Abstract
We present an air-coupled ultrasonic radiation force probe co-focused with a phase-sensitive optical coherence tomography (OCT) system for quantitative wave-based elastography. A custom-made 1 MHz spherically focused piezoelectric transducer with a concentric 10 mm wide circular opening allowed for confocal micro-excitation of waves and phase-sensitive OCT imaging. Phantom studies demonstrated the capabilities of this probe to produce quasi-harmonic excitation up to 4 kHz for generation of elastic waves. Experimental results in ocular tissues showed highly detailed 2D and 3D elasticity mapping using this approach with great potential for clinical translation.
Over a decade, wave-based optical coherence elastography (OCE) has evolved into the study of the ocular tunic (e.g., cornea, and sclera) biomechanical properties [1]. In particular, OCE has the potential to advance the understanding of corneal disease onset and progression, and treatment monitoring. Therefore, current efforts are guided towards the implementation of OCE techniques that allow for spatial elasticity mapping of tissues (e.g., use of higher excitation frequencies to produce smaller wavelengths) with fast acquisition and non-contact excitation for use in clinics.
Different non-contact excitation methods in wave-based OCE for cornea elastography with clinical translation suitability have been proposed including air-puff excitation [2], and air-coupled acoustic reflection-based radiation force excitation [3]. Air-coupled acoustic excitation has been demonstrated to produce transient waves in the cornea at higher frequencies (~2 kHz) than previous techniques using lower acoustic intensities (<1 mW/cm2) [3,4]. First proposed by Ambrozinski et al. [4], this technique uses piezoelectric transducers to focus ultrasonic waves onto an air–medium interface and generate transient displacement at the surface of tissues based on localized acoustic beam reflection [4]. The radiation pressure P [Pa] in the tissues is related to the acoustic intensity I [Watts/m2] of the beam by [5]
| (1) |
where R is the reflection coefficient at the air–tissue interface, and cair is the speed of sound in air (~340 m/s). Since acoustic impedance in air and tissue are very different, the acoustic energy is efficiently converted into displacements that can be detected using phase-sensitive optical coherence tomography (PhS-OCT).
Ambrozinski et al. [3] proposed the use of a 1 MHz cylindrically confused air-coupled ultrasound (ACUS) transducer to create transient quasi-plane mechanical waves in an ex vivo porcine cornea with a focal lateral spot size of ~0.35 mm. The ACUS transducer focal line was located 13 mm away from the tissue surface with a 45° incident angle to the OCT field of view (FoV) to avoid blocking the OCT beam. Similarly, Jin et al. [6] utilized a 0.25 MHz spherically focused ACUS transducer also tilted 45° and located 65 mm away from the sample to generate transient waves in in vivo rabbit corneas with a focal lateral spot size of 4 mm. In both approaches, the physical size of the ACUS transducer forces non-coaxial excitation with respect to the OCT beam direction. Moreover, the extended focal spot size, such as in Jin et al. [6], reduces the lateral resolution capabilities for detecting spatial elasticity changes. Finally, in both approaches, the use of transient waves constrains the calculation of spatial speed maps to the group speed, which can be misleading since group speed is highly dependent on the frequency peak of the excitation spectrum, which can shift significantly based on the viscoelastic properties of the tissue and tissue geometry.
To overcome these issues, we designed and implemented a confocal ultrasonic air-coupled OCT elastography (ACUS-OCE) probe for 2D and 3D elasticity mapping of ocular tissues using quasi-harmonic excitation. Our custom-made 1 MHz spherically focused ACUS transducer with an apical circular opening of 10 mm diameter allows for the confocal and coaxial micro-excitation of waves and the motion measurement in tissues using a PhS-OCT system. The excitation signal is formed by amplitude modulating a continuous 1 MHz carrier with a low-frequency kilohertz-range signal. Coaxial excitation with the OCT objective lens and the ACUS transducer on the same side of the sample is critical for clinical applications and facilitates easy control and alignment of the excitation focal point and the OCT beam. Moreover, this configuration allows for the generation and measurement not only of surface acoustic waves, but also longitudinal shear waves [7], expanding its elastographic capabilities. The working distance of our ACUS probe is ~20 mm and produces tissue displacements in the cornea <110 nm, holding great promise for in vivo corneal elastography. Finally, the use of quasi-harmonic excitation instead of a transient single pulse allocates more energy into a particular working frequency that can be isolated from bulk motion from live samples, and enables generation and comparison of repeatable 2D/3D phase speed maps of tissues for longitudinal studies.
The schematic of the OCE system is shown in Fig. 1(a), including the PhS-OCT system, excitation unit with the confocal ACUS-OCE probe, and the closed-loop intraocular pressure (IOP) control system for experiments with porcine eyeballs in situ. The PhS-OCT system was composed of a swept laser source (HSL2000, Santec Inc., Hackensack, NJ, USA) with a central wavelength of ~1310 nm and bandwidth of ~130 nm. The axial and lateral resolutions of the OCT sample beam were ~11 μm and ~16 μm, respectively, in air. The A-line rate was 30 kHz (temporal resolution Δt ~33.3 μs). The displacement stability was measured as ~40 nm in these experiments. A 3D rendering of the confocal ACUS-OCE probe is shown in Fig. 1(b). Here, the ACUS transducer was coaxially attached to the OCT objective lens using a 3D printed holder. The pressure field generated by the ACUS transducer was simulated using the k-wave toolbox from MATLAB 2019b (The MathWorks, Inc., Natick, MA, USA) using a continuous 1 MHz signal. The ACUS transducer was custom designed to have the same dimeter as the OCT objective lens (34 mm) and a spherical focal distance (20 mm) of ~4/5ths the focal distance of the objective lens (~25 mm), as shown in Fig. 1(c). The 10 mm diameter opening allows for confocal and simultaneous OCT imaging and excitation. The location of the excitation focal point was coaligned with the OCT beam focus at the surface of an isotropic tissue-mimicking phantom. Figure 1(d) shows lateral pressure profiles along x and y axes of the ACUS transducer at the focal depth measured using a needle hydrophone with <0.25 mm tip diameter (Muller Instruments, Oberursel, Germany). The lateral spot size was ~0.33 mm as measured by the full-width half-maximum (FWHM) of the pressure profile.
Fig. 1.
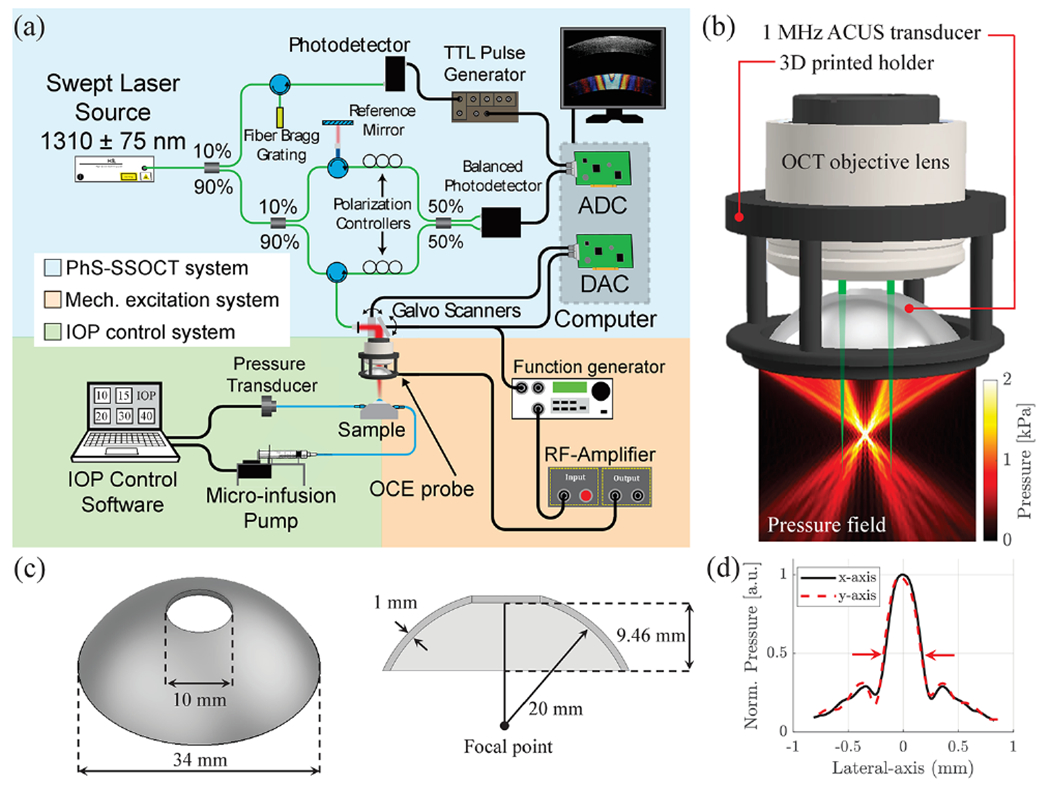
Schematic of the OCE system and confocal ACUS-OCE probe. (a) OCE system including the PhS-OCT, mechanical excitation, and IOP control subunits. ADC, analog to digital converter; DAC, digital to analog converter. (b) 3D rendering of the confocal ACUS-OCE probe with its simulated pressure field. (c) Schematic of the custom-made 1 MHz spherically focused ACUS transducer. (d) Measured ACUS lateral (x and y axes) focal profiles (FWHM = 0.33 mm).
The M-B-mode protocol was used for the acquisition of motion in samples in 2D (x z plane) [1], and 3D (x y z volume) [8], where the z axis corresponds to depth. Quasiharmonic excitation is composed of five cycles of a 2 kHz square pulse (50% duty cycle) amplitude modulating a continuous 1 MHz signal. The modulated signal was amplified using a radio-frequency amplifier (A150, Electronics & Innovation, Rochester, NY) and delivered to the ACUS transducer to produce mechanical excitation in the sample, as shown in Fig. 1(a). The OCT system captured a total of M = 450 A-line repetitions (15 ms) at each measurement position. For the 2D case, a line of ~9 mm was imaged (Δx ~ 36 μm, Δy = 0, 250 x samples), and 9 × 9 mm along x and y axes for the 3D case (Δx ~90 μm, Δy ~90 μm, 100 × 100 samples along the x y plane). The data were reorganized in 2D + time (2D case), and 3D + time (3D case) formats resulting in an equivalent frame/volume rate of 30 kHz. The total imaging time was 2.75 s for the 2D case and 2.5 min for the 3D case.
A uniform tissue-mimicking agar phantom (3.5% w/w) was excited using the confocal ACUS-OCE probe using 1, 2, 3, and 4 kHz quasi-harmonic excitation. Motion snapshots in Fig. 2(a) show a dramatic decrease in wavelength when the frequency was increased. Motion was calculated as particle velocity (vz) along the z axis (depth) using the phase-resolved Doppler equation , where Δϕ is the phase difference of two consecutive A-lines with a time interval τ = 33.33 μs (M-acquisition), λ is the central wavelength of the swept-source laser (1300 nm), and n is the refractive index of the sample (1.40 for agar phantoms, and 1.38 for cornea [9]). Particle velocity plots in Fig. 2(b) extracted from the excitation zone in Fig. 2(a) show how motion was attenuated as frequency was increased from 1 to 4 kHz. Figure 2(c) shows the frequency content of motion plots for 1, 2, 3, and 4 kHz cases and highlights how quasi-harmonic excitation can concentrate motion energy in the desired frequency and still preserve a frequency bandwidth of ~300 Hz compared to transient excitation.
Fig. 2.
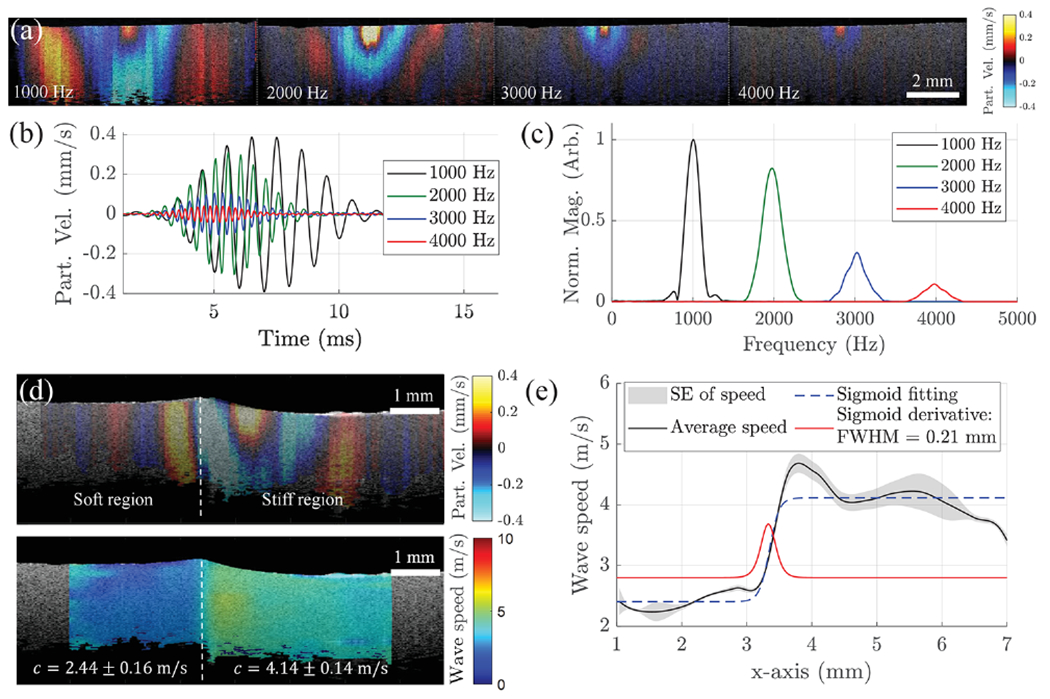
Phantom studies and elastography resolution characterization. (a) Particle velocity snapshots of wave propagation in a 3.5% w/w agar phantom when the ACUS transducer is excited at 1, 2, 3, and 4 kHz. (b) Comparison of filtered motion profiles extracted at the excitation region in (a). (c) Frequency content of excitation plots in (b). (d) Top: particle velocity snapshot of wave propagation in a two-sided agar phantom: 1.5% (left), 3.5% (right); bottom: wave speed map (in m/s) of the phantom at top. (e) Speed transition calculated from the two-sided phantom in (d). Sigmoid fitting and its derivate show a lateral speed resolution of 0.21 mm.
A two-sided 1.5% (left) and 3.5% (right) agar phantom was excited with five cycles of a 2 kHz modulated signal using the confocal ACUS-OCE probe for lateral speed resolution characterization. The motion snapshot in Fig. 2(d) (top) shows the difference in wavelength in both sides of the phantom. The 2D phase-derivative method [10] leveraging the complex-valued spatial particle velocity field was used for local phase velocity estimation of the waves. Within a small region of interest (ROI) of 0.2 × 0.2 mm2 centered at (x0, z0), orthogonal wave numbers kx and kz can be calculated corresponding to propagation directions x and z, respectively [10]. Finally, the equivalent 2D spatial wave speed map is found using
| (2) |
Figure 2(d) (bottom) shows the 2D wave speed map of the two-sided phantom with average speed values of 2.44 ± 0.16 m/s and 4.14 ± 0.14 m/s calculated for the soft (1.5%) and stiff (3.5%) regions, respectively. The average speed translation along the x axis is plotted in Fig. 2(e) and fitted to a Sigmoid function. The FWHM of the derivative of the Sigmoid fit is 0.21 mm when a 2 kHz quasi-harmonic excitation is used, which is the transverse speed resolution.
Experiments in two pairs (n = 4, two animals) of in situ porcine eyes (Sioux-Preme Packing Co., Sioux City, IA, USA) were conducted within 48 h of enucleation. The right-side eye of the first animal was placed in a holder and cannulated with two needles for artificial IOP control along the superior–inferior meridian, as shown in Fig. 1(a) using a previously reported system [11]. The confocal ACUS-OCE was used to image the 2 kHz quasi-harmonic excitation with the eye globe at 10, 20, and 30 mmHg. Figure 3(a) shows particle velocity snapshots of the cornea under different IOP levels taken at 1.5 ms after excitation. Here, Lamb waves propagate through the entire FoV (~9 mm) at 2 kHz. Displacement amplitudes of ~110, ~67, and ~53 nm were found at the focus of the excitation in the cornea at 10, 20, and 30 mmHg, respectively. 2D speed maps were calculated based on Eq. (2) and are shown in Fig. 3(b). An increasing trend of Lamb wave speed in the cornea was found as IOP was elevated, which is in agreement with previous studies [1,3,8].
Fig. 3.
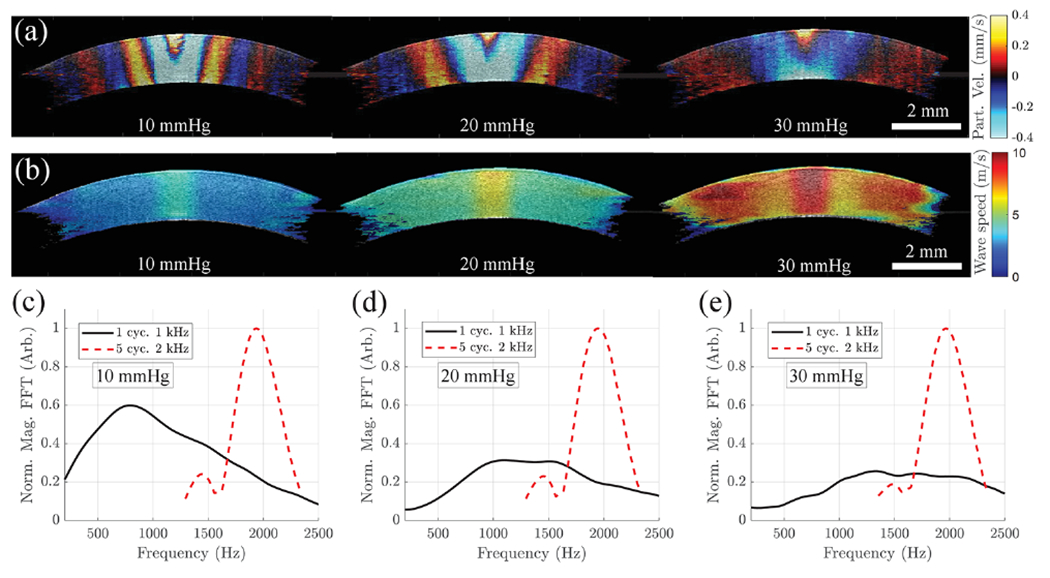
Ex vivo porcine cornea elastography using the confocal ACUS-OCE probe when subjected to 10, 20, and 30 mmHg IOP levels. (a) Particle velocity snapshots extracted at 1.5 ms after the 2 kHz excitation is burst. (b) 2D speed maps calculated from cornea cases in (a) using Eq. (2). (c)–(e) Comparison of frequency spectrum plots when a 2 kHz quasi-harmonic and a 1 kHz single pulse are excited in corneas subjected to: (c) 10 mmHg, (d) 20 mmHg, and (e) 30 mmHg IOP levels.
It is important to highlight that the Lamb wave speed maps in Fig. 3(b) correspond to phase speeds at 2 kHz enabling longitudinal comparison of corneal elasticity, which is of great importance during clinical screening. Typical group speed maps of cornea based on transient excitation are highly dependent on the main frequency peak and bandwidth (due to Lamb wave dispersion behavior), which may change with the elastic properties of cornea as IOP increases [1,3]. This behavior can be observed in Figs. 3(c)–3(e) where we compare the Lamb wave spectra when a 2 kHz quasi-harmonic and a 1 kHz transient single pulse are excited in corneas at 10, 20, and 30 mmHg IOP. Unlike the quasi-harmonic case where the motion energy is concentrated around 2 kHz for all IOPs, the energy in the transient case is spread out with main frequency peaks changing at every IOP case. Thus, longitudinal comparison of group speed maps of the same cornea may not be accurate and could lead to errors in clinical interpretation due to confounding variables.
An important clinical application of the confocal ACUS-OCE probe is localized elastography of the cornea for treatment guidance and clinical decision making. Figure 4(a) (left) shows the B-mode structural image of corneas of the right-side eye of the second animal. After conducting measurements using the probe in the eyeball subjected to a controlled IOP of 10 mmHg, half of the cornea of the same eye was exposed to UV-A/riboflavin cross-linking (CXL) treatment. CXL was performed according to the standard “Dresden” clinical protocol except that only half of the cornea was subjected to the treatment [12]. Figure 4(a) (center) shows the B-mode structural image of the cornea after the half-sided CXL treatment. After conducting measurements, the left-side eye of the same animal was fully exposed to the CXL treatment, and its B-mode structural image is shown in Fig. 4(a) (right). Particle velocity snapshots extracted at 1.5 ms after the 2 kHz excitation for all corneas are shown in Fig. 4(b). 2D Lamb wave phase speed maps are shown for all cases in Fig. 4(c) highlighting the potential of the confocal ACUS-OCE probe in detecting local speed changes between untreated and CXL-treated regions of cornea for custom treatments that have shown superior outcomes with fewer side effects. Figure 4(d) shows the space–time map of wave propagation in the half-sided CXL cornea showing different average speed values of 3.07 ± 0.26 m/s and 4.95 ± 0.98 m/s in the left (untreated) and right (CXL-treated) regions, respectively. Since phase speed maps in Fig. 4(c) for all treatment cases are measured at the same frequency (2 kHz), they can be easily compared, as shown in Fig. 4(e). Average speeds in the virgin and full-CXL cases are in agreement with the untreated and CXL-treated regions of the half-CXL cornea, demonstrating internal consistency of the ACUS-OCE probe.
Fig. 4.
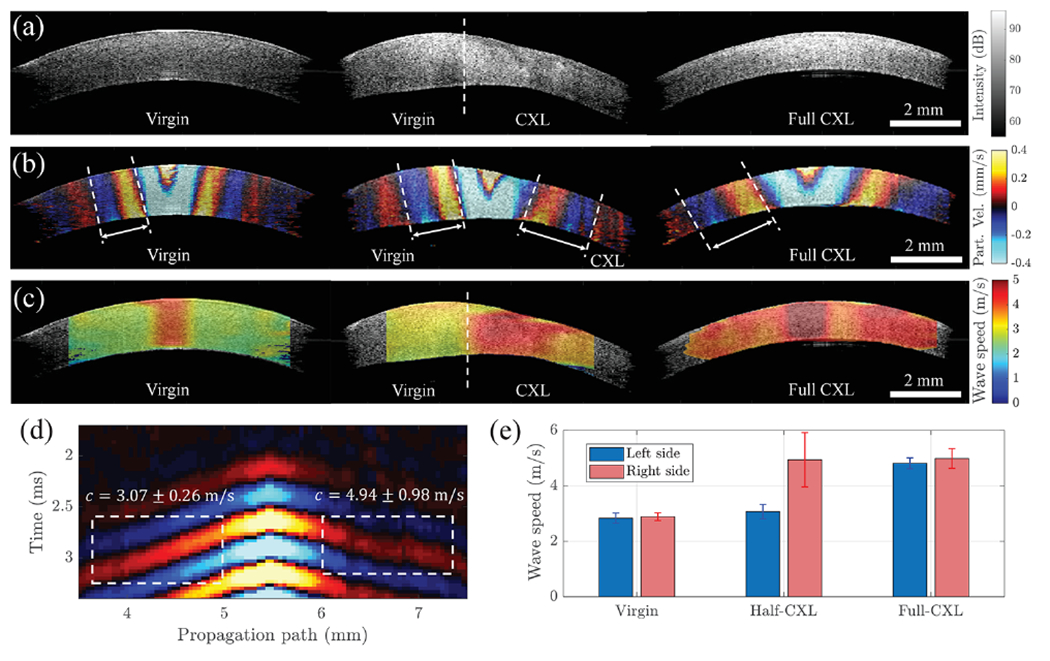
Elastography of porcine cornea for different UV-CXL treatment localizations using the confocal ACUS-OCE probe. (a) B-mode structural OCT images of untreated (virgin), half-CXL-treated, and full-CXL-treated corneas. (b) Particle velocity snapshots extracted at 1.5 ms after 2 kHz excitation. (c) 2D speed maps calculated from corneas in (b) using Eq. (2). (d) Space–time map (averaged along depth) extracted along the wave propagation path in half-treated CXL cornea. (e) Comparison of average speed values calculated from all cases in (c) along the right and left sides of corneas.
The confocal ACUS-OCE probe also allows for 3D elastography of ocular tissues such as the anterior segment of the eye. The structural OCT volume in Fig. 5(a) shows corneal and scleral regions with different intensities. A clear difference in the elastic wave wavelength in both regions can be observed in the motion snapshot of within the FoV. The speed map of the same region is shown in Fig. 5(b), and it confirms that the sclera (11.39 ± 0.83 m/s) is stiffer than the cornea (3.28 ± 0.19 m/s) by a factor of ~3.4 in average phase speed at 2 kHz.
Fig. 5.
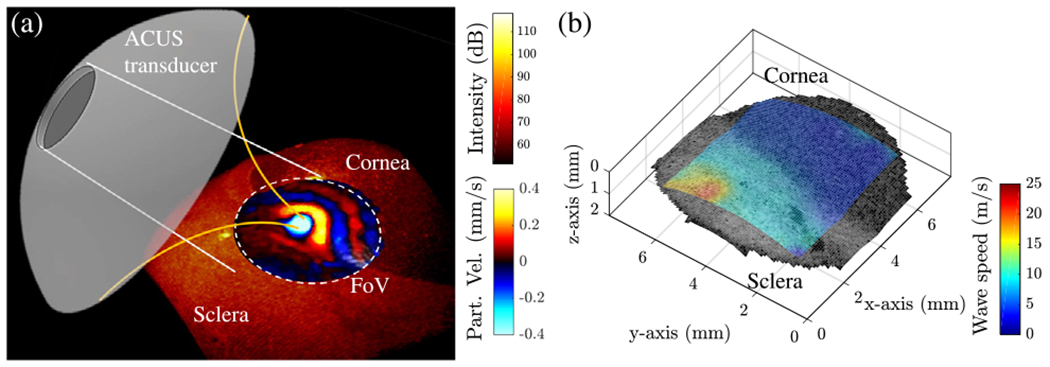
3D elastography of anterior eye segment using the confocal ACUS-OCE probe. (a) Structural volume of the anterior segment showing the alignment of the eye and ACUS transducer producing 2 kHz excitation at the corneo—scleral border. Particle velocity snapshot shows wave propagation within the FoV. (b) Speed map (in m/s) calculated from the FoV in (a).
In this study, we have implemented a confocal ACUS-OCT probe and tested it for 2D and 3D elasticity mapping of ocular tissues using quasi-harmonic excitation. The coaxial configuration of the ACUS transducer with the OCT imaging facilitates easy control and alignment of the excitation in tissues. Moreover, the use of quasi-harmonic excitation instead of a transient pulse allows the comparison of 2D/3D Lamb wave phase speed maps at the same frequency, which is fundamental for the accuracy and repeatability of longitudinal studies in the cornea. Finally, the non-contact excitation (air-coupled excitation) and imaging (OCT); the low acoustic intensity at the tissue surface (spatial peak pulse average intensity ISPPA ~1 W/cm2 as reported in [3], which is orders of magnitude lower than the 28 W/cm2 maximum exposure regulated in ophthalmic imaging [13]); the lower displacements generated in the cornea (< 100 nm); the compactness of the probe and its safe working distance from the eye (~20 mm, compared to other excitation devices: ~13 mm in [4], and ~1 mm for air-puff excitation [2]) make this probe suitable for in vivo clinical measurements.
One of the limitations of this study lies in the extended acquisition time. Strategies for the mitigation of such a problem include reducing the number of M-repetitions and x-samples to half (acquisition time reduced from 2.75 s to 0.94 s in the 2D case), and using a fast megahertz-range A-line rate swept-source [14] (acquisition time reduced from 2.5 min to <1 s in the 3D case). Finally, safety studies of this probe are limited in this Letter, and future work may concentrate on this topic using histological analysis of corneas and preliminary in vivo elasticity imaging in animal eye models.
Acknowledgment.
Dr. Fernando Zvietcovich thanks the 2020 SPIE-Franz Hillenkamp Fellowship for its support during his postdoctoral work.
Funding.
National Institutes of Health (P30EY007551, R01EY022362).
Footnotes
Disclosures. The authors declare no conflicts of interest.
REFERENCES
- 1.Kirby MA, Pelivanov I, Song S, Ambrozinski L, Yoon SJ, Gao L, Li D, Shen TT, Wang RK, and O’Donnell M, J. Biomed. Opt 22, 121720(2017). [DOI] [PMC free article] [PubMed] [Google Scholar]
- 2.Wang S, Li J, Manapuram RK, Menodiado FM, Ingram DR, Twa MD, Lazar AJ, Lev DC, Pollock RE, and Larin KV, Opt. Lett 37, 5184(2012). [DOI] [PMC free article] [PubMed] [Google Scholar]
- 3.Ambrozinski L, Song S, Yoon SJ, Pelivanov I, Li D, Gao L, Shen TT, Wang RK, and O’Donnell M, Sci. Rep 6, 38967 (2016). [DOI] [PMC free article] [PubMed] [Google Scholar]
- 4.Ambrozinski L, Pelivanov I, Song S, Yoon SJ, Li D, Gao L, Shen TT, Wang RK, and O’Donnell M, Appl. Phys. Lett 109, 043701 (2016). [DOI] [PMC free article] [PubMed] [Google Scholar]
- 5.Torr GR, Am. J. Phys 52, 402 (1984). [Google Scholar]
- 6.Jin Z, Khazaeinezhad R, Zhu J, Yu J, Qu Y, He Y, Li Y, Alvarez-Arenas TEG, Lu F, and Chen Z, Biomed. Opt. Express 10, 6272 (2019). [DOI] [PMC free article] [PubMed] [Google Scholar]
- 7.Zvietcovich F, Ge GR, Mestre H, Giannetto M, Nedergaard M, Rolland JP, and Parker KJ, Biomed. Opt. Express 10, 3699 (2019). [DOI] [PMC free article] [PubMed] [Google Scholar]
- 8.Zvietcovich F, Pongchalee P, Meemon P, Rolland JP, and Parker KJ, Nat. Commun 10, 4895 (2019). [DOI] [PMC free article] [PubMed] [Google Scholar]
- 9.Meek KM and Knupp C, Prog. Retinal Eye Res 49, 1 (2015). [DOI] [PMC free article] [PubMed] [Google Scholar]
- 10.Zvietcovich F, Rolland JP, Yao J, Meemon P, and Parker KJ, J. Biomed. Opt 22, 035010(2017). [DOI] [PubMed] [Google Scholar]
- 11.Twa MD, Li J, Vantipalli S, Singh M, Aglyamov S, Emelianov S, and Larin KV, Biomed. Opt. Express 5, 1419 (2014). [DOI] [PMC free article] [PubMed] [Google Scholar]
- 12.Wollensak G, Spoerl E, and Seiler T, Am. J. Ophthalmol 135, 620 (2003). [DOI] [PubMed] [Google Scholar]
- 13.U. S. Food & Drug Administration, Marketing Clearance of Diagnostic Ultrasound Systems and Transducers (Center for Devices and Radiological Health, 2019), Vol. FDA-2017-D-5372. [Google Scholar]
- 14.Singh M, Wu C, Liu C-H, Li J, Schill A, Nair A, and Larin KV, Opt. Lett 40, 2588 (2015). [DOI] [PMC free article] [PubMed] [Google Scholar]


