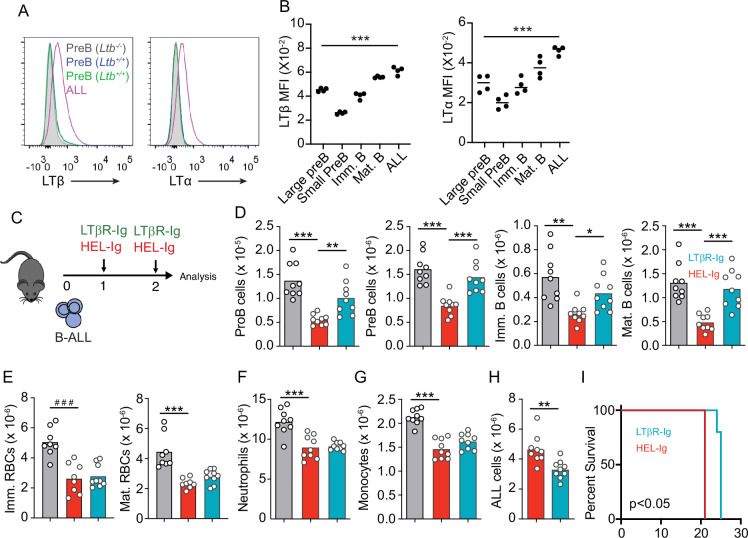
Figure 2. Lymphotoxin α1β2 expression in B-ALL cells and therapeutic effect of lymphotoxin beta receptor (LTβR) blocking.
(A) Histograms of LTα and LTβ expression in B-ALL cells and in pre-B cells. Purple, B-ALL; green, non-malignant pre-B cells (CD19+CD93+IgM-cKit-) in bone marrow (BM) of wild-type (WT) mice transplanted with B-ALL cells; blue, non-malignant pre-B cells in BM of WT mice (no B-ALL); filled gray, non-malignant Ltb-deficient pre-B cells in BM of Ltb-/- mice. (B) LTα and LTβ mean fluorescence intensity (MFI) in developing B cells and ALLs isolated from BM of ALL transplanted mice. (C) Experimental design of data described in panels D–H. (D) Number of non-malignant developing B cell subsets in BM. (E) Immature and mature erythrocyte number. (F) Neutrophils. (G) Monocytes. (H) B-ALL number. Data in panels D–H show BM numbers from WT mice transplanted with 3×10⁶ BCR-ABL-expressing B-ALL cells and treated with HEL-Ig or LTβR-Ig (150 µg/mouse) on day 0 and day 5; mice were analyzed on day 8 post ALL transplantation. (I) Frequency of mouse survival after B-ALL transplantation following pre-treatment with either HEL-Ig or LTβR-Ig (n=5 per group). Mice were treated with HEL-Ig or LTβR-Ig (150 µg/mouse) every 5 days until endpoint. Bars indicate mean, circles depict individual mice. Data are representative of two independent experiments. *p<0.05; **p<0.005; ***p<0.0005 unpaired, two-sided, Student’s t test. ###p<0.0005 Mann–Whitney test.


