Figure 1. Cell-contact-mediated transfer of macrophage mitochondria leads to increased cancer cell proliferation.
(a) CD14+ monocytes harvested from human blood are transduced and differentiated for 6 days. Mito-mEm +macrophages (green) are co-cultured with MDA-MB-231 cells (231 cells) expressing mito-RFP (magenta; right image). (b) Confocal image showing transferred mitochondria (green, arrowhead) in a 231 cell (magenta, cell outline in white). (c) Representative flow cytometry plots depicting mitochondrial transfer (black box) within a population of co-cultured mito-RFP+ 231 cells (right) compared to monoculture control (left) with background level of mEmerald (mEm) fluorescence set at 0.2%. (d) Aggregate data of mitochondrial transfer rates across macrophage donors. Each data point represents one replicate (N=14 donors). (e) Analysis of proliferative capacity by quantifying Ki-67 levels and DNA content in co-cultured 231 cells after 24 hr. Percentage of cancer cells within a specific cell cycle phase with or without transfer is shown. A significantly different percent of recipient cells occupies G2/M (black) phases of the cell cycle compared to non-recipient cells (N=4 donors; statistics for G2/M only). (f) Co-cultured recipient 231 cells have a significantly higher specific growth rate compared to non-recipients (N=60 cells (control), 115 (recipient) over 4 donors indicated as shades of gray). (g) Schematic of mitochondrial isolation and bath application on MDA-MB-231 cells. Mitochondria are isolated from mito-mEmerald expressing THP-1 monocytes and bath applied at 20–30 µg/mL for 24 hr. Cancer cells which had taken up mEm+ mitochondria are then FACS-isolated and plated for 48 hr for further analyses. (h) Representative confocal image showing mito-RFP-expressing 231 cell (magenta) that had taken up macrophage mitochondria (green, grey arrow). (i) 48 hr after FACS-isolating 231 cells with macrophage mitochondria, flow cytometry was used to determine percent of daughter cells which still contain mEm+ mitochondria. N=3 biological replicates. (j), Cell cycle analysis of daughter cells 48 hr after FACS-isolation of 231 cells that had taken up macrophage mitochondria. N=3 biological replicates. For all panels, standard error of the mean (SEM) is displayed and scale bars are 10 µm. Mann-Whitney (d), two-way ANOVA (e, j), Welch’s t-test (f, i), *p<0.05; **p<0.01; ****p<0.0001.

Figure 1—figure supplement 1. Macrophages transfer mitochondria to cancer cells.

Figure 1—figure supplement 2. Cancer cells will macrophage mitochondria exhibit increased proliferation.

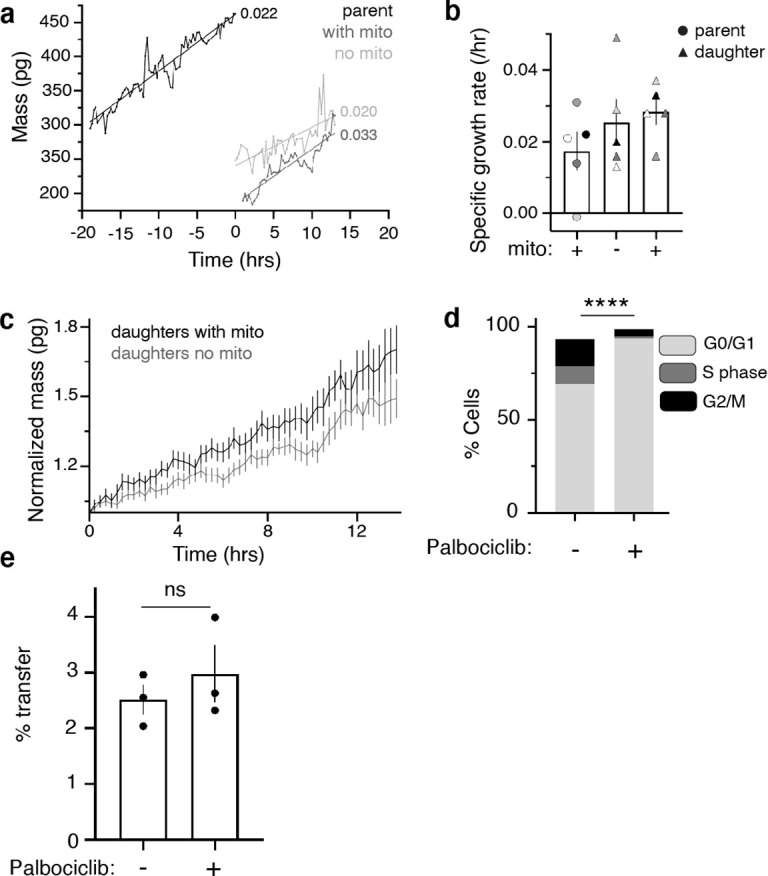
Figure 1—figure supplement 3. Mitochondrial transfer leads to sustained increased growth rate in daughter cancer cells.