

Abstract
EFSA was asked for a scientific opinion on the risks to public health related to the presence of N‐nitrosamines (N‐NAs) in food. The risk assessment was confined to those 10 carcinogenic N‐NAs occurring in food (TCNAs), i.e. NDMA, NMEA, NDEA, NDPA, NDBA, NMA, NSAR, NMOR, NPIP and NPYR. N‐NAs are genotoxic and induce liver tumours in rodents. The in vivo data available to derive potency factors are limited, and therefore, equal potency of TCNAs was assumed. The lower confidence limit of the benchmark dose at 10% (BMDL10) was 10 μg/kg body weight (bw) per day, derived from the incidence of rat liver tumours (benign and malignant) induced by NDEA and used in a margin of exposure (MOE) approach. Analytical results on the occurrence of N‐NAs were extracted from the EFSA occurrence database (n = 2,817) and the literature (n = 4,003). Occurrence data were available for five food categories across TCNAs. Dietary exposure was assessed for two scenarios, excluding (scenario 1) and including (scenario 2) cooked unprocessed meat and fish. TCNAs exposure ranged from 0 to 208.9 ng/kg bw per day across surveys, age groups and scenarios. ‘Meat and meat products’ is the main food category contributing to TCNA exposure. MOEs ranged from 3,337 to 48 at the P95 exposure excluding some infant surveys with P95 exposure equal to zero. Two major uncertainties were (i) the high number of left censored data and (ii) the lack of data on important food categories. The CONTAM Panel concluded that the MOE for TCNAs at the P95 exposure is highly likely (98–100% certain) to be less than 10,000 for all age groups, which raises a health concern.
Keywords: N‐nitrosamines (N‐NAs), cancer, genotoxicity, occurrence, exposure, food, margin of exposure (MOE)
Summary
Following a request from the European Commission, the Panel on Contaminants in the Food Chain (CONTAM Panel) has provided a scientific opinion on the human health risks related to the presence of N‐nitrosamines (N‐NAs) in food. The opinion evaluates the toxicity of N‐NAs to animals and humans, estimates the dietary exposure of the European Union (EU) population to N‐NAs and assesses the human health risks to the EU population due to the estimated dietary exposure.
Overall, 32 N‐NAs have been investigated for their presence in food. The CONTAM Panel identified and characterised the hazards for all of them. However, so far, the actual presence of quantifiable amounts in food was demonstrated for a limited number of these compounds. Therefore, the risk characterisation was limited to 10 carcinogenic N‐NAs occurring in food (TCNAs), i.e. NDMA, NMEA, NDEA, NDPA, NDBA, NMA, NSAR, NMOR, NPIP and NPYR.
N‐NAs are the reaction products of nitrosating agents such as nitrites or nitrogen oxides and amino‐based substances such as secondary amines and may be formed in a variety of foods under processing conditions in the presence of these reactants. N‐NAs have been detected, e.g. in cured meat products, processed fish, beer and other alcoholic and non‐alcoholic beverages, cheese, soy sauce, oils, processed vegetables and human milk. Heat treatment also produces and increases the levels of N‐NAs in food with findings mainly focusing on meat and fish products.
NDMA, NDEA, NPYR, NHTZ and NPRO are readily and completely absorbed and distributed mainly to the liver but also to other organs in experimental animals. Data for absorption and distribution of other N‐NAs are scarce. Most N‐NAs undergo a CYP‐mediated oxidation which is a key event in bioactivation. NDMA is metabolised to α‐hydroxydimethylnitrosamine via α‐hydroxylation, catalysed mainly by CYP2E1. α‐Hydroxydimethylnitrosamine spontaneously decomposes to methyldiazonium ions that react easily with DNA bases producing DNA adducts such as 7‐Me‐Gua and O 6‐Me‐Gua. The DNA repair enzyme O 6 ‐Me‐Gua‐DNA‐methyltransferase removes the O 6 ‐Me‐Gua adducts. If unrepaired, O 6 ‐Me‐Gua adducts cause miscoding and generate principally G > A transition mutations which can lead to the initiation of carcinogenesis. The liver plays a major role in clearing and metabolising NDMA; extrahepatic distribution is also possible for this and other N‐NAs and is enhanced by co‐exposure to other CYP substrates such as ethanol. CYP enzymes of different families convert NDEA, NMEA, NDPA, NDBA, NMA, NSAR, NMOR, NPIP and NPYR mostly via α‐hydroxylation to alkylating agents which are capable of binding to DNA. The same enzymes also perform denitrosation, which is mainly considered a detoxification pathway. Extrahepatic bioactivation of other N‐NAs mainly in the upper gastrointestinal (GI) and respiratory tract has been shown. Quantitative and qualitative species‐ and tissue‐related differences in N‐NAs' biotransformation have been documented. Overall, unmetabolised N‐NAs and their stable metabolites (e.g. glucuronides) are mainly and rapidly excreted via urine; for NTCA, NMTCA, NHPRO, NPRO, NSAR and NMA, urinary excretion accounts for up to 90% of the administered dose. Biliary excretion is considered of minor importance and has been documented for NDMA, NDEA, NDPA, NPYR and NDPheA. Direct or indirect evidence for transfer via milk has been reported for NDMA, NDEA and NDBA; in addition, NDMA, NDEA, NDBA and NDPA undergo placental transfer.
Very little is known about the fate of N‐NAs in humans and most of the available information concerns NDMA. The presence of measurable N‐NA levels has been reported in blood, gastric juice, urine and milk. The origin of these N‐NAs is unknown, and their endogenous formation could not be excluded. In the few studies in which human volunteers were offered meals with known N‐NA (NDMA) content, only trace amounts of the ingested dose were recovered in biological fluids, except in the case of ethanol co‐administration. This suggests that, in humans, ethanol may decrease the hepatic clearance of NDMA, as demonstrated in rodents. The in vivo extrapolation of the in vitro hepatic NDMA intrinsic clearance measured in human liver microsomes resulted in a calculated hepatic extraction ratio of about 90%, which is very similar to that measured in vivo in the rat. Finally, quantitative differences between humans and rats were reported in the ability of the same tissue to biotransform and activate (as measured by DNA‐binding) different N‐NAs.
Earlier studies performed with human tissue subfractions or tissue cultures have demonstrated the bioactivation of several N‐NAs not only by the liver but also by extrahepatic organs and tissues, including oesophagus, colon, bladder, bronchi, pancreatic duct and nasal mucosa. The most common N‐NAs found in food (NDMA, NMEA, NDEA, NDPA, NDBA, NMA, NSAR, NMOR, NPIP and NPYR) are mostly biotransformed by CYP2E1 and 2A6, while CYP2B1 and CYP1A1 are involved to a lesser extent. CYP genetic polymorphisms may, at least partly, explain the large interindividual variation in the biotransformation of certain N‐NAs observed in in vitro studies.
Most studies on DNA adducts in human tissues do not specifically identify N‐NAs as their source. It is also unclear to which extent exposure to N‐NAs reflects their endogenous formation or occurs via food/water.
In short‐term toxicity studies, NDMA, NDEA, NMOR and NPIP exerted pronounced hepatotoxic effects, reduced body weight gains and the survival of experimental animals.
The genotoxic properties of the acyclic volatile NDMA, NMEA, NDEA and NDPA have been extensively investigated both in vitro and in vivo. Following metabolic activation, these N‐NAs induce gene mutations in both bacteria and mammalian cells in vitro. Mutations have also been observed in the liver of transgenic animals with GC > AT transitions being the main mutational class. These base substitutions are consistent with the well‐known miscoding properties of DNA bases alkylated at the O 6 position of guanine. Information on the genotoxicity of the acyclic non‐volatile N‐NAs is more limited. Induction of mutations in vitro was shown for NDBA while increased levels of DNA breaks in several organs confirmed the in vivo genotoxicity of NDBA. The cyclic volatile NMOR, NPIP and NPYR were mutagenic both in vitro and in vivo. For all these N‐NAs, increased levels of DNA strand breaks were observed in several mouse organs (stomach, colon, liver, lung, kidney and urinary bladder). In addition, the clastogenic potential of NMOR has been demonstrated by its ability to induce micronuclei in the bone marrow cells. The reported in vitro mutagenicity of NPYR has been confirmed in vivo in transgenic rats (increases mainly of AT > GC transitions but also of mutations at G:C base pairs). Overall there is: (i) evidence of in vitro and in vivo genotoxicity of NDMA, NMEA, NDEA, NDPA, NDBA, NDBzA, NMOR, NPIP and NPYR; (ii) evidence of genotoxicity limited to in vitro studies for NDIPA, NMBA, NMA, NMAMBA, NTHZ, NHPYR and NHMTHZ; (iii) indirect evidence (gained by read‐across and SAR analyses) that NEIPA, NMVA, NDIBA, NEA, NMAMPA, NSAR and NMTHZ may exert genotoxic activity; (iv) experimental and/or indirect evidence (gained by read‐across and SAR analyses) that NPRO, NHPRO, NTCA, NTMCA, NHMTCA, NOCA, NMOCA and NPIC may not exert significant genotoxic activity; and (v) insufficient information to conclude on the genotoxic potential of NDPheA.
The acyclic volatile N‐NAs NDMA, NMEA, NDEA, NDPA, NDIPA, NEIPA, NMBA and NMVA induced tumour formation in several mammalian species and many different organs, such as liver, pharynx, oesophagus, forestomach, the upper respiratory tract and the lung. In monkeys, NDEA and NDPA induced hepatocellular carcinoma (HCC). The acyclic non‐volatile N‐NAs NDBA, NDIBA, NMA, NMAMBA and NSAR were carcinogenic in many rodent organs/tissues, including liver, the upper and lower respiratory tract, oesophagus and/or forestomach. NDBzA did not induce tumour formation in rodents. The cyclic volatile N‐NAs caused tumour formation in rat liver, the respiratory and/or the GI tract (NMOR, NPIP, NPYR and NHPYR). Furthermore, NPIP induced HCC in livers of monkeys. For the cyclic N‐NAs NPRO, NHPRO and NPIC, no clear evidence for carcinogenicity could be obtained in rodents. NDPheA induced malignant tumours of the urinary bladder in male and female rats. Overall, NDMA, NMEA, NDEA, NDPA, NDIPA, NEIPA, NMBA, NMVA, NDBA, NDIBA, NMA, NMAMBA, NSAR, NMOR, NPIP, NPYR, NHPYR and NDPheA are carcinogenic in experimental animals. Genotoxic mechanisms are the underlying mode of action for the carcinogenic activity of N‐NAs, except for NDPheA. The most frequent target organ in animals is the liver followed by the upper digestive, urinary and the respiratory tract.
Some of the 32 N‐NAs had no or limited carcinogenicity data. Based on (i) a large database of N‐NAs with known carcinogenic potency (parametrised as TD50s), (ii) the most likely mode of action and (iii) wide genotoxicity and toxicokinetic information, carcinogenic activity was predicted for NEA, NMAMPA, NMAMBA, NTHZ, NMTHZ, NHMTHZ and NDBzA, and lack of carcinogenic potential for NTCA, NMTCA, NHMTCA, NOCA and NMOCA. TD50s were also predicted for NMVA, NEIPA, NMBA, NDIPA, NDIBA and NSAR, whose carcinogenic activity was known but TD50s were not reported.
Reports on transplacental carcinogenesis as well as developmental and reproductive toxicity show the effects of N‐NAs, tested at high doses in several rodent species. However, the studies often applied only one dose, did not cover several critical phases and were small in number and quality which limited conclusions on potential risks for human health. The documented transplacental transfer and bioactivation of N‐NAs in fetal tissues provides a mechanistic explanation for the transplacental carcinogenic effects of NDMA, NDEA, NDPA, NDBA and NPIP in rodents. Furthermore, a high rate of cell replication in the liver of neonatal animals increases the susceptibility towards the carcinogenic activity of N‐NAs.
In all the epidemiological studies on associations between dietary intake of N‐NAs and cancer, selection bias, information bias and confounding were present to some degree. In addition, in all studies, N‐NA intake was estimated from data obtained from food frequency and food history questionnaires. Food intake questionnaires are imperfect measures of exposure, and thus, misclassification of exposure is likely to occur. It is important to note that food frequency questionnaires are used for ranking subjects according to food or nutrient intake, but not for estimating absolute levels of intake. Based on the exposure tools used in these studies and the possibility of residual confounding by other exposure sources (e.g. smoking, occupation) and/or other unmeasured factors (e.g. helicobacter infection, fruits and vegetables intake, chemicals in meat other than N‐NAs) the possibility of using data from these studies for hazard characterisation is limited. Due to limitations in study design, these studies cannot be used to establish tumour target sites and reference points for N‐NAs.
The main mode of action for the carcinogenic activity of N‐NAs is genotoxicity. The key step is metabolic activation by α‐hydroxylation and the subsequent formation of highly reactive diazonium ions which can form DNA‐adducts. Acyclic N‐NAs with dimethyl‐ and diethyl‐groups were reported to be more genotoxic and mutagenic than N‐NAs with longer chains and cyclic N‐NAs. In rodents, the liver is the main target tissue for the carcinogenic activity of N‐NAs, followed by the upper GI and respiratory tract. However, these tissues have not been identified consistently as N‐NA targets in human epidemiological studies. This may be due to species‐specific differences in absorption, distribution and elimination and species‐/tissue‐specific differences in bioactivation and repair of DNA adducts. Analysis of 900 human colorectal cancer (CRC) cases identified the mutational signature of DNA O 6 ‐alkylguanine, the most mutagenic adduct induced by N‐NAs. This signature was associated with the development of CRC and with high intakes of processed or unprocessed red meat.
Regarding the individual TCNAs reported to occur in food, experimental data allowed the derivation of BMDL10 values (in mg/kg bw per day) for NDMA (0.035), NDEA (0.010), NMOR (0.014), NPIP (0.062) and NPYR (0.127). From the CPDB database (Gold et al., 1991), TD50 values (in mg/kg bw per day) were taken for nine carcinogenic N‐NAs: NDMA (0.0959), NMEA (0.05), NDEA (0.0265), NDPA (0.186), NDBA (0.691), NMA (0.142), NMOR (0.109), NPIP (1.11) and NPYR (0.799). The TD50 was predicted only for NSAR (0.982). By any criterion, NDEA, NMEA, NDMA and possibly NMOR are in the group of highest carcinogenic potency.
In a conservative approach, the CONTAM Panel applied the same carcinogenic potency to all TCNAs. In an alternative approach, the ratio between the lowest BMDL10 applied for the N‐NAs with the highest concern (0.010 mg/kg day for NDEA, NMEA, NDMA and NMOR) and the lowest BMDL10 applied for the remaining N‐NAs (0.062 mg/kg per day for NDPA, NDBA, NMA, NPYR, NPIP, NSAR) was used to calculate a potency factor of 0.2 between the two subgroups. Despite the differences in experimental systems, NDEA, NMEA, NDMA and possibly NMOR are the most potent by any criterion measured.
Considering the occurrence of N‐NAs in food, 2,817 results for food samples analysed from four European countries between 2003 and 2021 were available for the assessment. Besides the EFSA occurrence data set, the CONTAM Panel considered also analytical results from EU countries (n = 3,976) and non‐EU countries (n = 27) extracted from articles published between 1990 and 2021, selected based on quality criteria.
From this data set, the dietary exposure assessment could be performed for the following food categories: ‘Alcoholic beverages’, ‘Coffee, cocoa, tea and infusions’, ‘Fish, seafood, amphibians, reptiles and invertebrates’, ‘Meat and meat products’ and ‘Seasoning, sauces and condiments’. The percentage of left‐censored data in these food categories at the Level 1 of the Foodex2 classification, across N‐NAs, ranged from 3% to 99%.
No occurrence data were available to EFSA or selected from the literature for any of the N‐ NAs for the following food categories: ‘Fruit and fruit products’, ‘Fruit and vegetable juices and nectars (including concentrates)’, ‘Grains and grain‐based products’, ‘Legumes, nuts, oilseeds and spices’, ‘Milk and dairy products’, ‘Starchy roots or tubers and products thereof, sugar plants’, ‘Vegetables and vegetable products’ and ‘Water and water‐based beverages’.
Among the five food categories considered in the dietary exposure assessment ‘Meat and meat products’ was the only food category for which data were available for all the individual TCNAs.
NDMA was the only N‐NA for which data were available for all five Foodex2 Level 1 food categories. Data were available for three food categories for NPYR, NPIP, NDEA and NDBA; for two food categories for NMOR and one food category for NSAR, NMEA, NDPA and NMA.
Although unprocessed and uncooked meat may contain trace amounts of N‐NAs, evidence is found in the literature which shows the increased presence of N‐NAs in these foods after cooking (baking, frying, grilling, microwaving) indicating that cooking generates N‐NAs.
However, data availability on cooked unprocessed meat and fish is limited and there is also some uncertainty regarding the potential presence or absence of nitrite/nitrate added to the products that were cooked and/or bought already as cooked. For this reason, the Panel decided to estimate exposure using two scenarios, excluding (scenario 1) or including cooked unprocessed meat and fish (scenario 2).
In scenario 1 (excluding cooked unprocessed meat and fish), the TCNA mean middle‐bound (MB) dietary exposure ranged from < 0.1 ng/kg bw per day in infants to 12.0 ng/kg bw per day in toddlers. The TCNA P95 upper bound (UB) dietary exposure ranged from 0 to 54.8 ng/kg bw per day, both in infants. The highest P95 dietary exposure to TCNAs assessed using potency factors was 1.7 times lower than the highest P95 dietary exposure to TCNA assessed without using potency factors (both found in infants).
In scenario 2 (including cooked unprocessed meat and fish), the TCNA mean MB dietary exposure ranged from 7.4 ng/kg bw per day in infants to 87.7 ng/kg bw per day in toddlers. The TCNA P95 UB dietary exposure ranged from 34.7 ng/kg bw per day in infants to 208.8 ng/kg bw per day in toddlers. The highest P95 dietary exposure to TCNAs assessed using potency factors was 3.3 times lower than the highest P95 dietary exposure to TCNAs assessed without using potency factors (both found in toddlers).
In both scenarios, NPYR, NSAR, NDMA, NPIP and NDEA are the five individual N‐NAs contributing the most to the highest mean TCNA exposure across surveys and age groups ( > 80%).
The highest P95 UB dietary exposure to TCNAs in scenario 2 was about three times higher than in scenario 1.
For the individual compounds, in both scenarios, the main contributing food category to the exposure at the Foodex2 Level 1 was ‘Meat and meat products’ for all N‐NAs. ‘Alcoholic beverages’ (beer and unsweetened spirits and liqueurs) was also a main contributor to the exposure for NDBA, NDMA and NMOR in adolescents, adults, elderly and very elderly in both scenarios. ‘Fish, seafood, amphibians, reptiles and invertebrates’ (processed fish and seafood categories only) was also a main contributor to the exposure in scenario 1 for NDMA, NPIP and NPYR in all age groups and for NDEA in adults, elderly and very elderly and in scenario 2 for NDMA and NPIP in all age groups.
Due to the uncertainty regarding the high proportion of results below LOD/LOQ and/or only limited availability of data considered in the dietary exposure assessment for TCNAs, the CONTAM Panel noted that exposure calculations should be interpreted with caution.
For substances that are both genotoxic and carcinogenic, the EFSA Scientific Committee stated that a margin of exposure (MOE) of 10,000 or higher, if based on the BMDL10 from an animal carcinogenicity study, would be of low concern from a public health point of view (EFSA, 2005). The CONTAM Panel characterised the risk for scenario 1 (excluding cooked unprocessed meat and fish) and scenario 2 (including cooked unprocessed meat and fish). The NDEA BMDL10 of 10 μg/kg bw per day, for increased incidence of liver tumours (benign and malignant tumours combined) in rodents, was used as the reference point for the TCNAs in the MOE approach. MOE values ranged (minimum LB‐maximum UB at the P95 exposure) in scenario 1 from 3,337 to 183 and in scenario 2 from 322 to 48, across dietary surveys (excluding some infant surveys with P95 exposure equal to zero) and age groups. The CONTAM Panel concluded that these calculated MOEs for the TCNAs are below 10,000 in both scenarios which raises a health concern. Attributing a lower potency factor to NMA, NDPA, NDBA, NSAR, NPIP, NPYR would not change the above conclusion.
The P95 exposure assessment was subject to significant sources of uncertainty, which could make the true value up to a factor of three times lower or a factor of eight times higher. The uncertainty contributing most to the potentially large underestimation was the lack of occurrence data for important food categories, especially vegetables, cereals and milk and dairy products. Only minor uncertainties were identified for the reference point (BMDL10) for NDEA. The toxicity of some other N‐NAs was more uncertain due to limitations in the available toxicity data. Taking account of the identified uncertainties, the CONTAM Panel concluded that the MOE for TCNAs at the P95 exposure is highly likely (98–100% certain1) to be less than 10,000 for all age groups.
The CONTAM Panel recommends to
fill the gaps in ADME of N‐NAs relevant to human exposure.
fully characterise the metabolic activation pathways and DNA adducts formed in human and animal tissues.
determine the relative mutagenic potencies of some N‐NAs present in food for which the genotoxic/carcinogenic mechanisms have not been fully clarified (e.g. NMOR, NPIP, NPYR). This would include: (i) the use of metabolic activation systems of human origin, (ii) characterisation of DNA adducts and (iii) comparison of mutational spectra obtained by whole genome sequencing to mutational signatures present in human cancer.
perform epidemiological studies implementing a molecular approach and endorsing omics investigation on the association between N‐NAs and cancer with control of confounding factors (e.g. use of medicines, occupational exposure, smoking).
standardise a sensitive analytical method to quantify the carcinogenic N‐NAs, both volatile and non‐volatile, in different food products.
collect data on N‐NAs in processed foods other than processed meat (i.e. raw meats, vegetables, cereals, milk and dairy products, fermented foods, pickled preserves, spiced foods, etc.) and of products cooked in different ways, with and without the addition of nitrate and nitrite. In addition, more data on human milk are needed to enable the exposure assessment in infants.
1. Introduction
1.1. Background and Terms of Reference as provided by the requestor
1.1.1. Background and rationale of the mandate
N‐nitrosamines can be found as contaminants in processed foods as unintentional by‐products of food preparation and processing. N‐nitrosamines are formed by a reaction between nitrites and certain secondary and tertiary amines. N‐nitrosamines and/or their precursors can be found in certain foods such as processed meats, fish and cheese. They have also been detected in some alcoholic beverages.
Certain N‐nitrosamines such as N‐nitrosodimethylamine (NDMA) and N‐nitrosodiethylamine (NDEA) were classified by the International Agency for Research on Cancer (IARC) as probably carcinogenic to humans (Group 2A).
The EFSA Panel on Food Additives and Nutrient Sources Added to Food (ANS) concluded in its opinion on the re‐evaluation of potassium nitrite (E249) and sodium nitrite (E250) as food additives, 1 that the formation of N‐nitrosamines in the body from nitrites added at approved levels to meat products was of low concern for human health.
EFSA has been requested to assess the risks for public health related to the presence of N‐nitrosamines as contaminants in food.
1.1.2. Terms of reference as provided by the European Commission
In accordance with Art. 29 (1) (a) of Regulation (EC) No 178/20022, the Commission asks EFSA for a scientific opinion on the risks for human health related to the presence of N‐nitrosamines in food.
1.2. Interpretation of the terms of reference
The EFSA Panel on Contaminants and in the Food Chain (CONTAM) will assess the risk to public health related to the presence of N‐NAs as contaminants in food matrices prior to consumption.
The risks for public health related to the presence of N‐nitrosamines endogenously generated from amines and nitrates/nitrites provided by food intake, are not in the scope of the document.
The EFSA CONTAM Panel agreed that this opinion should answer the questions defined in the protocol annexed (Annex A).
1.3. Supporting information for the assessment
1.3.1. Chemistry
N‐Nitroso compounds are a group of chemical compounds considered to be causally involved in the development of cancer in humans and animals, as first proposed by Barnes and Magee (1954). They can be divided into two classes: N‐nitrosamines (N‐NAs) and N‐nitrosamides and related compounds, such as N‐nitrosoureas, N‐nitrosocarbamates, N‐nitrosoguanidines (Fernández‐Alba and Agüera, 2005). From the literature, there is no sufficient evidence of the actual presence of N‐nitroso compounds other than N‐NAs in food.
N‐NAs can be found in food as the consequence of a reaction between nitrosating agents (NOX) with amino‐based substances (R2NH):
The nitrosating agents commonly present in food are nitrite salts or nitrogen oxides.
Table 1 lists all N‐NAs investigated for their presence in food. So far, the actual presence of quantifiable amounts in food has been demonstrated for a limited number of these compounds (Fiddler et al., 1998; Lijinsky, 1999; Stuff et al., 2009; Campillo et al., 2011; Hermmann et al., 2015a,b; Scheeren et al., 2015; Beard and Swager, 2021; Dong et al., 2020).
Table 1.
N‐NAs analysed in food
| # | N‐NA | Acronym | CAS no. | Structure | Volatility boiling point (°C) |
|---|---|---|---|---|---|
| ACYCLIC N‐NAs | |||||
| Volatile | |||||
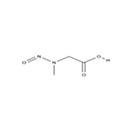
| 1. | N‐nitrosodimethylamine | NDMA | 62‐75‐9 |
|
156 |
| 2. | N‐Nitrosomethylvinylamine | NMVA | 4549‐40‐0 |
|
176 |
| 3. | N‐nitrosomethylethylamine | NMEA | 10595‐95‐6 |

|
178 |
| 4. | N‐nitrosodiethylamine | NDEA | 55‐18‐5 |
|
198 |
| 5. | N‐nitrosoethylisopropylamine | NEIPA | 16339‐041 |
|
206 |
| 6. | N‐nitrosodiisopropylamine | NDIPA | 601‐77‐4 |
|
214 |
| 7. | N‐nitrosomethylbutylamine | NMBA | 4549‐40‐0 |
|
218 |
| 8. | N‐nitrosodipropylamine | NDPA | 621‐64‐7 |
|
236 |
| Non‐volatile | |||||
| 9. | N‐nitrosodiisobutylamine | NDIBA | 997‐95‐5 |
|
251 |
| 10. | N‐nitrosodibutylamine | NDBA | 924‐16‐3 |
|
271 |
| 11. | N‐nitrosomethylaniline | NMA | 614‐00‐6 |
|
275 |
| 12. | N‐nitroso‐N‐(1‐methylacetonyl)‐2‐methyl‐propylamine | NMAMPA | 93755‐83‐0 |
|
283 |
| 13. | N‐nitrososarcosine | NSAR | 13256‐22‐9 |
|
289 |
| 14. | N‐nitrosoethylaniline | NEA | 612‐64‐6 |
|
291 |
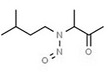
| 15. | N‐nitroso‐N‐(1‐methylacetonyl)‐3‐methyl‐butylamine | NMAMBA | 5336‐53‐8 |
|
298 |
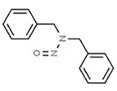
| 16. | N‐nitrosodibenzylamine | NDBzA | 5336‐53‐8 |
|
382 |
| CYCLIC N‐NAs | |||||
| Volatile | |||||
| 17. | N‐nitrosopyrrolidine | NPYR | 930‐55‐2 |
|
209 |
| 18. | N‐nitrosopiperidine | NPIP | 100‐75‐4 |
|
230 |
| 19. | N‐nitrosomorpholine | NMOR | 59‐89‐2 |
|
235 |
| 20. | N‐nitrosothiazolidine | NTHZ | 73870‐33‐4 |
|
242 |
| Non‐volatile | |||||
| 21. | N‐nitroso‐2‐methylthiazolidine | NMTHZ | 73870‐33‐4 |
|
255 |
| 22. | N‐nitroso‐3‐hydroxypyrrolidine | NHPYR | 56222‐35‐6 |
|
266 |
| 23. | N‐nitroso‐2‐hydroxymethylthiazolidine | NHMTHZ | 92134‐93‐5 |
|
313 |
| 24. | N‐nitrosoproline | NPRO | 7519‐36‐0 |
|
321 |
| 25. | N‐nitrosooxazolidine‐4‐carboxylic acid | NOCA | 95326‐10‐6 |
|
325 |
| 26. | N‐nitroso‐5‐methyloxazolidine‐4‐carboxylic acid | NMOCA | 95326‐11‐7 |
|
334 |
| 27. | N‐nitrosopipecolic acid | NPIC | 4515‐18‐8 |
|
335 |
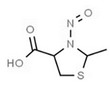
| 28. | N‐nitroso‐2‐methyl‐thiazolidine‐4‐carboxylic acid | NMTCA | 103659‐08‐1 |
|
351 |
| 29. | N‐nitroso‐thiazolidine‐4‐carboxylic acid | NTCA | 88381‐44‐6 |
|
343 |
| 30. | N‐nitrosohydroxyproline | NHPRO | 30310‐80‐6 |
|
359 |
| 31. | N‐nitroso‐2‐hydroxymethyl‐thiazolidine‐4‐carboxylic acid | NHMTCA | 99452‐46‐7 |
|
395 |
| Other N‐NAs | |||||
| Aromatic (a) (non‐volatile) | |||||
| 32. | N‐nitrosodiphenylamine | NDPheA | 86‐30‐6 |
|
359 |


Aromatic N‐NAs are characterised by aromatic ring(s) directly attached to the N‐nitroso functional group.
The identified N‐NAs have been groupe0d into two primary classes, acyclic and cyclic, according to their structure. In addition, since volatility of N‐NAs is a characteristic often reported in the literature, they were further subdivided to volatile and non‐volatile based on the threshold of boiling point (BP) = 250°C suggested by the European Union (EU) Solvents Emissions Directive3 relative to volatile organic chemicals (VOC).4 This division, beyond facilitating the reading of the text, may also provide some useful information, following the completion of the assessment, on structure–activity relationships.
Another N‐NA, N‐nitrosomethylbenzylamine (NMBzA), was reported by Lijinsky (1999) and Jenkins et al. (1999) as a possible food contaminant. However, there is no reliable information related to its quantification in food. N‐nitrosofolic acid was detected in medicines (Documentation provided to EFSA no 1); however, its presence in food, food supplements or food additives containing folic acid is not documented.
Consequently, NMBzA and N‐nitrosofolic acid have not been taken into consideration in this opinion.
1.3.2. Analytical methods
The first analytical approach for the determination of N‐NAs in food was based on the characteristic of these compounds to release nitric oxide (NO) after thermal cleavage. The final detection was obtained by using a thermal energy analyser (TEA), which can measure the light emission of nitrogen dioxide formed after oxidation of nitric oxide (obtained using ozone), in the near infrared region (Fine et al., 1975). This approach can lead to the overestimation of N‐NAs due to the co‐detection of other compounds which generate nitric oxide, so TEA detection was coupled to both liquid and gas chromatographic separation (Sen et al., 1982).
Many N‐NAs detected in food, such as NDMA, NDEA and NDPA, are characterised by volatility. Consequently, gas chromatography was used extensively for this type of analytical determination. Besides TEA, other types of detection, such as the nitrogen phosphorus detector (NPD), reductive Hall detector and flame ionisation detector (FID), as well as nitrogen chemiluminescence detection and mass spectrometry have been proposed (United States Environmental Protection Agency, 1996; Ozel et al., 2010; Al‐Kaseem et al., 2014).
Regarding non‐volatile N‐NAs, some analytical approaches have used high‐performance liquid chromatography (HPLC) with UV, fluorescence and mass spectrometry detection. All these techniques have also been applied for the simultaneous determination of volatile and non‐volatile N‐NAs in food and other matrices (Komarova and Velikanov, 2001; Wang et al., 2006; Avasilcai et al., 2014; Li et al., 2018; Iammarino et al., 2020).
Considering the high sensitivity and selectivity, and the capability of detecting both volatile and non‐volatile N‐NAs, liquid chromatography‐mass spectrometry can be considered a comprehensive technique for this type of analytical determination. Recent studies on the determination of N‐NAs in food, published in the last decade, are summarised in Table 2.
Table 2.
Current analytical methods used for the determination of N‐NAs in food
| Analytical method (a) | Sample preparation | N‐NAs analysed for their presence in food (b) | Limits of detection (μg/kg) | Application field | Reference |
|---|---|---|---|---|---|
| GC‐PCI‐MS/MS | SLLE and SPE | NDMA, NMEA, NDEA, NDBA, NPIP, NPYR, NMOR | 0.10–0.25 | Rice soup, apple juice, corn oil, 20% alcohol matrix | Seo et al. (2016) |
| GC/MS | QuEChERS | NDMA, NDEA, NDBA, NPIP, NPYR, NDPA | 0.4–0.9 | Soy sauce | Zeng et al. (2016) |
| HPLC‐UV | TLPE‐PHWE‐DLLME | NDMA, NMEA, NDEA, NDBA, NPIP, NPYR, NMOR, NDPA, NDPheA | 0.08–0.55 | Salted duck eggs | Li et al. (2018) |
| GCxGC/NCD | Two‐step SPE | NDMA, NDEA, NDBA, NPIP, NPYR, NDPA | 1.66–3.86 | Meat products | Ozel et al. (2010) |
| HPLC/UV‐DAD | AEPSE | NMEA, NDEA, NDBA, NPIP, NPYR, NMOR, NDPA, NDPheA, NMA, NDBzA | 20.1–111.6 | Meat products | Iammarino et al. (2020) |
| LC‐(APCI/ESI)MS/MS | SLE | NDMA, NMEA, NDEA, NDBA, NPIP, NPYR, NMOR, NDPA, NMA, NSAR, NPRO, NTCA, NMTCA | 0.2–1.0 | Meat products | Hermmann et al. (2014, 2015a,b) |
| GC/MS | HS‐SPME | NDMA, NMEA, NDEA, NDBA, NPIP, NPYR, NMOR, NDPA, NDPheA | < 3.6 | Meat products | Roasa et al. (2019) |
| GC‐CI/MS | SLE | NDMA, NMEA, NDEA, NDBA, NPIP, NPYR, NMOR, NDPA, NDPheA | 0.15–0.37 | Meat products | Scheeren et al. (2015) |
| GC‐PCI‐MS/MS | Two‐step SPE | NDMA, NMEA, NDEA, NDBA, NPIP, NPYR, NMOR | 0.10–0.30 | Vegetables, beverages, fish, meat and milk products, oils and fats, sauces and seasonings | Park et al. (2015) |
| LC/MS | SLE | NDEA, NTCA, NMTCA | NA | Meat products | Cintya et al. (2019) |
| GLC/MS | MAE‐DLLME | NDMA, NMEA, NDEA, NDBA, NPIP, NPYR, NDPA | 0.1–0.5 | Meat products | Amelin and Lavrukhin (2016) |
| HPLC‐UV | SLE | NDMA, NDEA, NPIP, NPYR, NMOR | 0.17–0.40 | Seafood | Bhangare et al. (2016) |
| GC/MS | MAE‐DLLME | NDMA, NMEA, NDEA, NDBA, NPIP, NPYR, NMOR, NDPA, NDPheA | 0.003–0.014 | Meat products | Campillo et al. (2011) |
|
GC/FID GC/MS |
SWE and SMC | NDEA, NPIP, NPYR, NMOR | 0.47–1.48 | Meat products | Chienthavorn et al. (2014) |
| GC/MS | HSSPME | NDMA, NMEA, NDEA, NDBA, NPIP, NPYR, NDPA | 0.6–52.4 | Drinking water and beer | Fan and Lin (2018) |
| GC/CI‐MS | MAE and D‐μ‐SPE | NDMA, NMEA, NDEA, NDBA, NPIP, NPYR, NDPA | 0.03–0.36 | Meat products | Huang et al. (2013) |
| GC/MS/MS | QuEChERS | NDMA, NDEA, NDBA, NPIP, NPYR | 0.1 | Meat products | Lehotay et al. (2015) |
| GC‐MS | HSSPME | NDMA, NDEA, NDBA, NPIP | 0.12–0.35 | Red wine | Lona‐Ramírez et al. (2016) |
| HPLC/FLD | DLLME | NDMA, NDEA, NDBA, NPYR, NDPA | 0.01–0.07 | Meat, fish and egg products and beer | Lu et al. (2017) |
| GC/MS/MS | QuEChERS | NDMA, NMEA, NDEA, NDBA, NPIP, NPYR, NMOR, NDPA, NDPheA | 0.01–0.10 | Salted fish | Qiu et al. (2017) |
| GC/MS | DLLME | NDMA, NMEA, NDEA, NDBA, NPIP, NPYR, NDPheA | 011–0.48 | Meat products | Ramezani et al. (2015) |
| GC/MS | HSSPME | NDMA, NDEA, NDBA, NPIP, NPYR | 0.21 (NDBA) | Tequila | Ramírez‐Guízar et al. (2020) |
| GC‐CI/MS/MS | SLE and SPE | NDMA, NMEA, NDEA, NDBA, NPIP, NPYR, NMOR, NDPA, NDPheA | 0.3–0.4 | Meat products | Sannino and Bolzoni (2013) |
| GC/MS/MS | SPE | NDMA, NMEA, NDEA, NDBA, NPIP, NPYR, NMOR, NDPA | 0.05–0.10 | Beef jerky | Wang et al. (2018) |
| GC/MS/MS | IBASLE | NDMA, NMEA, NDEA, NDBA, NPIP, NPYR, NMOR, NDPA, NDPheA, NMA, NEA, NDBzA | 0.1–0.5 | Yellow rice wine and beer | Xian et al. (2019) |
| GC/MS | QuEChERS | NDMA, NDEA, NDBA, NPIP, NPYR, NDPA, | 0.4–0.9 | Soy sauce | Zeng et al. (2016) |
| GC/MS | USLE and SPE | NDMA, NMEA, NDEA, NDBA, NPIP, NPYR, NDPA, NDPheA | 0.057–0.495 | Meat products | Yuan et al. (2015) |
| GC/MS | QuEChERS | NDMA, NMEA, NDEA, NDBA, NPIP, NPYR, NDPA | 0.02–0.15 | Salted vegetables | Zhang et al. (2019) |
| HPLC/FLD | SLE‐DEN‐DER | NDEA, NDBA, NPYR, NDPA | 1.3–2.5 | Salted cucumber, meats and seafood, eggs and marinated garlic | Zhao et al. (2016) |
AEPSE: anionic exchange polymeric sorbent extraction; APCI: atmospheric pressure chemical ionisation; CI: chemical ionisation; DEN: denitrosation; DER: derivatisation; DLLME: dispersive liquid‐liquid micro‐extraction; D‐μ‐SPE: dispersive micro solid‐phase extraction; FID: flame ionisation detector; FLD: fluorescence detection; HSSPME: head space solid‐phase micro‐extraction; IBASLE: ice bath‐assisted solid liquid extraction; LLE: liquid–liquid extraction; MAE: microwave‐assisted extraction; NCD: nitrogen chemiluminescence detection; PCI: positive chemical ionisation; PHWE: pressurised hot water extraction; SLE: solid/liquid extraction; SLLE: solid‐supported liquid–liquid extraction; SMC: silica monolith capillary; SPE: solid‐phase extraction; SWE: superheated water extraction; TLPE: tandem liquid‐phase extraction; USLE: ultrasonic solid liquid extraction. NA: not available.
Studies from 2010 to the present.
The analytical method proposed by Hermmann et al. (2014) allows the simultaneous determination of both volatile and non‐volatile N‐NAs, representing the most efficient approach for this type of analytical determination in meat products. The method combines high selectivity with high specificity. Regarding the application field (matrix), the most effective method seems to be that proposed by Park et al. (2015), applicable to the most important types of food, such as vegetables, meat and milk products, fish, beverages and fats. This method is applicable only to N‐NAs detectable by gas chromatography; taking into account the available literature, it allows the determination of the most significant N‐NAs in food. Due to the low concentrations of N‐NAs in food, method sensitivity can be considered as a very important analytical parameter. As appreciable from Table 2, the detection limits of the available analytical methods are highly variable, e.g. from 0.003 to 20.1 μg/kg for meat product analysis. The number and type of N‐NAs detectable are also variable, e.g. from 3 to 13 compounds in meat products.
1.3.3. Sources of N‐NAs in food
Based on the literature, cured meats often contain detectable levels of N‐NAs mainly due to the use of nitrite as a preserving agent and are affected by several additional factors, such as temperature, pH, processing conditions (i.e. raw material and storage) and the presence of free amines, particularly biogenic amines (EFSA ANS Panel, 2017b). In this regard, a comprehensive review of N‐NA presence in meat is available from Lee (2019). N‐NAs, such as NDBzA, NDMA, NDEA, NPIP, NPYR, NDBA, NMOR and NTHZ, are formed by a reaction between secondary and tertiary aliphatic amines, amides or alkylureas and nitrosating agents (CEPA, 1999; IARC, 2010a,b; Mestankova et al., 2014; Kobayashi, 2018; USDA, 2018; Molognoni et al., 2019). The reaction between nitrosating agents and primary amines leads to the formation of diazocompounds (Hill, 1988), and the corresponding alcohol (Zhao et al., 2007). Tertiary amines, after N‐nitrosation, are deprived of one group (nitrosative dealkylation) becoming the N‐nitroso derivative of a secondary amine.
Besides meat products, the occurrence of N‐NAs has also been reported in other foods, such as beer, cured fish, cheese and soy sauce among others.
In beer, the presence of NDMA is due to the occurrence of two amines (hordenine and dimethylamine) in germinated barley. During the malting process, these two precursors may react with N2O3 and N2O4 from air passed through the malt during kilning (Wainwright, 1986b) to form NDMA. Water can also be a potential source of NDMA in beer as well as other beverages. This N‐NA was identified as a potential disinfection by‐product, so that traces can be found in the water used for production (Baxter et al., 2007). The levels of NDMA detected in beer in the past could vary from 0.1 (Tricker and Preussmann, 1991; Izquierdo‐Pulido et al., 1996) to 0.3 μg/L (Kubacki et al., 1989). Other than NDMA, Tricker and Preussmann (1991) also detected NPRO in the concentration range of 0.5–3.6 μg/L. Fan and Lin (2018) detected low levels of other N‐NAs in beer, such as NDMA, NMEA, NDEA, NDPA, NPIP, NPYR and NDBA. These authors concluded that the levels of NDEA, NDPA and NPIP in beer are similar to those of NDMA. However, there have been no specific studies about the mechanism of formation and possible precursors of these N‐NAs in beer.
The presence of N‐NAs in processed fish was attributed to nitrate addition during processing and/or its natural presence in this matrix. The first reports about the presence of N‐NAs in processed fish date back to the early 1970s. Fish are rich in secondary and tertiary amines and nitrite/nitrate may be present in the salt used in pickling treatment. These factors, together with possible microbial contamination may lead to N‐NA (mainly NDMA) formation at levels up to 388 μg/kg (IARC, 1993). Pedersen and Meyland (1981) also linked the use of nitrate as a food additive in pickled herring, to the possible formation of NDMA. In their study, these authors detected NDMA in several samples at concentrations of up to 2.2 μg/kg. In this context, the paper published by Iammarino et al. (2013) is worthy of mention, as these authors detected nitrate as an endogenous compound in fish at up to 205.3 mg/kg.
The first evidence of N‐NAs in cheese dates back to the late 1970s, when Klein et al. (1978) detected quantifiable amounts of NDMA, NDEA and NPYR in different types of cheese. Nitrate‐based additives are allowed in cheese production by the current European Legislation,5 at up to 150 mg/kg in hard, semi‐hard and semi‐soft ripened cheese and related whey cheese to prevent bloating during ripening. Given the large availability of secondary and tertiary amines in these products, especially ripened cheese, the formation of N‐NAs is possible, particularly if sodium or potassium nitrate is added to cheese milk (Glória et al., 1997). A positive correlation was observed by these authors between the level of nitrate added to cheese milk and the levels of NDMA and NDEA in gruyere cheese. However, there is no full agreement about this topic. Śmiechowska et al. (1994) reported that the formation of N‐NAs in Zulaw, Gouda and Edam cheeses is occasional and not related to the KNO3 additive to milk but rather to the degree of cheese ripeness. The main precursors of N‐NA formation in cheese are N‐nitrosatable amines, such as morpholine, dimethylamine, trimethylamine, pyrrolidine, piperidine and some biogenic amines (i.e. tyramine, histamine and tryptamine). Also, tryptophan derivatives (e.g. N‐acetyl dipeptide) can react with nitrite to give nitroso‐compounds in which the nitroso‐group is substituted at the N‐1 of the indole. The best pH for nitrosation in cheese is 3.4. Aliphatic N‐NAs (NDMA, NDEA, NDPA and NDBA) are mainly found in cheese and milk‐derived products (Gray et al., 1979). NPIP was also detected by Mavelle et al. (1991) at levels up to 2.6 μg/kg, while Stuff et al. (2009) reported about the possible presence of NMOR and NTCA in margarine/butter and cottage cheese, respectively. The correlation between added nitrate and N‐NA levels has not been demonstrated and quantifiable levels of N‐NAs may also be found in cheese with no nitrate added (Gray et al., 1979; Bouchikhi et al., 1999; Renner, 2012). Indeed, nitrate is also an endogenous component of cheese, up to levels of 58.6 mg/kg, and the reduction to nitrite may occur by the action of the enzyme xanthine oxidase (Gray et al., 1979; Iammarino et al., 2013). Moreover, Klein et al. (1980) attributed the presence of NDMA at ≤ 20 μg/kg in cheese to the activity of micromycetes strains (i.e. Penicillium camemberti) used as fermentation agents and/or microorganisms in general at pH between 2 and 4.5 (Klein et al., 1978). The same authors also reported that N‐NAs levels may increase during ripening. Dellisanti et al. (1996) monitored the N‐NA levels in selected Italian cheeses with interesting findings, such as the presence of formaldehyde as a nitrosation catalyst in some cheese types. NDMA, NDPA and NDBA were the N‐NAs found in some samples. However, given the limited number and type of samples analysed in this study, no significant conclusions were drawn.
The presence of N‐NAs (mainly NDMA) in soy sauce has been reported by various authors (Song and Hu, 1988; Park et al., 2015). Kim et al. (1985) and Sung et al. (1991) attributed levels of NDMA of ≤ 261.34 μg/kg in these products to tap water used during production and probably containing high nitrate levels. To date, this seems to be the main cause of N‐NA residues in soy sauce. The generation of N‐NAs from heat‐induced reactions between D‐glucose and L‐amino acids was proposed by Devik (1967) and by Heyns and Koch (1970). However, this proposal was not confirmed by Kawabata and Shyazuki (1972), who studied the presence of N‐NAs in brown‐coloured foods, comprising soy sauce. These authors found no evidence for the presence of N‐NAs, hypothesising a misidentification of non‐enzymatic browning products in the previous studies.
The possible presence of N‐NAs (mainly NDMA, NDEA and NPYR) in vegetables, especially leafy vegetables, and pickled/salted vegetables, is attributed to high levels of nitrate, low pH, the possible presence of not negligible amounts of nitrite and significant concentrations of aryl/alkyl‐ and indolyl‐glucosinolates (Tiedink, 1988; 1991; Song and Hu, 1988; Iammarino et al., 2014; Hamlet and Liang, 2017). Another mechanism of formation was reported by Li et al. (1986) which proved that some species of fungi, namely Fusarium Monoliforme, can reduce nitrate to nitrite and increase the amount of secondary amines in vegetables. These authors detected quantifiable amounts of NDMA, MDEA and NMAMBA.
The presence of NDMA and NDEA, in the range of 0.6–8.7 μg/kg, was detected in potatoes after different types of cooking, due to the high level of nitrate in the raw material (Qajarbeygi et al., 2015).
The possible contamination of water is the only explanation for the presence of N‐NAs in non‐alcoholic beverages (NDMA and NDEA) (Jawad, 2012), alcoholic beverages other than beer (NDMA, NPYR and NMOR) (Park et al., 2015) and fermented beverages (NDMA and NPYR) (Kawabata et al., 1980).
Regarding oils and fats, soybean oil was the most investigated product, and the presence of NDMA and NDEA of up to 28 μg/kg was ascertained (Fiddler et al., 1981). Some articles reported the possible presence of low levels of NDMA and NDEA in oil (Hedler et al., 1979; Fiddler et al., 1981). This result was confirmed by Yurchenko and Mölder in 2006. However, there are no articles describing the mechanism of formation of such N‐NAs in oil.
The presence of N‐NAs in human milk deserves a separate discussion. Indeed, not negligible levels of different N‐NAs can be found in human milk. Lakritz and Pensabene (1984) detected concentrations of NDMA of up to 17.1 μg/kg in human milk collected from lactating women after consumption of nitrate‐rich foods such as bacon, beetroot and spinach. Conversely, Sen et al. (1984) verified the presence of NDMA, NDEA, NDBA, NPIP and NMOR in human milk, as the result of migration from rubber products, also at high levels, corresponding to 2,796 μg/kg (NDBA). Another study reported of 54 milk samples collected from healthy nursing Estonian women analysed for volatile N‐NAs that two samples contained NDMA at 1.1 and 1.2 μg/L, respectively (Uibu et al., 1996).
1.3.4. Effect of processing on the residual concentration of N‐NAs in food and drinking water
1.3.4.1. Food
The possible role of different heat treatments during processing as well as cooking methods before consumption on the presence and levels of N‐NAs in food was investigated in detail. Due to the marked volatility of several N‐NAs, high temperature can lead to a decrease of N‐NAs in the final product. However, some reactions of N‐NA formation are accelerated and favoured by high temperatures.
In meat, pasteurisation during processing inhibits the generation of NDMA and NDEA (Rywotycki, 2002). An increase of NPIP and a decrease of NMTCA and NMTHZ concentrations after heat treatment were verified in meat products by Hermmann et al. (2015a). The same authors reported the effect of high temperature on NPRO, NDMA, NPYR, NDEA and NDMA concentrations, demonstrating that the final residue concentrations are dependent on the type of product and heat treatment. Yuan et al. (2015) analysed different meat products in China, verifying the highest level of volatile N‐NAs (NDMA, NMEA, NDEA, NPYR, NMOR, NPIP, NDBA and NDPheA) in grilled and smoked sausage, probably due to the heat treatment. Different cooking methods (boiling, pan‐frying, deep‐frying and microwave) were tested by Li et al. (2012) in order to verify the effect on the residual amount of NDMA, NDEA and NPYR. The authors reported that the cooking method affects the residual level of N‐NAs. In particular, frying treatments led to an increase in N‐NAs and concurrent decrease of biogenic amine levels, while boiling and microwave treatments had no significant effect on the final concentration of N‐NAs.
Yurchenko and Mölder (2007), Li et al. (2012), Kocak et al. (2012) and Mirzazadeh et al. (2021) studied the effect of boiling, pan‐ and deep‐frying, grilling, smoking and microwaving on the levels of different N‐NAs, comprising NDMA, NDEA, NPYR, NPIP and NDBA, in raw meat, dry‐cured sausages and smoked sausages. The authors reported that cooking by grilling and pan‐ or deep‐frying resulted in the highest N‐NA levels, compared to other heat treatments. In particular, Yurchenko and Mölder (2007), who studied the formation of N‐NAs in poultry and pork meat after grilling and frying, verified the increase of NDMA, NDEA, NPYR, NPIP and NDBA mean levels from non‐detected in raw meat to 1.5 μg/kg (NDMA), 0.7 μg/kg (NDEA), 15.2 μg/kg (NPYR), 1.7 μg/kg (NPIP) and 0.3 μg/kg (NDBA) after cooking. The increase was not substantially different after different types of cooking and by analysing poultry or pork meat. Similar results were obtained by Chen et al. (1991), who cooked bacon samples using a microwave oven and containers of different materials (Teflon‐coated frying pan, transparent and susceptor packages). The authors reported that the use of transparent or susceptor packaging allows the levels of NPYR and NDMA to be decreased, with high levels of NPYR in susceptors compared to transparent packaging. Regarding cooking treatments, the most significant result available from the literature is the possible formation of N‐NAs also in meat products with no added nitrite/nitrate (i.e. raw mutton). The possible presence of these low levels of N‐NAs in these products after cooking could be due to the concurrent presence of free amines and low endogenous concentrations of nitrate. Indeed, ‘natural’ levels of nitrate up to almost 40 mg/kg in fresh meat have been reported in various studies (EFSA ANS Panel, 2017a,b; Iammarino and Di Taranto, 2012; Iammarino et al., 2013). The high temperature could somehow trigger the reaction. However, further studies are needed to better understand the mechanism of reaction. Moreover, some articles reported that the use of some spices, such as paprika, can increase the level of some N‐NAs after cooking (Yurchenko and Mölder, 2007). In this study, the N‐NA increase was attributed to the presence of a high level of NPYR precursors in paprika (Huxel et al., 1974). Also in this case, novel studies are needed to better understand the topic.
Two tertiary amine alkaloids, namely hordenine and gramine, are the most important precursors of N‐NAs in beer. These compounds, produced during malt germination, can be nitrosated resulting in the formation of NDMA (Davidek, 2017). During malting and brewing, the nitrosation of proline can also occur when the temperature reaches 100°C. NPYR and most of NDMA are lost during heat treatments, but high temperatures also produce NPYR by nitrosation of proline peptides and amides at pH 3–4.62, and NDMA from NSAR above 80°C. Moreover, lecithin can produce NDMA, NDEA and NDPA after heating with nitrite in solution and additional NDMA can be generated from nitrosohordenine decomposition after heating (Wainwright, 1986a).
Regarding heat treatments linked to N‐NA formation in fish, such as frying, broiling or steaming, NDMA, NDEA, NDPA, NMOR and NDBA were detected at up to 1.4 μg/kg (IARC, 1993). Another study by Iyengar et al. (1976) reported NDMA levels in the range of 4–6 μg/kg, detected in smoked caplin, while, after baking or frying, NDEA was also detected in fish samples such as halibut and scallops. In these samples, the presence of nitrate in the range of 8–94 mg/kg was also ascertained. Yurchenko and Mölder (2006) investigated the effect of different cooking treatments on the formation of NDMA, NDEA, NPYR NPIP and NDBA. In this study, the authors confirmed the absence of N‐NAs in fresh fish, and their possible detection after smoking treatment and cooking by frying. If compared to smoking treatment, the levels of all N‐NAs were slightly greater after frying, probably due to the higher temperature of processing. Quantifiable concentrations of N‐NAs were also detected in pickled and salted/dried fish. In these last cases, the presence of N‐NAs can be due to different sources. The long storage with consequent matrix proteolysis causes the release of considerable amounts of free amines. In pickled products, the acidic conditions can cause the reduction of endogenous nitrate to nitrite. Moreover, some processed fish products can be added with food additives.
Quantifiable levels of NDMA of (up to) ≤ 5.3 μg/kg were detected in milk, in particular non‐fat dry milk, as a consequence of direct‐fire processing used in production (Scanlan et al., 1994). The presence of this N‐NA at ≤ 0.6 μg/kg was also ascertained in pasteurised, evaporated and sweetened condensed milk, while the presence of N‐NAs in raw milk is considered unlikely (Lakritz and Pensabene, 1981). In their study, Havery et al. (1982) also detected NPYR and NPIP, other than NDMA, in non‐fat dry milk, at concentrations not higher than 0.1 μg/kg. Finally, Weston (1983) quantified NDMA in milk proteins (casein and lactalbumin) obtained from both direct and indirect drying, at very low levels of ≤ 0.3 μg/kg, while no N‐NAs were detected in raw materials, confirming that this type of processing can lead to formation of N‐NAs.
Qajarbeygi et al. (2015) studied the effect of deep and superficial frying and boiling in distilled and drinking water on the residual amount of NDMA and NDEA in potatoes. The authors ascertained that frying, especially superficial frying, may increase the levels of NDMA and NDEA up to 5.1 and 8.7 μg/kg, respectively. This finding was explained by the high nitrate levels in potatoes.
Several studies available in the literature are focused on the use of nitrite in meat and its correlation with N‐NA formation. For instance, Shahidi et al. (1994) reported on the absence of N‐NAs in cooked pork with or without the addition of nitrite and its presence at low levels in cod and products obtained by mixing pork and cod and cod surimi up to 50%, when nitrite was added. Hermmann et al. (2015b) studied the formation and mitigation of N‐NAs in meat products, verifying a positive correlation between the levels of NPIP, NHPRO, NPRO, NTCA and NMTCA and the amount of nitrite added to pork sausages (up to 350 mg/kg), after pan‐frying (reached temperature of sausage: 100°C). The authors also reported that the levels of NDMA and NPYR remained below the limit of quantification (LOQ). Fiddler et al. (1996) quantified the concentration of NDBzA in ham when processed in elastic nets made with rubber. The authors verified the increase of this N‐NA with netting contact time and the nitrite amount added to the outer surface. No significant effect on the formation of N‐NAs in chicken salami was observed by Shahidi et al. (1995) when adding mechanically separated seal meat and seal protein hydrolysate. The only slight effect was observed after frying, when the content of NDMA increased from 0.29 to 0.79 ppb. De Mey et al. (2014) studied the formation of NDMA, NDEA, NDBA, NPIP, NPYR and NMOR in dry fermented sausages after the addition of nitrite, cadaverine and piperidine. The most significant results were obtained when 150 ppm of nitrite and 100 ppm of piperidine were added to the samples. After storage, about 50% of these samples were characterised by quantifiable levels of NPIP (highest concentration ≈ 15 ppb), while other N‐NAs were not detected. Drabik‐Markiewicz et al. (2010, 2011) studied the influence of biogenic amines (putrescine, cadaverine, spermidine and spermine) and other nitrogen‐containing compounds (proline, hydroxyproline and pyrrolidine) on the N‐NA formation in heated cured lean meat, both in the presence and absence of nitrite and at different processing temperatures. The authors reported that the levels of N‐NAs, especially NDMA and NPIP, increased at high processing temperatures and with a high amount of nitrite (much higher than the maximum permitted levels for nitrites as food additives). Spermidine, putrescine, proline and pyrrolidine might amplify the formation of NDMA and NPYR.
Moreover, a recent concern in food safety is the illegal treatment of tuna with high amounts of nitrite to obtain a significant improvement in appearance (European Commission, 2017). Taking into account the high levels of amines (particularly biogenic amines) in these products (Lo Magro et al., 2020), the possible formation of N‐NAs should be considered.
In summary, most studies about the effect of processing on N‐NA formation were focused on meat products with some significant findings also in fish. The N‐NAs most frequently detected were NDMA, NDEA, NPYR and NPIP. The highest formation of these N‐NAs was verified when the products were treated by using high temperatures such as in grilling or frying. Thus, the formation of most important N‐NAs in meat and fish products seems related to the heat treatment temperature.
1.3.4.2. Drinking water
N‐NAs can also be present at trace levels in drinking water. They represent disinfection by‐products that form when water is treated with certain disinfectants, such as chloramine, sodium hypochlorite, among others. The levels of N‐NAs in drinking water depend on water pollution with nitrogen‐containing waste such as run‐off from animal‐feeding operations, wastewater treatment plants, etc. (WHO, 2008). The WHO (2008) listed other possible sources of N‐NAs in drinking water than by‐products of water treatment plants, generated from chlorination and/or anion‐exchange process. These contaminants can be derived from the environment, particularly dimethylhydrazine degradation, emissions from diesel vehicle exhaust, alkylamines reaction with nitrate or nitrite, sewage sludge application to soils rich in nitrate or nitrite and use of certain contaminated pesticides.
The reaction between dichloramine and amine precursors is considered the prevalent mechanism of formation of NDMA which is the most studied N‐NA in drinking water. However, it accounts for only 5% of all N‐NAs present in chloraminated drinking water (Krasner et al., 2013). This means that further research is needed to better characterise the N‐NA profile of drinking water.
Among the few studies available, Fan and Lin (2018) detected seven N‐NAs in drinking water: NMEA, NDEA, NDMA, NDPA, NPYR, NPIP and NDBA. If compared with the levels usually detected in food, the concentrations of N‐NAs in drinking water are much lower. For instance, the highest concentration detected by Luo et al. (2012) in China was related to NDMA and equal to 13.3 ng/L, where the authors also detected NMOR and NDPhA. In Spain, Farré et al. (2020) detected no more than 4.2 ng/L of NDMA in final treated water samples. Higher N‐NA levels, up to 42.6 ng/L of NDPA and 59.1 ng/L of NPYR, were detected by Chen et al. (2019) in water collected from two different water treatment plants in China.
1.3.5. Mitigation measures to reduce the N‐NAs concentration in food and drinking water
Another important chemical aspect in the mechanisms of N‐NA formation is the possible inhibition obtained by adding some compounds to the product formulation. The possible use of ascorbates and erythorbates for NDMA mitigation in meat was first proposed by Fiddler et al. (1973). This effect was confirmed in many subsequent studies (Sen et al., 1976; Kalus and Filby, 1980; Mirvish, 1981; Tannenbaum et al., 1991; Özbay and Şireli, 2022), becoming a treatment that has been required by the USDA since the early 1980s (McCutcheon, 1984). In Europe, both ascorbic acid/ascorbates (E300–E302) and erythorbic acid/sodium erythorbate (E315–E316) are listed in the food additives list of Regulation (EC) No 1333/20086. Indeed, their addition is common in processed meats with added nitrite/nitrate. The use of these compounds accelerates the chemical conversion of nitrite to nitric oxide, inhibiting the nitrosamine formation (Archer et al., 1975; JECFA, 2017). However, nitric oxide could promote other types of reactions e.g. nitrosylation and formation of potentially toxic compounds (Kostka, 2020). Hermmann et al. (2015b) reported up to 75% reduction of NHPRO, NPRO, NPIP and NTCA in meat products with added erythorbic acid. In the same study, the authors verified a slight decrease of NPIP, NSAR and NPYR levels in meat products supplemented with haem (e.g. ~ 28% for NPIP), due to increased competition for the nitrosating agents because more nitric oxide was bound to haem. Moreover, the authors specified that the addition of Fe(III) (added both as haem iron in the form of myoglobin from equine heart and free iron as Fe2(SO4)3 • H2O) annulled the inhibiting effect of erythorbic acid, especially for NTCA and NMTCA.
The possibility of exploiting the antioxidant activity of polyphenols (mainly propyl gallate) for reducing the residual level of N‐NAs was first proposed in the late 1970s (Sen et al., 1976; Mergens and Newmark, 1980). These compounds can also inhibit the growth of microorganisms with amino acid decarboxylase activity, reducing the level of residual nitrite, the main precursor of NDMA (Drabik‐Markiewicz et al., 2011). The possible use of ingredients containing high levels of polyphenols (mainly proanthocyanidins from green tea) in meat formulations was proposed by Li et al. (2013) who reported the decrease of NDEA and NPYR in dry fermented sausage with both plant polyphenols and ascorbic acid added. Wang et al. (2015) confirmed that the addition of 300 mg/kg of green tea polyphenols, grape seed extract (mainly proanthocyanidins and catechins), and α‐tocopherol reduces the residual level of NDMA in dry‐cured bacon. Other possible ingredients to add to food for the same purpose were proposed by Bastide et al. (2017) (red wine, rich in phenolic acids, flavonoids, tannins and stilbenes and pomegranate extract, rich in punicalagins and ellagic acid), and by Tian et al. (2020) (Diospyros lotus L. leaf extract, rich in myricetin).
Dion et al. (1997), Choi et al. (2007) and Yuan et al. (2015) studied other possible compounds useful as nitrite scavengers, such as some sulfur compounds (e.g. S‐allyl cysteine, S‐oxodiallyl disulfide, dipropyl disulfide, etc., and 1,2‐benzendicarboxylic acid) present in garlic, onion and strawberries. The inhibition of NDMA and NMOR formation was demonstrated. Finally, Theiler et al. (1981) reported about the inhibiting activity of sodium chloride on NPYR formation.
Regarding other possible food processes useful for reducing the levels of N‐NAs, Rywotycki (2002) revealed that pasteurisation is an effective treatment, which can halve the N‐NA residues in the product. Fiddler et al. (1992, 1993) and Pensabene and Fiddler (1993) tested the addition of Alaska pollock surimi as partial substitutes of meat in frankfurters, obtaining a decrease in NDMA formation. Shao et al. (2021) investigated the effects of adding Lactobacillus pentosus R3 on NDMA formation in raw, fermented and cooked sausages, obtaining an NDMA concentration decrease comparable to that deriving from the addition of sodium erythorbate. Finally, meat irradiation was extensively used to decrease the levels of N‐NAs (Ahn et al., 2002a,b; Jo et al., 2003; Song et al., 2003; Byun et al., 2004; Wei et al., 2009). Irradiation doses up to 30 kGy were tested, obtaining a decrease in NDMA, NDEA and NPYR concentrations in different meat products. This reduction could be due to the decrease in nitrosomyoglobin and nitrite caused by irradiation.
For beer, a lot of research was focused on the improvement of processing to reduce the levels of N‐NAs. The levels of these contaminants in beer caused worldwide concern in the late 1970s, when the possibility of detecting NDMA concentrations higher than the threshold value of 0.5 μg/L was high, and levels up to 70 μg/L were detected. This was predominantly due to the adopted procedure for malt kilning, obtained by direct firing (Lachenmeier and Fügel, 2007).
A decrease in NDMA can be obtained in malt processing by adopting several procedures. The first is the avoidance of N2O3 and N2O4 in the kilning air, using systems with indirect heating of low NOx burners. Sulfurous anhydride can also be injected in the kilning air, obtaining a further decrease in NDMA formation. Moreover, some conditions (i.e. temperature and moisture control, application of bromate, ammonium persulfate, etc.) can be used during malt processing to decrease the levels of hordenine and dimethylamine, the most important precursors of N‐NAs in beer (Davidek, 2017).
Processing modifications enabled a decrease in the incidence of samples with a high level of NDMA (higher than the threshold value) from 70% in the late 1970s to 5% in the 1990s, up to only 1–2% in the 2000s (Lachenmeier and Fügel, 2007; Baxter et al., 2007). Thus, nowadays, the NDMA intake from beer consumption is of less concern.
Regarding certain types of cheese, Stasiuk and Przybyłowski (2006) replaced a traditional KNO3 addition in cheese‐making milk with the addition of this salt in brine, obtaining a slight reduction in NDEA formation.
Regarding N‐NA removal from drinking water, several methods have been proposed. These methods include UV radiation, precursor removal by activated carbon, precursor deactivation by oxidants and advanced oxidation processes (AOPs), ozone and chlorine (Krasner et al., 2013; Bian et al., 2019).
1.3.6. Non‐dietary sources of N‐NAs
From the limited available scientific literature, tobacco products (cigarettes, cigars) followed by personal care products (cosmetics, hair products, lotions, shampoos, soaps) are representing the main non‐dietary exposure sources to N‐ NAs.
N‐NAs observed in personal care products are primarily due to the presence of N‐nitrosodiethanol‐amine (NDELA), accounting for 99% of the concentration of all observed N‐ NAs within care products. Carcinogenic N‐NAs observed within tobacco products are mainly due to the presence of N‐nitrosonornicotine (NNN) and 4‐(N‐nitrosomethylamino)‐1‐(3‐pyridyl)‐1‐butanone (NNK) (EMA, 2020).
A recent critical review dealing with major sources of human exposure to N‐NAs published in 2018 by Gushgari and Halden has provided some refined quantification of estimations of total N‐NA exposure (TNE) by diet and lifestyle. One hundred and twenty‐two relevant studies on N‐NA occurrence, encompassing contamination of food products, water, tobacco, alcohol and personal care products were reviewed. The analysis performed by the authors was concentrated on the following selected N‐NAs of major concern listed as NNN, NNK, NDMA, NDEA, NPIP, NPIP, NDBA, NPYR, NDELA, NMEA, NDPhA. Average N‐NA levels within commonly contaminated matrices were evaluated in conjunction with dietary and lifestyle data to estimate average daily exposures for the selected N‐NA. The authors identified tobacco use as the largest source of mean daily N‐NA intake across all considered categories, at a rate of 21,800 ng per day. Uptake of N‐NAs from food intake was identified as the second largest source of N‐NA exposure, with mean daily intake values ranging from 1800 to 1900 ng per day. Consumption of beer or other malt beverages contributes with an intake of 1000 ng per day of N‐NAs, whereas exposure from consumption of potable water was the smallest daily dose of N‐NA exposure at a rate of 120 ng per day. In these estimates, individuals regularly consuming beer, and smoking tobacco are expected to incur most of their daily exposure from tobacco use (88%), food intake (8%), beer consumption (4%) and potable water consumption (< 1%) accounting for the remainder. The Panel noted that the exposure estimates for the sum of food, beer and water are consistent with the exposure estimates in this opinion. In this publication, uptake from personal care products was not documented by the authors due to the large uncertainties associated with the use and type of personal care products and the highly variable level of N‐NAs found therein. But it can be noted to date that this potential exposure source to N‐NAs is no more an issue considering that EMA in its recent report published in 2020 indicated that personal care products (cosmetics, hair products, lotions, shampoos, soaps) containing N‐NAs including NDELA are no longer allowed on the EU/EEA market under the Cosmetics Directive 76/768/EEC (limit of 50 μg/kg (50 ppb) for N‐NAs).
In 2020, EMA published an opinion on the presence of N‐NAs in medicines due to NA‐contaminated starting materials or intermediate active pharmaceutical ingredients in the synthesis of drugs. In this report, possible causes that could lead to N‐NA formation and contamination in medicinal products were identified, requiring companies to take measures to limit the presence of N‐NAs in human medicines as far as possible in order to ensure that levels of these impurities in the final product do not exceed acceptable control limits that have been defined for individual N‐NAs at 96 ng per day for NDMA and for NMBA and at 26.5 ng per day for NDEA, EIPNA, DIPNA, MeNP and for NDBA (EMA, 2020). According to Directive 2009/48/EC on the safety of toys, levels of N‐NAs are limited to ≤ 10 μg/kg in toys made with elastomers. The German Bundesinstitut für Risikobewertung (BfR) calculated an exposure of < 0.19 ng per day, assuming a maximum release limit of 0.05 mg/kg rubber is met (EMA, 2020).
According to estimates, it can be reasonably assumed that the human exposure sources to N‐NAs followed the order: smoking, 21,800 ng per day, diet (food including beer and water), around 3,100 ng per day and drugs, < 100 ng per day (Gushgari and Halden, 2018; EMA, 2020).
1.3.7. Previous assessments
In 2017, the EFSA ANS Panel in its opinion in the frame of the risk assessment of nitrates and nitrites as food additives (EFSA ANS Panel, 2017a,b) considered that nitrite may contribute to the formation of N‐NAs, endogenously upon ingestion and in food matrices prior to consumption, and therefore assessed both issues. For the endogenous formation of N‐NAs, the ANS Panel quantified the theoretical amount of N‐nitrosodimethylamine (NDMA) upon digestion of nitrite at the level of the ADI (0.07 mg/kg bw, nitrite ion per day). Applying a number of conservative assumptions, the Panel estimated that the margin of exposure (MoE) would be much greater than 10,000 and therefore of low concern (EFSA, 2005; EFSA Scientific Committee, 2012a). In epidemiological studies, there was evidence for a positive association between preformed NDMA and increased risk of colorectal cancer (CRC) or its subtypes. Based on literature occurrence data, the Panel estimated the risk from the exposure to two N‐nitroso compounds (NDMA and NDEA both separately and as a sum) present in meat products and calculated the MoE for the total exposure to NDMA plus NDEA using the lowest BMDL10, i.e. the BMDL10 of NDEA. This resulted in a conservative estimate, as NDEA gives a lower contribution to the overall exposure compared to NDMA. Under this assumption, the Panel concluded that at the mean exposure, the MoE was < 10,000 in toddlers, children and adolescents in some surveys. At high level exposure, the MoE was < 10,000 in all age groups. However, based on the results of a systematic review, the Panel concluded that it was not possible to clearly discern the NOCs produced from the nitrite added as food additive at the authorised levels, from those produced already in the food matrix where nitrite has not been added.
In 2008, the WHO published a background document (WHO, 2008) for the development of WHO Guidelines for N‐Nitrosodimethylamine Drinking water Quality. The WHO used a study (Brantom, 1983; Peto et al., 1991a,b) with exceptionally wide concentration ranges (15 dose groups between 33 and 16,896 μg/L). The dose groups were also large, with 60 male and female Colworth–Wistar rats at each dose. The WHO calculated the TD05 (i.e. the dose level that causes a 5% increase of risk over background) for hepatic cancers of various types in the male and female rats. The most sensitive endpoint was hepatic biliary cystadenoma in female rats: the 95% lower confidence limit on the TD05 was 18 μg/kg bw per day, resulting in a unit risk of 2.77 × 10⁻³ μg/kg bw per day. No animal‐to‐human kinetic adjustment was applied to the calculation of the base unit risk. For the evidence that humans may be particularly at risk from NDMA, the guideline value (GV) for NDMA in drinking water associated with an upper bound excess lifetime cancer risk of 10−5 was set to approximately 0.1 μg/L.
In 2011, a guideline technical document on N‐Nitrosodimethylamine (NDMA) for Canadian drinking water was published (Health Canada, 2011). Using the same study used by the WHO in 2008 (Brantom, 1983; Peto et al., 1991a,b), TD05 values ranging from 34 to 82 μg/kg bw per day for female rats and from 35 to 78 μg/kg bw per day for males were used to calculate unit risks for this assessment. An animal to human allometric scaling factor of (0.35/70)¼ was applied to the resulting unit risks to account for interspecies differences in susceptibility to NDMA. The maximum acceptable concentration (MAC) for NDMA in drinking water associated with an excess lifetime cancer risk of 10−5 was 0.04 μg/L.
In 2012, the Scientific Committee on Consumer Safety published an opinion on Nitrosamines and Secondary Amines in Cosmetic Products (SCCS, 2012). The SCCS based the ranking of the NOCs assessed with respect to their carcinogenic potential using three dose descriptors common in carcinogenic risk assessment, T25, BMDL10 and TD50. A good correlation was found between the carcinogenic potency and the in vivo genotoxic potency.
In 2020, the European Medicines Agency's (EMA's) Committee for Medicinal Products for Human Use (CHMP) published an assessment report on nitrosamine impurities in human medicinal products (EMA, 2020). The EMA/CHMP set limits for individual N‐NAs belonging to the ‘cohort of concern’ in human medicinal products based on the guidelines on assessment and control of DNA‐reactive (mutagenic) impurities in pharmaceuticals to limit potential carcinogenic risk (ICH M7 (R1), 2015). An acceptable intake (AI) is established specifically for each nitrosamine. The point of departure for establishing the acceptable intake for nitrosamine impurities in medicinal products is usually the TD50 (indicating the lifetime dose at which tumours would have developed in 50% of animals which would have remained tumour free without treatment) and this is converted to a specification limit using the maximum daily dose of the medicinal product. The TD50 values calculated in animal cancer studies were used as the point of departure. The Carcinogenic Potency Database (CPDB)7 (Gold et al., 1991) was considered as a reliable source of TD50 values from cancer studies. Based on TD50 values, N‐nitrosamines with a TD50 below 1.5 mg/kg/day (cohort of concern chemicals) would be listed according to their TD50 as follows: NMPEA > NDEA > NDMA > NMEA > NNK > NNN > NMOR > NMA > NDPA > NDBA > NPYR > MNNG > NMBA > NPIP
With regard to previous assessments of the hazard, IARC (1978, 1982) has classified NDMA and NDEA as group 2A carcinogens (probably carcinogenic to humans) and NMEA, NDPA, NMVA, NDIBA, NSAR, NMOR, NPIP and NPYR as group 2B carcinogens (possibly carcinogenic to humans) while NPRO, NHPRO and NDPheA were allocated to group 3 (not classifiable as to its carcinogenicity to humans); all other N‐NAs of this opinion were not classified.
1.3.8. Legislation
N‐NAs are regulated in the European Union for their presence in elastomer or rubber teats and soothers,8 in cosmetic products9 and in toys.10
There is no available EU legislation regulating the presence of N‐NAs in food or drinking water.
2. Data and methodologies
The current update of the EFSA risk assessments on N‐NAs in food was developed applying a structured methodological approach, which implied developing a priori the protocol or strategy of the full risk assessments and performing each step of the risk assessment in line with the strategy and documenting the process. The protocol in Annex A to this Opinion contains the method that was proposed for all the steps of the risk assessment process, including any subsequent refinements/changes made.
2.1. Data
2.1.1. Dietary exposure assessment
In this section, the data used to estimate the dietary exposure to N‐NAs are described. This estimation includes exposure to N‐NAs, from all dietary sources.
2.1.1.1. Food consumption data
Food consumption data from the EFSA Comprehensive European Food Consumption Database (Comprehensive Database) were used for the dietary exposure assessment to N‐NAs. This database contains national data on food consumption at the individual level, which is the most complete and detailed data currently available in the EU.
The food consumption data gathered in the Comprehensive Database was collected using repeated 24‐h or 48‐h dietary recalls or dietary records covering 3 or 7 days per individual. Owing to the differences in the methods used for data collection, direct country‐to‐country comparisons of the exposure estimates should be avoided.
Details of how the Comprehensive Database is used to assess the dietary exposure to food chemicals were published in a 2011 EFSA Guidance (EFSA, 2011). The latest version of the Comprehensive Database was updated in 2021 and contains results from 51 dietary surveys carried out in 24 Member States (MSs) covering 97,154 individuals. Six surveys provide information on ‘Pregnant women’, two on ‘Lactating women’ and one on Vegetarians. When two different dietary surveys are available for one country and age class, the most recent one is used in the dietary exposure assessment.
Since 2018, all consumption records in the Comprehensive Database have been codified according to the FoodEx2 classification system (EFSA, 2015). The FoodEx2 classification system consists of a large number of standardised basic food items aggregated into broader food categories in a hierarchical parent–child relationship. Additional descriptors, called facets, are used to provide additional information about the codified foods (e.g. information on food processing and packaging material).
For N‐NAs, a chronic dietary exposure assessment is relevant in the context of the terms of reference. For such an assessment, surveys in which food consumption data were collected over only 1 day are not considered appropriate. Exclusion of these surveys resulted in a total of 41 dietary surveys carried out in 22 MSs covering 83,540 individuals. Table 3 provides an overview of the population groups and countries included in the dietary exposure assessment of N‐NAs.
Table 3.
Population groups and countries included in the chronic dietary exposure assessment
| Population group | Age range | Countries with food consumption surveys covering more than 1 day |
|---|---|---|
| Infants | > 12 weeks to < 12 months | Bulgaria, Cyprus, Denmark, Estonia, Finland, France, Germany, Italy, Latvia, Portugal, Slovenia, Spain |
| Toddlers | ≥ 12 months to < 36 months | Belgium, Bulgaria, Cyprus, Denmark, Estonia, Finland, France, Germany, Hungary, Italy, Latvia, Netherlands, Portugal, Slovenia, Spain |
| Other children | ≥ 36 months to < 10 years | Austria, Belgium, Bulgaria, Cyprus, Czechia, Denmark, Estonia, Finland, France, Germany, Greece, Hungary, Italy, Latvia, Netherlands, Portugal, Spain, Sweden |
| Adolescents | ≥ 10 years to < 18 years | Austria, Belgium, Cyprus, Czechia, Denmark, Estonia, Finland, France, Germany, Greece, Hungary, Italy, Latvia, Netherlands, Portugal, Romania, Slovenia, Spain, Sweden |
| Adults | ≥ 18 years to < 65 years | Austria, Belgium, Croatia, Cyprus, Czechia, Denmark, Estonia, Finland, France, Germany, Greece, Hungary, Ireland, Italy, Latvia, Netherlands, Portugal, Romania, Slovenia, Spain, Sweden |
| Elderly | ≥ 65 years to < 75 years | Austria, Belgium, Cyprus, Denmark, Estonia, Finland, France, Germany, Greece, Hungary, Ireland, Italy, Latvia, Netherlands, Portugal, Romania, Slovenia, Spain, Sweden |
| Very elderly | ≥ 75 years | Austria, Belgium, Denmark, France, Germany, Hungary, Ireland, Italy, Latvia, Netherlands, Portugal, Romania, Sweden |
According to the EFSA Scientific Committee Guidance on the risk assessment of substances present in food intended for infants under 16 weeks of age, the exposure assessment for these infants should be carried out separately from that for older infants, following the procedure described in the guidance (EFSA Scientific Committee, 2017a). Based on this guidance, infants under 16 weeks of age should be excluded from the dietary exposure estimation of the infants age group. However, for the exposure assessment of N‐NAs, due to uncertainty in the reported individual ages of infants in the Comprehensive Database, the cut‐off age was based on a validated existing age group in this database corresponding to 12 weeks of age. Thus, food consumption data of infants between 12 and 16 weeks of age were also included in the exposure assessment. As the number of children within this age range in the database is limited, it is not expected that this will have affected the exposure estimate of N‐NAs for infants of 16 weeks up to 12 months of age.
Table C.1 in Annex C provides details on the dietary surveys included in the dietary exposure assessment.
2.1.1.2. Concentration data for N‐NAs in food
Analytical results from the EFSA contaminant database as well as literature data on N‐NA concentrations in food were used to assess the dietary exposure to N‐NAs. These data sources are described below. Details on concentration data validation and selection are given in Section 3.3.
2.1.1.2.1. Occurrence data submitted to EFSA
Following a mandate from the European Commission to EFSA, a call for annual collection of chemical contaminant occurrence data in food was issued by the former EFSA Dietary and Chemical Monitoring Unit (now iDATA Unit) in December 2010. Since then, data have been submitted every year with a closing date on 1 October of each year.11 As no N‐NA data was submitted before 2021, N‐NAs were put in the priority list of the call for data in 2021 with a deadline for submission by 30 June 2021.
The data submission to EFSA follows the requirements of the EFSA Guidance on Standard Sample Description for Food and Feed (EFSA, 2010a) and the EFSA Guidance on Standard Sample Description 2 (EFSA, 2013). Occurrence data were managed following the EFSA standard operational procedures (SOPs) on ‘Data collection and validation’ and on ‘Data analysis of food consumption and occurrence data’.
2.1.1.2.2. Occurrence data in the literature
An extensive literature search was carried out to collect data on the levels of N‐nitroso compounds in food. Bibliographic searches were conducted in bibliographic databases or scientific citation search platforms via an extensive literature review and as listed in Annex A of the protocol for nitrosamines using search terms related to occurrence concentrations of N‐nitroso compounds in food. During the development of the opinion, additional publications were collected by applying a ‘snowballing approach’.12
2.1.2. Hazard identification and risk characterisation
2.1.2.1. Collection and selection of evidence
Information relevant for the sections under hazard identification and characterisation was identified by an extensive literature review13 (Extensive literature search on N‐nitroso compounds in food). During the development of the opinion, additional publications were collected by applying a ‘snowballing approach’. Since there is no previous opinion from EFSA on the matter, no time limit was applied in the literature searches.
2.1.2.1.1. Toxicological studies
Studies on the acute, repeated‐dose and long‐term effects as well as the carcinogenic activity or toxicity on reproduction and the immune system date back to the mid‐1950s with the majority performed in the 1960s and 1970s. At that time, OECD guidelines for the testing of chemicals in whole animal bioassays had not been developed. Occasionally, old studies were not documented completely and/or lack negative controls. Nevertheless, they were added to the tables for an overview of the overall outcome.
2.2. Methodologies
2.2.1. Dietary exposure assessment
To calculate the chronic dietary exposure to N‐NAs, food consumption and body weight data at the individual level were obtained from the Comprehensive Database. The mean daily consumption at the individual level was combined with the lower bound (LB), medium bound (MB) and upper bound (UB) mean concentration of each N‐NA considered in the risk assessment and with the total concentration of all N‐NAs considered, at the most detailed level of the FoodEx2 classification system to calculate individual average daily exposures. For eating events concerning foods for which the occurrence of N‐ NAs was obtained from the literature, the same value was used for the LB, MB and UB as no information was available on the treatment of left censorship. On the basis of distributions of individual average daily exposures, the LB, MB and UB mean and 95th percentile exposure was then calculated for each N‐NA and for the total of the N‐NAs considered in the risk assessment per survey and per age class.
The contribution of food categories at level 1 of the FoodEx2 classification to the dietary exposure to each N‐NA compound and for the total of the N‐NAs considered in the risk assessment, for each survey and age class, was calculated using the relevant LB mean exposure. Categories that contributed more than 10% of the exposure in the highest number of surveys per age class were considered a main contributor for that class.
Surveys on ‘Pregnant women’, ‘Lactating women’ and ‘Vegetarians’ were used to identify specific concerns for these subpopulation groups.
Eating events concerning meat‐ and fish‐based composite dishes were remapped to the relevant main fish and meat ingredient and the consumed amount of the ingredient was calculated using the percentages documented by EFSA's Raw Primary Commodity model (EFSA, 2019a) and shown in Table C.4 of Annex C.
2.2.2. Hazard identification and risk characterisation
The CONTAM Panel applied the general principles of the risk assessment process for chemicals in food as described by the WHO/IPCS (2009), which include hazard identification and characterisation, exposure assessment and risk characterisation. In addition to those principles, EFSA guidance pertaining to risk assessment: the guidance on the approach for risk assessment of substances which are both genotoxic and carcinogenic (EFSA, 2005), on uncertainties in dietary exposure assessment (EFSA, 2007), on transparency in the scientific aspects of risk assessments (EFSA, 2009), on standard sample description for food and feed (EFSA, 2010a), on management of left‐censored data in dietary exposure assessments (EFSA, 2010b), on use of the EFSA comprehensive food consumption database in intakes assessment (EFSA, 2011), on genotoxicity testing (EFSA Scientific Committee, 2011), on selected default values to be used in the absence of data (EFSA Scientific Committee, 2012b), on risk assessment terminology (EFSA Scientific Committee, 2012c), on the benchmark dose (BMD) approach (EFSA Scientific Committee, 2017b) and on uncertainty analysis in scientific assessments (EFSA Scientific Committee, 2018a).
The draft scientific opinion underwent a public consultation from 12 October 2023 to 22 November 2023. The comments received were taken into account when finalising the scientific opinion and are presented and addressed in Annex F.
3. Assessment
3.1. Hazard identification and characterisation
3.1.1. Toxicokinetics and metabolic activation
3.1.1.1. Toxicokinetics and metabolic activation in experimental animals
3.1.1.1.1. Acyclic volatile N‐NAs
NDMA
Absorption, distribution, metabolism and excretion (ADME)
In vitro studies
The in vitro metabolism of NDMA has been extensively investigated mainly in rats using liver tissue subfractions (Kroeger‐Koepke et al., 1981b; Preussmann and Stewart, 1984; Chowdhury et al., 2012) and isolated hepatocytes (Encell et al., 1996). There is unanimous consensus that the α‐hydroxylation of the methyl group (oxidative N‐demethylation) is a critical metabolic step in the bioactivation of dialkylnitrosamines: the initial product of this reaction, α‐hydroxydimethylnitrosamine, is an unstable intermediate that spontaneously decomposes yielding formaldehyde, methyl diazohydroxide and/or the methyl diazonium ion (Mochizuki et al., 1979; Chowdhury et al., 2012; George et al., 2019) (Figure 1). Formaldehyde is subsequently oxidised to carbon dioxide or reduced to form methanol. Methyl diazonium ion is a highly reactive alkylating species. It methylates macromolecules including proteins and nucleic acids, playing a critical role in the initiation of carcinogenesis, and is generally considered too reactive to affect organs other than those in which it is generated (Pegg, 1980). A positive correlation between the rate of in vitro NDMA biotransformation and DNA alkylation has been demonstrated in rats (Yang et al., 1987).
Figure 1.
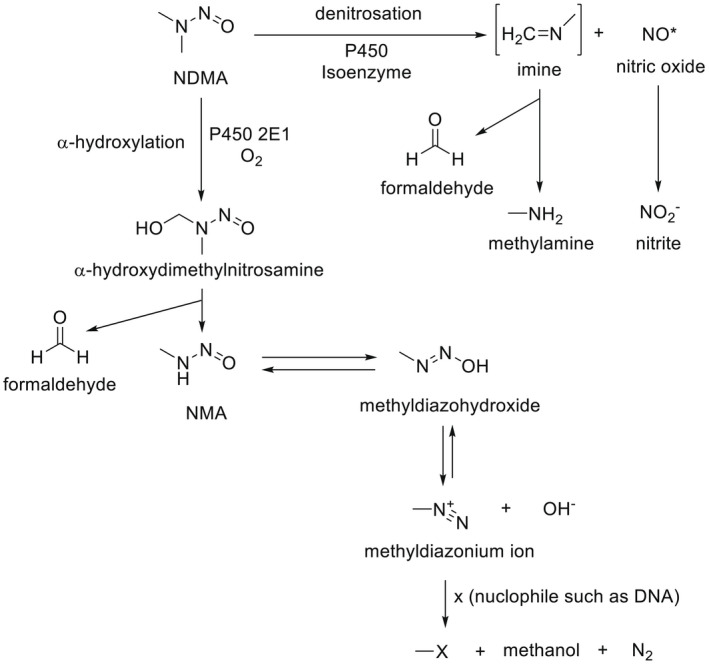
NDMA metabolic pathways (modified from ATDSR, 2000)
In rat (Tu and Yang, 1985; Levin et al., 1986) but also in rabbit (Sulc et al., 2004) and hamster (Yoo et al., 1987) liver preparations, the α‐hydroxylation of NDMA (e.g. the N‐demethylation at the C‐alpha) is mainly mediated by CYP2E1, while other CYP isoforms seem to play a minor role (Levin et al., 1986). At least two forms of NDMA‐N‐demethylases (NDMAd) have been isolated in rodent liver, showing different kinetic properties with respect to substrate concentrations; the high affinity form has a Km in the micromolar range, while the low affinity forms have a Km > 1 mM (Yoo et al., 1987). Age‐ and species‐related differences in oxidative NDMA metabolism have been reported. For example, liver microsomes from adult hamsters showed a threefold higher NDMAd activity than adult rats; this difference was halved when microsomes from weanling individuals of either species were compared (Yoo et al., 1987). These results are consistent with the higher ability of hamster liver preparations compared to rat in generating mutagenic metabolites to Salmonella test systems (Raineri et al., 1981).
Finally, the involvement of oxidative enzymes other than CYP in the bioactivation of NDMA was demonstrated by Stiborova et al. (1997) who measured the in vitro NDMA N‐demethylation rate in a reconstituted system including peroxidase and H2O2 (Km 3.12 ± 0.03 mM, Vmax 0.45 ± 0.04 nmol/min/nmol peroxidase). It is worth noting that peroxidases (such as prostaglandin H synthase and/or non‐specific peroxidases) can play an essential role in the bioactivation of pro‐carcinogenic chemicals in certain extrahepatic target tissues (i.e. urinary bladder, kidney, lung) that possess low CYP monooxygenase activity (for a review, see Vogel, 2000).
Another metabolic pathway occurring simultaneously with N‐demethylation (Schwarz et al., 1980; Lorr et al., 1982; Tu and Yang, 1985; Wade et al., 1987) is NDMA denitrosation. Although the underlying chemical pathways of denitrosation are still a matter of debate, the resulting cleavage of the N‐N bond ultimately yields formaldehyde, nitrite and methylamine (Keefer et al., 1987). It is generally accepted that this reaction is mainly catalysed by the same enzyme involved in NDMA‐demethylation (CYP2E1) (Yang et al., 1985; Chowdhury et al., 2012); in addition, denitrosation is considered to be a detoxification pathway since it competes with NDMA‐demethylation and diverts NDMA from being bioactivated to the methyl diazonium ion (Keefer et al., 1987). Using uninduced rat liver microsomes, it has been reported that the rate of denitrosation (measured as nitrite generation) is about 8–11% that of N‐demethylation (measured as formaldehyde release) (Lorr et al., 1982). An overview of the overall NDMA metabolic fate has been proposed (ATSDR, 2000).
No information on other phase I or phase II NDMA metabolites could be retrieved from further in vitro studies.
In vivo studies
Rats
Most of the available information is concerned with the metabolic fate and its relationship with the carcinogenicity of the N‐NA.
There is a wealth of data providing direct or indirect evidence to confirm that most of the postulated stable in vitro metabolites are also formed in vivo (reviewed by Pegg, 1980). Studies with [14C] NDMA are consistent with a complete NDMA metabolism to CO2 which is eliminated via the expired air (Heath, 1962). Metabolic denitrosation resulting in the formation of formaldehyde, methylamine and nitrate has been characterised in vivo. Heath and Dutton (1958) found methylamine in rats and mice urine as metabolic products. Streeter et al. (1990a,b) found methylamine in rat blood a few minutes after the i.v. bolus injection of 7.6 μmoles NDMA/kg and kinetic parameters of methylamine were calculated after a single i.v. or intragastric exposure to 8.36 or 13.5 μmoles NDMA/kg, respectively. To calculate the relative amount of methylamine formed, rats were treated with two NDMA doses (50 or 5 μg/min per kg at 1 mL/h, i.v. infusion) (Burak et al., 1991). Under steady‐state conditions, the systemic clearance of NDMA was found to be 34.8 ± 5.4 mL/min per kg bw, whereas that of methylamine amounted to 48.0 ± 7.4 mL/min per kg. The fraction of the dose of NDMA metabolised to MA was 29 ± 2%, thus accounting for a significant proportion of the administered NDMA dose.
Gomez et al. (1977) studied the oral absorption of [14C] NDMA. The experiment was conducted on female Wistar rats. Four individuals/time point were administered [14C] NDMA (2 mg/kg bw) by gavage and euthanised 15 min, 30 min, 1 h and 2 h later, respectively. The radioactivity was measured in gastric and intestinal content. Results are in line with a rapid absorption rate since already after 15 min only 2% of the administered dose remained. In a subsequent set of experiments, rats (four per dose) were treated (gavage) with a wide range of [14C] NDMA doses (from 0.001 to 10 mg/kg bw) and euthanised 4 h after dosing. The methylation (7‐methylguanine formation) rate of liver and kidney DNA samples was taken as a measure of the extent of liver first pass effect. Although the amount of methylation of liver DNA was directly proportional to the dose over a range of doses from 10 to 0.001 mg/kg bw, methylation of kidney DNA occurred only at the higher doses. For example, following an oral dose of 0.040 mg NDMA/kg bw, the alkylation of liver DNA was 75‐fold higher than that measured in the kidney. These results point to an almost complete hepatic extraction and metabolism of NDMA at low oral doses, preventing it from reaching the systemic circulation. Conversely, upon the administration of larger oral doses, hepatic biotransformation becomes saturated and the unmetabolised NDMA may distribute to extrahepatic organs with possible tumorigenic outcomes.
These conclusions were confirmed by subsequent experiments. Using female Wistar rats, Pegg and Perry (1981) found very rapid absorption (t1/2 < 3 min) of small oral doses of NDMA (< 100 μg/kg bw) occurring mainly in the small intestine, leading to an almost complete liver DNA alkylation (N7‐methylguanine formation) in as little as 15 min. The amount of 7‐methylguanine formed in kidney DNA following i.v. administration of NDMA was about 10 times less than that formed in liver DNA over a wide dose range (1–10 mg/kg). A similar ratio (liver: kidney DNA alkylation) was found after p.o. administration at relatively higher NDMA doses (5–10 mg/kg); however, rats exposed to doses of 1 mg/kg or below showed a much lower amount of 7‐methylguanine in the kidney, thereby in line with the capital role of the liver in trapping and bioactivating relatively low NDMA doses.
The kinetics and oral bioavailability of low NDMA doses were studied in male Fischer 344 rats by Mico et al. (1985). Following the i.v. dosing with 1.35 μmol NDMA (100 μg)/kg bw, blood concentrations declined in an apparently biexponential manner with a terminal half‐life of 10 min, a volume of distribution at steady state (Vdss) of 297 mL/kg and an apparent total systemic blood clearance of 39 mL/min/kg. Since this value is similar to the calculated hepatic blood flow in rats, the authors concluded that, under the adopted experimental conditions, the clearance of NDMA is limited by the delivery to the main eliminating organ (high hepatic extraction) rather than by liver enzyme activity. After the oral administration of 2.02 or 4.05 μmol NDMA (about 150 or 300 μg)/kg bw, the calculated areas under the curve (AUCs) were proportional to the dose, indicating linear kinetics. Under these conditions, the calculated bioavailability was quite low (about 8%), in line with a remarkable first‐pass effect by the liver.
In rats that were i.v. dosed with 0.2 mg/kg NDMA, the concentrations of unmetabolised NDMA in liver, spleen, kidney, lung and brain were approximately 70% of the arterial blood concentrations. There was a rapid decline in parallel with blood concentrations up to 4 h after exposure when non‐detectable levels were reached. This suggests that, in rats, these tissues do not accumulate NDMA (ATSDR, 2000).
Biliary excretion of NDMA was reported in rats exposed by i.p. injection (20 mg/kg) and accounted for 2.7–4.4% of the administered dose. The rate of biliary excretion was lowest in rats given a very low protein diet (3.4%) and highest in those given a high protein diet (64%) (Alaneme and Maduagwu 2004 as reported by ATSDR, 2000).
The excretion of NDMA was investigated in Portman albino rats both after a single oral dose of 50 mg/kg bw or following an i.v. injection of 500 mg/kg bw. Only small amounts of unchanged NDMA were recovered in the urine up to 24 h, the cumulative amounts excreted representing about 1.7% of the oral dose and 4.7–11% of the i.v. dose. During the same time, no NDMA was detected in faeces (Magee and Barnes, 1956).
Indirect evidence has been provided for the milk excretion of NDMA and/or metabolites in nursing rats (Chhabra et al., 2000). Sprague‐Dawley dams were administered by gavage 5 mg NDMA/kg bw on post‐natal days 1, 7 or 14, respectively; pups were euthanised 4 h after treatment and liver, lung, kidney and blood from the sucklings were analysed for O 6 ‐methylguanine (O 6 ‐Me‐Gua) ‐in DNA (another NDMA‐derived adduct). In agreement with a translactational NDMA delivery, O 6 ‐Me‐Gua adducts were found in liver, lung and kidney from sucklings. Interestingly, co‐treatment of the dams with one dose (1.6 g/kg) of ethanol (a CYP2E1 substrate and hence a competitive inhibitor of NDMA‐oxidative metabolism) caused in the newborns a small (by about 25%) decrease of O 6 ‐Me‐Gua adducts in liver but a sharp increase (4‐ to 10‐fold) of DNA methylation in lung and kidney. This reinforces the role of the liver in NDMA first‐pass effect and the involvement of extrahepatic organs in NDMA distribution and carcinogenicity in case of saturation/inhibition of its hepatic metabolism.
Mice
The disposition of NDMA after repeated exposure and the influence of ethanol co‐treatment were studied in outbred Swiss mice (Anderson et al., 1986). Animals were exposed to 0.5 or 50 mg NDMA/L via drinking water for up to 4 weeks and representative lots were sacrificed at week 1, 2 or 4. At kill, blood, liver, kidney, lung and brain samples were collected. After 4‐week administration, NDMA (limit of detection (LOD) 0.5 μg/L) was detected at low concentrations (1–4 μg/L) in blood and organs from 0.5 mg NDMA/L, while higher but dose‐unrelated amounts (6–65 μg/L) were found in mice exposed to 50 mg NDMA/L, indicating a lack of accumulation of NDMA. In the latter case, the concentrations were in the order blood > kidney > brain >> liver. The co‐administration of 10% ethanol caused an increase in blood and tissue levels of NDMA, reaching a factor of 10 or more and led to a partial alleviation of the hepatic lesions (centrilobular haemorrhage and necrosis) brought about by NDMA at 50 mg/L. These results are consistent with the competitive inhibition of the CYP2E1‐mediated biotransformation and metabolic activation of NDMA by ethanol. In a further study from the same research group (Anderson et al., 1994), in female Swiss mice i.v. treated with 1 or 5 mg NDMA/kg, the AUC values were proportional to the administered doses indicating that NDMA metabolism was not saturated by the treatments. Elimination was rapid and biphasic with MRTs of about 6 min, t1/2 α values of 3–4 min and clearances of 90–110 mL/min/kg. The calculated oral bioavailability (1 mg/kg dose) was 3.6%. Ethanol intragastric pretreatment caused a remarkable dose‐related increase in the AUC, MRTs, t1/2 α and a decrease in clearance by a factor of 10–30; blood, liver and lung NDMA concentrations increased accordingly. Data from this study confirm that factors limiting hepatic uptake and/or metabolism of NDMA (high dosages, inhibition of NDMA metabolising enzymes) will result in higher NDMA concentrations to reach the systemic circulation, increasing the risk of developing tumours in extrahepatic target tissues.
Pigs
A study was designed to determine the basic kinetic parameters, the oral bioavailability and the extent of plasma protein binding of NDMA in pigs (unspecified gender) (Gombar et al., 1988). Following a bolus i.v. administration of 0.1, 0.5 or 1.0 mg NDMA/kg bw, the concentration of NDMA in blood declined biphasically with a mean distribution half‐life of 7 min and a mean elimination half‐life of 28 min. The AUC increased roughly proportional with the dose, indicating first‐order toxicokinetics (TK) (and hence a constant clearance) over the tested dose range. The mean systemic clearance from blood was 65.8 mL/min/kg and the steady‐state Vd was 1.4 L/kg. Since no appreciable protein binding was found (blood/plasma ratio ~ 1), the measured Vd is consistent with a wide tissue distribution. After the oral exposure to 1.0 or 5.0 mg NDMA/kg bw, there was a rapid absorption with a mean Tmax at 23 min. When comparing the AUC and Cmax of the respective tested doses, it was noted that at the higher NDMA oral dose (5.0 mg NDMA/kg bw), the TK was not linear because the AUC and Cmax were not proportional to the administered dose. Even considering the lower oral tested dose (1.0 mg NDMA/kg bw), the calculated systemic bioavailability was still 67% meaning that liver metabolism may be easily saturated allowing a substantial proportion of NDMA to reach extrahepatic organs/tissues. Finally, a mean systemic clearance of 113 mL/min/kg was calculated for pigs treated with 1.0 mg NDMA/kg bw, which greatly exceeds the estimated blood flow in pigs (about 44 mL/min/kg, Boxenhaum (1980)). Taken together, the above results point to a substantial involvement of extrahepatic organs in NDMA metabolism in swine.
In a further study conducted in female pigs (Harrington et al., 1990), a rapid decline in blood NDMA was observed after the i.v. or intra‐arterial administration of 10 mg/kg bw, reaching almost undetectable levels 8 h post‐injection and pointing to a rapid distribution throughout the body. After the single oral administration of three different doses (10, 1 or 0.1 mg/kg bw), the portal and hepatic vein blood were collected and analysed for NDMA at different time points. Peak concentrations in both cases were reached very rapidly (1–0.5 h after treatment). The observed dose‐related decrease in the concentration of NDMA in hepatic vein blood (i.e. leaving the liver), reaching the lowest values at the lowest dose (0.1 mg/kg bw), is consistent with a significant liver first‐pass effect and hence metabolism of the N‐NA at low dosages. The occurrence of notable NDMA hepatic metabolism was confirmed by the presence of almost superimposable NDMA concentrations in portal and hepatic vein blood from animals dosed with known CYP2E1 substrates (and hence competitive inhibitors), namely halothane or ethanol. After the intra‐arterial administration, biliary excretion was demonstrated; concentrations in bile reached blood levels within an hour after injection and peaked (3–4 mg/kg as judged by eye from a graph) about 2 h after injection. Biliary levels of NDMA declined at approximately the same rate as blood levels. Urine samples were analysed for NDMA only in i.v. dosed animals and only trace levels (μg/L) were detected.
Dogs
The TK of NDMA was investigated in male Beagle dogs (N = 4 per treatment group) (Gombar et al., 1987). Animals were given 0.5 or 1.0 mg/kg NDMA i.v (bolus injection) and blood was collected at 50‐min intervals for up to 250 min; plasma protein binding was tested in vitro. Urine was collected for 24 h from dogs dosed with 0.5 mg/kg NDMA. A biphasic decline in blood NDMA concentration was noted after i.v. dosing, with a mean distribution half‐life of 19 min and a mean elimination half‐life of 73 min. The TK of NDMA in the studied dose range (0.5 or 1.0 mg/kg) appeared to be linear (first order) since in either case, the AUCs were roughly proportional. The Vdssss was 1.9 L/kg, and the mean residence time was 45 min. The systemic clearance from blood ranged from 33.9 to 52.9 mL/min/kg; since these values are similar or exceed the reported hepatic blood flow in the dog (~ 40 mL/min/kg) (Harrison and Gibaldi, 1977), it was suggested that the liver is not the only organ involved in the clearance of NDMA. In addition, no NDMA could be detected in urine (measured only after i.v. dosing) leading to the conclusion that the clearance of NDMA in the dog was entirely due to its metabolism. In a second set of studies, animals received one dose of 1.0 or 5.0 mg NDMA/kg per os. The plasma protein binding was negligible. The TK of the 1.0 mg/kg dose was first order (linear), but at the 5.0 mg/kg dose, the metabolism of NDMA was saturated, AUC and Cmax values not being proportional to the administered dose. For the lower dose, the mean Tmax was 20 min and the bioavailability averaged at 93%, pointing to a rapid and extensive absorption at the gastroenteric level along with poor hepatic metabolism. Overall, as previously reported for pigs, TK data are consistent with the substantial involvement of extrahepatic organs in the NDMA systemic clearance in the canine species.
Syrian hamsters
The TK after a single dose i.v. or oral of [14C] NDMA, as well as its in vitro protein binding and urinary excretion were studied in 8‐week‐old male Syrian golden hamsters (Streeter et al., 1990c). Following an i.v. bolus dose of 4.2 μmol/kg [14C] NDMA (about 0.3 mg/kg), both the unchanged compound and the total radioactivity were measured. A biphasic first‐order TK was observed with a mean terminal half‐life of 8.7 min for unchanged NDMA and 31.5 min for total radioactivity. The mean systemic blood clearance and Vdss for unchanged NDMA were 51 mL/min/kg and 582 mL/kg, respectively. Urine excretion was studied in separate experiments where animals received an i.v. bolus dose of 15 μmol/kg [14C] NDMA (about 1.1 mg/kg) and urine was collected. No unchanged NDMA was detected in the urine up to 72 h post‐dosing, suggesting that clearance of NDMA almost entirely occurs via hepatic metabolism. However, 31% of the total radioactivity was eliminated via urine, pointing to the partial biotransformation of the N‐NA to more polar metabolites. NDMA displayed negligible binding to hamster plasma protein. A dose of 38 μmol/kg [14C] NDMA (about 2.8 mg/kg) given by gavage indicated a systemic bioavailability of about 11% for unchanged NDMA, i.e. similar to that found in the rat (Streeter et al., 1990a). However, the estimated intrinsic hepatic clearance was 648 mL/min/kg, which is greater than that found in the rat (388 mL/min/kg) in a study from the same research group (Streeter et al., 1990b) and indicates a higher metabolic capacity of the hamster liver compared to rat liver. This is in line with the higher incidence of liver neoplasms in orally dosed hamsters when compared to rats, where lung and kidney tumours are also observed (Lijinsky et al., 1987).
The placental transfer of a single s.c. NDMA dose (12.5 mg/kg bw) was studied in pregnant Syrian hamsters at day 8, 10, 12 or 14 of gestation with groups of five to six animals (Althoff et al., 1977). After sacrifice, NDMA was measured in maternal blood, placenta, fetal tissues (unspecified) and amniotic fluid. Maximal concentrations (0.2–1 μg/g) occurred in all tissues about 1 h after injection, and only traces were found after 4 h. Maternal blood and placental levels were similar (around 1 μg/g) and significantly higher than the amounts determined in amniotic fluid and fetus, the latter showing the lowest NDMA levels (around 0.2 μg/g).
Patas monkeys
The single dose i.v. and oral NDMA TK were investigated in 2‐ to 4‐year‐old Patas monkeys (Erythrocebus patas) (Gombar et al., 1990). The bolus i.v. dosing with 0.5, 1.0 or 5.0 mg NDMA/kg resulted in a mono‐exponential decrease of blood concentrations. Since the AUC was roughly proportional to the dose (linear TK), the Cl, Vdss and MRT were dose‐unrelated and amounted to about 103 mL/min, 27 mL and 31 min, respectively. The mean half‐life of NDMA in blood was about 31 min. Following the oral administration of a 1.0 mg/kg dose, an average Cmax of 205 μg/L was reached after 25 min and was followed by a mono‐exponential decrease with an average half‐life of about 23 min. Assuming linear NDMA kinetics, under the adopted experimental conditions, the calculated oral bioavailability was estimated to be 49%.
In another study (Anderson et al., 1992), the excretion of NDMA was measured in urine samples collected for 7.5 h from monkeys given 1.0 mg/kg i.v. A maximum concentration of less than 50 μg/L was found, corresponding to less than 0.001% of the administered dose. The prior dosing (gavage or i.v.) with different amounts of other CYP2E1 substrates (ethanol or isopropyl alcohol) caused the maximum urinary concentration to rise 15‐ to 50‐fold and the percentage of the dose excreted from urine by 100‐ to 800‐fold.
Pregnant Patas monkeys were given a single i.g. dose (1.0 or 0.1 mg/kg) of NDMA at 147 ± 2 days of gestation (Chhabra et al., 1995). To study the distribution and the bioactivation ability of maternal and fetal tissues of NDMA, the authors determined the formation of DNA adducts (see below in DNA adduct formation) and in particular, O 6 ‐Me‐Gua adducts (as μmol O6‐Me‐Gua adduct/mol guanine). In the 1.0 mg/kg exposed monkeys, the highest average levels (27 μmol/mol guanine) of adduct concentrations found in placenta and fetal liver were 10–20% of those measured in maternal liver. Lower (< 1 μmol/mol guanine) but measurable adduct concentrations could be measured in amniotic fluid cells (0.75 μmol/mol guanine) and other fetal tissues in the order spleen, heart, adrenals followed by the fetal testes, brain cerebellum, skin, cord blood, fetal venous blood, female genital tract, lung and kidney. About a 10‐fold lower adduct concentration was found in dams exposed to the 0.1 mg/kg dose. Data from this study confirm the importance of the liver in the biotransformation/bioactivation of NDMA, along with a wide array of extrahepatic tissues. Results are also consistent with the transplacental passage of this N‐NA.
DNA adduct formation
As mentioned above, the initial and critical step for the carcinogenicity of NDMA is hydroxylation of the methyl group, catalysed mainly by CYP2E1 (Preussmann and Stewart, 1984). This process, known as α‐hydroxylation, is the common metabolic activation reaction for most dialkyl and cyclic N‐NAs (Figure 1). The initial product of this reaction in the case of NDMA is α‐hydroxydimethylnitrosamine, an unstable intermediate that spontaneously decomposes yielding formaldehyde and methyl diazohydroxide and/or the methyl diazonium ion (Mochizuki et al., 1979; Chowdhury et al., 2012). The methyldiazohydroxide/diazonium ion intermediates are highly reactive electrophiles which alkylate DNA, RNA and proteins; the other product of this reaction is molecular nitrogen (Kroeger‐Koepke et al., 1981a,b). These reactions, including DNA adduct formation, generally take place at the site where the intermediate methyldiazohydroxide is generated. Extensive studies in laboratory animals treated with NDMA have characterised the DNA adducts formed, which, after low oral doses, are found mainly in the liver. The same adducts have also been identified in the hepatic DNA of a human murdered by intentional poisoning with NDMA (Herron and Shank, 1980); see more details in Section 3.1.1.2.
A comprehensive examination of DNA adducts in the livers of rats treated with NDMA demonstrated that N7‐methylguanine (N7‐Me‐Gua) and O 6 ‐Me‐Gua (Figure 2) were the major adducts observed, in approximately a 10:1 ratio, 2 h after a dose of 10 mg/kg NDMA, given by i.p. injection. Considerably lower amounts of 3‐Me‐Gua, 3‐Me‐Ade, 7‐Me‐Ade, O 2 ‐Me‐Cyt, O 2 ‐Me‐Thy, O 6 ‐Me‐Thy, 3‐Me‐Thy, as well as methyl phosphate adducts were also observed (Den Engelse et al., 1986). Most studies have focused on 7‐Me‐Gua and O 6 ‐Me‐Gua in tissues of rats treated with NDMA. In one typical study, male F344 rats were treated with NDMA (0.055 mmol/kg) by s.c. injection and sacrificed 4 h later. Levels of 7‐Me‐Gua and O 6 ‐Me‐Gua in hepatic DNA averaged 1420 μmol/mol Gua and 170 μmol/mol Gua, respectively, while the corresponding amounts 24 h after injection were 680 μmol/mol Gua and 45 μmol/mol Gua (Hecht et al., 1986).
Figure 2.
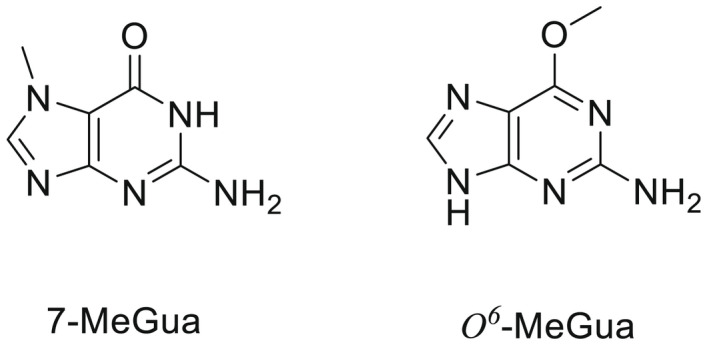
Structures of 7‐Me‐Gua and O 6 ‐Me‐Gua
While the initial levels of 7‐Me‐Gua and O 6 ‐Me‐Gua formed in tissues of rats treated with NDMA are typically about 10:1, reflecting the reactivity of the methyl diazonium ion with Gua in DNA, this ratio increases with time because O 6 ‐Me‐Gua is repaired by O6‐alkylguanine DNA alkyltransferase. This protein directly removes a methyl group (and other related alkyl groups) from the O 6 ‐position of Gua, restoring the Gua structure in DNA (Pegg, 2011). This unique protein acts only once and is degraded after the transfer of the methyl group. Therefore, AGT is very important in controlling levels of O 6 ‐alkylGua adducts and the resulting carcinogenicity of DNA alkylating agents such as NDMA.
O 6 ‐Me‐Gua has miscoding properties and is considered to be critical in carcinogenesis by NDMA and related methylating carcinogens. The miscoding properties were demonstrated by experiments in which the O 6 ‐Me‐Gua adduct was specifically and uniquely inserted into a strand of DNA, which was then replicated demonstrating G to A transition mutations (Delaney and Essigmann, 2008). The persistence of O 6 ‐Me‐Gua in DNA is critical in carcinogenesis by DNA methylating agents such as NDMA (Margison and Kleihues, 1975; Peterson, 2017).
In summary, in all tested species, NDMA appears to be rapidly and completely absorbed upon oral exposure. Wide species‐related differences in the systemic bioavailability via the oral route have been reported, with low values in rodents (up to 10%) (mice, rats and hamsters) and much higher values in Patas monkeys, pigs and Beagle dogs (range 49–93%). In the bloodstream, NDMA is essentially free, as no significant binding to plasma proteins has been demonstrated; it is distributed to all tissues with no tendency to accumulate. For hamsters and Patas monkeys, indirect evidence has been provided of NDMA transplacental passage and distribution to fetal tissues.
The clearance of NDMA from blood occurs primarily via metabolism. According to oral bioavailability data, hepatic extraction (first pass effect) is maximal in rodents and is expected to be less significant in Patas monkeys, pigs and dogs in which extrahepatic organs are believed to play a significant role in the NDMA metabolic fate. NDMA is metabolised by CYP2E1 and likely by other oxidases, to α‐hydroxydimethylnitrosamine, an unstable intermediate that spontaneously decomposes yielding formaldehyde, methyl diazohydroxide and/or the methyl diazonium ion, a highly reactive alkylating agent involved in the initiation of carcinogenesis. Denitrosation of NDMA, yielding formaldehyde and monomethylamine, has also been demonstrated; it is believed to be a competitive pathway also mediated by CYP2E1. NDMA metabolism is saturable by high dosages or the co‐exposure to other CYP2E1 substrates (e.g. ethanol, isopropyl alcohol, etc.); under these conditions, NDMA clearance is greatly reduced and a higher amount of the N‐NA escapes liver and may be distributed to extrahepatic organs.
Biliary and urinary excretion routes are of minor quantitative importance. Biliary excretion has been documented in rats and pigs. In the pigs, evidence has been provided of entero‐hepatic circulation. Small amounts of NDMA are excreted in urine, where metabolic products may be found. Among them, limited data in rats suggest that methylamine (a denitrosation product) may account for a significant amount of the orally administered dose (around 30%). There is limited indirect evidence of the milk excretion of NDMA and its metabolites.
The NDMA α‐hydroxylation, catalysed mainly by CYP2E1, produces unstable α‐hydroxydimethylnitrosamines which spontaneously decompose to methyldiazonium ions that react easily with DNA bases producing DNA adducts such as 7‐Me‐Gua and O 6‐Me‐Gua. The DNA repair enzyme O 6 ‐Me‐Gua‐DNA‐methyltransferase removes the O 6‐Me‐Gua adducts. If unrepaired, O 6‐Me‐Gua adducts cause miscoding to generate principally G > A transition mutations which can lead to the initiation of cancer.
NDEA
ADME
In vitro studies
A very limited number of in vitro studies have been performed with NDEA. It is acknowledged that the metabolic pathways are similar to those undergone by NDMA. The CYP‐mediated α‐hydroxylation generating the highly reactive ethyl diazonium ion (Figure 3), responsible for DNA ethylation, is considered the key bioactivating step.
Figure 3.
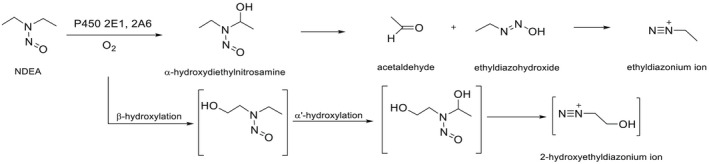
Metabolism of NDEA catalysed by CYPs
Metabolic products of this pathway include acetaldehyde as well as acetic acid and CO2 (not shown in Figure 3). Alternatively, ß‐hydroxylation and secondary α‐hydroxylation of NDEA may form, via several intermediates, 2‐hydroxymethyldiazonium. Denitrosation has been also reported with the ultimate generation of nitrite (Montesano and Magee, 1974; Camus et al., 1993; Chowdhury et al., 2012). Similar to NDMA, studies with rat liver microsomes point to a significant role for CYP2E1 in both NDEA de‐ethylation and denitrosation; CYP2E1 was found to be responsible for about half of the low Km (~40 μM) for NDEA‐deethylase activity in control liver microsomes and about two‐thirds of the same activity in microsomes from rats in which CYP2E1 was induced by acetone treatment (Yoo et al., 1990). In a comparative study concerning the metabolic fate of NDEA compared to NDMA, the NDEA N‐deethylation rate was slightly decreased (−15%) in ethanol‐induced microsomes and increased eightfold in phenobarbital‐induced microsomes, also pointing to a significant role for CYP2B and possibly other phenobarbital‐inducible CYPs in CYP‐mediated NDEA metabolism (Gorsky and Hollenberg, 1989). By contrast, the rate of NDMA N‐demethylation was found to be greatly increased (+90%) in microsomes from ethanol‐pre‐treated rats but slightly decreased (−10%) in microsomes from phenobarbital‐pre‐treated rats. These results are in line with previous findings of Longo et al. (1986) who found increased NDEA N‐deethylase activity in liver microsomes from phenobarbital induced‐rats and hamsters. In another study, a CYP2A‐5 antibody was able to inhibit NDEA N‐deethylase (measured as acetaldehyde production) up to 40% in liver microsomes from control mice and up to 90% in pyrazole‐ (a CYP2A inducer) treated mice (Camus et al., 1993).
Tissue‐ and species‐related differences in the rate of NDEA bioactivation have been reported (Montesano and Magee, 1974). A study was designed to compare the rate of NDEA bioactivation (acetaldehyde production) in liver and nasal mucosa microsomes from rats and Syrian golden hamsters (Longo et al., 1986). A higher Vmax and a lower Km were found in hamster vs. rat preparations, with striking differences (about ninefold higher Vmax) concerning nasal mucosa microsomes. These results are consistent with the particular sensitivity of NDEA‐exposed hamsters in developing tumours in the respiratory tract, and notably in nasal cavity and trachea, irrespective of the administration routes (IARC, 1978).
Mouse tissue slices were incubated with 2.5 μM [14C] NDEA for 60 min and radioactivity incorporated in the acid‐insoluble tissue precipitates was determined and taken as index of tissue‐specific NDEA bioactivation. The amount of measured radioactivity was in the order sublingual gland > lacrimal gland > oesophagus >> liver, pointing to the ability of several extrahepatic tissues in bioactivating NDEA. The expression of NDEA metabolising CYPs has been reported as a major determinant of the development of tumours in certain tissues. For example, Ribeiro Pinto et al. (2001) found that CYP2E1 was exclusively expressed in liver, while CYP2A3 was only found in the oesophagus; the Km for NDEA N‐deethylase in oesophageal microsomes was about one‐third of that calculated in liver microsomes (Ribeiro Pinto et al., 2001) and similar results were obtained using tissue slices (Ribeiro Pinto, 2000). Results from these studies suggest that in rat oesophagus, CYP2A3 is mainly responsible for NDEA bioactivation and may induce tumour formation even at low doses.
It is acknowledged that the first‐pass clearance of N‐NAs in liver, which is particularly high in rodents, is one of the most important factors affecting their oral bioavailability (Okada, 1984). In a comparative study (Graves and Swann, 1993), rat livers were perfused with NDMA, or NDEA and the rate of liver uptake was measured as the difference between the N‐NA concentrations in the blood entering and leaving the liver, respectively. At 5 μM, about 80% of NDMA was removed (metabolised) by the liver, while the maximum clearance for NDEA was 50% with a slight increase to 60% at extremely low concentrations (0.05 μM); the Km for NDMA clearance was calculated as 2.3 μM and the maximum rate for uptake was about 11 nmol/min/g liver while the values for NDEA were 10.6 μM and about 9 nmol/min/g liver, respectively. It was concluded that, especially at low concentrations, hepatic clearance of NDEA is lower than that of NDMA, and therefore, a comparatively higher amount of NDEA is expected to enter the systemic circulation and be distributed to tissues.
In vivo studies
Scant information is available concerning the fate of NDEA in experimental species.
A study was conducted in lactating goats orally exposed to single NDEA doses (unspecified breed, weight range 32–47 kg) (Juszkiewicz and Kowalski, 1974). The administration of 20 mg NDEA/kg bw resulted in measurable amounts of NDEA in blood as early as half an hour post‐dosing, reaching a peak (5.2 mg NDEA/kg) at 1 h; 12 h after administration, 0.3 mg NDEA/kg could be still recovered. When goats were administered with increasing NDEA amounts (1.0, 2.5, 5.0, 10.0, 20.0, 30.0 mg/kg bw, respectively), measured NDEA blood levels at 1 h (peak) were not proportional to the administered dose; e.g. 0.01, 0.72 and 5.3 mg NDEA/kg were found in animals, respectively, dosed with 1.0, 5.0 and 20.0 mg/kg bw. These results point to a dose‐related saturation of the metabolic (presumably hepatic) clearance as previously reported for NDMA in rodents. Milk excretion was also investigated in the same study. After the exposure to 30 mg NDEA/kg bw, NDEA concentrations (4.9 mg/kg) were already detectable after 0.5 h and peaked at 4 h (14.7 mg/kg); 0.008 mg/kg were detected after 24 h and traces could still be recovered 36 h after treatment.
Rajewsky and Dauber (1970) investigated the tissue distribution, plasma protein binding and urine excretion of diethyl‐(mono‐2[3H])‐nitrosamine (3H‐NDEA) in adult male rats after the administration of a single oral dose (16 mg/kg bw). The tissue‐specific concentrations of 3H‐NDEA were monitored up to 240 h. There was a very rapid decrease in the first 8 h and a much slower fall for the remaining time, reflecting the binding of 3H to cell components with a slower turnover. At 240 h, measured tissue radioactivity was maximal in liver, followed by kidney (74% of liver radioactivity), spleen (40%), small intestine (18%) and lung (14%). Only 0.3% of the radioactivity was associated with plasma proteins, mainly with alpha‐globulins. The 3H‐NDEA excretion amounted to 6% and 25% in urine collected for 4 and 24 h, respectively.
The NDEA tissue distribution was examined with the autoradiography technique in mice injected intravenously with [14C] NDEA (2.2 uCi; 0.8 mg/kg) (Brittebo et al., 1981a). A homogeneous distribution of the volatile radioactivity was found in the autoradiograms from mice euthanised 1 and 5 min after dosing, indicating the ability of the unmetabolised molecule to freely pass across biological membranes and be distributed to most tissues. At the same time, however, a strong, non‐volatile radioactivity (expression of NDEA formation of reactive metabolites) was found in the mucosa of the nose and trachea, the respiratory tract, the oesophagus, the tongue, the forestomach, as well as in liver and in the kidney cortex. In autoradiograms from mice euthanised after 30 min, radioactivity was also present in gall and urinary bladders as well as in tissues with high metabolic turnover (exocrine pancreas, gastrointestinal tract, bone marrow). In the same study, pretreatment with the CYP2E1 inhibitor diethyldithiocarbamate (DDEC) was expected to reduce the extent of NDEA biotransformation; accordingly, a twofold increase in serum total radioactivity and a fourfold (lung) or threefold (liver) decrease in tissue radioactivity was detected in DDEC‐pretreated mice euthanised 15 min after NDEA administration.
Nursing female rats were dosed once (gastric tube) with 40 mg NDEA (130 mg NDEA/kg bw) and returned to the litter 30 min after dosing. After 2, 4, 6 or 49 h, five pups per time point were sacrificed and the gastric content (clotted milk) removed and analysed for NDEA; the corresponding amounts were 5, 15 and 36 mg/L, respectively, while less than 1 mg/L (LOD) was found after 49 h (Schoental et al., 1974). In a parallel experiment in which nursing rats were dosed several times with NDEA (130 mg/kg bw), pups developed tumours in their later life (Schoental et al., 1974).
Pregnant (14 days of gestation) Syrian hamsters were treated s.c. with 100 mg/kg bw NDEA (Althoff et al., 1977). Animals were then sacrificed, and the blood, amniotic fluid, placental and fetal tissues (unspecified) of three hamsters per interval (from 0.25 to 5 h) were collected and analysed for NDEA (GLC method). Peak levels (around 5 μg/kg) in fluids, placental and fetal tissues were reached after 0.5 h and then rapidly declined with trace concentrations (around 0.2 μg/kg) still detectable after 5 h.
NMRI female mice were injected i.v. with [14C] NDEA at day 12, 14, 16 and 18 of pregnancy and euthanised after 2 or 30 min (Brittebo et al., 1981b). A transplacental passage of the volatile (non‐metabolised) [14C] NDEA could be demonstrated on all the studied days of gestation to most fetal tissues with an even distribution. Tissue‐bound radioactivity (expression of NDEA bioactivation) was present in fetuses of days 18 of gestation but not in earlier stages of pregnancy, particularly in lung (bronchial tree) and liver, which are known targets of NDEA transplacental carcinogenesis in mice. These results highlight the importance of the time‐related development of metabolic competence of fetal tissues to bioactivate procarcinogens.
DNA‐adduct formation
The major observed pathway in the metabolism of NDEA is α‐hydroxylation, leading to the formation of the ethyl diazonium ion, a powerful DNA ethylating species and acetaldehyde, as indicated in Figure 3.
Consequently, ethylation of DNA is observed in laboratory animals treated with NDEA. The overall pattern of DNA ethylation is very similar to that observed with NDMA, but N7‐Et‐Gua, O 6 ‐Et‐Gua and O 4 ‐Et‐Thy (Figure 4) are among the most abundant adducts and have been studied in the most detail. In the case of ß‐hydroxylation and a secondary α‐hydroxylation of NDEA, the generated 2‐hydroxymethyldiazonium may form adducts such as N7‐HOEt‐Gua. Further details on the adducts so far characterised are reported in Li and Hecht (2022). Chronic treatment of rats with NDEA led to accumulation in liver or oesophagus of O 6 ‐Et‐Gua and O 4 ‐Et‐Thy, which are believed to be important in carcinogenesis by NDEA (Verna et al., 1996).
Figure 4.
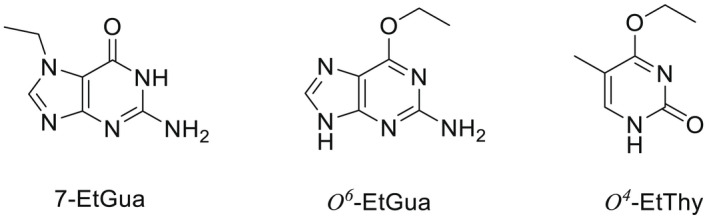
Structures of N7‐Et‐Gua, O 6 ‐Et‐Gua and O 4 ‐Et‐Thy
In summary, based on a limited data set, NDEA appears to follow the main metabolic routes similar to those undergone by NDMA, i.e. an oxidative bioactivation yielding the highly reactive ethyldiazonium ion capable of alkylating DNA, followed by a denitrosation route which is very likely representing a detoxification pathway. According to in vitro studies, not only CYP2E1 but also other CYPs like CYP2B and CYP2A are involved in NDEA bioactivation in liver and in extrahepatic organs/tissues (e.g. respiratory tract, oesophagus), with reported tissue‐ and species‐related differences in their catalytic efficiency. Studies with perfused rat livers indicate that hepatic NDEA extraction would be lower than that displayed for NDMA under comparable conditions.
According to the few available studies, oral NDEA seems to be rapidly and extensively absorbed and distributed to liver and extrahepatic tissues, with very limited plasma protein binding. In experiments with labelled NDEA, after a first phase of rapid decrease, tissue radioactivity declined more slowly, likely reflecting tissue bioactivation and DNA alkylation. In a rat experiment, 25% NDEA‐related radioactivity was excreted in the urine in the 24 h following an oral dose, and indirect evidence of biliary excretion has been provided in mice.
Milk transfer has been well documented in goats and rats and transplacental passage has been demonstrated in rodents.
Similar to NDMA, α‐hydroxylation is the metabolic pathway leading to the formation of the ethyl diazonium ion that reacts easily with DNA bases producing DNA adducts such as N7‐Et‐Gua, O 6‐Et‐Gua and O 4 ‐Et‐Thy which are related to the initiation of cancer.
NMEA
ADME
The CYP‐dependent oxidative dealkylation of NMEA was studied in rat liver microsomes and measured as the amount of the released formaldehyde and acetaldehyde; the employed preparations were found to efficiently perform both N‐demethylation and N‐deethylation, the latter with a higher catalytic efficiency (4.7 nmol CH3CHO/min/mg protein vs. 2.5 nmol HCHO/min/mg protein) (Chau et al., 1978). Both reactions are thought to be involved in the bioactivation of the N‐NA leading to the generation of the alkylating intermediates (von Hofe et al., 1986a). After NMEA N‐deethylation, the formation of N‐nitrosomethyl(2‐hydroxyethyl)amine (NMHA) has been postulated (Streeter et al., 1990a).
In a study performed with purified rabbit liver CYPs, the ethanol‐inducible isoform (LM3a, likely corresponding to CYP2E) was the most active one in bringing about either NMEA N‐demethylation (measured as the rate of HCHO generation) or NMEA‐denitrosation (nitrite generation) (Yang et al., 1985).
The single‐dose toxicokinetics of [14C] NMEA were studied in 8‐week‐old male Fischer 344 rats (Streeter et al., 1990a). Both unchanged NMEA and total radioactivity were measured. The i.v. bolus dose of 0.6 μmol/kg resulted in a biphasic first‐order elimination of the unchanged NMEA with a distribution (α‐phase) of 1.23 min−1 and an elimination (β‐phase) of 0.07 min−1. The AUC value was 16.4 nmol/min/ml, MRT was 12.8 min, Vdss was 496 mL/kg and systemic clearance was 40 mL/min/kg. When comparing data obtained for total blood radioactivity, it was noted that while values for the α‐phase were superimposable, those of elimination (β‐phase) were much greater. This indicated that NDEA was removed from the systemic circulation at a much higher rate than total radioactivity, pointing to an extensive NMEA conversion to more polar metabolites. Of note, the administration of a single large dose (27.5 μmol/kg) by gavage resulted in three distinct exponential phases for the unchanged compound, with an α, ß and γ phases amounting to 0.09, 0.02 and 0.58 min−1 respectively; MRT was 40.9 min and Vdss was not calculated. The comparison of AUC after oral and i.v. administration allowed to estimate the systemic NDEA bioavailability to be around 25%, indicating a remarkable first pass effect. Plasma protein binding was negligible. The renal excretion was investigated after a single i.v. treatment (4.16 μmol/kg). A total of 16.7% total radioactivity was detected in urine samples collected over 72 h with no measurable amount of unchanged NDEA. No measurable blood or urine levels of NMHA could be detected. Finally, no significant differences in any of the measured kinetic parameters were found when similar doses of ß‐deuterated NMEA were used; this form has been reported to cause a remarkable increase in the adduct formation in rat oesophagus with respect to non‐deuterated NDEA (Lijinsky et al., 1982).
No information on tissue distribution, transplacental passage and mammary excretion were retrieved.
DNA‐adduct formation
The two α‐hydroxylation pathways of NMEA bioactivation are shown in Figure 5 (Li and Hecht, 2022): α‐hydroxylation on the methyl group generates the ethyldiazonium ion and formaldehyde, whereas α‐hydroxylation on the ethyl group gives rise to the methyldiazonium ion and acetaldehyde. Both diazonium ions may alkylate DNA. N7‐Me‐Gua, N7‐Et‐Gua, O 6 ‐Me‐Gua and O 6 ‐Et‐Gua were the most abundant adducts while N3‐Et‐Gua, N3‐Et‐Ade and N7‐Et‐Ade were identified as minor products (von Hofe et al., 1986b).
Figure 5.
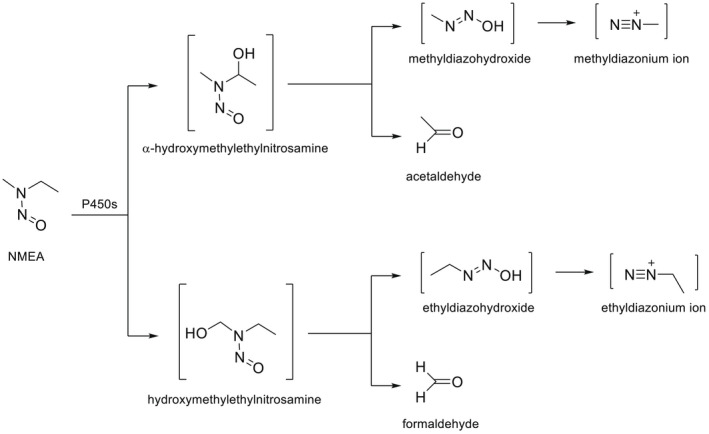
NMEA metabolic activation
When rats were treated with a single i.p. injection of NMEA, N7‐Me‐Gua and N7‐Et‐Gua were found in the DNA of liver, kidney and oesophagus, while O 6 ‐Me‐Gua occurred only in the liver and kidneys (von Hofe et al., 1991). N7‐Me‐Gua occurred at the highest concentration in the liver, followed by the kidneys (15‐fold lower), oesophagus (100‐fold lower) and lung (200‐fold lower) (von Hofe et al., 1986a). In hepatic DNA, the levels of N7‐Me‐Gua exceeded N7‐Et‐Gua by 170–200 times suggesting that DNA‐methylating events predominated in this organ (von Hofe et al., 1986a). This is in contradiction to the high catalytic efficiency of the N‐deethylating pathway, reported above.
In summary, few data are available concerning the fate of NMEA in experimental animals. Both N‐demethylation and N‐deethylation have been demonstrated in rat liver preparations and are reported to represent the key bioactivation pathways; N‐deethylation is seemingly prevalent over N‐demethylation. An ethanol inducible CYP isoform (presumably CYP2E1) has been reported as the most efficient one in catalysing both NMEA N‐demethylation and denitrosation in rabbit liver microsomes. In the only study addressing the in vivo kinetics, NMEA was found to rapidly disappear from the systemic circulation likely due to an extensive metabolism; an oral bioavailability of ~ 25% could be calculated, pointing to a remarkable first pass effect. Accordingly, no unchanged NMEA but only radioactivity pertaining to metabolites could be detected in the 72h urine samples of rats dosed once with labelled NMEA.
No information on the identity of metabolites, tissue distribution, transplacental passage and mammary excretion were retrieved.
Bioactivation (α‐hydroxylation) may occur at the methyl‐ or ethyl‐group of NMEA. Application of NMEA to rats generated N7‐Me‐Gua and N7‐Et‐Gua in the DNA of liver, kidney and oesophagus and O 6 ‐Me‐Gua in the liver and kidney. In the liver, N7‐Me‐Gua was predominant and exceeded N7‐Et‐Gua by 170–200 times.
NDPA
ADME
In vitro studies
A limited number of in vitro studies performed in rodents indicate that the metabolic pathways are similar to those undergone by other N‐nitrosodialkylamines (Figure 6). Accordingly, the α‐carbon hydroxylation is considered the primary pathway. The cleavage of the C‐N bond gives rise to propionaldehyde as well as 1‐propanol and 2‐propanol as metabolites; both 1‐propanol and 2‐propanol are generated through an unstable, highly reactive propyl cation (carbonium ion), which is thought to react with nucleic acids forming propylated DNA adducts. Further hydroxylation reactions also involve the ß‐ and the γ‐carbons. Besides the production of the metabolites resulting from the α‐carbon hydroxylation, the incubation of NDPA 0.28 mM with rat liver microsomes yielded N‐nitroso‐2‐hydroxypropylpropylamine (N2HPPA) at levels of only 15% of α‐oxidation (Park and Archer, 1978). Subsequent research also pointed to the formation of a further oxidised metabolite, N‐nitroso‐2‐oxo‐propylpropylamine (N2OPPA). Both N2HPPA and N2OPPA are potent liver carcinogens in rat and mouse (Althoff et al., 1974 as cited in Teiber et al., 2001), as a likely consequence of the generation of an alkylating derivative from the CYP‐mediated α‐hydroxylation of N2OPPA (Leung and Archer, 1985; Teiber et al., 2001)
Figure 6.
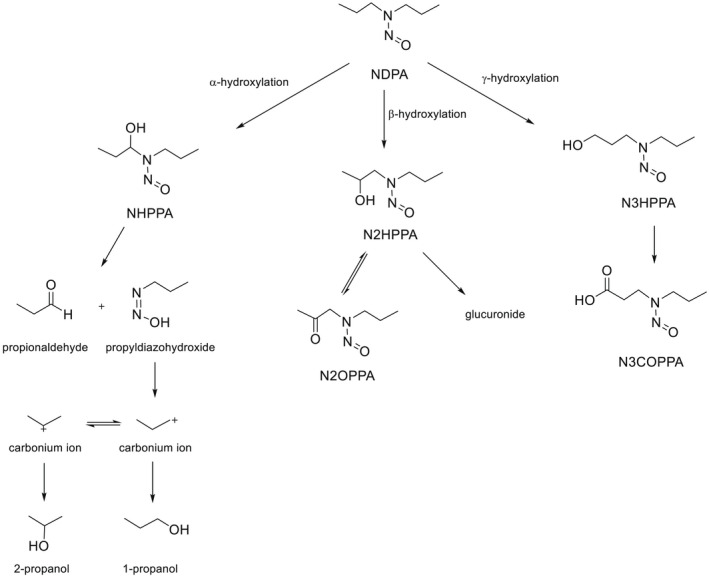
Metabolism of NDPA (modified ATDSR, 2019)
Studies with rat liver hepatocytes (Bauman et al., 1985) showed that the glucuronide of N2HPPA is the main metabolic product of NDPA ß‐hydroxylation; little amounts of the γ‐carbon hydroxylation derivatives N‐nitroso‐3‐hydroxypropylpropylamine and its oxidated product N‐nitrosopropyl(carboxyethyl) amine were also detected. In that study, α‐carbon hydroxylation derivatives were not detected possibly due to the low sensitivity of the analytical techniques.
Shu and Hollenberg (1996) investigated the involvement of different CYPs in the oxidative NDPA metabolism using liver microsomes from rats treated with different inducers (phenobarbital (PB), pyrazole, beta‐naphthoflavone, BHT, BHA or clofibrate). The CYP‐mediated NDPA oxidation was assayed by measuring the extent of the released propionaldehyde, a product of the α‐carbon hydroxylation pathway. As compared to uninduced rats, the lowest Km was detected upon the incubation with microsomes from PYR‐treated rats, while considerable increase in Vmax occurred with preparations from either PB‐ or PYR‐induced rats. Further assays with reconstituted systems containing purified rat CYP2B1 or rabbit CYP2E1, or monoclonal antibodies specific for rat CYP2B1 or CYP2E1 further confirm the major role played by CYP2B1 and CYP2E1 in NDPA α‐carbon hydroxylation. More studies performed with rat liver preparations indicated that both CYPs participate in the oxidation of N2HPPA to N2OPPA (see above), while the formation of alkylated‐DNA adducts was demonstrated in CYP2E1‐transfected T5 cells incubated with N2OPPA (Teiber et al., 2001).
In vivo studies
No studies investigating TK parameters were retrieved. Information about NDPA oral bioavailability in rodents was inferred from urine analysis of exposed animals (see below). No specific reports on NDPA tissue distribution were located. The placental transfer of a single s.c. NDPA dose (100 mg/kg bw) was studied in pregnant Syrian hamsters at day 8, 10, 12 or 14 of gestation (5–6 animals/group) (Althoff et al., 1977). After sacrifice, NDPA was measured in maternal blood, placenta, fetal tissues (unspecified) and amniotic fluid showing maximal levels for maternal blood (about 1 μg/g) and amniotic fluid (about 9 μg/g), at 45 and 90 min, respectively, after s.c. injection. The placenta and fetus had the highest NDPA concentrations at 90 min (range 8–9 μg/g); NDPA was no longer detectable 4 h after treatment.
The urinary excretion of NDPA and its metabolites was investigated in a few studies. Sprague‐Dawley rats were i.p. administered with 77 mg NDPA/kg bw and urine was collected over 24 h. Only 0.08% of the administered dose was recovered as the unchanged compound; after ß‐glucuronidase urine treatment, N2HPPA (a ß‐hydroxylation product, see above) amounted to about 5% while only traces of its oxidated derivative NOPPA could be detected (Leung and Archer, 1981). In a further report (Suzuki and Okada, 1981), male Wistar rats were i.g. dosed with NDPA (on average 125 mg/animal) and urine was collected over 48 h. The lack of unchanged NDPA suggested an extensive metabolism. The major pathway was the oxidation of one propyl chain yielding N‐nitroso‐3‐oxopropylpropylamine (N3OPPA), amounting to 5% of the administered dose; the obligatory intermediary metabolite N3HPPA was not detected. Other minor oxidation products were N2HPPA glucuronide and nitrosopropyl(carboxyethyl) amine.
Syrian hamsters (14 days of pregnancy) were treated s.c. with 100 mg/kg bw NDPA (Althoff et al., 1977). After sacrifice, the blood, amniotic fluid, placental and fetal tissues (unspecified) of three hamsters per interval (from 0.25 to 4–6 h) were collected and analysed for NDPA (GLC method). The placenta and fetus showed the highest NDPA concentrations at 90 min, and at this time, similar high levels were seen in maternal blood and amniotic fluid (around 8–10 μg/g); NDPA was not detected 4 h after dosing. The transplacental passage resulted in the development of a variety of tumours in the F1 generation (Section 3.1.2.6.1).
No information on milk excretion of NDPA or its metabolites was available.
DNA adduct formation
Information on NDPA‐DNA adducts is limited. In cultured primary rat hepatocytes, alkylation of DNA by [α14C]NDPA has been clearly proven (Shu and Hollenberg, 1997). N7‐Me‐Gua and N7‐(n‐propyl)guanine (N7‐n‐Pr‐Gua) were detected in the hepatic RNA of rats treated with [14C]NDPA. This provides evidence that both, the α‐ and β‐hydroxylation pathway, are involved in the metabolic activation of NDPA (Krüger, 1971, 1973; Krüger and Bertram, 1973; Li and Hecht, 2022).
Some studies reported on adduct formation by NDPA analogues. [3H]N‐nitroso‐bis(2‐hydroxypropyl)amine formed methyl and hydroxypropyl DNA adducts in rat and hamster tissues with highest concentrations in the liver; the following DNA adducts were identified: N7‐Me‐Gua, O 6 ‐Me‐Gua, N7‐(2‐hydroxypropyl)guanine, O 6 ‐(2‐hydroxypropyl)guanine and O 6 ‐(1‐methyl‐2‐hydroxyethyl)guanine (Figure 7) (Li and Hecht, 2022; Krüger 1973). Further NDPA analogues were studied in rats and hamsters. N‐nitroso‐bis(2‐oxopropyl)amine generated N7‐Me‐Gua and O 6 ‐Me‐Gua and N‐nitroso‐bis(2‐oxopropyl)amine and N‐nitroso‐(2‐hydroxypropyl)‐(2‐oxopropylamine) produced N7‐2‐hydroxypropylguanine (Kokkinakis, 1990, 1991).
Figure 7.
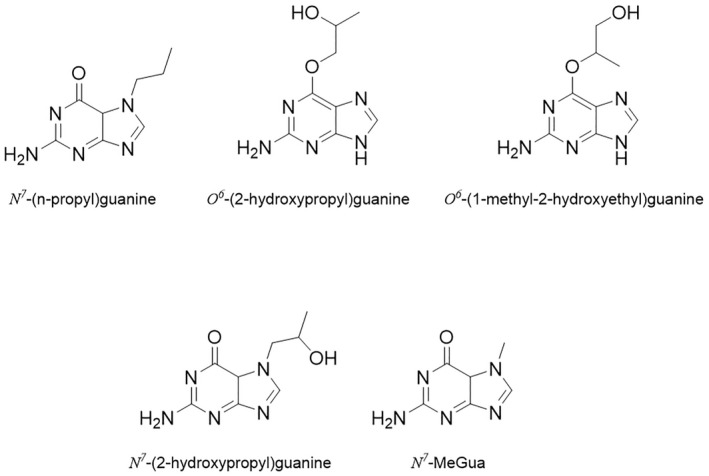
Structures of propyl/hydroxypropyl DNA adducts
In summary, according to a limited number of in vitro studies, it may be concluded that NDPA undergoes CYP‐mediated oxidations at the α‐, β‐ and γ‐carbons. In common with other NAs, the α‐hydroxylation pathway, ultimately yielding propionaldehyde and other compounds, is the main bioactivation route generating DNA alkylating species. The oxidation at the β‐carbon produces, among other compounds, both N2HPPA and its oxidised derivative N2OPPA, which are known liver carcinogens in rats and mice. Both CYP2B and CYP2E1 subfamilies seem to catalyse NDPA oxidations at α‐and β‐carbons. In rats exposed to a single oral dose, no unchanged NDPA was detected in the 48‐h urine, suggesting an extensive metabolism; N2HPPA was present in urine as a glucuronide. The transplacental passage has been documented while no studies on milk excretion could be retrieved.
The α‐ and the β‐hydroxylation pathways are involved in the metabolic activation of NDPA. Several methyl and hydroxypropyl DNA adducts were characterised. In rodents, the highest DNA adduct levels were found in the liver.
NMBA
ADME
No relevant information was retrieved on the absorption, distribution and excretion of NMBA.
Metabolic activation and DNA adduct formation
Rat liver microsomes were found to catalyse the N‐demethylation of NMBA; the catalytic efficiency was markedly increased with liver preparations from fasted rats (Tu and Yang, 1983). Denitrosation has been also reported (Lorr et al., 1982). In common with other N‐nitrosodialkylamines, NMBA is thought to be activated via a CYP‐mediated a‐hydroxylation yielding the ultimate mutagens alkyldiazonium ions; NMBA mutagenic derivatives were also generated in S. Typhimurium TA1535 and E. coli WP2 uvrA substituting rat liver S‐9 with Fe2+–Cu2+–H2O2 (Tsutsumi et al., 2010). In rat liver microsomal preparations, CYP2B6, 2C9, 2C19 and 2E1 were efficient catalysts of NMBA α‐hydroxylation based on the generated amounts of formaldehyde and butyraldehyde (Bellec et al., 1996).
Treatment of rats with a single oral dose of 0.1 mmol/kg NMBA of NMBA produced 7‐Me‐Gua and O 6 ‐Me‐Gua predominantly in liver, followed by oesophagus, lung and kidney. Compared with related methyl alkyl N‐NAs, relatively high levels of adducts were found in oesophagus, which is consistent with the carcinogenicity of NMBA in this tissue (von Hofe et al., 1987).
NMVA
ADME
No relevant information was retrieved on the absorption, distribution and excretion of NMVA.
Metabolic activation and DNA‐adduct formation
Chemical oxidation of NMVA with dimethyldioxirane or m‐chloroperbenzoic acid produced the potential metabolite 1‐nitrosomethylaminooxirane which was unstable, with a t1/2 of less than 5 s at 25°C and pH 7.4 (Okazaki et al., 1993). This unstable epoxide reacted with DNA to yield 7‐(2‐oxoethyl)Gua, N 2 ,3‐etheno‐Gua, 1,N 6 ‐etheno‐dAdo and 7‐Me‐Gua (Figure 8). Formaldehyde was observed as a product of the in vitro metabolism of NMVA, and when DNA was included in the incubations, 7‐Me‐Gua and 1,N 6 ‐etheno‐dAdo were isolated.
Figure 8.
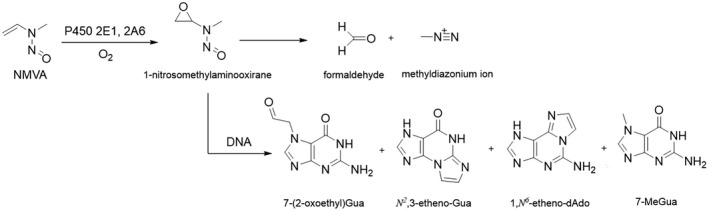
Formation and decomposition of 1‐nitrosomethylaminooxirane from NMVA, and formation of DNA adducts
No relevant data on the ADME and DNA adduct formation was available for NDIPA or NEIPA.
3.1.1.1.2. Acyclic non‐volatile N‐NAs
NDBA
ADME
In vitro studies
The metabolic fate of NDBA in rodent liver preparations was reviewed by Okada (1984). Similar to other N‐nitrosodialkylamines, the α‐hydroxylation pathway yields aldehyde and alcohol derivatives and is involved in the generation of unstable reactive diazonium ions (see Figure 9 below), i.e. the ultimate DNA‐ and protein alkylating species, which in the rat have been linked to liver cancer. The rate of NDBA N‐debutylation with formation of butyraldehyde is thought to represent a probe for α‐hydroxylation (Shu and Hollenberg, 1996). The remaining carbons of alkyl groups from β‐ to ω‐position can also be hydroxylated giving rise to 2‐(β), 3(ω‐1)‐ or 4(ω)‐hydroxylated derivatives; the last two are referred to as N‐nitroso‐3‐hydroxybutyl‐butylamine (3‐OH‐NDBA) and N‐nitroso‐4‐hydroxybutyl‐butylamine (4‐OH‐NDBA), respectively (Bellec et al., 1996; Shu and Hollenberg, 1996). Convincing evidence has been provided that oxidation of the terminal C‐atom (ω) generating 4‐OH‐NDBA is a prerequisite for induction of urinary bladder cancer in the rat (Gottfried‐Anacker et al., 1985; Richter et al., 1988); the hydroxylation at the ω‐1 carbon, instead, is considered a detoxification pathway (Richter et al., 1988; Huang et al., 1993). All the hydroxylated metabolites may then undergo glucuronidation (Okada, 1984).
Figure 9.
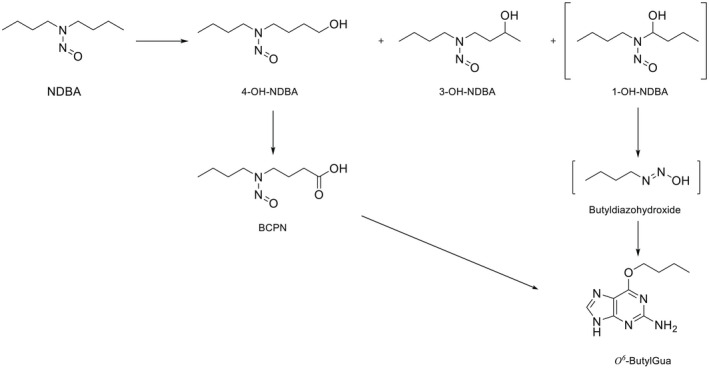
Metabolism of NDBA and formation of O 6 ‐butylGua in DNA
A further key metabolic step involving 4‐OH‐NDBA is represented by the two‐step oxidation of the ‐OH group, which is likely mediated by cytosolic alcohol‐ and aldehyde dehydrogenases (Shu and Hollenberg, 1996). This leads first to the formation of an aldehyde‐derivative and then of the carboxylic‐derivative N‐nitroso‐3‐carboxypropylbutylamine (BCPN), a powerful urinary bladder carcinogen in the rat (Irving et al., 1983). The biotransformation of 4‐OH‐NDBA and, to a much lower extent, of NDBA itself to BCPN has been demonstrated to occur in the isolated rat urinary bladder (Airoldi et al., 1987).
Finally, denitrosation (as measured by nitrite generation) was documented in rat liver microsomes as occurring at a lower rate (about 25%) than α‐hydroxylation (butyraldehyde formation) (Janzowski et al., 1982)
Tissue‐related differences have been reported in the generation of NDBA metabolites. In rat liver preparations, it was demonstrated that the α‐hydroxylation yielding butyraldehyde and butanol, and ω‐1 hydroxylation to 3‐OH‐NDBA are prevailing over the hydroxylation at other positions (Janzowsky et al., 1982). In a comparative study, the kinetics of NDBA biotransformation to 4‐OH‐NDBA and 3‐OH‐NDBA was determined in hepatic and extrahepatic (lung, kidney, intestine) rat microsomes (Richter et al., 1987). At low Km values (2–10 μM), the highest catalytic efficiency (Vmax) for 3‐OH‐NDBA was found in liver followed by lung, kidney and intestine; on the contrary, the 4‐OH‐NDBA generation was prevalent (about 2‐ to 10‐fold) in lung, kidney and intestine. Using isolated perfused rat small intestinal segments Richter et al. (1986) demonstrated an extensive enteric NDBA first‐pass metabolism being as high as 95% at concentrations below 10 μM and decreasing to about 30% at 200 μM. In further similar experiments performed with jejunum or ileal segments (Richter et al., 1988) and NDBA concentrations in the range 0.32–730 μM, the same research group found that 4‐OH‐NDBA, BCPN and other minor follow‐up products accounted for 75–95% of total NDBA metabolites; the proximate bladder carcinogen BCPN was by far the most abundant metabolite that could be recovered in the absorbate, and the rate of its formation was decreased with the increase of NDBA concentrations. The authors conclude that under conditions of exposure to environmentally relevant concentrations, small amounts of the parent compound are able to reach the liver.
Tissue‐ and species‐related differences in the generation of 4‐OH‐ and 3‐OH‐NDBA have been reported. In general, lung microsomes showed a much higher rate of 4‐OH‐NDBA generation over 3‐OH‐NDBA, while the reverse (3‐OH‐NDBA > 4‐OH‐NDBA) occurred in liver preparations from all tested species (rabbit, guinea pig, hamster, rat, mouse and monkey). These data point to the presence of enzymes with high catalytic efficiency for 4‐OH‐NDBA production in lung and extrahepatic tissues when compared to liver.
As measured by the rate of butyraldehyde formation, a good indicator of the α‐hydroxylation pathway (Janzowsky et al., 1982), NDBA metabolism was increased nearly three‐ and sixfold in liver microsomes from phenobarbital (CYP2B)‐ or pyrazole(CYP2E1)‐induced rats, respectively (Shu and Hollenberg, 1996). Bellec et al. (1996) investigated the rate of the formation of the NDBA metabolites resulting from the hydroxylation at different C positions in rat liver microsomes. In preparations from uninduced rats, they confirmed that the major site of hydroxylation was the ω‐1 yielding 3‐OH derivatives, followed by the ω (4‐OH derivatives) and the α (butyraldehyde). The latter pathway was strongly induced not only by phenobarbital (about fivefold) but also by dexamethasone (about 9‐fold), pointing to the participation of CYP2B and CYP3A in NDBA α‐hydroxylation. Interestingly, both inducers markedly decreased the rate of formation of 4‐OH NDBA by about 70% (phenobarbital) or 97% (dexamethasone).
In vivo studies
Scant information is available on NDBA ADME. The oral bioavailability may be inferred from a few studies addressing the excretion of this NA. Male Sprague‐Dawley rats were intragastrically administered with 66.9 or 208.8 mg NDBA/kg bw and urine and faeces were collected over 48 h (Gottfried‐Anacker et al., 1985). Only traces of the free parent compound were detected in the urine (0.04–0.06% of the administered dose). The hydroxylated derivatives were present as glucuronides and were in the order 3‐OH NDBA >> 2‐OH NDBA ~ 4‐OH‐NDBA accounting for 33–38%, 0.7 and 0.2–0.3% of the administered dose, respectively. Finally, a significant amount of BCPN in its free form (20–10% of the administered dose) was found in rat urine together with other minor metabolites (~ 5% of the administered dose); butyraldehyde formation was not investigated. Similar results were obtained by other researchers (reviewed by Okada, 1984), indicating that in rats, the main hydroxylated NDBA metabolite is 3‐OH NDBA but also pointing to an extensive generation of 4‐OH NDBA in the light of the remarkable amounts of its oxidised metabolite BCPN found in urine.
In view of the importance of NDBA metabolites in the induction of urinary bladder cancer in rats and mice, the pharmacokinetic profile of 4‐OH‐NDBA was investigated in male CD‐COBS rats after the i.v. dosing with 1 mg/kg bw (Bonfanti et al., 1988). Groups of four rats were euthanised for blood sampling at 2, 5, 10,15, 20, 30, 40, 60, 90, 120 and 1,440 min after treatment. Urine were collected 12, 24, 48, 42 and 96 h after dosing. Blood and urine samples were analysed for the presence of 4‐OH‐NDBA, 4‐OH‐NDBA glucuronide and BCPN. The 4‐OH‐NDBA blood concentration–time profile fitted a one‐compartmental linear model and the authors assumed that the compound distributed rapidly in body tissues. Its half‐life was very short, 8 min, and total body clearance and renal clearance were 86.1 and 0.22 mL/min/kg, respectively, pointing to a rapid and extensive biotransformation. Accordingly, 2 min after dosing, the metabolites 4‐OH‐NDBA glucuronide and BCPN were already present in blood; blood levels of both 4‐OH‐NDBA and its metabolites were no longer measurable 120 min after dosing. The total urinary recovery of measured compounds was estimated as ~ 48% of the administered dose, with BCPN accounting for about 36%, 4‐OH‐NDBA glucuronide for about 12% and unchanged 4‐OH‐NDBA for less than 0.3%. According to the authors, these results suggest further metabolism of 4‐OH‐NDBA or elimination via non‐renal routes. Urinary excretion of 4‐OH‐NDBA and BCPN was 36% and 11.7% of the dose, respectively.
Suzuki et al. (1981) investigated whether the lower susceptibility of guinea pigs with respect to rats in developing NDBA‐mediated urinary bladder tumours could rely on a different metabolic fate. To this aim, they administered intragastrically an average of 247 mg 4‐OH NDBA‐, 215 mg NDBA‐ or 226 mg DPCN/animal to male Hartley guinea pigs; urine was collected over 48 h and used for analytical determinations. The main 4‐OH NDBA metabolite was its glucuronide (9% of the administered dose) and not BCPN (6% of the administered dose); instead, under similar experimental conditions, the urinary excretion of BCPN and 4‐OH NDBA glucuronide in rats amounted to 40% and 2%, respectively (Suzuki and Okada 1980). In guinea pig urine, additional BCPN metabolites were found, particularly N‐nitroso‐3‐carboxymethylbutylamine (BCMN) (8% of the administered dose) in amounts almost double than those found in rats. The authors concluded that BCPN was more efficiently metabolised in guinea pigs than in rats. Unlike in the rat, when NDBA itself was administered to guinea pigs, the main urinary metabolite was 3‐OH glucuronide (12% of the administered dose) and not BCPN (4% of the administered dose) along with BCMN (percentage not specified). It was concluded that the species variation in NDBA/4‐OH NDBA metabolism, particularly the lower urinary concentrations of BCPN, could explain the lower susceptibility of guinea pigs to urinary bladder tumours with respect to rats.
Syrian hamsters (14 days of pregnancy) were treated s.c. with 100 mg/kg bw. NDBA (Althoff et al., 1977). Animals were then sacrificed, and the blood, amniotic fluid, placental and fetal tissues (unspecified) of three hamsters per interval (from 0.25 to 4–6 h) were collected and analysed for NDBA (GLC method). Unlike other dialkylnitrosamines, (e.g. NDMA, NDEA, NDPA see above), very low concentrations (around 0.2–0.3 μg/kg) were detected in fluids, placental and fetal tissues after 0.5 h and maintained at an almost constant level for the rest of the monitoring period. In contrast, using the same experimental design (Althoff et al., 1977), the s.c. dosing with 4‐OH NDBA (100 mg/kg bw) resulted in high maternal blood levels peaking at about 1 h (~40 μg/g) and slowly declining to nearly 20 μg/g at 4 h. Relatively lower levels were found in placenta (range 2–4 μg/g) and the amniotic fluid (range 2–10 μg/g), while in fetal tissues, 4‐OH NDBA peaked at 1 h (~10 μg/g) remaining thereafter relatively constant. It may be concluded that both NDBA and one of its main metabolites are able to cross the placental barrier, with 4‐OH NDBA being possibly more bioavailable via the s.c. route than the parent compound.
In experiments aimed at investigating the post‐natal carcinogenicity of NDBA, 6‐month‐old nursing hamsters were treated daily with high doses of NDBA (0, 300, 600 or 1,200 mg NDBA/kg bw) 1–30 days after delivery. The development of tracheal papillomas in the offspring is consistent with the translactational elimination of NDBA and its metabolites (Mohr et al., 1972; see also Section 3.1.2.6 on reproductive toxicity).
DNA‐adduct formation
Metabolic hydroxylation of each position of the NDBA alkyl chain has been demonstrated; the structures of three of these metabolites – 4‐OH‐NDBA, 3‐OH‐NDBA and the unstable 1‐OH‐NDBA‐are shown in Figure 9. The latter spontaneously decomposes to butyldiazohydroxide which reacts with DNA to form O 6 ‐butylGua, as identified in the liver of NDBA‐treated rats (Bonfanti et al., 1990). Further metabolism of 4‐OH‐NDBA can lead – via generation of BCPN – to DNA adduct formation including O 6 ‐(4‐hydroxybutyl)Gua and O 6 ‐butylGua, but only the latter has been detected in rats treated with NDBA (Airoldi et al., 1994).
In summary, in vitro studies indicate that the CYP‐mediated α‐hydroxylation is involved in the generation of unstable reactive diazonium ions and is thus considered a bioactivation pathway. In addition, the generation of 4‐OH‐NDBA via the CYP‐mediated oxidation of the terminal C‐atom (ω) is thought to be a prerequisite for the induction of urinary bladder cancer in the rat; by contrast, the oxidation at the ω‐1 carbon yielding 3‐OH‐NDBA is considered a detoxification route. A further important pathway entails the cytosolic two‐step oxidation of 4‐OH‐NDBA to yield the proximate urinary bladder carcinogen BCPN, a route which has also been demonstrated in the isolated rat urinary bladder. All the hydroxylated metabolites may undergo glucuronidation.
Tissue‐related (but also species‐related) differences have been reported in the generation of 3‐OH‐NDBA and 4‐OH‐NDBA with lung and extrahepatic tissues showing a much higher catalytic efficiency than liver in the production of 4‐OH‐NDBA. Experiments with isolated perfused enteric segments showed a remarkable intestinal first‐pass effect at low NDBA concentrations (10 μM) with the prevalent production of 4‐OH‐NDBA and the carcinogenic metabolite BCPN. The α‐hydroxylation pathway was found to be catalysed not only by CYP2B and CYP2E, but also by CYP3A.
According to a very limited database, oral NDBA seems to be extensively metabolised as only traces of the parent compound were found in the 48‐h urine samples along with significant amounts of 3‐OH NDBA and BCPN (resulting from 4‐OH NDBA oxidation). BCPN was found as the major urinary metabolite in rats injected with 4‐OH‐NDBA. The lower susceptibility of the hamster with respect to rat in developing bladder tumours has been related to species‐dependent variation in NDBA, 4‐OH NDBA and BCPN metabolism.
The transplacental passage of both the parent compound and 4‐OH NDBA has been documented. The development of tracheal papillomas in the nursed offspring of hamsters orally dosed with NDBA is consistent with the mammary excretion of NDBA and its metabolites.
The ω‐oxidation pathways have been delineated for the metabolic activation of NDBA leading to urinary bladder cancer. The ω‐hydroxylation, catalysed mainly by CYP enzymes but also other xenobiotic metabolising enzymes, produces unstable 4‐OH‐NDBA which spontaneously decomposes to butyldiazohydroxide to produce the DNA adducts O 6‐butylGua.
NMA
ADME
In vitro studies
It is generally acknowledged that the main metabolic pathways are represented by CYP‐mediated N‐dealkylation (N‐demethylation) and denitrosation. The former leads to the formation of formaldehyde (Tu et al., 1983); it is considered a bioactivation pathway, as it is thought to generate a reactive benzene diazonium ion (BDI), which is able to react with adenine residues in DNA giving rise to unstable adducts (Koepke et al., 1990). The latter represents a second pathway generating nitrite and various amines (Scheper et al., 1991) and is considered a detoxification route (Stiborova et al., 1996).
NMA N‐dealkylation and denitrosation were determined in liver microsomes from female NMRI mice and female Wistar rats by measuring the rate of formaldehyde and nitrite formation, respectively. In preparations from untreated animals, N‐demethylation prevailed over denitrosation with markedly different intensities, with the HCHO/NO2 − ratio of 10.7 in mice and only 2.9 in rats. When microsomes from phenobarbital pretreated mice were used, N‐dealkylation increased by 50%, while denitrosation by 250%; the opposite was true when preparations from BHT‐pretreated rats were used, with denitrosation increasing by 50% only and N‐dealkylation by 200%. The authors conclude that N‐demethylation and denitrosation are independent of each other, subjected to species‐related differences and likely catalysed by different CYP enzymes (Appel et al., 1985). The characterisation of NMA amine metabolites in liver microsomes from phenobarbital‐pretreated mice was reported by Scheper et al. (1991). Aniline represented the main amine metabolite, with comparatively less amount of N‐methylaniline and p‐methylaminophenol. Another study was performed with oesophageal and liver S‐9 fractions from phenobarbital or pyrazole‐treated Sprague‐Dawley rats (Gold et al., 1987). Besides aniline and methylaniline resulting from NMA denitrosation, phenol was also found and considered as a terminal product of NMA α‐hydroxylation (N‐demethylation), which is associated with the generation of reactive BDI intermediate. Interestingly, phenol could be detected only in S‐9 from phenobarbital‐pretreated rats and not in those from pyrazole‐pretreated rats, pointing to a prevalent involvement of CYP2E1 in the denitrosation pathway. Finally, in studies with purified CYP2Bs, it was reported that CYP2B1 was involved in both NMA α‐hydroxylation (N‐demethylation) and denitrosation, while CYP2B2 catalysed only denitrosation (Stiborova et al., 1996).
In vivo studies
The tissue distribution, the rate of disappearance from blood and organs and urine excretion of NMA were investigated in male Sprague‐Dawley rats administered with 37, 20 or 10 mg NMA/kg bw i.p. (Pylypiw et al., 1984). Groups of animals (N unspecified) were sacrificed at eight fixed time intervals (from 15 min to 24 h) and blood and organs (liver, kidney, oesophagus, fat and brain) were collected; urine was sampled at 24 and 48 h. NMA in all samples and its denitrosated metabolite MA in urine were detected. No substantial dose‐related differences were noticed in the rate of blood disappearance, which was rapid with NMA being undetectable 24 h after dosing. Only small fractions of the administered dose were recovered in 24 or 48 h urine samples as NMA and MA. There was no accumulation in fat or oesophagus (the target tissue for NMA carcinogenicity) or in other tissues and the rate of NMA depletion from organs over time was substantially the same as that seen in blood. Overall, these results are consistent with a rapid and free tissue distribution and an extensive biotransformation.
No similar studies with other administration routes were retrieved and information concerning milk excretion or placental transfer was not found.
DNA‐adduct formation
The mechanism of DNA damage by NMA remains unclear.
In summary, according to in vitro studies, the main metabolic pathways are N‐demethylation and denitrosation, which are mediated by both CYP2B isoforms and CYP2E1. N‐demethylation is considered a bioactivation pathway leading to the formation of reactive benzene diazonium ions. Identified metabolites were aniline, methylaniline (a denitrosation product) and p‐methylaminophenol; phenol was also detected and considered as a terminal product of NMA α‐hydroxylation (N‐demethylation). In the only available in vivo study, NMA was totally cleared from rat blood in 24 h and did not accumulate in body tissues. Only traces of NMA and methylaniline were found in the 24‐h urine. No information on transplacental passage or mammary excretion could be retrieved.
NSAR
ADME
In the only retrieved study (Ohshima et al., 1982), NSAR urinary and faecal excretion were studied in male BD‐IV rats orally challenged (gavage) with 50 μg NSAR/animal. Almost 88% and less than 0.1 % of the administered dose were excreted unchanged in the 24 h urine and faeces, respectively. The almost quantitative NSAR elimination in 24 h suggests a rapid absorption and minimal metabolism.
DNA‐adduct formation
NSAR can be metabolically activated via a CYP‐mediated methyl hydroxylation (N‐demethylation), giving rise to the DNA‐reactive intermediates carboxymethyldiazonium ion and formaldehyde. The DNA adducts that could potentially be formed during the metabolism of NSAR and exert genotoxic and mutagenic activity are reviewed in detail in Li and Hecht (2022). However, to date, no DNA adducts by NSAR have been detected in in vivo studies.
ADME or metabolic activation studies and DNA adduct formation of NDIBA, NEA, NDBzA, NMAMPA, NMAMBA have not been reported.
3.1.1.1.3. Cyclic volatile N‐NAs
NMOR
ADME
Relatively little is known on NMOR kinetics and most of the studies are related to its biotransformations.
Both CYP‐dependent oxidation (Hecht and Young, 1981; Jarman and Manson, 1986) and denitrosation (Appel et al., 1980) have been reported. Earlier studies in rat liver microsomes identified N‐nitroso‐2‐hydroxymorpholine as the main oxidation product and N‐nitrosodiethanolamine as the main urinary metabolite (Manson et al., 1978), possibly deriving from direct cleavage of NMOR as later suggested by Hecht and Young (1986). Hecht and Young (1981) demonstrated the NMOR α‐hydroxylation (3‐ or 5‐hydroxylation) by rat liver microsomes yielding 2‐(hydroxyethoxy)acetaldehyde. The urinary excretion was studied treating rats i.p. (125 or 150 mg NMOR/kg bw). N‐nitroso(2‐hydroxyethyl)glycine (33% of the dose), (2‐hydroxyethoxy)acetic acid (16% of the dose) and N‐nitrosodiethanolamine (12% of the dose) and traces of NMOR (1.5% of the dose) were detected in the urine after 48h.
An overview of the important metabolic pathways of NMOR is presented in Figure 10 (Hecht and Young, 1981). α‐Hydroxylation produces α‐hydroxy NMOR, an unstable intermediate that spontaneously ring opens giving a diazohydroxide that reacts with H2O, producing the major initial product of α‐hydroxylation, 2‐hydroxyethoxyacetaldehyde. This undergoes further oxidation producing the urinary metabolite 2‐hydroxyethoxy acetic acid. Hydroxylation at the 2‐position produces 2‐hydroxyNMOR which is in equilibrium with the open‐chain form, N‐nitroso‐2‐(hydroxyethyl)acetaldehyde, which undergoes further oxidation producing the urinary metabolite N‐nitroso‐2‐(hydroxyethyl)glycine. The latter has the potential to be used as a monitor of NMOR exposure, but has not yet been detected in human urine (Hecht and Morrison, 1984). Metabolism at the 2‐position of NMOR also produces N‐nitrosodiethanolamine.
Figure 10.
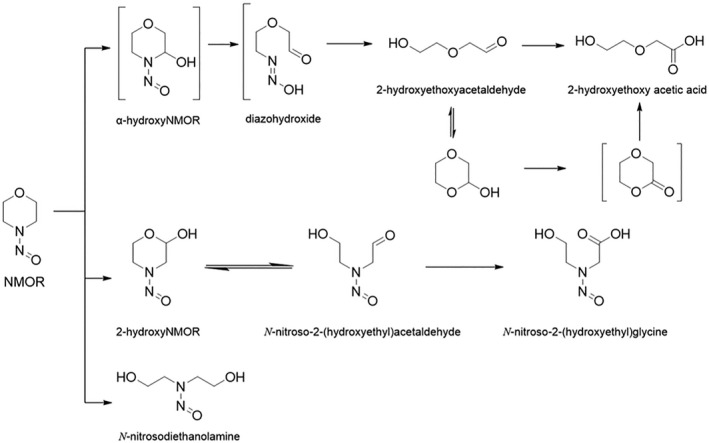
Metabolism of NMOR
The tissue distribution and the ability of the different tissues to metabolise NMOR were investigated with the whole‐body autoradiography technique (Löfberg and Tjälve, 1985). Sprague‐Dawley rats were injected i.v. with [14C]NMOR (2.5 mg/kg bw) and euthanised at different intervals. In vitro experiments in which tissue slices were incubated with [14C]NMOR were also performed to measure the extent of tissue‐bound radioactivity, as a result of NMOR bioactivation to reactive metabolites. The autoradiography performed 1 min after sacrifice indicated that, in common with other NAs, NMOR can be freely distributed to all tissues. After 8 h, radioactivity was maximal in liver (260 ± 45 dpm) followed by nasal olfactory mucosa (121 ± 23 dpm), kidney (77 ± 11 dpm) and other tissues (range 21–60 dpm). Results from in vitro experiments showed the highest degree of tissue‐bound radioactivity in nasal olfactory mucosa (48 ± 8 dpm), followed by liver (24 ± 4 dpm) and oesophagus (16 ± 1 dpm). Tissue‐bound radioactivity was reduced in the presence of metyrapone and greatly inhibited by CO, demonstrating the role of CYPs in the generation of NMOR‐reactive species. It is concluded that target tissue bioactivation of NMOR is an important determinant in the development of tumours.
No other information on NMOR ADME could be retrieved.
DNA‐adduct formation
The DNA‐adducts that may be formed during the metabolism of NMOR are reviewed in detail in Li and Hecht (2022). In vitro experiments showed that the intermediary diazohydroxide (see Figure 10) reacts with DNA to form an NMOR adduct (N1,N2‐glyoxal‐dGua), identical to that produced in the reaction of glyoxal with DNA. The same NMOR DNA adduct may also be formed from 2‐hydroxyNMOR (Chung and Hecht, 1985; Palladino et al., 1986). Evidence for adduct formation in vivo has not been provided so far.
NPYR
ADME
NPYR undergoes quite a complex metabolic degradation in rat liver microsomes leading to the formation of 4‐hydroxybutanal (4‐HB) and other metabolites; 4‐HB is predominantly found as its cyclic derivative 2‐hydroxytetrahydro‐2H‐furan (2‐OH‐THF) (Hecht et al., 1981). It is the result of an initial α‐hydroxylation step generating in turn a reactive carbocation species with mutagenic and carcinogenic properties (Hecht et al., 1978, 1979). The combination of the metabolic activation with rat liver microsomes and the trapping with a nucleophile (cysteamine), allowed to calculate half‐lives of the generated reactive intermediates amounting to 54 s for NPYR, similar to the 39 s found for NDEA (Keenan and Weinkam, 1985). These results strongly suggest that molecular species responsible for cell damage and neoplastic effects primarily act at their site(s) of formation (organ specificity). The α‐hydroxylation pathway is expected to be mediated by CYPs, since both piperonyl butoxide and SKF525A, two prototypical inhibitors of CYP‐dependent monoxygenases, decreased the rate of 4‐HB formation in rat liver microsomes in a concentration‐related manner (Cottrell et al., 1983). Different CYP2A isoforms have been reported to catalyse NPYR α‐hydroxylation in rat and mice liver preparations (Wong et al., 2005).
Metabolic pathways of NPYR were elucidated with the aid of a stable model compound, α‐acetoxyNPYR (Figure 11). The initially formed metabolite, α‐hydroxyNPYR, is unstable, as for acyclic N‐NAs. It undergoes spontaneous ring opening to form a diazohydroxide aldehyde and a diazonium ion, which reacts rapidly with H2O‐producing 4‐HB. 4‐HB spontaneously cyclises giving the major metabolite of NPYR observed in vitro, 2‐hydroxytetrahydrofuran. Other metabolites formed by this pathway include crotonaldehyde and the related hydrated and dimerised products. The metabolic activation of NPYR can be quantified by measurement of 4‐HB, as its 2,4‐dinitrophenylhydrazone.
Figure 11.
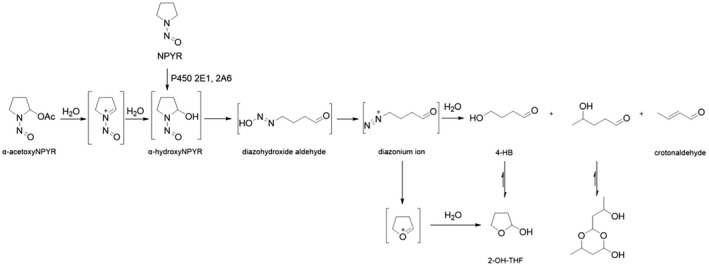
NPYR metabolism by α‐hydroxylation
In vivo studies following the i.p. administration of labelled NPYR revealed different metabolic pathways and the generation of several urinary metabolites, i.e. pyrrolidinone‐2‐oxime, pyrrolidin‐2‐one, y‐hydroxybutyric acid, y‐butyrolactone (likely originating from 4‐HB), succinic semialdehyde, 3‐hydroxy‐N‐nitrosopyrrolidine, dimethylamine and urea, as well as the ultimate production of CO2 (Cottrell et al., 1979, 1980). In particular, the rate of 14CO2 exhalation after the i.p. administration of N‐nitroso[2,5‐14C]pyrrolidine was taken as an index of the rate of the overall NPYR metabolism. Either SKF525A or piperonylbutoxide failed to decrease NPYR degradation to 14CO2; conversely, the pretreatment with disulfiram (an inhibitor of CYP2E1 and aldehyde dehydrogenase), imidazole (a specific inhibitor of microsomal amino oxidase), or pyrazole (an inhibitor of alcohol dehydrogenase) caused the rate of 14CO2 exhalation to fall to about 20–30% of controls i.e. without inhibitors. Accordingly, rats pretreated with the latter substances had a higher urinary excretion of unchanged NPYR. It is concluded that enzymes other CYPs play a significant role in the in vivo NPYR biotransformation.
The tissue distribution and the tissue‐specific ability to metabolise NPYR were investigated using a whole‐body autoradiography technique in mice i.v. injected with or orally exposed (gavage) to [14C]NPYR (0.2–0.6 mg/kg) and euthanised at different intervals (Johansson‐Brittebo and Tjälve, 1979). In vitro experiments in tissue slices incubated with [14C]NPYR were also conducted to measure the extent of NPYR bioactivation as tissue‐bound radioactivity. In mice euthanised shortly after i.v. or oral dosing, the radioactivity was uniformly distributed in the tissues, indicating rapid absorption (also via the oral route) and distribution. From the autoradiograms, it appeared that the higher metabolic rate occurred in the liver, tracheo‐bronchial and nasal mucosa and in the Harder's gland. The radioactivity measured in the gall bladder suggests that the biliary route might play a role in NPYR/NPYR metabolites excretion.
DNA adduct formation
Several potentially DNA‐reactive electrophiles are produced during α‐hydroxylation of NPYR, as summarised in Figure 11 above and Figure 12 below. The electrophiles comprise carbocations, oxonium ions and crotonaldehyde (Figure 12). Accordingly, in DNA from treated rodents, a great variety of adducts have been characterised. The carbocation‐derived cyclic N7,8‐butanoguanine was by far most prevalent in the liver (Loureiro et al., 2009) and was found also in the lungs and kidneys of NPYR‐treated mice, rats and hamsters (Hunt et al., Carcinogenesis 1991). N7‐(4‐oxobutyl)guanine occurred at a low level in hepatic DNA of rats (Wang et al., Chem Res Tox. 1992; Wang et al., Carcinogenesis 1992). Oxonium ion‐derived adducts were among others N 2 ‐(4‐HOB)‐dGuo or O 2 ‐THF‐Thd, while the intermediary crotonaldehyde gave rise to N1,N 2‐propano‐dGuo (Li and Hecht 2022). Further details are reviewed in Li and Hecht (2022).
Figure 12.
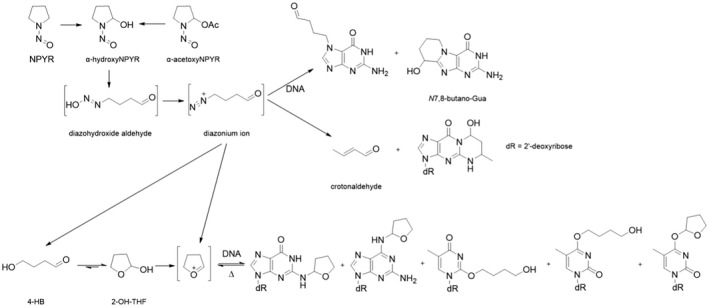
DNA adduct formation from NPYR
NPIP
ADME
Early studies conducted with rat liver microsomes identified N‐nitroso‐4‐hydroxypiperidine as the major NPIP metabolite (Rayman and Challis, 1975). In common with other NAs, it was postulated that the α‐hydroxylation represents the key activation pathway also for NPIP; in later studies, the major end product of α‐hydroxylation was identified as 5‐hydroxypentanal, which cyclises to 2‐hydroxytetrahydro‐2H‐pyran (2‐OH‐THP) (Leung et al., 1978). In a comparative study, Wong et al. (2003b) compared the α‐hydroxylation rate of NPIP and of the structurally related NPYR by measuring the rate of (2‐OH‐THP) and (2‐OH‐THF) formation, respectively, in oesophageal and liver microsomes. Rat oesophageal microsomes α‐hydroxylate NPIP at a much higher rate than NPYR. Differences ranged from sevenfold over a substrate concentration of 4–100 μM and up to 40‐fold at the same substrate concentration (4 μM) at different microsomal protein concentrations. In contrast, the α‐hydroxylation rates of NPIP or NPYR by rat liver microsomes were not significantly different. These results clearly point to an organo‐specific bioactivation and are consistent with the particular susceptibility of rat oesophagus to the tumorigenic action of NPIP. In addition, according to the authors, CYP2A3 might play a role in the preferential bioactivation of NPIP in the oesophageal tissue.
Similar to the metabolism of NPYR, α‐hydroxylation of NPIP produces 2‐OH‐THP, as the major product (Figure 13). Consistent with its activity as an oesophageal carcinogen in the rat, NPIP was converted to 2‐OH‐THP by rat oesophageal microsomes. This reaction proceeded with a 40‐fold higher velocity than the analogous α‐hydroxylation of NPYR, a rat liver carcinogen inactive in the oesophagus, but both compounds underwent α‐hydroxylation at similar rates with rat liver microsomes. Similar results were observed in reactions catalysed by rat nasal microsomes (Wong et al., 2003a). Expressed rat CYP2A3, found in low levels in the oesophagus, was a good catalyst of NPIP α‐hydroxylation but a poor catalyst of NPYR α‐hydroxylation (Wong et al., 2003b). CYP2As were generally better catalysts of NPIP α‐hydroxylation than NPYR. Therefore, mouse CYP2A4 and 2A5 and human CYP2A6 and 2A13 exhibited significantly lower Km and higher kcat/Km values for NPIP than NPYR α‐hydroxylation, similar to rat CYP2A3 (Fujita and Kamataki, 2001a).
Figure 13.
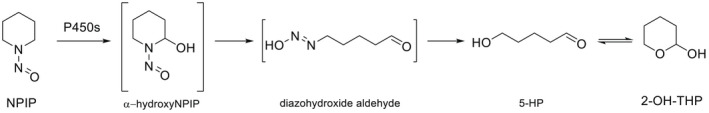
NPIP metabolism by α‐hydroxylation
The tissue distribution and the sites of the likely NPIP bioactivation were investigated by the autoradiography technique in male C57BL/6J mice after the i.v. dosing with 1.2 mg/kg [14C]NPIP and killing at different times after injection. The autoradiographs revealed intense localisation of radioactivity already at the first time point (6 min) in the epithelium of the nose and bronchi, as well as in the liver, kidney and salivary glands. At 24 h, the most intense accumulation was in the epithelium of the bronchi, nose, salivary gland ducts and oesophagus as well as in the liver and Harder's gland. This latter radioactivity was interpreted as the result of NPIP metabolic conversion to alkylating species, able to bind to molecular constituents in tissues which are targets for NPIP carcinogenicity.
No other information on kinetic parameters, milk excretion and transplacental passage was made available.
DNA adduct formation
α‐AcetoxyNPIP is a model compound for metabolic α‐hydroxylation of NPIP. Reaction of α‐acetoxyNPIP with DNA followed by enzymatic hydrolysis produced the adduct N 2 ‐tetrahydropyranyl‐dGua (N 2 ‐THP‐dGua) (Figure 14) (Wang et al., 1995). Further DNA adducts that could potentially be formed during the metabolism of NPIP are reviewed in detail in Li and Hecht (2022).
Figure 14.
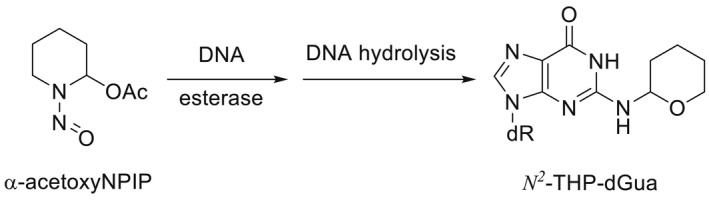
Formation of N 2 ‐THP‐dGua
NTHZ
ADME
The in vitro metabolism of 2[14C]NTHZ was investigated in primary cultures of rat hepatocytes and 2‐hydroxy‐1,3‐thiazolidine (α‐hydroxyTHZ) (Figure 15), a water soluble derivative resulting from α‐hydroxylation and denitrosation, was identified as the major metabolite (Cragin and Shibamoto, 1992). This study confirmed the results of a previous in vivo report (Cragin et al., 1989) in which rats were orally treated once with 125 mg 2[14C]NTHZ/kg bw (gavage) and sacrificed 24 h after dosing. Urine and faeces were collected over 24 h. Already 6 h after treatment, an amount of 14C radioactivity corresponding to 50% of the administered dose was found in urine while the percentage rose to 81% after 24 h; at that time, only about 1% and 5% was recovered in the faeces and the carcases, respectively. Subsequent analysis with GC‐MS revealed that α‐hydroxyTHZ accounted for the 77% of the urinary metabolites. It is concluded that in rats, NHTZ is rapidly and extensively absorbed and biotransformed to α‐hydroxyTHZ which undergoes to rapid elimination via urine with very limited tissue accumulation.
Figure 15.
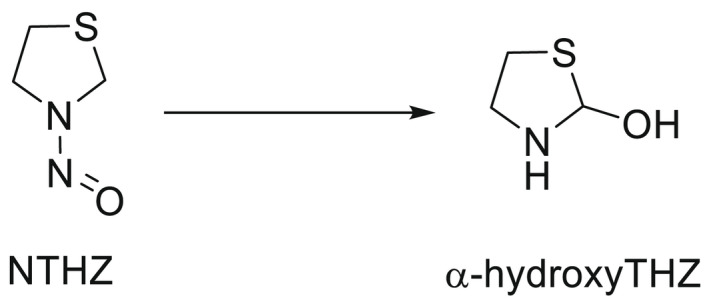
Structures of NTHZ and its metabolite
No other studies on NTHZ ADME were retrieved.
3.1.1.1.4. Cyclic non‐volatile N‐NAs
There is a paucity of knowledge on cyclic non‐volatile N‐NAs TK in experimental animals.
NPRO
ADME
The absorption, tissue distribution and excretion of a single dose (10 mg/animal, gavage) of [14C]N‐NPRO were investigated in adult male Osborne–Mendel rats. After dosing, animals were sacrificed at different intervals (from 0.5 h up to 7 days) and blood and tissue samples were collected. Urine and faeces were collected over 24 h. Results showed a ready and extensive absorption of [14C]NPRO from the gastrointestinal (GI) tract and a rapid elimination since 98% of the total 14C radioactivity administered was excreted in the urine within 24 h. Blood and tissue levels (expressed as μg NPRO/g) were also measured. Blood levels (about 36 μg/g) peaked at 1 h and then rapidly declined to reach < 1 μg/g 24 h after treatment. At 4 h, kidney and liver displayed the highest concentrations (3.5–6 μg/g), but at 24 h negligible values (< 1 μg/g) were detected in all tissues, in line with the rapid NPRO elimination (Dailey et al., 1975). Ohshima et al. (1982) reported that rats exposed to single oral doses (5 or 50 μg NPRO/animal, gavage), eliminated about 96% and 3% unchanged NPRO in urine and faeces, respectively, within 24 h after treatment. A nearly complete urinary NPRO elimination 24 h of treatment was detected in rats orally treated with 1 or 10 mg [14C]NPRO/kg (Chu and Magee, 1981).
In summary, in rats, oral NPRO seems to be rapidly and extensively absorbed, distributed to tissues with no significant accumulation and then quickly eliminated as its unchanged form mainly via urine within 24 h.
In line with the reported lack of NPRO carcinogenicity in rodents, rats treated once with the same doses of labelled ([14C]NPRO) and unlabelled NPRO did not show differences in the radioactivity measured in liver DNA, RNA and protein at 4 or 8 h after dosing (Chu and Magee, 1981).
NHPRO
No information concerning absorption, distribution and metabolism were located. The only available study (Ohshima et al., 1982) addressed the urinary and faecal NHPRO elimination in rats 24 h after the oral dosing with 50 μg/animal, amounting to, respectively, 47% and 46%.
No data could be retrieved on NHPRO bioactivation and DNA adduct formation.
NTCA and NMTCA
Data on absorption, distribution and metabolism were not retrieved. In the only available report (Ohshima et al., 1984), the urinary and faecal NTCA and NMTCA elimination were investigated in rats. Animals received a single oral dose of either compound (100 μg/animal) or urine and faeces were collected up to 48 h. More than 90% of unchanged NTCA or NMTCA was recovered in the 24 h urine along with traces in faeces (< 2%); 48 h after treatment, a further small amount (around 2%) of either compound was detected.
No data could be retrieved on NTCA and NMTCA bioactivation and DNA adduct formation.
ADME studies and DNA adduct formation of NHMTCA, NOCA, NMOCA, NPIC, NHPYR, NMTHZ and NHMTHZ have not been reported.
3.1.1.1.5. Aromatic non‐volatile N‐NAs
NDPheA
ADME
Limited information is available on NDPheA kinetics (ATSDR, 2017).
In vitro studies
As NDPheA does not bear oxidisable hydrogen at the α‐position, it is not subjected to the generally accepted bioactivation pathway of N‐NAs (α‐hydroxylation). The in vitro metabolism was reviewed by Appel et al. (1987). When incubating NDPheA with liver microsomes from rats or phenobarbital‐induced mice, the main metabolic pathway is a CYP‐dependent denitrosation yielding diphenylamine, nitric oxide, nitrate and nitrite. Other metabolites were the 4‐OH derivative of diphenylamime and its corresponding quinoneimine derivative (Figure 16). N‐hydroxylation is considered the critical step in the bioactivation of carcinogenic arylamines, but N‐hydroxy‐diphenylamine, which might be implied in the carcinogenic properties of NDPheA (see adduct formation below) was never isolated from microsomal incubates.
Figure 16.
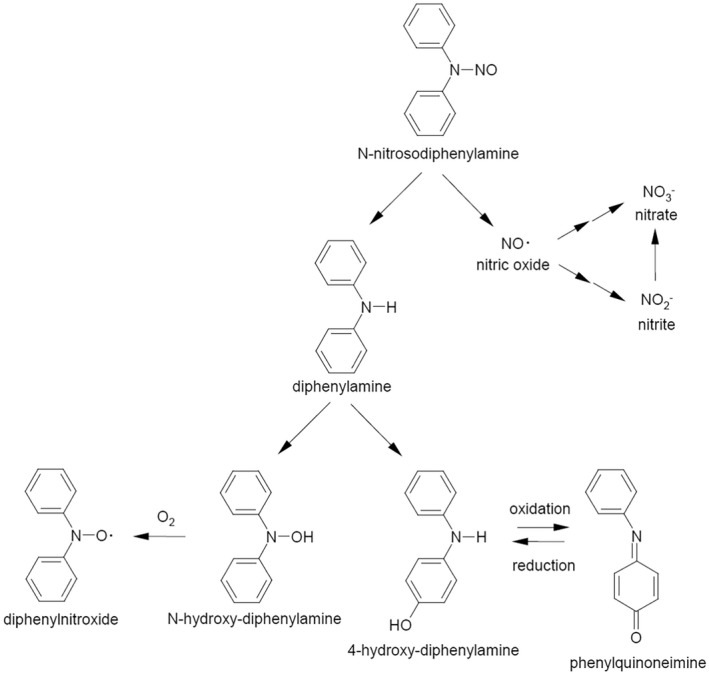
Metabolic pathways for NPhA (ATSDR, 2017)
In vivo studies
No specific studies on absorption and distribution could be retrieved. Oral absorption may be inferred from reports documenting the presence of the parent compounds and its metabolites in blood or urine. Dodd et al. (2013) treated female Fischer 344 (F344) rats by including NDPheA in feed at concentrations of 0, 250, 1,000, 2,000, 3,000 or 4,000 mg/kg for 5 days, 2, 4 or 13 weeks duration. Terminal blood samples were collected and analysed for the presence of NDPheA by LC‐MS/MS (LOD = 0.005 μg/mL). Small amounts of the unchanged N‐NA (range 0.02–0.19 μg/mL) were found irrespective of the administered dosages and the duration of the treatment. The in vivo metabolic fate was investigated in female Wistar rats orally administered with a single dose of NDPheA (1000 mg/kg bw); the 36h urine samples were analysed by GC/MS, expressing results as μmol/rat/36 h. Urinary nitrate (248 μmol) was the main metabolite and largely outweighed nitrite (14 μmol); measurable amounts of diphenylamine (0.022 μmol) and 4‐OH diphenylamine (0.5 μmol) were also detected. After 96 h about 25% of the applied NDPheA was eliminated as nitrate and nitrite (Appel et al., 1984). Species‐related differences in biliary excretion of NDPheA were reported in rats, rabbits and guinea pigs receiving 50 mg NDPheA/kg i.p. (Atawodi and Maduagwu, 1990). After 6h from the treatment, the elimination half‐life values were 510 min, 240 min and 95 min, respectively, while cumulative excretions amounted to 12%, 3% and 0.3%, respectively.
No information could be retrieved on the ability of NDPheA and its metabolites to cross the placental barrier or to be excreted via the mammary route.
DNA adduct formation
Most of the in vitro positive tests concerning NDPheA‐mediated DNA damage occurred after metabolic activation (see above), suggesting that NDPheA genotoxic potential arises from its metabolites and for most N‐NAs, the generation of reactive metabolites results from the α‐‐hydroxylation of the α‐carbon next to the NO group. Since NDPheA is not susceptible to α‐carbon hydroxylation, other mechanisms have been proposed, like for instance the transnitrosation of dietary amines (ATSDR, 2017).
In summary, NDPheA is absorbed through the GI tract, but quantitative data are missing and no information on distribution is available as well. The main metabolic pathway seems to be a CYP‐dependent denitrosation with diphenylamine and nitrate being the main metabolites which are primarily eliminated via the urinary route. Since the α‐carbon hydroxylation does not occur, other mechanisms (e.g. transnitrosation of dietary amines) have been proposed to explain the potential genotoxicity of NDPheA.
3.1.1.2. Toxicokinetics and metabolic activation in humans
In vivo and in vitro TK studies
Relatively little is known about the toxicokinetics of N‐NAs in humans. Some data are available on the presence of N‐NAs and/or their metabolites in human biological fluids such as blood, gastric juice, urine and milk (e.g. Lakritz et al., 1982; Lakritz and Pensabene, 1984), which are often used in epidemiological studies. However, the relevance of these data may be limited due to the level of endogenous formation of N‐NAs (Tannenbaum, 1980).
Indeed, in a study conducted in human volunteers (Lakritz et al., 1982), low concentrations of NDMA were detected in gastric juice (range 0.1–0.7 μg/g), blood (range 0.2–0.7 μg/g) or urine (range 0.1–0.7 μg/g) after 1–2 h fasting; interestingly, these levels were not increased by the ingestion of an ordinary diet containing sources of precursor amines (fish or beef) or preformed NDMA (bacon, range 0.3–2.9 μg/g).
The substantial lack of structured ADME data of N‐NAs in humans is of importance in the light of the well‐known interspecies kinetic differences displayed by experimental animals. A telling example comes from NDMA oral bioavailability ranging from 8% to 10% in hamsters and rats and 49–93% in monkeys, pigs and dogs; large differences were also noticed for Cl and Vdss ranging from 3.8 mL/min (Cl) and 21 mL (Vdss) and 2516 mL/min (Cl) and 40,000 mL (Vdss) in mice and pigs, respectively (Gombar et al., 1990). An attempt to extrapolate in vivo kinetic data from experimental species to humans has been made by Gombar et al. (1990). Data for rats, hamsters, rabbits, Patas monkeys, dogs and pigs taken from the literature were used to scale to body weight using allometric equations adequately fitting data from all species. Using these equations and assuming a body weight of 70 kg, the Cl and Vdss in humans were estimated to be 3450 mL/min and 64,800 mL, respectively, comparable to those measured in pigs.
Another issue to be addressed in humans is the effect of ethanol on N‐NA metabolism and disposition. As demonstrated in experimental animals (Swann et al., 1984, Anderson et al., 1986; Anderson et al., 1994; Chhabra et al., 2000), the co‐exposure to ethanol may affect the hepatic first pass clearance of certain N‐NAs entailing the increased exposure of extrahepatic organs and a related rise in DNA adduct formation. Few observations in humans are available. As reported by Swann et al. (1987) in a review, NDMA was found in blood from individuals consuming meals with alcoholic beverages but not when similar meals were taken in the absence of alcohol. In repeated experiments, human volunteers were administered orange juice containing NDMA (13–26 μg/dose) in the presence or absence of 6% ethanol and the urinary 24 h excretion of NDMA was expressed as the percentage of the ingested dose. Measurable (> 0.05 μg/L) NDMA concentrations were found only when the juice was administered with ethanol, corresponding to a urinary excretion of 0.5–2.4% of the ingested dose (Spiegelhalder and Preussmann, 1984). Taken together, these results point to an effect of ethanol on NDMA hepatic first‐pass clearance comparable to that observed in rodents, and consistent with the metabolism of both ethanol and NDMA by CYP2E1.
In the absence of in vivo studies, attempts were made to extrapolate in vitro kinetic data to the in vivo situation. A high affinity hepatic NDMA N‐demethylase was identified in human liver microsomes (Yoo et al., 1988), with kinetic constants similar to that characterised in rats (Tu and Yang, 1983). Assuming that most (if not all) NDMA metabolism at low substrate concentrations takes place in the liver, based on the published values of Km and Vmax, Streeter et al. (1990a,b) calculated that the intrinsic hepatic clearance in rats and humans amounts to 133–200 mL/min/kg and 200 mL/min/kg, respectively. These values would correspond to a hepatic blood clearance of 19 mL/min/kg in humans, which is close to the calculated hepatic blood flow of 21 mL/min/kg for a 70 kg human individual. According to this extrapolation, NDMA in humans would undergo a high hepatic extraction ratio (nearly 90%) which is very similar to what has been demonstrated in vivo in the rat, but different from that in pigs as noted above.
N‐NAs are organotropic carcinogens in experimental animals. Since all N‐NAs considered here require bioactivation to form carcinogenic derivatives, such organotropism may be partly explained by the different ability of organs/tissues to metabolise N‐NAs into their ultimate carcinogenic forms. As mentioned in the previous section, species‐ and organ/tissue related differences in N‐NAs bioactivation have been reported in laboratory species particularly for acyclic volatile N‐NAs (see Section 3.1.1.1.1). In this respect, it was of interest to compare humans vs. rats, which are widely used animal models for N‐NAs carcinogenesis. Oesophagus is a major target for N‐NAs carcinogenesis in rats. Autrup and Stoner (1982) compared the metabolic ability of cultured human and rat oesophagus to metabolise and bioactivate 14C labelled NDMA, NMEA, NDEA, NMBzA[1] 14 or NPYR by measuring the amount of formed metabolites and the radioactivity associated with DNA. Overall, there were marked differences between the two species, in that cultured rat oesophagus biotransformed and activated all the tested N‐NAs, while its human counterpart was active only toward NDMA and NDEA. Even considering the limitations of studies with tissue cultures, these results suggest that broad generalisation s in interspecies extrapolations should be avoided.
In summary, very little is known about the fate in humans of the N‐NAs considered here and most of the available information concerns NDMA. The presence of measurable N‐NAs levels has been reported in blood, gastric juice, urine and milk, but these studies are of limited value with respect to toxicokinetics since the origin of these N‐NAs is unknown and their endogenous formation represents a potentially important N‐NAs source in humans. In the few studies in which human volunteers were offered meals with known N‐NA (NDMA) content, only trace amounts of the ingested dose were recovered in biological fluids, except in the case of ethanol co‐administration. This suggests that in humans, ethanol may decrease the hepatic clearance of NDMA, as demonstrated in rodents. The in vivo extrapolation of the in vitro hepatic NDMA intrinsic clearance measured in human liver microsomes resulted in a calculated hepatic extraction ratio of about 90%, which is very similar to that measured in vivo in the rat. Finally, quantitative differences between humans and rats were reported in the ability of the same tissue (e.g. cultured oesophagus) to biotransform and activate (as measured by DNA‐binding) different N‐NAs with the exception of NDMA and NDEA.
CYP‐isoforms involved in N‐NAs biotransformation
Most of the studies relevant for humans focus on the in vitro biotransformation by human CYP enzymes.
As discussed in the previous sections, N‐NAs require metabolic activation, generally by α‐hydroxylation, to exert their DNA damaging, mutagenic and carcinogenic effects. There is no doubt that specific human CYP enzymes are excellent catalysts of this process. CYP2E1 is the best catalyst of NDMA metabolism by α‐hydroxylation.
CYP2E1 and 2A6 catalyse the α‐hydroxylation of NDEA. Kinetic constants for NMEA N‐dealkylation were intermediate between those of NDMA and NDEA (Graves and Swann, 1993), which were estimated using human liver slices. CYP2B1 and 2E1 are effective catalysts of α‐hydroxylation of NDPA (Camus et al., 1993; Shu and Hollenberg, 1996; Bellec et al., 1996; Chowdhury et al., 2012). CYP2A6 is an effective catalyst of α‐hydroxylation of NMBA (Fujita and Kamataki, 2001a,b). The α‐hydroxylation of NPYR is catalysed by CYPs 2A6 and 2E1 while CYP2A6 and 2A13 are effective catalysts of NPIP α‐hydroxylation (Fujita and Kamataki, 2001a,b; Wong et al., 2005). For NDBA, CYPs 1A1 and 2A6 catalyse its α‐hydroxylation (Fujita and Kamataki, 2001a,b). NMA is also a good substrate for CYP2E1 (Sulc et al., 2010). These studies of N‐NA metabolic α‐hydroxylation by human CYP enzymes are fully consistent with earlier studies with explant cultures which demonstrated that a variety of human tissues including bronchus, nasal mucosa, oesophagus, bladder, colon and pancreatic duct can metabolise various N‐NAs (Harris et al., 1977; Autrup et al., 1978; Longo et al., 1986; Archer, 1989).
Fujta and Kamataki (2001b) studied the role of human CYPs in the metabolic activation of N‐alkylnitrosamines using genetically engineered Salmonella Typhimurium (S. Typhimurium). YG7108 cells expressed each form of human CYP together with human NADPH‐cytochrome P450 reductase. The relationship between N‐NA structure and CYP form(s) involved in the activation was evaluated. Strains of S. Typhimurium YG7108 cells expressing CYP1A1, CYP1A2, CYP1B1, CYP2A6, CYP2C8, CYP2C9, CYP2C19, CYP2D6, CYP2E1, CYP3A4 or CYP3A5 were used. Eight N‐alkylnitrosamines including NDMA, NDEA, NDPA, NDBA, NMEA, NMPA, NMBA and N‐nitrosoethylbutylamine (NEBA) were examined. Mutagen‐producing capacity of CYPs, as indicated by induced revertants/nmol promutagen/pmol CYP, for an N‐alkylnitrosamine was determined for all forms of CYP. These N‐NAs were mainly activated by CYP2E1, CYP2A6 and CYP1A1. N‐alkylnitrosamines with relatively short alkyl chains such as NDMA and NMEA were mainly activated by CYP2E1. The contribution of CYP2A6 increased with increasing alkyl chain length of the tested NAs. CYP2A6 played major roles in the activation of NDEA, NDPA, NMPA, NMBA and NEBA. CYP1A1 was important in the metabolic activation of NDBA. In a separate study, multiple CYPs including CYP2B6, CYP2C9, CYP2C19 and CYP2E1 were efficient catalysts of NMBA α‐hydroxylation based on yields of formaldehyde and butyraldehyde (Bellec et al., 1996).
A high interindividual variability in NDEA metabolism was found in a panel of human liver microsomes as the result of differences in the expression of CYP2A6 (Camus et al., 1993). Among the human CYP enzymes that metabolise N‐NAs commonly found in food such as NDMA, NDEA, NPYR and NPIP, CYP2A6 is highly polymorphic. There are numerous variants in this enzyme that are summarised in the Human Cytochrome P450 (CYP) Allele Nomenclature Database15; 75 different CYP2A6 alleles are listed. Low activity forms of this enzyme most commonly occur in Asian populations. Polymorphisms in CYP2E1 have also been described, but their effects on the metabolism of N‐NAs commonly detected in food are not clear (He and Feng, 2015).
In summary, earlier studies performed with human tissue subfractions or tissue cultures have demonstrated the ability not only of liver but also of several extrahepatic organs and tissues, including oesophagus, colon, bladder, bronchi, pancreatic duct and nasal mucosa, to biotransform and bioactivate several N‐NAs. CYPs play a key role in N‐NAs bioactivation, which in most cases consist in the hydroxylation at the α‐carbon position. The most common N‐NAs found in food (NDMA, NMEA, NDEA, NDPA, NDBA, NMA, NSAR, NMOR, NPIP and NPYR) are mostly biotransformed by CYP2E1 and CYP2A6, while CYP2B1 and CYP1A1 are involved to a lesser extent. CYP genetic polymorphisms may at least partly explain the large interindividual variation in the biotransformation of certain N‐NAs observed in in vitro studies.
Levels of N‐NAs in humans
A few studies report measurements of the levels of N‐NAs in humans (urine, blood, tissues etc.). None of these reports addresses the source of these compounds (endogenous vs. exogenous) (see Table A.1 in Appendix A).
Table A.1.
Levels of N‐NAs in humans
| Endpoint | Test item | Results | Comments | References |
|---|---|---|---|---|
| Levels of NDMA, NDEA, NMOR, NDBA in urine of normal donors and bladder cancer patients |
Normal urine samples from 27 male donors (10 smokers and 17 non‐smokers) and 4 samples from bladder cancer patients. Age range: 24–75 years. N‐NAS measured by HPLC/TEA |
Out of the 50 normal samples (multiple sampling from same individuals), 10 contained NDMA (0.02 to 0.10 μg/l), 6 contained NDEA (0.02 to 3.10 μg/l), 9 contained NMOR (0.06 to 0.67 μg/l), none contained NDBA. 2/4 samples from cancer patients, contained NDBA (0.35 and 0.66 μg/l). |
Cigarette smoking was found to be unrelated to the pattern or amount of these N‐NAs. The levels of volatile N‐NAs in urine can vary greatly from individual to individual from day to day. |
Kakizoe et al. (1979) |
| Levels of NDMA, NDEA, NPYR, NPIP, NSAR, NPRO in gastric juice of North China (Lin‐Xian and Fan‐Xian) inhabitants (high‐risk and low‐risk area for gastric cancer) |
353 samples of fasting gastric juice collected from subjects living in Lin‐Xian |
Main N‐NAs in Lin‐Xian: NDMA (mean: 17.09 μg/kg) and NDEA (mean: 6.95 μg/kg) in 95.2% and 95.3% of samples. Lower levels of NPYR, NPRO, NPIP and NSAR (2.45, 2.27, 1.30, 0.58 μg/kg, respectively). The urine of inhabitants of a low‐risk area (Fan‐Xian) contained lower levels of NSAR, NPRO and nitrates than Lin‐Xian inhabitants (data not shown). |
Positive correlation between the lesions of oesophageal epithelium and the amount of N‐NAs present. Exposure of Lin‐Xian subjects to N‐NAs could be either directly via food or by their in vivo formation. |
Lu et al. (1986) |
| Levels of NMEA, NDEA, NDPA, NDBA, NPYR, NPIP, NMOR in gastric juice of 71 patients undergoing upper gastrointestinal endoscopy |
NMEA, NDEA, NDPA, NDBA, NPYR, NPIP, NMOR by GC/MS Measurements of pH and nitrate/ nitrite levels in gastric juice |
N‐NAs mean values: 4.84 nmol/l (range 0–17.7 nmol/l). Main N‐NAs: NDEA (70% of the total N‐NAs; mean: 3.1 nmol/l), NDMA (mean: 0.90 nmol/l) NPYR (mean: 0.38 nmol/l). |
A significant positive correlation between total N‐NAs content and pH at the high pH range. | Dallinga et al. (1998) |
| Levels of NPRO and nitrate in urine of Italian inhabitants (high risk and low‐risk area for gastric cancer, Florence vs. Cagliari) |
Method for NPRO as previously described in Oshima and Bartsch, 1981. 40 men (25–40 years) for each urban areas. On 2 consecutive days, 12‐h urine samples collected from each subject, 1 h after the evening meal. |
Significantly higher levels of NPRO in high‐risk vs. low‐risk area (geometric mean: 0.94 vs. 0.58 μg; Confidence interval: 0.72–1.24 and 0.41–0.83). 12 h urinary excretion of nitrate was similar in the 2 populations studied. |
Questionnaires to collect details of age, current smoking habits and dietary practices. Background NPRO excretion increased with nitrate exposure, but non‐significantly, suggesting that intake of pre‐formed NPRO had more effect on excretion of background NPRO than nitrosation of dietary L‐proline. |
Knight et al. (1992) |
For example, the low levels of NDEA, NDMA and NMOR present in the urine of healthy individuals were found to be unrelated to cigarette smoking, but no alternative source was identified (Kakizoe et al., 1979). In a study to investigate the relevance of N‐NA exposure to oesophageal cancer, levels of NDEA, NDMA, NPIP, NPYR, NPRO and NSAR were measured in the gastric juice of inhabitants of high‐ and low‐risk regions of China. The levels of N‐NAs were positively correlated with the number of oesophageal lesions. The authors concluded that this might reflect exogenous N‐NAs present either in contaminated food/water and/or their formation endogenously in vivo (Lu et al., 1986).
In a separate study, several N‐NAs (NDEA, NMEA, NDBA, NDPA, NPIP, NPYR, NMOR), concentrations of nitrates/nitrites and pH values were measured in the gastric juice of patients undergoing upper GI endoscopy. The authors propose that microbial nitrite formation from enhanced bacterial growth at elevated pH increases nitrosation reactions (Dallinga et al., 1998). These data are consistent with the endogenous formation of N‐NAs. An earlier study showed higher urinary excretion of N‐nitrosoproline in an area of Italy with high gastric cancer incidence compared to an area with low gastric cancer incidence. The authors suggested different dietary exposure to background sources of nitroso compounds in the two regions (Knight et al., 1992).
The Panel concludes that these studies do not discriminate between food contamination and endogenous production as possible origins of N‐NAs in humans.
DNA adducts formation
Convincing evidence for DNA adduct formation in a human exposed to NDMA was obtained in a study of human liver autopsy samples (Herron and Shank, 1980). They obtained 12 frozen samples of human liver, kidney and heart from recently deceased individuals. They successfully isolated DNA from 7 of these samples and analysed it for 7‐Me‐Gua and O 6 ‐Me‐Gua using a validated HPLC‐fluorescence detection method. Only two of the seven samples had clearly measurable levels of 7‐Me‐Gua and O 6 ‐Me‐Gua. These two samples contained 1363–1373 μmol of 7‐Me‐Gua and 273 to 317 μmol of O 6 ‐Me‐Gua per mol of guanine and came from the liver of a 23‐year‐old victim of NDMA poisoning while the other samples were from unrelated causes (Herron and Shank, 1980). From the DNA methylation levels, it was estimated that the NDMA‐poisoning victim had been exposed to a dose of 20 mg or more of NDMA per kg of body weight, as estimated from animal studies. These results confirm the identical metabolic activation process in a human to that observed in laboratory animals.
DNA adducts were also measured in several studies in attempts to clarify the role of N‐NAs in human cancer. Comparisons were made between normal mucosa and oesophageal and/or stomach cancers of patients from areas of high and low cancer risk (Umbenhauer et al., 1985; Lu et al., 1986; Palli et al., 2001; Totsuka et al., 2019). Most of these studies reported levels of DNA O 6 ‐Me‐Gua, with a few reports on O 6 ‐Et‐Gua, O 4 ‐Et‐Thy and O 4 ‐Me‐Thy (for details see Appendix A Table A.1). Levels of DNA O 6 ‐Me‐Gua were higher in individuals from an area of China with a high risk of gastric cancer compared to those in individuals from regions in Europe (France and Germany) or China with a lower cancer incidence (Umbenhauer et al., 1985; Lu et al., 1986).
A study in which DNA O 6 ‐Me‐Gua was measured in peripheral blood leucocytes of 407 individuals from 17 populations living in 13 countries with different gastric cancer rates, revealed a high prevalence of positive samples from Japan and Portugal both of which have extremely high gastric cancer rates (Eurogast Study Group, 1994).
In line with these findings, relatively high levels of DNA O 6 ‐alkylguanines (O 6 ‐Me‐Gua, O 6 ‐ButylGua, O 6 ‐PropylGua) were found in gastric cancer cases from an area of central Italy with an unusually high incidence of gastric cancer. Estimated intakes based on measurements of NDMA and dimethylamine concentrations in foods from local markets correlated with total levels of DNA O6‐alkylguanines. Although based on a small series of cases, these findings support a causal role for dietary N‐NAs in the aetiology of gastric cancer (Palli et al., 2001).
More recently, measurements of multiple DNA adducts by mass spectrometry (DNA adductomics) have implicated the rat oesophageal carcinogen NPIP in the aetiology of oesophageal cancer in an area of high cancer incidence in China (Cixian) (Totsuka et al., 2019). The study identified several different DNA adducts that were more abundant in samples from the high‐risk compared to a low‐risk area. One of these was N 2 ‐THP‐dGua, the main DNA adduct produced by NPIP. NPIP was mutagenic both in vitro and in vivo. AT > CG transversions followed by GC > AT and AT > GC transitions were the main mutations identified in liver and oesophagus of NPIP‐treated transgenic rats. A similar mutational pattern was observed in one of the mutational signatures (Signature C which was similar to signature 17 in the COSMIC database with an unknown aetiology) identified by whole exome sequencing of oesophageal tumours from the high‐risk area. This signature was weakly correlated with N 2 ‐THP‐dGua levels in the blood of oesophageal cancer patients, indicating that NPIP‐induced DNA adducts are partly involved in oesophageal carcinogenesis.
These new data are in line with the older studies. They suggest that N‐NAs other than those producing DNA O 6 ‐Me‐Gua and O 6 ‐Et‐Gua/O4‐Et‐Thy contribute to the development of human cancer. The source(s) of these carcinogenic N‐NAs still remains to be determined, however.
Measurements of DNA O 6 ‐Me‐Gua in colorectal mucosa of patients with GI tract disorders (Hall et al., 1991) or in paired normal and tumour samples of CRC patients (Jackson et al., 1996; Povey et al., 2000), proved to be uninformative as to the role of this alkylated base in the aetiology of colorectal cancer (Jackson et al., 1996; Povey et al., 2000).
In summary, these observations generally implicate N‐NAs in the aetiology of human cancer (mainly stomach, oesophagus, colon). Most of the studies of DNA adducts do not specifically identify N‐NAs as their source. It remains to be determined whether exposure to N‐NAs reflects their endogenous formation or occurs via food/water. The specific exceptions are the study on human poisoning by NDMA and possibly the N 2 ‐THP‐dGua study from NPIP exposure in China.
3.1.2. Toxicity in experimental animals
3.1.2.1. Acute toxicity studies
The following chapter provides a summary of the animal studies and the details on the studies in the form of tables. Whenever appropriate, the text and the tables are subdivided into acyclic volatile and non‐volatile N‐NAs and cyclic/aromatic N‐NAs.
3.1.2.1.1. Acyclic volatile N‐NAs
Acute toxicity studies on the acyclic volatile N‐NAs NDMA, NMEA, NDEA, NDPA, NDIPA, NEIPA and NMVA are compiled in Table C.1 of Appendix C. No acute toxicity studies could be retrieved for NMBA.
Table C.1.
Acute toxicity studies on the acyclic (volatile) N‐NAs NDMA, NMEA, NDEA, NDPA, NDIPA, NEIPA and NMVA
| Reference | Species/Dose route/Doses | Observed effects | Lowest dose with effect (mg/kg bw) | LD50 (mg/kg bw) |
|---|---|---|---|---|
| NDMA | ||||
| Barnes et al. (1954) | Rat, albino (M, F), i.p. | 26.5 | ||
| Druckrey et al. (1967) | Rat, BD (M, F), gavage | 40 | ||
| Druckrey et al. (1967) | Rat, BD (M, F), i.p. | 43 | ||
| Korsrud et al. (1973) |
Rat, SD (M) Gavage: 0, 0.3, 0.7, 1.9, 5.1, 13.7, 37 or 100 mg/kg bw |
Hepatic vacuolation Centrolob. congestion ↑Transaminases | 1.9 5.1 13.7 | |
| Stewart et al. (1975) | Rat, Wistar (F), i.p. | Reduced protein synthesis in liver; Centrolobular necrosis | 20 | |
| Maduagwu et al. (1980) | Rat, Wistar (M) Gavage: 0 or 50 mg/kg bw | ↑ ALT, AST, Bilirubin | 50 | |
| Nishie (1983) | Rat, Holtzman (F), gavage | ↓ Survival, hepatic necrosis | 20 | |
| Sumi et al. (1983) | Rat, Wistar (M) Gavage: 0, 8, 9 or 10 mg/kg bw | ↓ Survival Hepatic necrosis, ↑ ALT, AST | 8 8 | |
| Frei et al. (1970) | Mouse, CFW/D (M, F), i.p. | 19.2 | ||
| Mirvish and Kaufman (1970) | Mouse, SWR (M, F), i.p. | 100% lethality | 20 | |
| Tomatis et al. (1964) |
Hamster, Syrian Golden (M, F), gavage |
28.3 (M), 33.6 (F) | ||
| Haas et al. (1973) | Hamster, Syrian Golden (M, F), s.c. | 28 (M), 34 (F) | ||
| Mohr et al. (1974) | Hamster, European (M, F), s.c. | 28 (M), 43 (F) | ||
| Reznik (1975) | Hamster, Chinese (M, F), s.c. | 17.7 (M, F) | ||
| Ungar et al. (1984) | Hamster, Golden (M) Drinking water 0 or 2 mg/100 mL Duration: 24 h | Hepatic venopathy | 2 | |
| Maduagwu et al. (1980) | Guinea pig, Hartley (M), gavage | ↑ ALT, AST, ALP, Bilirubin | 50 | |
| Maduagwu et al. (1980) | Cat (M), gavage | ↓ Survival ↑ ALT, AST, ALP | 50 | |
| Maduagwu et al. (1980) | Monkey, African Green (M), gavage | ↑ rel liver weight ↑ ALT, AST | 50 | |
| NMEA | ||||
| Druckrey et al. (1967) | Rat, BD (M, F), gavage | 90 | ||
| NDEA | ||||
| Druckrey et al. (1967) | Rat, BD (M, F), gavage | 280 | ||
| Stewart et al. (1975) | Rat, Wistar (F), i.p. | ↓ Protein synthesis in liver Centrolobular necrosis | 250 | |
| Mukherjee and Ahmad (2015) | Rat, Wistar (M), i.p. | Hepatic necrosis ↑ AST, ALT | 100 200 | |
| Schmähl et al. (1963) | Mouse, DB (M, F), s.c. | Hepatic necrosis | 180 | |
| Mirvish and Kaufman (1970) | Mouse, SWR (M, F), i.p. | ↓ Survival | 280 | |
| Mohr et al. (1966) | Hamster, Syrian Golden (?), s.c. | 178 | ||
| Witschi, 1973 | Hamster, Syrian Golden (M), s.c. | ↓ Survival, liver damage ↓ hepatic protein synthesis | 200 | |
| Mohr et al. (1972) | Hamster, European (?), s.c. | 246 | ||
| Reznik et al. (1976) | Hamster, Chinese (M, F), s.c. | 232 (M, F) | ||
| NDPA | ||||
| Druckey et al. (1967) | Rat, BD (M, F), gavage | – | 480 | |
| Pour et al. (1973); Althoff et al. (1973) | Rat, SD (M, F), s.c. | 487 | ||
| Reznik et al. (1975) | Rat, SD (M, F), s.c. |
Haemorrhages in lung and stomach |
487.2 | |
| Dickhaus et al. 1977) | Mouse, NMRI (F), s.c. | 689 | ||
| Pour et al. (1973) | Hamster, Syrian Golden (M, F), s.c. | Liver necrosis, haemorrhages in lung, heart and kidney | 600 | |
| NDIPA | ||||
| Druckey et al. (1967) | Rat, BD (M, F), gavage | 850 | ||
| NEIPA | ||||
| Druckrey et al. (1967) | Rat, BD (M, F), oral application | 1,100 | ||
| NMVA | ||||
| Druckrey et al. (1967) | Rat, BD (M, F), gavage | 24 | ||
In male and female rats, the LD50 of NDMA was found to be 40 mg/kg bw after gavage and 26.5–43 mg/kg bw, when applied i.p. (Barnes and Magee, 1954; Druckrey et al., 1967). In rats, liver damage, as indicated by hepatocellular vacuolation and necrosis and increased serum transaminases, was reported after 1.9–50 mg/kg bw (gavage) and 20 mg/kg bw (i.p.) (Korsrud et al., 1973; Stewart et al., 1975; Maduagwu and Bassir, 1980; Nishie, 1983; Sumi and Miyakawa, 1983). A single i.p. dose of 19.2 mg/kg bw was determined to be the LD50 for CFW/D mice, while 20 mg/kg bw induced 100% lethality in SWR mice (Frei, 1970; Mirvish and Kaufman, 1970). In hamsters, LD50 values were obtained between 28.3 and 33.6 mg/kg bw (gavage) and 17.7–43 mg/kg bw (s.c.) with no clear difference between strain or sex of the animals (Tomatis et al., 1964; Haas et al., 1973; Mohr et al., 1974; Reznik et al., 1975). Ungar et al. (1984) reported on a hepatic venopathy (loss of endothelia of medium‐sized branches of portal veins, surrounded by oedematous connective tissue) in hamster after exposure to 2 mg/kg bw via drinking water for 24 h. Maduagwu and Bassir (1980) treated male guinea pigs, cats and African Green monkeys with 50 mg/kg bw via gavage. In all three species, liver damage was induced as shown by elevated levels of serum transaminases, alkaline phosphatase and/or bilirubin; reduced survival was reported for the cats and increased relative liver weights for the monkeys.
The acute toxicity of NMEA was tested only in male and female rats, treated via gavage; an LD50 of 90 mg/kg bw was obtained (Druckrey et al., 1967).
Following gavage of male and female rats with NDEA, an LD50 of 280 mg/kg bw was derived (Druckrey et al., 1967). In male and female Wistar rats, centrolobular hepatic necrosis reduced protein synthesis of the liver and increased serum transaminases were found after single i.p. applications of 100–250 mg/kg bw (Schmähl et al., 1963, Stewart et al., 1975; Mukherjee and Ahmad, 2015). A single s.c. application of 180 mg/kg bw reduced the survival of mice (Mirvish and Kaufman, 1970). The LD50 was similar for Syrian, European and Chinese Golden hamsters, ranging between 178 and 246 mg/kg bw (Mohr et al., 1966, 1972; Reznick, 1976).
For NDPA, the LD50 was around 480 mg/kg bw when applied by gavage or s.c. to BD or SD rats of both sexes (Druckrey et al., 1967; Pour et al., 1973; Althoff et al., 1973; Reznik et al., 1975). The LD50 values for female NMRI mice and male and female Syrian Golden hamsters were in a similar range, i.e. 689 and 600 mg/kg bw, respectively (Pour et al., 1973; Dickhaus et al., 1977).
In male and female BD rats, Druckrey et al. (1967) determined the following LD50 values: 850 mg/kg bw for NDIPA, 1,100 mg/kg bw for NEIPA and 24 mg/kg bw for NMVA.
In summary, within the acyclic volatile N‐NAs, the acute toxicity was highest for NDMA and NMVA, with LD50 values of at least 17.7 mg/kg bw (hamster; s.c.) and 24 mg/kg bw (rat; gavage), respectively. This was followed by LD50 values of at least 90 mg/kg bw for NMEA (rat; gavage), 178 mg/kg bw for NDEA (hamster; s.c.), 480 mg/kg bw for NDPA (rat; gavage), 850 mg/kg bw for NDIPA (rat; gavage) and finally 1,100 mg/kg bw for NEIPA (rat; p.o.). The acute toxicity of the individual acyclic volatile N‐NAs appears to be relatively independent of the species, strain and sex of the animals tested as well as of the route of administration.
3.1.2.1.2. Acyclic non‐volatile N‐NAs
Acute toxicity studies on the acyclic non‐volatile N‐NAs NDBA, NDIBA, NMA, NEA and NSAR are compiled in Table C.2 of Appendix C. No studies could be retrieved for NDBzA, NMAMPA and NMAMABA.
Table C.2.
Acute toxicity studies on the acyclic (non‐volatile) N‐NAs NDBA, NDIBA, NMA (N‐nitrosomethylaniline), NEA and NSAR
| Reference | Species/Dose route/Doses | Observed effects | Lowest dose with effect (mg/kg bw) | LD50 (mg/kg bw) |
|---|---|---|---|---|
| NDBA | ||||
| Druckrey et al. (1967) | Rat, BD (M, F), gavage | 1,200 | ||
|
Druckrey et al. (1967) |
Rat, BD (M, F), s.c. | 1,200 | ||
| Althoff et al. (1971) | Hamster, Chinese (M), s.c. | Acute liver dystrophy, necrosis in kidney, adrenals and heart | 561 | |
| Althoff et al. (1971) | Hamster, Syrian Golden (M), s.c. | 1,750 | ||
| Althoff et al. (1973) | Hamster, Syrian Golden (M, F), gavage | 2,150 | ||
| Althoff et al. (1973) | Hamster, Syrian Golden (M, F), i.p. | 1,200 | ||
| Althoff et al. (1973) | Hamster, Syrian Golden (M, F), s.c. | 1,750 | ||
| Althoff et al. (1974) | Hamster, European (M, F), s.c. | 2,462 (M), 1,866 (F) | ||
| Reznik et al. (1976) | Hamster, European (M, F), s.c. | 1,420 | ||
| NDIBA | ||||
| Althoff et al. (1975) | Hamster, Syrian Golden (M, F), s.c. | 5,600 (M), 6,600 (F) | ||
| NMA | ||||
|
Druckrey et al. (1967) |
Rat, BD (M, F), gavage | – | 280 | |
| Goodall et al. (1970) | Rat, albino (M, F), gavage | 336 (M), 225 (F) | ||
| Goodall et al. (1970) | Hamster, Syrian Golden (M), gavage | Fat vacuoles in hepatocytes | 150 | |
| NEA | ||||
| Pubchem (a) and ChemIDplus (b) | Rat (strain, sex not specified), p.o. | Lethality | 180 | |
| Pubchem (a) and ChemIDplus (b) | Rat (strain, sex not specified), i.p. | Lethality | 180 | |
| NSAR | ||||
| Druckrey et al. (1967) | Rat, BD (M, F), gavage | 5,000 | ||
| Wogan et al. (1975) | Mouse, newborn C57Bl/6JxC3HeB/FeJ (M, F) i.p. on PP day 1 | 184 | ||
| Friedman and Couch (1976) | Mouse, Swiss (M), i.p. | 3,500 | ||
In male and female rats, the LD50 of NDBA was 1,200 mg/kg bw, independent of whether the compound was applied s.c. or by gavage (Druckrey et al., 1967). Althoff et al. (1971, 1973, 1974) and Reznik et al. (1976) used Syrian and European hamsters and reported LD50 values of 1,200–2,462 mg/kg bw after gavage or s.c. or i.p. application with no clear differences between both strains or male and female animals. Male, s.c.‐treated Chinese hamsters, however, exhibited a considerably lower LD50 of 561 mg/kg bw (Althoff et al., 1971).
When NDIBA was applied s.c. to Syrian Golden hamsters, Althoff et al. (1975) determined an LD50 of 5,600 mg/kg bw for males and of 6,600 mg/kg bw for females.
In two independent studies, NMA was given to male and female rats by gavage; the resulting LD50 values ranged between 225 and 336 mg/kg bw (Druckrey et al., 1967; Goodall et al., 1970). Using the same route of administration, male Syrian Golden hamsters showed a somewhat lower LD50 of 150 mg/kg bw (Goodall et al., 1970).
A study on NEA, published in 1968 in Russian and cited by PubChem and ChemIDplus, indicated lethality in rats when treated with 180 mg/kg bw orally or via i.p. application.
One study with gavage of male and female rats obtained an LD50 for NSAR of 5,000 mg/kg bw (Druckrey et al., 1967). Similarly, male Swiss mice showed an LD50 of 3,500 mg/kg bw when the N‐NA was given i.p. (Friedman and Couch, 1976). In male and female newborn mice, however, the LD50 was significantly lower, i.e. 184 mg/kg bw (Wogan et al., 1975).
In summary, NMA and NEA were the most toxic compounds within the acyclic non‐volatile N‐NAs with an LD50 value of 150 mg/kg bw for NMA (hamster; gavage) and considerable lethality reported for NEA at 180 mg/kg bw (rat, p.o.). NDBA, NDIBA and NSAR exerted toxicity above 500 mg/kg bw in adult animals.
3.1.2.1.3. Cyclic and aromatic N‐NAs
The acute toxicity studies for the cyclic volatile N‐NAs, NMOR, NPIP, NTHZ and NPYR, for the cyclic non‐volatile NPRO and for the aromatic NDPheA are given in Table C.3 of Appendix C. No data could be retrieved for the cyclic non‐volatile N‐NAs NHPYR, NMTHZ, NHMTHZ, NHPRO, NTCA, NMTCA, NHMTCA, NOCA, NMOCA and NPIC.
Table C.3.
Acute toxicity studies for NMOR, NPIP, NTHZ, NPYR, NPRO and NDPheA
| Reference |
Species Dose route Doses |
Observed effects | Lowest dose with effect (mg/kg bw) | LD50 (mg/kg bw) |
|---|---|---|---|---|
| NMOR | ||||
| Lee and Lijinsky (1966) | Rat, Wistar (M), i.p. | 320 | ||
| Druckrey et al. (1967) | Rat, BD (M, F), gavage | 320 | ||
| Druckrey et al. (1967) | Rat, BD (M, F), i.p. | 320 | ||
| Druckrey et al. (1967) | Rat, BD (M, F), i.v. | 98 | ||
| Stewart et al. (1975) | Rat, Wistar (F), i.p. | ↓hep. protein synthesis centrolobular necrosis | 400 | |
| Nishie et al. (1984) | Rat, SD (M), s.c. | ↓ rel liver weight ↑ ALT, AST, ↑ mitosis in liver | 100 | |
| Grasl‐Kraupp et al. (2000) | Rat, Wistar (M), gavage | Hep. centro‐lobular necrosis | 250 | |
| Haas et al. (1973) | Hamster, Syrian Golden (M, F), s.c. | 492 (M), 562 (F) | ||
| Mohr et al. (1974) | Hamster, European (M, F), s.c. | 493 (M), 429 (F) | ||
| Reznik et al. (1976) | Hamster, Chinese (M, F), s.c. | 163 (M, F) | ||
| Mohr et al. (1979) | Hamster, Syrian Golden (M, F), s.c. | 492 (M), 562 (F) | ||
| Ketkar et al. (1983) | Hamster, Syrian Golden (M, F), gavage | 956 (M), 1,149(F) | ||
| Cardesa et al. (1990) | Hamster, Syrian Golden (M, F), gavage | 735 (M), 615 (F) | ||
| NPIP | ||||
| Lee and Lijinsky (1966) | Rat, Wistar (M), i.p. | 85 | ||
| Druckrey et al. (1967) | Rat, BD (M, F), gavage | 200 | ||
| Druckrey et al. (1967) | Rat, BD (M, F), s.c. | 100 | ||
| Druckrey et al. (1967) | Rat, BD (M, F), i.v. | 60 | ||
| Haas et al. (1973) | Hamster, Syrian Golden (M, F), s.c. | 324 (M), 283 (F) | ||
| Althoff et al. (1974) | Hamster, Syrian Golden (M, F), s.c. | 324 | ||
| Mohr et al. (1974) | Hamster, European (M, F), s.c. | 226 | ||
| Reznik et al. (1976) | Hamster, Chinese (M, F), s.c. | 113 | ||
| Mohr et al. (1979) | Hamster, Syrian Golden (M, F), s.c. | 324 (M), 283 (F) | ||
| Cardesa et al. (1990) | Hamster, Syrian Golden (M, F), gavage | 735 (M), 617 (F) | ||
| NTHZ | ||||
| Nishie et al. (1984) | Rat, SD, (M), s.c. | 1,950 | ||
| NPYR | ||||
| Lee and Lijinsky (1966) | Rat, Wistar (M), i.p. | 650 | ||
| Druckey et al. (1967) | Rat, BD (M, F), gavage | – | 900 | |
| Ketkar et al. (1982) | Hamster, Syrian Golden (M, F), gavage | 1,318 (M), 1,023 (F) | ||
| NPRO | ||||
| Mirvish et al. (1980) | Rat, MRC Wistar (M), i.p. | 4,500 | ||
| Nagasawa et al. (1973) | Mouse, Swiss (sex not specified), i.p. | 203 | ||
| NDPheA | ||||
| Druckrey et al. (1967) | Rat, BD (M, F), gavage | 3,000 | ||
| ECHA, 2017 (a) | Rat, Wistar (F), gavage | > 2,000 | ||
Acute toxicity studies for NMOR in male and female rats provided LD50 values of 320 mg/kg bw, independent of whether the compound was applied via gavage or i.p.; when given i.v., the LD50 dose was about one‐third (Lee and Lijinsky, 1966; Druckrey et al., 1967). NMOR mainly affected the liver, reducing the relative organ weight and inducing centrolobular necrosis with subsequent raises in serum transaminases, followed by regenerative cell replication (Stewart et al., 1975; Nishie et al., 1984; Grasl‐Kraupp et al., 2000). Acute toxicity studies on NMOR in mice could not be retrieved. The LD50 values in hamsters ranged between 163 and 1149 mg/kg bw, with no clear differences between strains or male and female animals (Haas et al., 1973; Mohr et al., 1974; Reznik et al., 1976; Mohr, 1979; Ketkar et al., 1983; Cardesa et al., 1990).
In male and female rats, NPIP showed an LD50 at 60 mg/kg bw (i.v. application), 85 mg/kg bw (i.p. application), 100 mg/kg bw (s.c. application) and 200 mg/kg bw (gavage) (Lee and Lijinsky, 1966; Druckrey et al., 1967). Acute toxicity studies in mice could not be identified. NPIP was applied to hamsters mostly via s.c. injection, providing LD50 values between 113 and 324 mg/kg bw (Haas et al., 1973; Althoff et al., 1974; Mohr et al., 1974; Reznik et al., 1976; Mohr, 1979). When given via gavage, the LD50 was somewhat higher, i.e. 735 mg/kg bw in males and 617 mg/kg bw in female Syrian Golden hamster (Cardesa et al., 1990).
A single acute toxicity study on NTHZ was carried out in male SD rats showing an LD50 of 1950 mg/kg bw (s.c.) (Nishie et al., 1984).
Two studies on NPYR in rats reported an LD50 of 900 mg/kg bw (gavage) and 650 mg/kg bw (i.p. application) (Lee and Lijinsky, 1966; Druckrey et al., 1967). In hamsters, the LD50 value was somewhat higher in male (1,318 mg/kg bw) than in female animals (1023 mg/kg bw) when NPYR was applied via gavage (Ketkar et al., 1982)
The LD50 of NPRO was 4,500 mg/kg bw in male rats, subjected to i.p. application (Mirvish et al., 1980); using the same route of administration in Swiss mice, an LD50 value of 203 mg/kg bw was derived (Nagasawa et al., 1973).
In two independent gavage studies in rats on NDPheA, the LD50 value was determined to be above 2,000 mg/kg bw (Druckrey et al., 1967; ECHA16).
To conclude for the cyclic/aromatic N‐NAs tested, the lowest LD50 values reported were 60 mg/kg bw for NPIP (rat; i.v.), 98 mg/kg bw for NMOR (rat; i.v.), 203 mg/kg bw for NPRO (mouse; i.p.) and 650 mg/kg bw for NPYR (rat; i.p.). NTHZ and NDPheA exerted significant acute toxicity at doses above 1,000 mg/kg bw.
3.1.2.2. Repeated dose toxicity studies
3.1.2.2.1. Acyclic N‐NAs
Repeated dose toxicity studies on the acyclic volatile NDMA and NDEA are compiled in Table D.1 of Appendix D. No studies could be retrieved for the acyclic (volatile) N‐NAs NMEA, NDPA, NDIPA, NEIPA, NMBA and NMVA and for the acyclic non‐volatile N‐NAs NDBA, NDIBA, NMA, NEA, NSAR, NDBzA, NMAMPA and NMAMABA.
Table D.1.
Repeated dose toxicity studies on NDMA and NDEA
| Reference | Species/Experimental design and doses | Most sensitive endpoint | Highest dose with no effect (mg/kg bw per day) | Lowest dose with effect (mg/kg bw per day) |
|---|---|---|---|---|
| NDMA | ||||
| Barnes et al. (1954) |
Rat, albino (M, F) No./sex/group: not specified Diet: 0, 50, 100, 200 ppm; equivalent to 0, 2.5, 5, 10 mg/kg bw per day(a) Duration: up to 110 days |
↓ Body weight ↓ Survival and hepatic necrosis |
2.5 |
2.5 5 |
| Khanna and Puri (1966) | Rat, albino (sex not specified) No./group: > 5 Diet: 0 or 75 ppm, equivalent to 6.75 to 9 mg/kg bw per day(a) Duration: 1, 2, 4, 8, or 12 weeks | Hepatic necrosis (1–8 weeks) | 6.75–9 | |
| Reuber (1975) | Rat, Buffalo (M, F) No./sex/group: 12 Diet: 0 or 0.0114%; equivalent to 10.3 mg/kg bw per day(a) Duration: 12 weeks | Hepatic vein thrombosis and fibrosis (F) | 10.3 | |
| Maduagwu et al. (1980) | Rat, Wistar (M) No./group: 10 Gavage: 0, 1 or 5 mg/kg bw per day Duration: 5–11 days (5 mg), 30 days (1 mg) | ↓ Survival ↑ ALT, AST, Bilirubin ↑ ALP |
1 1 |
5 1 5 |
| Sykora et al. (1985) | Rat, newborn Wistar (M, F) No./sex/group: > 6 i.p. application: 0, 0.2, 0.4 or 0.5 mg/kg bw per day Duration: postnatal day 1–20 (0), day 1–5 (0.2 mg), day 1–10 (0.4 mg), day 1–20 (0.5 mg) | ↓ Survival ↓ body weight | −/0.2 |
0.2 (M, F) 0.2/0.4 (M, F) |
| Roszczenko et al. (1996) (from ATSDR 2022) |
Rat, Wistar (M) No./group: 7 Drinking water: 0, 0.002 mg/kg bw per day Duration: 10 days |
↑ Serum AST, ALT, ALP and GGT |
0.002 | |
| Roszczenko et al. (1996) (from ATSDR 2022) |
Rat, Wistar (M) No./group: 7 0, 0.0007, 0.0016, 0.0035 mg/kg bw per day Duration: 10 days |
↓ Serum total and latent iron binding capacity |
0.0007 | 0.0016 |
| Chooi et al. (2016) | Rat, Wistar (M) No./group: > 5 i.p. application: 0 or 10 mg/kg bw on 3 days/week: equivalent to 0 or 4.3 mg/kg bw per day, Duration: 4 weeks | ↓ Body weight gain Liver fibrosis | 4.3 | |
| Terracini et al. (1966) | Mouse, Swiss (M, F) No./sex/group: > 12 Drinking water: 0 or 0.005%; equivalent to 0 or 9 mg/kg bw per day(a) Duration: 1 week |
↓ Survival |
9 | |
| Anderson et al. (1986) | Mouse, A/J (M) No./group: 10 Drinking water: 0 or 50 ppm; equivalent to 9 mg/kg bw per day(a) Duration: 1, 2 or 4 weeks | ↓ Body weight (1 week) ↑ hepatic NDMA demethylase activity (1 week) centrolobular liver damage (1 week) | 9 | |
| Ungar et al. (1984) | Hamster, Golden (M) No./group: not specified Drinking water: 0 or 2 mg/100 mL; (100 mL drinking water/kg bw per day assumed) equivalent to 0 or 2 mg/kg bw per day(c) Duration: 2–14 days or 28 days | ↓ Survival Portal venopathy | 2 2 | |
| Ungar et al. (1986) | Hamster, Syrian Golden (M) No/group: > 3 Drinking water: 0 or 2 mg/100 mL (100 mL drinking water/kg bw per day assumed) equivalent to 0 or 2 mg/kg Duration: 8, 12 or 16 weeks | ↓ Survival Hepatic venopathy | 2 2 | |
| Maduagwu et al. (1980) | Guinea pig, Hartley (M) No./group: 10 Gavage: 0, 1 or 5 mg/kg bw per day Duration: 30 days (1 mg), 5–11 days (5 mg) | ↓ Survival ↑ ALT, AST, ↑ ALP, bilirubin |
1 1 |
5 1 5 |
| Magee et al. (1956) | Rabbit (M) No./group: 6 Diet: 20 ppm (10 weeks) followed by 30 ppm (4 weeks) and 50 ppm (8 weeks); equivalent to 1.5, 2.25 or 3.75 mg/kg bw per day(b); no control Duration: 22 weeks | ↓ Survival Hepatic fibrosis | 1.5–3.75 | |
| Sheweita et al. (2017) | Rabbit, New Zealand (M) No./group: 5 Oral route (not specified): 0 or 0.5 mg/kg bw per day Duration: 12 weeks | Hepatic necrosis and fibrosis ↑ hepatic TBARS ↓ activity of hepatic SOD, catalase, GST and GPx ↓ hepatic GSH content | 0.5 | |
| Carter et al. (1969) | Mink (M) No./group: 3–6 Diet: 0, 2.5, 5 ppm; equivalent to 0, 0.32 or 0.63 mg/kg bw per day(b) Duration: 32–34 days | ↓ Survival Hepatic necrosis | 0.32 | |
| Strombeck et al. (1983) |
Dog (sex not specified) No./group: 12 Oral: 2.5 μl/kg bw on 2 days/week, equivalent to 0.67 mg/kg bw per day Duration: 3 weeks |
↓ Survival Hepatic necrosis ↑ ALT, AST ↑ ALP, bilirubin |
0.67 |
|
| Maduagwu et al. (1980) | Cat (M) No./group: 6 Gavage: 0, 1 or 5 mg/kg bw per day Duration: 5–11 days (5 mg), 30 days (1 mg), | ↓ Survival ↑ ALT, AST ↑ ALP, bilirubin | 1 | 1 1 5 |
| Maduagwu et al. (1980) | Monkey, African Green (M) No./group: 6 Gavage: 0, 1 or 5 mg/kg bw per day Duration: 5–11 days (5 mg), 30 days (1 mg) | ↓ Survival ↑ ALT, AST, ALP |
1 1 |
5 5 |
| NDEA | ||||
| Takayama et al. (1975) | Rat, Donryu (M) No./group: 24 Drinking water: 50 ppm; equivalent to 6 mg/kg bw per day(a); no control Duration: 3 weeks | Areas of liver hyperplasia | 6 | |
| Rapp et al. (1965) |
Rabbit, New Zealand (F, M) No./group: 3–13 Drinking water: 0, 42, 126, 378 or 1,134 mg/L on 6 days/week (1.4 kg bw reported and assuming 100 mL/kg bw water consumption/day) equivalent to 0, 3.6, 10.8, 32.4 or 97.2 mg/kg bw per day Duration: 4 weeks |
↓ Survival | 3.6 | 10.8 |
| Sheweita et al. (2017) | Rabbit, New Zealand (M) No./group: 5 Oral route (not specified): 0 or 0.5 mg/kg bw per day Duration: 12 weeks | Hepatic necrosis and fibrosis ↑ hepatic TBARS ↓ activity of hepatic SOD, catalase, GST and GPx ↓ hepatic GSH content | 0.5 | |
NDMA was applied to male and female rats via diet (2.5–10.3 mg/kg bw per day), drinking water (0.0007–0.0035 mg/kg bw per day), gavage (1–5 mg/kg bw per day) or i.p. applications (0.2–4.3 mg/kg bw per day) for 5–110 days. The most sensitive endpoint was a decreased total and latent iron binding capacity in the serum at 0.0016 mg/kg bw per day after 10 days of treatment (Roszczenko et al., 1996 as reported in ATSDR, 2022). Reduced survival and body weight gain was reported at already 0.2 mg/kg bw per day, applied i.p. on post‐natal days 1–5 (Sykora et al., 1985). In young adult animals, 5 mg/kg bw per day affected survival and ≥ 2.5 mg/kg bw per day affected body weight gain (Barnes et al., 1954; Chooi et al., 2016). Liver damage was documented by elevated serum transaminases (0.002 mg/kg bw per day for 10 days), hepatic necrosis (≥ 5 mg/kg bw per day for 7–110 days), hepatic vein thrombosis (10.3 mg/kg bw per day for 12 weeks) and hepatic fibrosis (≥ 4.3 mg/kg bw per day for 4–12 weeks) (Barnes and Magee 1954; Khanna and Puri, 1966; Reuber, 1966; Maduagwu et al., 1980; Roszczenko et al., 1996 as reported in ATSDR, 2022; Chooi et al., 2016).
Terracini et al. (1966) reported reduced survival of male and female Swiss mice at 9 mg/kg bw per day provided via drinking water for 7 days. Anderson et al. (1986) applied the same dose to male A/J mice and found reduced body weights and centrolobular hepatic necrosis after 1 week of treatment.
Ungar (1984, 1986) reported the development of a hepatic occlusive venopathy and the reduced survival of hamsters, treated with 2 mg/kg bw per day via drinking water for up to 16 weeks.
In guinea pigs, gavage of 1 mg/kg bw per day for 30 days elevated serum transaminases and 5 mg/kg bw per day for 5–11 days reduced the survival of the animals (Maduagwu et al., 1980).
Magee and Barnes (1956) showed reduced survival and toxic liver fibrosis in male rabbits receiving 1.5–3.75 mg/kg bw per day in the diet for 22 weeks. NDMA caused hepatic necrosis in male New Zealand rabbits, when applied orally at 0.5 mg/kg bw per day for 12 weeks (Sheweita et al., 2017). This was associated with lipid peroxidation, as determined by increased thiobarbituric acid‐reactive substances (TBARS) and decreased activity of superoxide dismutase (SOD), catalase, glutathione‐S‐transferases (GST) and glutathione‐peroxidases (GPx) as well as overall reduced glutathione (GSH) content in the liver. The effects on testicular tissue are given in Section 3.1.2.6.2 on Reproductive effects.
Male minks, exposed to 0.32 mg/kg bw via diet for about 1 month, showed hepatic necrosis and reduced survival (Carter et al., 1969).
In dogs, 0.67 mg/kg bw per day for 3 weeks reduced survival and caused hepatic necrosis and increases in serum transaminases as well as bilirubin and alkaline phosphatase (ALP) (Strombeck et al., 1983).
Gavage of 1 mg/kg bw per day for 30 days reduced the survival of male cats; the increase in serum transaminases, ALP and bilirubin indicated toxic liver damage (Maduagwu and Bassir, 1980).
In male African Green monkeys 5 mg/kg bw per day, applied by gavage for 5–11 days, raised the serum ALT, AST and ALP levels and lowered the survival of the animals (Maduagwu et al., 1980).
NDEA induced areas of liver hyperplasia, seen in histological sections of male rats, receiving 6 mg/kg bw per day for 3 weeks in the drinking water (Takayama and Hitachi‐Masahito Yamada, 1975). Rapp et al. (1965) reported reduced survival of male and female New Zealand rabbits when treated with 10.8 mg/kg bw per day via drinking water for 4 weeks. Like NDMA, NDEA induced liver necrosis in male New Zealand rabbits, exposed to 0.5 mg/kg bw per day for 12 weeks (Sheweita et al., 2017). Intrahepatic lipid peroxidation and reduced activities of superoxide dismutase, catalase, glutathione‐S‐transferases and glutathione‐peroxidases and a lowered glutathione content were reported as well. The NDEA effects on the testes are described in Section 3.1.2.6.2 on Reproductive effects.
In summary, NDMA exerted pronounced hepatotoxic effects, which reduced body weight gains and the survival of rats, mice, hamsters and guinea pigs as well as of non‐rodent mammalian species, such as mink, dog, cat, rabbit and monkey. Similar results were reported for NDEA in rats and rabbits.
3.1.2.2.2. Cyclic and aromatic N‐NAs
Repeated dose toxicity studies on the cyclic volatile N‐NAs, NMOR and NPIP and on the aromatic NDPheA are summarised in Appendix D in Table D.2. No data could be retrieved for the cyclic volatile N‐NAs NTHZ and NPYR and the cyclic non‐volatile N‐NAs NHPYR, NMTHZ, NHMTHZ, NPRO, NHPRO, NTCA, NMTCA, NHMTCA, NOCA, NMOCA and NPIC.
Table D.2.
Repeated dose toxicity studies on NMOR, NPIP and NDPheA
| Reference | Species/Experimental design and doses | Most sensitive endpoint | Highest dose with no effect (mg/kg bw per day) | Lowest dose with effect (mg/kg bw per day) |
|---|---|---|---|---|
| NMOR | ||||
| Wanson et al. (1980) |
Rat, SD (sex?) No./sex/group: not specified Drinking water: 0 or 2.4 mg/kg bw per day Duration: 7 weeks |
Ultrastructural changes in hepatocytes | 2.4 | |
| Oberemm et al. (2009) | Rat, Wistar (M) No./sex/group: 7 Drinking water: 0 or 120 mg/L; equivalent to 0 or 10.8 mg/kg bw per day Duration: 7 weeks Observation: further 43 weeks | Induction of GSTp positive preneoplasia Alterations in hepatic transcriptome and proteome patterns | 10.8 | |
| NPIP | ||||
| Flaks and Challis (1980) | Rat, Leeds strain (M) No./sex/group: 6 Drinking water: 0 or 0.02% on 6 days/week; equivalent to 0, 8.6 or 15.4 mg/kg bw per day(a), in dependence of the duration of experiment Duration: 2.5, 5 or 6 months | Centrolobular hepatic vacuolation (2.5 months) Preneoplastic foci (2.5 months) | 8.6–15.4 | |
| Flaks and Challis (1981) |
Rat, Leeds strain (M) No./sex/group: 6–12 Drinking water: 0 or 0.02% on 6 days/week; equivalent to 0 or 20.6 mg/kg bw per day (a) Duration: 12 or 28 days |
Liver: ↓ glycogen, ↑ lipid and smooth endoplasmic reticulum; changed bile canaliculi | 20.6 | |
| NDPheA | ||||
| NCI/NTP 1979 |
Rat, F344 (M, F) No./sex/group: 5 Diet for M: 0, 1,000, 2,000, 3,000, 4,000, 6,000, 8,000 or 10,000 ppm; equivalent to 0, 90, 180, 270, 360, 540, 720, or 900 mg/kg bw per day (a) For F: 0, 4,000, 8,000, 16,000, 24,000, 32,000, 46,000 ppm; equivalent to 0, 360, 720, 1,440, 2,160, 2,880 or 4,260 mg/kg bw per day (a) Duration: 11 weeks |
↓ Survival ↓ Body weight | 720 (F) 270 (M/F) | 1440 (F) 360 (M/F) |
| ECHA, 2017b |
Rat, SD (M, F) No./sex/group: 10 Gavage: 0, 15, 50 or 150 mg/kg bw per day Duration: M: 2 weeks before and after mating (in total 4 weeks) F: 2 weeks before mating, during the mating period (up to 2 weeks), during gestation, during lactation until day 13 post‐partum (duration 7–8 weeks) |
Necrosis of urinary bladder (M, F) | 50 (M, F) | 150 (M, F) |
| NCI/NTP 1979 | Mouse, B6C3F1 (M, F) No./sex/group: 5 Diet for M: 0 or 3,160 to 22,000 ppm, equivalent to 0 or 632 to 4,400 mg/kg bw per day (a) ; for F: 0 or 3,160 to 46,000 ppm; equivalent to 0, or 4,400 to 9,200 mg/kg bw per day (a) Duration: 7 weeks | ↓ Body weight M/F | 2,200/6,400 | 3,000/9,200 |
| Sheweita et al. (2017) | Rabbit, New Zealand (M) No./sex/group: 5 Route: oral 0 or 0.5 mg/kg bw per day Duration: 12 weeks | Hepatic necrosis and fibrosis ↑ hepatic TBARS ↓ activity of hepatic SOD, catalase, GST and GPx ↓ hepatic GSH content | 0.5 | |
GST: glutathione‐S‐transferase; GSTp: placental glutathione‐S‐transferase; GSH: glutathione; GPx: glutathione–peroxidase; SOD: superoxide dismutase; TBARS: thiobarbituric‐acid reactive substances.
EFSA default values applied.
The liver is the main target organ for the toxic and carcinogenic effects of NMOR (see Table C.3 of Appendix C on acute toxicity studies and Table 5 on long‐term toxicity). This is also substantiated by (i) ultrastructural alterations of rat hepatocytes, treated for 7 weeks with a dose of 2.4 mg/kg bw per day and (ii) the development of hepatic preneoplastic lesions in parallel with alterations of the liver transcriptome and proteome patterns of rats, receiving 10.8 mg/kg bw per day for 7 weeks (Wanson et al., 1980; Oberemm et al., 2009).
Table 5.
Selected long‐term/carcinogenicity studies on the acyclic volatile N‐NAs NDMA, NMEA, NDEA, NDPA, NDIPA, NEIPA, NMBA and NMVA. Note that studies on NDMA and NDEA, applying the compound s.c., i.p., i.v. or i.m. to rats or mice, were not considered. For all studies evaluated, see Table E.1 in Appendix E
| Reference | Species/Experimental design and doses | Most sensitive endpoint | Highest dose with no effect (mg/kg bw per day) | Lowest dose with effect (mg/kg bw per day) |
|---|---|---|---|---|
| NDMA | ||||
| Arai et al. (1979) | Rat, Wistar (M, F) No./sex/group: > 17 Diet: 0, 0.1, 1, or 10 ppm; equivalent to 0, 0.005, 0.05 or 0.5 mg/kg bw per day (a) Duration: 96 weeks | Nodular hepatic hyperplasia (M, F) HCC (M, F) | 0.005 0.005 | 0.05 0.05 |
| Brantom 1983 (Thesis) with calculations in Peto et al. (1984, 1991a,b) |
Rat, Wistar (M, F) No./sex/group: 60 Drinking water: 0, 0.033, 0.066, 0.132, 0.264, 0.528, 1.056, 1.584, 2.112, 2.640, 3.168, 4.224, 5.280, 6.336, 8.448, 16.896 ppm Equivalent to for M: 0, 0.002, 0.004, 0.008, 0.02, 0.03, 0.07, 0.1, 0.14, 0.17, 0.2, 0.27, 0.34, 0.41, 0,54, 1.08 mg/kg bw per day (a) For F: 0, 0.003, 0.006, 0.01, 0.02, 0.05, 0.09, 0.14, 0,18, 0.23, 0.28, 0.37, 0.46, 0.55, 0.73, 1.47 mg/kg bw per day (a) Duration: 12 months, 18 months, lifetime |
↓ Survival M/F Liver tumours including HCC (Brantom) M/F bile epithelial tumour M/F mesenchymal liver tumours M/F | 0.17/0.23 0.1/0.003 0.1/0.14 | 0.2/0.28 0.002/0.003 0.14/0.006 0.14/0.18 |
| Fukushima et al. (2005) |
Rat, F344 (M) No./group: > 80 Drinking water: 0, 0.001, 0.01, 0.1, 1 or 10 ppm; equivalent to 0, 0.00005, 0.0005, 0.005, 0.05 or 0.5 mg/kg bw per day (a) Duration: 16 weeks |
↑ Number and size of preneoplastic liver lesions | 0.005 | 0.05 |
| Griciute et al. (1981) | Mouse, C57Bl (M, F) No/sex/group: > 30 Gavage: 0.03 mg/mouse (20 g) on 2 days/week; equivalent to 0.43 mg/kg bw per day; no control Duration: 50 weeks Observation: 80 weeks | HCC, hepatic haemangioendothelio‐sarcoma | 0.43 | |
| Anderson et al. (1986) | Mouse, A/J (M) No./group: 49–100 Drinking water: 0 or 0.5 ppm; equivalent to 0 or 0.05 mg/kg bw per day (a) Duration 12–18 weeks | Papilloma of forestomach (18 weeks) | 0.05 | |
| Homburger et al. (1976) |
Hamster, Syrian Golden (M, F) No./group: > 9 Drinking water: 0 or 1 mg/L (consumption of 100 mL drinking water/kg bw per day assumed) equivalent to 0 or 0.1 mg/kg bw per day Duration: 60 weeks |
No significant tumour formation; CA in stomach of 1 animal | 0.1 | |
| Love et al. (1977) |
Hamster, Syrian Golden (M, F) No./sex/group: > 46 Drinking water: 0 or 15 mg/L on 5 days/week; (consumption of 100 mL drinking water/kg bw per day assumed) equivalent to 0 or 1.1 mg/kg bw per day Duration: 19–23 weeks Observation: 19–23 weeks |
HCC, CCC, hepatic Kupffer cell sarcoma | 1.1 | |
| Lijinsky et al. (1987) | Hamster, Syrian Golden (M) No./group: 10–20 Gavage: 0.75 or 1.5 mg/animal on 1–2 days/week; (assuming 135 g bw) equivalent to 0.79 or 1.58 mg/kg bw per day; no control Duration: 4–6.5 weeks (1,58 mg) or 20 weeks (0.79 mg) |
HCC, CCC, nasal mucosa Haemangiosarcoma in liver, nasal mucosa |
0.79 |
1.58 (4 weeks) 0.79 (20 weeks) |
| Le Page and Christie (1969a) | Guinea pig (M) No./group: 6 Diet: 0, 12.5, 25 or 50 ppm (60 g food/kg bw per day assumed) equivalent to 0, 0.75, 1.5 or 3 mg/kg bw per day Duration: 49 weeks | Tumours in liver | 0.75 | 1.5 |
| Adamson et al. (1983) | Monkey (4 Rhesus, 2 Cynomolgus (sex not specified) No./group: 6–7 i.p. application: 10 mg/kg bw 1× every 2 weeks; equivalent to 0.71 mg/kg bw per day Duration: not specified | Hepatitis, cirrhosis, hyperplastic nodules | 0.71 | |
| NMEA | ||||
| Lijinsky and Reuber (1980) | Rat, F344 (M) No./group: 20 Drinking water: 6 or 30 mg/L on 5 days/week; equivalent to 0.2 or 1.1 mg/kg bw per day (a) ; no control Duration: 30 weeks Observation: ~ 70–120 weeks | Liver tumours (HCC) Tumours of oesophagus and nasal cavity | 0.2 | 0.2 1.1 |
| Lijinsky (1987) | Rat, F344 (M) No./group: 16 Gavage: 0 or 2.3 mg/rat (~ 300 g bw) on 2 days/week; equivalent to 0 or 2.2 mg/kg bw per day; Duration: 30 weeks Observation: ~ 45 weeks | ↓ Survival HCC, haemangiosarcoma of liver, tumours of lung and nasal mucosa | 2.2 | |
| Lijinsky (1987) | Hamster, Syrian Golden (M) No./group: 9–20 Gavage: 0.9 mg/animal on 1 or 2 days/week; (assuming 135 g bw) equivalent to 0.95 or 1.9 mg/kg bw per day; no control Duration: 15–20 (0.95 mg) or 25 (1.9 mg) weeks | ↓ Survival HCA/HCC CCA/CCC; tumour of nasal mucosa | 0.95 | 1.9 0.95 |
| NDEA | ||||
| Lijinsky et al. (1981) | Rat, F344 (F) No./group: 12–20 Drinking water: 0, 0.45, 1.1, 2.8, 7, 18, 45 or 113 mg/L on 5 days/week; equivalent to 0, 0.02, 0.04, 0.1, 0.25, 0.6, 1.6 or 4.0 mg/kg bw per day (a) Duration: up to 104 weeks | HCC Tumours of oesophagus and stomach | 0.02 (60 weeks) 0.02 (104 weeks) | |
| Brantom 1983 (Thesis) with calculations Peto et al. (1991a,b) |
Rat, Wistar (M, F) No./sex/group: 60 Drinking water: 0, 0.033, 0.066, 0.132, 0.264, 0.528, 1.056, 1.584, 2.112, 2.640, 3.168, 4.224, 5.280, 6.336, 8.448, 16.896 ppm Equivalent to for M: 0, 0.002, 0.004, 0.008, 0.02, 0.03, 0.07, 0.1, 0.14, 0.17, 0.2, 0.27, 0.34, 0.41, 0,54, 1.08 mg/kg bw per day (a) For F: 0, 0.003, 0.006, 0.011, 0.02, 0.05, 0.09, 0.14, 0,18, 0.23, 0.28, 0.37, 0.46, 0.55, 0.73, 1.47 mg/kg bw per day (a) Duration: 12 months, 18 months, lifetime |
↓ Survival M/F Liver tumours (including HCC, Brantom) M/F Tumours in oesophagus M | 0.1/0.05 ~ 0.004/− ~ 0.02/0.02 | 0.14/0.09 ~ 0.008/0.003 ~ 0.03/0.05 |
| Berger et al. (1987) | Rat, SD (M) No./group: 80 Drinking water: 0, 0.01, 0.032 or 1 mg/kg bw on 5 days/week; equivalent to 0, 0.007, 0.023 or 0.07 mg/kg bw per day Duration: lifetime |
↓ Survival Tumours in liver, GI and urinary tract |
0.007 | 0.023 0.007 |
| Gray et al. (1991) | Mouse, strain not specified (F) No./group: 10 Drinking water: 0, 0.033, 0.066, 0.132, 0.264, 0.528, 1.056, 1.584, 2.112, 2.640, 3.168, 4.224, 5.280, 6.336, 8.448, 16.896 ppm Equivalent to: 0, 0.01, 0.02, 0.04, 0.07, 0.14, 0.29, 0.43, 0.58, 0.72, 0.87, 1.15, 1.44, 1.73, 2.31, 4.62 mg/kg bw per day (c) Duration: ~ 25 months |
Malignant tumours in liver (hepatocell.) Tumours in oesophagus stomach Lung tumours |
0.04 0.14 0.29 |
0.07 0.29 0.43 |
| Gray et al. (1991) | Hamster, strain not specified (F) No./group: 10 Drinking water: 0, 0.033, 0.066, 0.132, 0.264, 0.528, 1.056, 1.584, 2.112, 2.640, 3.168, 4.224, 5.280, 6.336, 8.448, 16.896 ppm Equivalent to: 0, 0.003, 0.01, 0.02, 0.03, 0.05, 0.11, 0.16, 0.22, 0.27, 0.33, 0.44, 0.55, 0.66, 0.88 or 1.75 mg/kg bw per day (c) Duration: 22 months | Tumours in liver Tumours in trachea | 0.03 0.22 | 0.05 0.27 |
| Arcos et al. (1969) | Guinea pig (M) No./group: ~ 20 Drinking water: 1.2 mg/kg bw per day; no control Duration: 4, 8, 12, 16, 20 or 24 weeks Observation: 12 months | Liver tumours | 1.2 (12 weeks) | |
| Rapp et al. (1965) |
Rabbit, New Zealand (M, F) No./sex/group: 3–13 Drinking water: 0 or 42 mg/L on 6 days/week (assuming 2 kg bw and 200 mL water consumption/day) equivalent to 0 or 3.6 mg/kg bw per day Duration: 52–82 weeks |
CA of liver and lung | 3.6 | |
| Hirao et al. (1974) |
Dog (mongrel) (M) No./group: ~ 14 Drinking water: 50, 100 or 500 mg/L (assuming 100 ml water consumption/kg bw per day) equivalent to 5, 10 or 50 mg/kg bw per day; no control Duration: 2–50 weeks Observation: 175 weeks |
HCC, CCC and mesenchymal liver tumours (haemangioma, haemangiosarcoma, fibroma, leiomyoma, leiomyosarcoma, haemangioendothelioma) CA of nasal mucosa |
5 | |
| Adamson et al. (1989); Thorgeirsson et al. (1994) | Monkey, Cynomolgus, Rhesus (M, F) Diet: 40 mg/kg bw per day on 5 days/week; equivalent to 28.6 mg/kg bw per day; tumours in untreated controls: 7/90 Start of treatment: at birth, 1–8 months post‐partum or adulthood. Duration until tumour appearance: 49(Rh, F), 52 (Rh, m), 31 (Cy, f), 25 (Cy, m) months; total dose: 8.8 g (Rh, F), 10.2 (Rh, m), 7.1 g (Cy, f), 18 g (Cy, m). | HCC in 31/40 animals | 28.6 | |
| Thorgeirsson et al. (1994) | Monkey. Cynomolgus, Rhesus (M, F) i.p. application: 40 mg/kg bw on 2 days/months, i.e. 2.7 mg/kg bw per day; Start of treatment: at birth, 1–8 months post‐partum or adulthood Mean duration until tumour appearance: 17 months (except 18 months for Cy, M); mean total dose: 1.1 g (for all except 1.3 g for Cy, M) |
HCC 112/128 |
2.7 |
|
| Thorgeirsson et al. (1994) | Monkey, Rhesus, Cynomolgus, African Green, Rhesus × Cynomolgus (sex not specified) No/group: 10–106 Newborn at first treatment i.p. application: 0.1, 1, 5, 10, 20, 40 every 2 weeks; equivalent to 0.007, 0.07, 0.35, 0.7, 1.4 and 2.8 mg/kg bw per day; untreated controls available Mean duration/tumour induction time: 157 (111–177), 74 (52–109), 38 (14–64), 25(13–39), 16 (6–49) months. Total dose: 0.104 (0.056–0.146), 1.78 (1.66–2.74), 2.70 (1.47–5.81), 2.02 (1.22–4.14), 2.40 (0.83–4.65), 1.59 (0.39–4.08) g. | HCA in 4/11 animals | 0.007 | 0.07 |
| Adamson and Sieber (1979, 1983) Thorgeirsson et al. (1994) |
Monkey, Bush baby G. crassicaudatus (M, F) No/group: 10–14 i.p. application: 0 or 10–30 mg/kg bw per day on 2 days/months, i.e. 0.6–2 mg/kg bw per day; untreated controls available; Mean duration/tumour induction time: 22.9 months (range: 15–32 months); average total dose: 0.75 g (range: 0.3–1.49 g) |
Mucoepidermoid CA of nasal mucosa >> HCC | 0.6–2 | |
| NDPA | ||||
| Linjinsky et al. (1983) | Rat, F344 (M, F) No./sex/group: 12–20 Gavage: 0 or 4.4 mg/kg bw for M and 0 or 2.2 mg/kg bw for F on 2 days/week; equivalent to 0 or 1.3 mg/kg bw per day for M and to 0 or 0.62 mg/kg bw per day for F Duration: 30 weeks | ↓ Survival HCC, CA of nasal cavity, oesophagus and forestomach |
1.3/0.62 (M/F) 1.3/0.62 (M/F) |
|
| Dickhaus et al. (1977) | Mouse, NMRI (F) No./group: 12–14 s.c. application: 0, 34.4, 68.9 or 137.8 mg/kg bw on 1 day/week; equivalent to 0, 4.9, 9.8 or 19.6 mg/kg bw per day Duration: lifetime | ↓ Survival Tumours in nasal cavity, lung, pharynx, oesophagus and stomach | 4.9 4.9 | |
| Pour et al. (1973, 1974) | Hamster, Syrian Golden (M, F) No./sex/group: > 19 s.c. application: 0, 3.75, 7.5, 15, 30, or 60 mg/kg 1 day/week; equivalent to 0, 0.53, 1.07, 2.14, 4.28 or 8.6 mg/kg bw per day Duration: lifetime | ↓ Survival Tumours of nasal/ paranasal cavities and in upper and lower respiratory tract | 0.53 | 1.07 0.53 |
| Adamson and Sieber (1979, 1983); Thorgeirsson et al. (1994) | Monkey (4 Rhesus, 2 Cynomolgus) (sex not specified) No/group: 6 i.p. application: 40 mg/kg bw; 2×/month; equivalent to 2.7 mg/kg bw per day Mean duration/tumour latency: 29 months (22–33 months); Total dose 6.97 g (6.07–7.86 g) | HCC 6/6 | 2.7 | |
| NDIPA | ||||
| Lijinsky and Taylor (1979) | Rat, SD (M) No./group: 15 Drinking water: 90 or 600 mg/L on 5 days/week equivalent to 3.2 or 21.46 mg/kg bw per day (a) ; no control Duration: 50 weeks for 5.8 mg/kg bw per day or 40 weeks for 38.6 mg/kg bw per day Observation: ~ 50 weeks | ↓ Survival CA of nasal turbinates HCC | 3.2 | 3.2 3.2 21.4 |
| NEIPA | ||||
| Druckrey et al. (1967) | Rat, BD (M, F) No./group: 14 Drinking water: 10 or 20 mg/kg bw per day; historical controls available Mean tumour induction time: 345 and 375 days | HCC, CA of oesophagus, pharynx and forestomach | 10 | |
| NMBA | ||||
| Lijinsky et al. (1980) | Rat, F344 (M, F) No./group: 20 Drinking water: 6.25 mg/L (for M) or 16 mg/L (for M and F) on 5 days/week; equivalent to 0.23 mg/kg bw per day (for M) or 0.57 mg/day per day(a) (for M and F); historical controls available Duration: 20–23 weeks Observation: lifetime | ↓ Survival Papilloma and CAs of oesophagus, forestomach, oropharynx, tongue | 0.23/0.57 (M/F) 0.23/0.57 (M/F) | |
| Stoner et al. (2006) |
Rat, F344 (M) No./group: 10–20 s.c. application: 0 or 0.25 mg/kg bw on 1 day/week; equivalent to 0 or 0.04 mg/kg bw per day Duration: 15 weeks Observation: 8 weeks after end of treatment |
Papilloma and CAs of oesophagus | 0.04 | |
| NMVA | ||||
| Druckrey et al. (1967) | Rat, BD (M, F) No./group: 5–14 Drinking water: 0.3 or 0.6 mg/kg bw per day; historical controls available Duration/average tumour induction time: 390 or 270 days | CA of oesophagus, tongue, pharynx | 0.3 | |
AD: adenoma; CA: carcinoma; CCC: cholangiocellular carcinoma; HCA: hepatocellular adenoma; HCC: hepatocellular carcinoma.
Applying EFSA default values (EFSA, 2012b).
Animal dietary exposure: overview of current approaches used at EFSA (EFSA, 2019b).
Based on suggestions of authors, compound uptake in mg/kg bw per day was calculated as follows: ppm values were multiplied by the density factor of 0.942 and a water consumption of 290 mL/kg bw for female mice and 110 mL/kg bw for female hamsters was assumed.
Flaks and Challis (1980, 1981) focused on the NPIP effects on rat liver. In the first study, animals were treated with 8.6–15.4 mg/kg bw per day for a period of up to 6 months. After 2.5 months, preneoplastic liver lesions were identified. Also, centrolobular vacuolation, indicating hepatocellular damage, was reported. In the second study, NPIP (20.6 mg/kg bw for 12 or 28 days) induced ultrastructural changes in hepatocytes, such as glycogen depletion, cytoplasmic fat accumulation, proliferation of the smooth endoplasmic and reduction of the rough endoplasmatic reticulum, as well as bile canalicular changes.
NDPheA was the subject of an NCI/NTP‐study published in 1979. The study arm on subchronic toxicity over a period of 11 weeks in rats and 7 weeks in mice was conducted to estimate the maximum tolerated doses for the long‐term studies; only survival and body weights were reported. In rats > 360 mg/kg bw per day reduced the body weight of males and females and > 1,440 mg/kg bw per day the survival of the female animals. In the ECHA database, a study from 2017 is publicly accessible. A 4‐ to 8‐week treatment with 150 mg/kg bw per day induced necrosis of the urinary bladder in male and female SD rats. The NTP study of 1979 showed that in mice, the body weight was reduced at > 3,000 mg/kg bw per day in the males and at > 9,200 mg/kg bw per day in the females. This study arm focused on the determination of the maximum tolerated dose and did not include detailed analyses of the organs or blood chemistry. Sheweita et al. (2017) reported on toxicity in liver and testis in New Zealand rabbits treated with 0.5 mg/kg bw per day for 12 weeks. Hepatic necrosis was associated with lipid peroxidation, as determined by increased TBARS.
3.1.2.3. Genotoxicity
3.1.2.3.1. Acyclic volatile N‐NAs
In vitro studies: NDMA is a potent hepatocarcinogen that has proved mutagenic in a number of different assay systems (Montesano and Bartsch, 1976). It is not a direct‐acting mutagen. Rather, like many other N‐NAs, it requires enzymatic activation (Malling, 1971). Positive results were reported in Salmonella Typhimurium strain TA100 and in Escherichia coli uvrA in the presence of metabolic activation by hamster and rat liver S9 (with enhanced NDMA mutagenicity by hamster S9) (Araki et al., 1984). In mammalian cells, NDMA induced gene mutations in mouse lymphoma cells in the presence of an exogenous metabolic system from Syrian hamster cells (Amacher and Paillet, 1982). In the absence of an exogenous metabolic activation system, no induction of micronuclei was observed in cultured isolated lymphocytes (Katic et al., 2010), while a significant increase of micronuclei frequency was reported in the human hepatoma‐derived HepG2 cells (Majer et al., 2004).
In vivo studies: In several reports, NDMA provided generally negative results in the peripheral blood micronucleus (MN) assays (Cliet et al., 1993; Suzuki et al., 2005; Rothfuss et al., 2010; Bowen et al., 2011; Dertinger et al., 2019). One exception is the increased incidence of micronucleated reticulocytes in peripheral blood of Big Blue mice after a single i.p. treatment with high doses of NDMA (5 and 10 mg/kg) (Suzuki et al., 1996). In collaborative Study Groups of several laboratories (Japanese Environmental Mutagen Society) conducting simultaneous liver and peripheral blood MN assays in young rats, positive results were observed only in the liver (Suzuki et al., 2005). Similarly, positive results were obtained by MN assay system targeting the liver after repeated‐dose treatments of young adult rats, while negative results were found in the bone marrow and the GI tract (Hamada et al., 2015). Induction of chromosome aberrations, micronuclei and sister chromatid exchanges (SCEs) were also reported in hepatocytes of F344 rats exposed in vivo to/for NDMA (Sawada et al., 1991). Finally, an increased level of DNA breaks, as measured by alkaline elution and Comet assays, was reported in the liver of rats given a single oral dose of NDMA (Brambilla et al., 1987) or following a 15 day repeat dosing protocol that resulted in a negative peripheral blood MN assay (Rothfuss et al., 2010).
Evaluation of a multi‐endpoint assay in rats combining MN test in the bone marrow and peripheral blood and the Comet assay allowed identification of (a) increased levels of DNA breaks in the liver and in the blood, but not in the stomach; and (b) an increase in MN that was considered equivocal because of excessive toxicity (Bowen et al., 2011). Similarly, NDMA was positive only in the hepatocyte MN assay (and not in the peripheral blood or the Pig‐a mutation assay) in young rats (Dertinger et al., 2019). These data indicate that NDMA is clastogenic in the liver; in addition, although NDMA intermediates did not induce chromosomal damage in the bone marrow, the plasma level in peripheral blood could be sufficient to induce DNA damage, albeit limited, that can be detected in the Comet assay.
In an international validation study of the in vivo Comet assay, significant induction of DNA strand breaks as measured by the comet assay was also observed in liver but not in the stomach of rats orally treated with NDMA (Hobbs et al., 2015; McNamee and Bellier, 2015). In another study on i.p.‐treated mice, increased levels of DNA breaks, as measured by the comet assay, were observed in stomach, colon, liver, lung, kidney, urinary bladder and brain (Tsuda et al., 2000).
The mutational specificity of NDMA in the lacI gene of E. coli was initially determined by a host‐mediated assay. E. coli, recovered from the livers of i.p. NDMA‐treated mice, exhibited a 37‐fold increase in mutation frequency with GC > AT transitions being 91% of the NDMA spectrum. The type and the sequence context of these mutations (guanines flanked at the 5' end by a purine) are consistent with O 6‐Me‐Gua being the main pre‐mutagenic adduct induced by NDMA. A small proportion (10%) of other types of mutation were also identified (Horsfall et al., 1989).
NDMA‐induced mutations recovered after in vitro activation (S9) show a spectrum very similar to that obtained after an in vivo activation employing a mouse host‐mediated assay. In both systems, G:C > A:T transitions dominate and their distribution reveals similar site specificity (Jiao et al., 1993).
Information on the mutagenicity of NDMA in whole animals came from several studies in lacZ or lacI C57BL/6 and B6C3F1 transgenic mice (Mirsalis et al., 1993; Tinwell et al., 1994; Suzuki et al., 1996; Souliotis et al., 1998; De Boer et al., 1999; Shane et al., 2000). Good agreement of positive and negative results was observed among the different TransGenic Rodent (TGR) assays (reviewed in Lambert et al., 2005).
NDMA induced comparable increases in lacI mutation frequencies (10‐ to 20‐fold) in liver DNA of two different transgenic mouse strains (C57BL/6 and B6C3F1). A significant effect of the age of the animals (3‐ vs. 6‐week‐old mice) was observed with young animals being more sensitive to the mutagenic effects of NDMA. Sequencing of the mutants indicates that NDMA produces predominantly C:G > T:A transitions (Mirsalis et al., 1993).
Increased mutations in the liver and, to a minor extent, in the spleen of the transgenic lacZ MutaTM mice were also found following single or multiple exposures to NDMA. Although DNA adducts (O 6‐Me‐Gua and 7‐Me‐Gua) levels increased linearly with dose, the authors report a greater than linear increase in the mutation frequency. Most of the mutations were GC > AT mutations at GpG sites (60%) and a smaller fraction (22%) of deletions of a few (up to 11) base pairs were also observed (Souliotis et al., 1998).
When the organ specificity of NDMA mutagenicity was investigated in i.p.‐treated Big Blue mice, lacI mutant frequency increased in target organs for NDMA carcinogenicity, i.e. liver (6.2‐fold), kidney (2.4‐fold) and lung (2.1‐fold), but not in non‐target organs such as bone marrow, urinary bladder and testis (Suzuki et al., 1996).
Liver mutations (4.5‐fold increased mutation frequency) investigated in Big Blue mice identified again a high percentage of GC > AT transitions (64%) and a small number of frameshift mutations. Unlike the controls, none of these transitions occurred at CpG sites (Delker et al., 2008).
Finally, oral NDMA mutagenicity was investigated in liver of transgenic Big Blue rats at lacI and cII genes with similar increases in mutation frequency being found at the two loci (4.5‐fold at 6 mg/kg bw) (Gollapudi et al., 1998). A similar study performed in the liver of transgenic Big Blue mice reported similar increases in mutation frequency (around threefold) at the two gene loci but differences in the spontaneous as well as in the NDMA‐induced mutational spectra (Shane et al., 2000).
Because of the large database available on in vivo mutagenicity of NDMA in different TGR gene mutation assays, a recent study employed the BMD approach to examine the ability of different TGR variants to yield comparable genotoxic potency estimates. Preliminary results indicate that the tissue choice is potentially more important than the choice of a specific TGR assay (Wills et al., 2017).
In summary, NDMA‐induced gene mutations occur mainly in the liver and, to a smaller degree, the lung and kidney, but not in the bone marrow, urinary bladder or testis. The large majority of mutations are GC > AT, occurring at specific sites different from those observed in controls (GpG and CpG, respectively) with a small fraction of frameshifts and small deletions. Exposure to NDMA also induced chromosomal damage in the liver, while DNA breaks as measured by comet assay were also observed in several organs of NDMA‐treated mice and rats.
In vivo genotoxicity studies with NDMA are compiled in Table B.1 of Appendix B.
Table B.1.
In vivo genotoxicity studies with NDMA
| Endpoint | Species | Experimental design and doses | Effect level | Comments |
Reference |
|---|---|---|---|---|---|
| DNA strand breaks by alkaline elution in liver | Sprague Dawley rats |
Gavage (single) 21.5, 57.8, 73.2, 79.9 mg/kg bw |
Positive |
Mutagenic potency: NDMA, NMEA, NDEA > NDBA, NMOR > NPIP, NPYR, NDPA > NDPheA (neg) Poor correlation with carcinogenic potency |
Brambilla et al. (1987) |
|
Mutations in lacI of E.coli by host‐mediated assay |
Swiss albino mice (n = 2–3) |
E. coli injected in mice treated i.p with 200 μL of 500 pmol/kg bw; incubation time: 3 3 h |
Positive: liver (37‐fold increase in mutation frequency) | GC > AT mutations at specific sequences (not at the CpG sites observed in controls): consistent with O 6 ‐Me‐Gua miscoding properties | Horsfall et al. (1989) |
| Micronuclei, chromosomal aberrations and SCEs in cultured hepatocytes |
F344 rats (n = 3–8) |
Gavage (single) 2.5, 5, 10, 20 mg/kg bw analysis: 2–48 h after dosing |
Positive: micronuclei, SCEs, chromosome aberrations (dose‐dependent increases) | Chromosome aberrations: mainly acentric types |
Sawada et al. (1991) |
| DNA strand breaks by alkaline elution in lung and kidney | Male Sprague‐Dawley rats |
Oral (1 h exposure) 2, 4, 20, 32, 40 mg/kg bw |
Positive: at the first dose; plateau at 20 mg/kg in both tissues |
Brendler et al. (1992) |
|
| Mutations and UDS in liver of transgenic lacZ/galE Muta mouse |
Male Mice (3 and 6 weeks old) n = 4 |
Oral; 10 mg/kg bw (single) analysis: 7, 11, 20 days after dosing |
Positive: mutation and UDS | Similar mutation frequency at lacI and lacZ loci; |
Tinwell et al. (1994) |
| Mutations in the liver of transgenic lacl Big Blue mice |
B6C3F1 Mice (3 and 6 weeks old) n = 4 |
2 mg/kg bw per day × 5 days analysis: 7, 11, 20 days after dosing |
Positive: Ninefold increase in mutation frequency; mutations increase only at 3 but not at 6 weeks of age |
GC > AT mutations not at CpG sites (typical spectrum of controls); small increases in GC > TA transversions and deletions. |
De Boer et al. (1999) |
| Micronuclei in BM and testis | Male CD1/CR mice; 7–8 weeks (n = 5) |
i.p.; 3, 6, 9 mg/kg bw; BM: twice at 24 h interval; analysis: 24 hr; testis: 6 times at 24 h interval |
Negative in BM Positive in spermatids (6 and 9 mg/kg bw only) |
No toxicity in the BM; toxicity in the testis at the highest dose; | Cliet et al. (1993) |
| Mutations at lacI gene in vitro and in vivo | In vitro and in vivo host‐mediated assay |
E. coli treated in vitro with 25 mM NDMA in the presence of Aroclor‐induced rat S9 E.coli injected in mice treated i.p with 200 μL of 500 pmol/kg bw; incubation time: 3 h in the host‐mediated assay |
Positive |
Same mutational spectra in vitro and in vivo (large predominance of GC > AT transitions; a few transversions at A:T and GC bp) |
Jiao et al. (1993) |
| Mutations in the liver of transgenic lacl B6C3F1 mice | B6C3F1; 3 and 6 weeks old | 2, 4, 6 mg/kg bw per day × 5, 14, 21 days; analysis: 1, 8, 22 days after the final dose |
Positive both strains: 10‐ to 20‐fold increase in mutation frequency |
GC > AT mutations at specific sequences (not at the CpG site); consistent with O 6 ‐Me‐Gua miscoding properties; no strain difference in the mutagenic response; strong age effect (hypersensitivity of young animals) | Mirsalis et al. (1993) |
| Mutations in the liver of transgenic lacZ C57BL/6 mice | C57BL/6 | ||||
| Mutations in liver, kidney, lung, BM, urinary bladder, testis of lacI Big Blue mice |
Male Big Blue C57Bl6; 7 weeks old (n = 10; 10 for micronuclei; 3 for mutations) Carcinogenicity study in parallel (n = 10) |
i.p. 1 mg/kg bw per day × 5 days 5 and 10 mg/kg bw (once) analysis (1 mg/kg bw): 1 week analysis (5 and 10 mg/kg bw): 2 weeks |
Positive: Increase in liver (6.2‐fold); kidney (2.4‐fold); lung (2.1‐fold). Negative: BM, urinary bladder and testis |
Suzuki et al. (1996) | |
| Micronuclei in peripheral blood |
Negative: in low, repeated doses; Positive: 5 and 10 mg/kg |
High doses are considered sublethal | |||
| Mutations in liver and spleen of lacZ MutaTM mice |
5 mg/kg bw and 10 mg/kg bw 1 mg/kg bw × 10 daily doses up to 7 days |
Positive: maximal increase (3.6 fold) at 5 mg/kg bw in liver and marginal in spleen | GC > AT at non‐CpG sites (60%) + small deletions up to 11bp (22%) | Souliotis et al. (1998) | |
| 7‐Me‐Gua and O6‐Me‐Gua DNA adducts and AGT levels in liver and lung | DNA adduction higher in liver than in lung | Information on kinetics of formation and removal of DNA adducts as well as on depletion and re‐synthesis of AGT | |||
| Mutations at lacI and cII loci in the livers of transgenic Big Blue rats |
Fischer 344 Big Blue rats 12 weeks old |
Oral gavage; 0.2, 0.6, 2.0, 6.0 mg/kg bw per day × 9 doses | Positive: 2 and 6 mg/kg bw; 4.5‐fold increase at highest dose | no difference between lacI and cII target gene (gene size ………Column Break…………1080 vs. 300 bp). | Gollupadi et al. (1998) |
| Mutations at lacI and cII loci in livers of Big Blue® transgenic mice | B6C3F1 Big Blue® mice; 10 weeks old; (n = 6) | Oral gavage, 4 mg/kg bw per day × 5 days | Positive: similar increases in mutation frequency (3.3‐ and 3.5‐fold at lacI and cII) | Different spontaneous and NDMA‐induced mutation spectra at lacI and cII loci | Shane et al. (2000) |
|
DNA breaks by comet assay in stomach, colon, liver, lung, kidney, urinary bladder, brain and BM |
Male ddY mice (n = 6) |
i.p.; 6.25, 12.5, 25, 50 mg/kg bw analysis: 3 and 24 h after dosing |
Positive: all organs except BM | Tsuda et al. (2000) | |
| Micronuclei in liver and peripheral blood |
Male Fischer F344 or SD rats; 3 weeks old; (n = 4–5); 2 laboratories |
5, 10 mg/kg bw |
Positive: liver (both doses) Negative: blood |
Suzuki et al. (2005) | |
| Mutations at lacI in livers of Big Blue® transgenic mice |
Male B6C3F1; 12 weeks old; (n = 6) |
Oral gavage; 7 mg/kg bw per day × 3 days Analysis: 11 days |
Positive: liver ($.5‐fold increase) | GC > AT (64%, not at CpG sites) + some frameshifts + 3 small deletions | Delker et al. (2008) |
| DNA strand breaks by comet assay in liver |
Male SD or Wistar rats; 6–10 weeks old; Collaborative studies in several laboratories |
p.o.; 0.5, 2, 4 mg/kg bw per day × 15 days |
Positive | Information on liver histopathology | Rothfuss et al. (2010) |
| Micronuclei in peripheral blood | Negative | ||||
| Micronuclei in BM | Male Han–Wistar or Sprague–Dawley rats; 7–10 weeks old; (n = 6–10) |
Oral gavage; 20, 40, 75 mg/kg bw per day × 3 days (75 mg/kg bw: not analysed for excessive toxicity) |
Equivocal (linear trend but excessive tox; only 2 doses) | Excessive toxicity also at 40 mg/kg bw | Bowen et al. (2011) |
| Micronuclei in blood | Equivocal (linear trend but excessive tox; only 2 doses) | ||||
| DNA breaks by comet assay in liver, stomach, blood, |
Positive: liver, blood Negative: stomach |
||||
| Micronuclei in liver, BM, GI tract (stomach and colon) | Male Crl:CD (SD) rats; 6 weeks old |
p.o.; 1, 2, 4 mg/kg bw per day × 14 days 0.5,1, 2 mg/kg bw per day × 28 days |
Positive: liver Negative: BM and GI |
Hamada et al. (2015) | |
| DNA breaks by comet assay in liver and stomach | Male Crl:CD (Sprague–Dawley) rats |
Oral gavage; 2.5, 5.0, and 10 mg/kg bw (single) Analysis: 3 h after dosing |
Positive: liver (all doses) Negative: stomach |
Acute hepatotoxicity; however heavily damaged cells (hedgehogs) were excluded from the analysis of the Comet assay | McNamee and Bellier (2015) |
| DNA breaks by comet assay in liver and stomach | Male Sprague–Dawley rats;7–8 weeks old |
Oral gavage; 0.63, 1.25 and 2.5 mg/kg bw per day on day 1, 2 and 3 Analysis: 1 h after dosing |
Positive: liver (all doses) Negative: stomach |
No liver toxicity by histopathology Doses were chosen on the basis of McNamee and Bellier study |
Hobbs et al. (2015) |
| Micronuclei in liver | Male and female Crl:CD (SD) rats; 4 weeks old; (n = 3 males and 3 females) |
Oral gavage; 2.5, 5, 10 mg/kg bw per day × 3 days (1 cycle) or 3 cycles |
Positive 1 and 3 cycles: both sexes at high dose; | Dertinger et al. (2019) | |
| Micronuclei in blood | Negative 1 or 3 cycles | ||||
|
Mutations at Pig‐a |
Negative 1 or 3 cycles |
In vitro studies: The mutagenic potential of NMEA was studied in various S. Typhimurium YG7108 strains each expressing a form of the human CYPs. As judged by the levels of induced mutations, NMEA was mainly activated by CYP2E1 (Fujita and Kamataki, 2001).
In vivo studies: Positive results were reported for DNA single strand breaks and alkali‐labile sites as measured by the alkaline elution technique in the liver of rats given a single oral NMEA dose. A linear dose response was observed over all NDPA doses tested (Brambilla et al., 1987). An increased number of DNA breaks, as measured by comet assay, were also reported in the stomach, colon, liver, lung and kidney of i.p. treated mice (Tsuda et al., 2000). No induction of micronuclei was observed in CD1 mouse haematopoietic cells by single or double i.p. treatments of up to lethal or sublethal doses (Morita et al., 1997).
In vitro studies: NDEA is a potent genotoxicant in in vitro systems. It induced reverse mutations in bacteria in the presence of an exogenous metabolic system (Yahagi et al., 1977; Araki et al., 1984) and in host‐mediated assays in mice. In mammalian cells, NDEA induced chromosomal aberrations and SCEs in the presence of an exogenous metabolic system in Chinese hamster cells (Ishidate Jr and Odashima, 1977) and gene mutations in mouse lymphoma cells (Amacher and Paillet, 1982).
In vivo studies: Inconclusive results in the MN assay in vivo were reported by a Collaborative Study Group of several laboratories (Environmental Mutagen Society of Japan) evaluating the rodent MN assay in chemicals identified as group‐1, group‐2A and group‐2B carcinogens by IARC (Morita et al., 1997). In several other reports, NDEA provided consistently negative results in the MN assays in vivo (Cliet et al., 1993; Shi et al., 2011; Avlasevich et al., 2014, Hagio et al., 2014; Khanal et al., 2018; Dertinger et al., 2019). The inconsistency between the positive results in the in vitro chromosomal aberration assays and negative bone marrow MN assays has been explained by the lifespan of the active NDEA metabolite which is too short to reach the target organ and allow for sufficient exposure in the bone marrow to cause cytogenetic damage in the haematopoietic system (Morita et al., 1997).
When methods to measure MN induction in the liver (involving partial hepatectomy, treatment with mitogens and the use of juvenile animals) became available, consistently positive results for MN induction in the liver by NDEA were reported (Igarashi et al., 2010; Takasawa et al., 2010; Shi et al., 2011; Itoh et al., 2012; Hagio et al., 2014; Narumi et al., 2012, 2013; Khanal et al., 2018; Dertinger et al., 2019). These assays have been proven to be of high sensitivity and specificity and to predict hepatocarcinogenicity of compounds that cannot be detected by bone marrow MN assays.
Finally, a significant induction of DNA strand breaks, as measured by alkaline elution in the liver (Brambilla et al., 1987) or by Comet assay, was observed in liver and kidney (Miyamae et al., 1998; Sekihashi et al., 2001; Hashimoto et al., 2007; Igarashi et al., 2010; Shi et al., 2011; Hagio et al., 2014) as well as in stomach, colon, bladder, brain and lung cells (Tsuda et al., 2000; Sekihashi et al., 2001). In contrast, negative results were reported in spleen and bone marrow (Miyamae et al., 1998). The target organs of NDEA genotoxicity were almost identical in mice and rats (Sekihashi et al., 2002). In a single study, a modest increase in DNA breaks was reported at a high NDEA dose (10 mg/kg/day) in blood cells (Shi et al., 2011). These data suggest that, although NDEA intermediates did not induce chromosomal damage in the bone marrow, the plasma level in peripheral blood could be sufficient to induce modest DNA damage that can be detected in the Comet assay.
Mutations induced by NDEA have been investigated in several TGR assays [lacZ MutaTM mouse, gpt delta (gpt), gpt delta (spi‐)]. Good agreement of positive and negative results was observed among the different TGR assays (reviewed in Lambert et al., 2005). Increases in mutation frequencies were reported in the liver and lung after both i.p. and oral administration (reviewed in Lambert et al., 2005; Okada et al., 1997). No induction of mutations was reported in testis or sperm, while results were largely negative in the bone marrow.
In addition, mutations as well as DNA adducts formation, i.e. O 6 ‐Et‐Gua and N7‐Et‐Gua were investigated in bone marrow and liver of lacZ MutaTM mouse i.p. treated with NDEA for different length of time (3, 14 and 28 days) (Mientjes et al., 1998). No DNA adducts or mutation induction were observed in bone marrow of NDEA‐treated mice. Mutations increased in a time‐dependent manner in the liver (maximal values at 14–28 days), while maximal levels of liver DNA adducts were observed within 24 h. Mutations have also been investigated in the blood‐based Pig‐a mutation assay with equivocal results. The negative Pig‐a results are in agreement with the negative ones observed in the MN assays since these tests detect, respectively, mutation and chromosomal damage occurring in bone marrow and measured in peripheral red blood cells (erythrocytes and reticulocytes for the Pig‐a assay and reticulocytes in the MN assay) (Shi et al., 2011; Wada et al., 2016). However, a weakly positive response in the Pig‐a assay was identified in two studies (Avlasevich et al., 2014; Khanal et al., 2019). The slight elevation in mutation frequency could be identified with a new scoring approach that allows a very large number of cells to be analysed and provides sufficient statistical power to detect increases on the order of threefold (Dertinger et al., 2019).
In vivo genotoxicity studies with NDEA are compiled in Table B.2 of Appendix B.
Table B.2.
In vivo genotoxicity studies with NDEA
| Endpoint | Species | Experimental design and doses | Effect level | Comments | Reference |
|---|---|---|---|---|---|
| DNA strand breaks in liver by alkaline elution | Sprague Dawley rats |
Gavage (single) 0.6, 1.8, 5.4, 16.2 mg/kg bw |
Positive |
Mutagenic potency: NDMA, MEA, NDEA > NDBA, NMOR > NPIP, NPYR, NDPA > NDPheA (neg) Poor correlation with carcinogenic potency |
Brambilla et al. (1987) |
| Micronuclei in BM and testis | Male CD1/CR mice; 7–8 weeks (n = 5) | i.p.; 14, 28, 56, 112, 170 mg/kg bw per day; 2 × at 24 h interval (liver); 3 × at 24 h interval (testis); positive control: MMC |
Negative in liver Positive in spermatid (28 and 56 mg/kg bw only; toxicity at higher doses) |
No toxicity in the BM; toxicity in the testis | Cliet et al. (1993) |
| Micronuclei in BM and peripheral blood |
Male CD1 mice (n = 5) |
i.p. 250, 500, 1000 mg/kg bw (single) (2 exp.) 20, 40, 80 mg/kg bw (twice) (2 exp.) |
Inconclusive | Morita et al. (1997) | |
|
Male MS/Ae (n = 5) |
i.p. 1, 2, 5, 10, 20, 25, 40, 50, 100, 200 mg/kg bw (twice) | ||||
| DNA strand breaks by comet assay in liver, kidney, lung, spleen, BM | Male CD1/CR mice; 7 weeks (n = 5) |
i.p.; 160 mg/kg bw analysis: 3 and 24 h after dosing |
Positive in liver, kidney, lung Negative in spleen and BM |
Miyamae et al. (1998) | |
|
Mutations in liver and BM of transgenic MutaMouse (lacZ) |
Female CD2F1 mice |
i.p.; 66 mg/kg bw (single) analysis: 1, 3, 14, 28 day after dosing |
Positive: liver Negative: BM |
Mientjes et al. (1998) | |
| O 6 ‐EtGua and 7‐EtGua adducts in liver and BM | analysis: 1.5 h, 1, 3, 14, 28 day after dosing |
Positive: O 6 ‐EtGua peak in the liver: 1.5–24 h, disappeared at 14 days Negative: BM |
GC > AT mutations AT > TA transversions Probably due to O6‐EtGua and O2‐EtThy |
||
| DNA breaks by comet assay in stomach, colon, liver, lung, kidney and urinary bladder, brain and BM |
Male ddY mice (n = 6) |
i.p.; 20, 40, 80, 160 mg/kg bw analysis: 3, 8, 24 h after dosing |
Positive: all organs except BM | Tsuda et al. (2000) | |
| DNA strand breaks by comet assay in stomach, colon, liver, kidney, bladder, lung, brain, BM |
Male ddY mice (n = 4) |
i.p. 160 mg/kg bw p.o. 320 mg/kg bw analysis: 3, 8, 24 h after dosing |
i.p. Positive: stomach, colon, liver, kidney, bladder, lung, brain. Negative: BM p.o. Positive: stomach, colon, liver, kidney, bladder, lung. Negative: brain and BM |
Sekihashi et al. (2001) | |
| DNA strand breaks by comet assay in stomach, colon, liver, kidney, bladder, lung, brain, BM | Wistar rats |
i.p. 160 mg/kg bw analysis: 3, 24 h after dosing |
i.p. Positive: stomach, colon, liver, kidney, bladder, lung, brain. Negative: brain and BM |
Positive results in the same targets in mice and rats; (exception: negative results in BM in mouse and brain and BM in rat) | Sekihashi et al. (2002) |
|
Mutations in liver, lung, BM, sperm of transgenic MutaMouse (lacZ) |
CD2F1 mice C57Bl6 mice |
i.p.; 66, 50, 80, 100, 175 mg/kg bw (cumulative doses) |
Positive in liver and lung Negative in BM and sperm |
Lambert et al. (2005) (review) | |
|
Mutations in transgenic Gpt delta (gpt) |
i.e.; 40, 50, 80, 100, 150 mg/kg bw/(single) |
Positive in liver and lung Negative in BM and testis |
|||
| DNA strand breaks by comet assay in liver and kidney |
Male F344/ DuCrlCrlj rats; 9 weeks old (n = 5) and 20 months old (n = 4/5) |
i.p.; 160 mg/kg bw analysis: 3 and 20 h after dosing |
Positive in liver and kidney in young rats (3 and 24 h) Positive in kidney in aged rats: (only at 24 h) |
The lower level of DNA damage in old rats suggests that metabolic activation decreases in aging rats |
Hashimoto et al. (2007) |
| DNA strand breaks by comet assay in liver | Male ddY mice; 7–8 weeks old (n = 4) |
i.p.; 50 mg/kg bw partial hepatectomy; analysis at 3, 8, 24 h |
Positive (all sampling times, peak at 8 h) | Higarashi et al. (2010) | |
| Micronuclei in liver |
partial hepatectomy; analysis: 5 days later |
Positive (all sampling times, peaks at 24 h) | Proliferation of liver cells induced by partial hepatectomy | ||
| Micronuclei in liver |
Male F344/ DuCrlCrlj (Fischer) rats; 4 week; (n = 5) |
Oral gavage, 12.5,25,50 mg/kg bw per day; × 2 days at 24 h interval | Positive (all samples) | Takasawa et al. (2010) | |
| DNA strand breaks by comet assay in blood and liver | Male Sprague‐Dawley rats; 6–8 weeks; (n = 5) |
Oral gavage; 5,10,20 mg/kg bw per day × 28 days; the highest dose was lethal in all animals Comet assay: additional dose at day 29; |
Positive (both doses in liver; only the highest in blood) |
No toxicity in BM; limited toxicity in the liver | Shi et al. (2011) |
| Micronuclei in blood | Negative | ||||
| Mutation (Pig‐a) in reticulocytes and erythrocytes | Negative | ||||
| Micronuclei in liver | Male Crl:CD (SD) rats; 6 weeks (n = 5) | Oral gavage: 6.25, 12.5 mg/kg bw per day × 5, 14, 28 days | Positive (all time points at highest dose; at 28 days at the low dose) | Repeated exposures needed to detect increases in micronuclei frequency | Narumi et al. (2012) |
| Micronuclei in liver | Male Crl:CD (SD) rats; 6 weeks (n = 5) | Oral gavage: 12.5 mg/kg bw per day × 7 days | Positive (time–dependent increase) | Micronucleated hepatocytes accumulate and persist | Narumi et al. (2013) |
| DNA strand breaks by comet assay in liver and kidney | Male Crlj:CD1 (ICR) mice; 5.5 weeks old (n = ) |
Oral gavage 6.5 and 12.5 mg/kg bw per day × 15 days analysis: 3 h after last administration |
Positive in liver (both doses) and kidney (high dose) (% tail DNA) |
Positive results with repeated exposure of young mice; Negative in the blood because of short half‐life of metabolite |
Hagio et al. (2014) |
| Micronuclei in the liver and blood |
Positive in liver (high dose) Negative in blood |
||||
| Mutation (Pig‐a) in reticulocytes and erythrocytes |
Male Sprague‐Dawley rats; 6–8 weeks; (n = 6–9) Analysis MN: day 4 and 29 |
Oral gavage; 3.12, 6.25, 12.5 mg/kg bw per day × 28 days; Analysis Pig‐a: day 15, 29, 42 after dosing |
Positive (weakly): only at 12.5 mg/kg bw in reticulocytes at day 29; in erythrocytes at day 29 and 42 (limited increase) | Toxicity: dose‐related reduction in weight gain and in the number of reticulocytes (BM toxicity). | Avlasevich et al. (2014) |
| Micronuclei in reticulocytes | Negative | ||||
| Mutation (Pig‐a) in reticulocytes and erythrocytes |
Male Sprague‐Dawley rats; (n = 3) |
Oral gavage: 37.5, 75, 150 mg/kg bw (single dose) Analysis: 3, 7, 14, 28 day after dosing |
Negative | Toxicity: decreased body weight gain (150 mg/kg bw) and increased number of reticulocytes (BM toxicity). | Wada et al. (2016) |
|
Mutation (Pig‐a) in reticulocytes and erythrocytes |
Male Crl:CD (SD) rats; 6 weeks; (n = 5) |
Oral gavage: 5, 10, 15 mg/kg bw per day x 28 days |
Positive (weakly): increase at high dose in reticulocytes and positive trend in erythrocytes |
Toxicity: decreased body weight gain (150 mg/kg bw); no significant BM toxicity Increased proliferation of hepatocytes |
Khanal et al. (2018) |
| Micronuclei in reticulocytes and liver |
Positive in liver: dose‐dependent increase. Negative in reticulocytes |
||||
| Micronuclei in liver | Male and female Crl:CD (SD) rats; 4 weeks old; (n = 3 males and 3 females) |
Oral gavage; 10, 20, 40 mg/kg bw per day × 3 days (1 cycle) or 3 cycles |
Positive 1 and 3 cycles: both sexes | Dertinger et al. (2019) | |
| Micronuclei in blood | Negative 1 or 3 cycles | ||||
| Mutations at Pig‐a |
Negative 1 cycle Positive 3 cycles |
||||
| Micronuclei in liver | Male and female Crl:CD (SD) rats; 4 weeks old; (n = 3 males and 3 females) |
Positive 1 and 3 cycles: both sexes at high dose |
Dertinger et al. (2019) |
In vitro studies: Positive results for NDPA were reported in Salmonella Typhimurium strain TA100 and in E. coli uvrA (Araki et al., 1984) in the presence of metabolic activation by hamster and rat liver S9 (with enhanced NDPA mutagenicity by hamster S9). The mutagenic potential of NDPA was also studied in several S. Typhimurium YG7108 strains (a derivative of TA1535), each expressing a form of the human CYP. As judged by its mutagenic capacity, NDPA was mainly activated by CYP2A6 (Fujita and Kamataki, 2001b). NDPA induced DNA strand breaks, gene mutations and chromosome aberrations in mammalian cells in vitro (reported in a review by Lambert et al., 2005 and ATSDR, 2019).
In vivo studies: Positive results were reported for induction of DNA single strand breaks and alkali‐labile sites as measured by the alkaline elution technique in the liver of rats given a single NDPA oral dose (Brambilla et al., 1987). NDPA induced DNA breaks as measured by the comet assay in stomach, colon, liver, lung, bone marrow and urinary bladder (but not in the kidney) (Tsuda et al., 2000). No increase in micronuclei was observed in mouse bone marrow cells after double i.p. treatments up to about 80% of the LD50 (Morita et al., 1997). Similarly negative results were obtained in bone marrow of young rats treated by oral gavage for 14 days. In the same experiment setting, however, NDPA increased micronuclei frequencies in rat hepatocytes (Hamada et al., 2015; Terashima et al., 2015).
The mutagenic and clastogenic effects of NDPA were investigated in lacZ MutaTM mouse. NDPA did not cause a significant increase in micronucleated reticulocytes in peripheral blood. In the mutation assay, significant increases in mutant frequencies were observed in the liver, lung and kidney (in this ascending order of mutagenic potency) and not in bone marrow, urinary bladder or testis (Itoh et al., 1999; Suzuki et al., 1999).
The mutagenic and clastogenic effects of NDPA were investigated in lacZ MutaTM mouse. NDPA did not cause a significant increase in micronucleated reticulocytes in peripheral blood. In the mutation assay, significant increases in mutant frequencies were observed in the liver, lung and kidney (in this ascending order of mutagenic potency) and not in bone marrow, urinary bladder or testis (Ito et al., 1999; Suzuki et al., 1999).
In vitro studies: NDIPA induced the lambda prophage in E. coli (Rossman et al., 1991) and was weakly positive in S. Typhimurium strain TA100 (Lee and Guttenplan, 1981) in the presence of a metabolic activation system.
In vitro studies: The mutagenic potential of NMBA was studied in various S. Typhimurium YG7108 strains, each expressing a form of the human CYP. As judged by its mutagenic capacity, NMBA was mainly activated by CYP2A6 (Fujita and Kamataki, 2001b).
Genotoxicity studies on NMVA and NEIPA were not reported.
3.1.2.3.2. Acyclic non‐volatile N‐NAs
In vitro studies: The mutagenic potential of NDBA was studied in various S. Typhimurium YG7108 strains each expressing a form of the human CYP. As judged by mutagenic capacity, NDBA was mainly activated by CYP2A6 (Fujita and Kamataki, 2001b).
In vivo studies: Positive results were reported for induction of DNA single strand breaks and alkali‐labile sites as measured by the alkaline elution technique in the liver of rats given a single oral dose (Brambilla et al., 1987). NDBA induced DNA breaks as measured by the comet assay in stomach, colon, liver, lung, kidney, urinary bladder and brain (Tsuda et al., 2000). No increase of micronuclei was observed in mouse haematopoietic cells after a single i.p. treatment of up to the LD50 (Morita et al., 1997).
NMA has been reported to be negative or very weakly mutagenic in the standard Salmonella/microsome assays (reviewed in Zielenska and Guttenplan, 1988). However, NMA was found to be moderately mutagenic in the presence of liver S9 in the Salmonella TA104 strain. NMA‐induced mutations were predominantly AT > CG transversions (Zielenska and Guttenplan, 1988).
In vitro studies: NDBzA was mutagenic in bacteria and in mammalian cells in vitro. Both in TA100 and TA98 S. Typhimurium strains and in V79 cells, NDBzA mutagenesis required high levels of S9 fractions or metabolic activation by liver S9 from hamster (Boyes et al., 1990; Schmezer et al., 1990).
In vivo studies: No increase in micronuclei was observed in rat and mouse bone marrow, while positive results were observed in rat liver (Schmezer et al., 1990).
Mutagenicity of orally administered NDBzA was studied in lacZ Muta TM mouse. Mutant frequencies were increased in liver samples, but not in bone marrow after both NDBzA and NDMA treatment, with NDBzA being > 100 times less mutagenic than NDMA. The predominant type of NDBzA‐induced mutations was transversions, mainly GC > TA. The authors suggested that these may arise from specific unidentified DNA adducts with benzylation possibly being the primary mechanism involved in formation of these DNA adducts (Jiao et al., 1997).
In vitro studies: Both in TA1535 and TA100 S. Typhimurium strains NMAMBA mutagenesis required metabolic activation by rat liver S9 and the efficient liquid incubation assay (negative results by the plate assay) (Lu et al., 1980).
Genotoxicity studies on NEA, NDIBA, NMAMPA and NSAR were not reported.
3.1.2.3.3. Cyclic volatile N‐NAs
In vitro studies: Positive results were reported with NMOR in S. Typhimurium strain TA100 and in E. coli uvrA (Araki et al., 1984) in the presence of metabolic activation by hamster and rat liver S9 (with enhanced NMOR mutagenicity by hamster S9).
In vivo studies: Positive results were reported for induction of DNA single‐stranded breaks and alkali‐labile sites as measured by the alkaline elution technique in the liver of rats given a single oral dose (Brambilla et al., 1987). NMOR induced DNA breaks as measured by the comet assay in stomach, colon, liver, lung, kidney and urinary bladder (Tsuda et al., 2000). In addition, dose‐dependent and reproducible positive responses for induction of micronuclei were observed in mouse bone marrow after single i.p. treatments (Morita et al., 1997).
In vitro studies: NPIP was found to be mutagenic in S. Typhimurium strains TA1535 only in the presence of rat S9 (Stoltz and Sen, 1977) and in strain TA100 and in E.coli uvrA (Araki et al., 1984) in the presence of metabolic activation by hamster or rat liver S9 (with enhanced NPIP mutagenicity by hamster S9). Recently, Totsuka et al. (2019) confirmed the positive results in S. Typhimurium strains TA1535 and TA 100 and showed that GC > AT transitions are significantly higher in NPIP‐exposed clones than in control clones.
In vivo studies: Positive results were reported for induction of DNA single‐stranded breaks and alkali‐labile sites as measured by the alkaline elution technique in the liver of rats given a single oral dose (Brambilla et al., 1987). NPIP induced DNA breaks as measured by the comet assay in stomach, colon, liver, lung, kidney and urinary bladder (Tsuda et al., 2000). Recently, an increase in mutation frequency was reported in liver and oesophagus of NPIP‐treated transgenic rats, with AT > C:G transversions followed by GC > AT and AT > GC transitions being the main mutations (Totsuka et al., 2019). No increase in micronuclei was observed in BDF1 mouse haematopoietic cells after a single i.p. treatment of up to 80% of the LD50 (Morita et al., 1997).
In vitro studies: NTHZ was found to be mutagenic in S. Typhimurium strains TA100 and TA98 with and without metabolic activation (Umano et al., 1984). NTHZ induced positive responses also in another microbial system (repair deficient rec ‐ strain of Bacillus subtilis) and in a DNA repair assay in primary rat hepatocytes (Unscheduled DNA synthesis, UDS) (Loury et al., 1984).
In vitro studies: NPYR was found to be mutagenic in S. Typhimurium strains TA1535 (Stoltz and Sen, 1977) and TA100 and TA104 (Zielenska and Guttenplan, 1987). NPYR‐induced mutational spectra have been investigated in the E. coli lacI gene. Base substitutions at G:C base pairs appeared to predominate in the mutational spectrum, although some AT > GC transitions also occurred suggesting that NPYR might be a complex mutagen (Zielenska et al., 1990).
In vivo studies: Positive results were reported for induction of DNA single‐stranded breaks and alkali‐labile sites as measured by the alkaline elution technique in the liver of rats given a single oral dose (Brambilla et al., 1987). An increased number of DNA breaks, as measured by comet assay, were also reported in the stomach, colon, liver, lung, kidney and urinary bladder of i.p. treated mice (Tsuda et al., 2000). There was no increase in micronuclei in CD‐1 mouse haematopoietic cells after a single i.p. treatment of up to 60% of the LD50 (Morita et al., 1997).
Mutagenicity of NPYR was investigated at two loci in the liver of gpt delta transgenic rats. A 10‐fold increase in mutation frequency was observed only at the gpt locus and this was caused by specific AT > GC transitions. The lack of variations in the frequency of Spi‐mutations indicates that NPYR does not induce small deletions (Kanki et al., 2005).
3.1.2.3.4. Cyclic non‐volatile N‐NAs
In vitro studies: NHPYR was reported as positive in S. Typhimurium strain TA1535 in DSSTox (CPDBAS) Carcinogenic Potency Database Salmonella Mutagenicity (the S. Typhimurium/mammalian microsomal assay): a report of the U.S. Environmental Protection Agency gene‐tox programme (Kier et al., 1986).
In vitro studies: NHMTHZ exhibited clear dose–response mutagenicity towards strain TA100 with or without metabolic activation (but not in strain TA98) (Umano et al., 1984).
In vitro studies: No induction of mutations was observed with NPRO in S. Typhimurium strain TA1535 with or without metabolic activation (Stoltz and Sen, 1977).
In vitro studies: No induction of mutations was observed with NHPRO in S. Typhimurium strain TA1535 with or without metabolic activation (Stoltz and Sen, 1977).
In vitro studies: NTCA was not mutagenic in strains TA100 and TA98 of S. Typhimurium with or without metabolic activation (Umano et al., 1984).
Genotoxicity studies on NMTHZ, NMTCA, NHMTCA, NOCA, NMOCA and NPIC were not reported.
3.1.2.3.5. Aromatic non‐volatile N‐NAs
In vitro studies: A lack of mutagenic activity of NDPheA has been consistently reported in commonly used strains of S. Typhimurium (strains TA100, TA1535, TA1537, TA1538 and TA98). NDPheA was weakly mutagenic in the TA104 Salmonella strain and induced predominantly AT > TA transversions (Zielenska and Guttenplan, 1988). No mutations were induced at the Na‐/K ATPase, Hprt or Tk loci in cultured mammalian cells. DNA strand breaks were not induced in mouse lymphoma L5178Y cells in a study performed only in the presence of S9 mix or in Chinese hamster V79 cells (in the absence of S9 mix). Discrepant results were reported for induction of Sister Chromatid Exchanges (SCEs) as well as for chromosome aberrations in CHO and CHL cells (reviewed in McGregor, 1994; reviewed by ATSDR, 2017).
In vivo studies: In three in vivo studies of MN induction in mouse bone marrow cells, there was no indication of an effect due to NDPheA (reviewed in McGregor, 1994). Negative results were reported for induction of DNA single‐stranded breaks and alkali‐labile sites as measured by the alkaline elution technique in the liver of rats given a single oral dose (Brambilla et al., 1987).
In vivo genotoxicity studies with NMEA, NDPA, NDBA, NDBzA, NMOR, NPIP, NPYR, NDPheA are compiled in Table B.3 of Appendix B.
Table B.3.
In vivo genotoxicity studies with NMEA, NDPA, NDBA, NDBzA, NMOR, NPIP, NPYR, NDPheA
| Endpoint | Species | Experimental design and doses | Effect level | Comments | Reference |
|---|---|---|---|---|---|
| NMEA | |||||
|
DNA strand breaks by alkaline elution in liver |
Male Sprague‐Dawley rats treated = 4 control = 16 |
Gavage (single) 0.67, 2, 6 mg/kg bw analysis: 3 h after dosing |
Positive (linear dose response) |
Mutagenic potency: NDMA, NMEA, NDEA > NDBA, NMOR > NPIP, NPYR, NDPA > NDPheA (neg). Poor correlation with carcinogenic potency |
Brambilla et al. (1987) |
| Micronuclei in peripheral blood |
Male CD1 mice n = 5 |
i.p. 7.5, 15, 30 mg/kg bw (single) 1.5, 3, 6 mg/kg bw (twice) |
Negative | Morita et al. (1997) | |
| DNA breaks by comet assay in stomach, colon, liver, lung, kidney, brain and urinary bladder and BM |
Male ddY mice n = 6 |
i.p.; 6.25, 12.5, 25, 50 mg/kg bw analysis: 3, 24 h after dosing |
Positive: stomach, colon, liver, lung, kidney | Tsuda et al. (2000) | |
| NDPA | |||||
| DNA strand breaks in liver by alkaline elution |
Male Sprague‐Dawley rats treated = 4 control = 16 |
Gavage (single) 25, 75, 225 mg/kg bw analysis: 3 h after dosing |
Positive (linear dose response) | See also above | Brambilla et al. (1987) |
| Micronuclei in BM |
Male CD1 mice n = 5 |
i.p. 50, 100, 200, 400 mg/kg bw (twice) | Negative | Morita et al. (1997) | |
|
Mutations in liver, lung, kidney, urinary bladder, testis and BM of transgenic lacZ MutaTMMouse |
Male CD2F1 mice (n = 6 animals) |
i.p.; 250 mg/kg bw (single) analysis: 7, 14, 28 days |
Positive: liver, lung, kidney Negative: BM, urinary bladder, testis |
Mutagenic potency: liver > lung > kidney | Ito et al. (1999); Suzuki et al. (1999) |
| Micronuclei in blood reticulocytes | analysis: 24, 48, 72 h | Negative: BM | |||
| DNA breaks by comet assay in stomach, colon, liver, lung, kidney, brain and urinary bladder and BM |
Male ddY mice (n = 6) |
i.p.; 50, 100, 200, 400 mg/kg bw analysis: 3, 24 h after dosing |
Positive: all organs (excluding kidney) | Tsuda et al. (2000) | |
| Micronuclei in liver and BM |
Male Crl:CD (SD) rats, 6 weeks age |
gavage: 10, 20, 40 mg/kg bw × 14 days |
Positive: liver Negative: BM |
Hamada et al. (2015) |
|
| Micronuclei in liver and BM |
Male Crl:CD (SD) rats, 6 weeks age |
gavage: 10, 20, 40 mg/kg bw × 14 days |
Positive: hepatocytes Negative: blood |
T | Terashima et al. (2015) |
| NDBA | |||||
|
DNA strand breaks by alkaline elution in liver |
Male Sprague‐Dawley rats treated = 4 control = 16 |
Gavage (single) 2.22, 6.67, 20, 60 mg/kg bw analysis: 3 h after dosing |
Positive (linear dose response) |
Mutagenic potency: NDMA, NMEA, NDEA > NDBA, NMOR > NPIP, NPYR, NDPA > NDPheA (neg). Poor correlation with carcinogenic potency |
Brambilla et al. (1987) |
| Micronuclei in BM |
Male BDF1 mice (n = 5) |
i.p. 150, 300, 600 mg/kg bw (single) |
Negative | Morita et al. (1997) | |
| DNA breaks by comet assay in stomach, colon, liver, lung, kidney and urinary bladder, brain and BM |
Male ddY mice (n = 6) |
i.p.; 75, 150, 300, 600 mg/kg bw analysis: 3, 24 h |
Positive: all organs except BM | Tsuda et al. (2000) | |
| NDBzA | |||||
| DNA strand breaks by alkaline elution in liver | Male Alderley Park rats |
Gavage Analysis: 12 h after dosing |
Positive | Schmezer et al. (1990) | |
| Micronuclei in peripheral blood | Male CBA and C57B1/6J mice |
Gavage 750 mg/kg bw (CBA) 500, 750 mg/kg bw (C57B1/6J) analysis: 24 h after dosing |
Negative | ||
| Male Alderley Park rats |
Gavage 750 mg/kg bw analysis: 24 h after dosing |
Negative | |||
| Micronuclei in liver | Male Alderley Park rats |
Gavage 250, 500, 750 mg/kg bw analysis: 24 h after dosing |
Positive | ||
|
Mutations in transgenic lacZ MutaTMMouse liver and BM |
Male CD2F1 mice (N = 6 animals) |
Oral 30, 100, 435, 750 mg/kg bw (single dose) Analysis: 30 and 90 days after dosing NDMA as +ve control: 2,6,10 mg/kg bw |
Positive: liver (NDBzA and NDMA) Negative: BM (NDBzA and NDMA) |
NDBzA is 100‐fold less potent than NDMA. Mutations are mainly GC > TA transversions (unidentified DNA adduct; possibly due to benzylation) |
Jiao et al. (1997) |
| NMOR | |||||
|
DNA strand breaks by alkaline elution in liver |
Male Sprague‐Dawley rats treated = 4 control = 16 |
Gavage (single) 1.2, 3.6, 10.7, 32 mg/kg bw analysis: 3 h after dosing |
Positive (linear dose response) |
Mutagenic potency: NDMA, NMEA, NDEA > NDBA, NMOR > NPIP, NPYR, NDPA > NDPheA (neg). Poor correlation with carcinogenic potency |
Brambilla et al. (1987) |
| Micronuclei in BM |
Male ddY mice (n = 5) |
i.p. 125, 250, 500, 1,000, 2,000 mg/kg bw (single) 250, 375, 500 mg/kg bw (single) 31, 63, 125 mg/kg bw (twice) 125, 250 mg/kg bw (twice) |
Positive | Morita et al. (1997) | |
| DNA breaks by comet assay in stomach, colon, liver, lung, kidney and urinary bladder, brain and BM |
Male ddY mice (n = 6) |
i.p.; 250 mg/kg bw analysis: 3, 8, 24 h |
Positive: all organs except brain and BM | Tsuda et al. (2000) | |
| NPIP | |||||
| DNA strand breaks by alkaline elution in liver |
Male Sprague‐Dawley rats treated = 4 control = 16 |
Gavage (single) 60, 180 mg/kg bw analysis: 3 h after dosing |
Positive (only high dose) | See above | Brambilla et al. (1987) |
| Micronuclei in peripheral blood |
Male BDF1 mice (n = 5) |
i.p. 30, 60, 120 mg/kg bw (single) |
Negative | Morita et al. (1997) | |
| DNA breaks by comet assay in stomach, colon, liver, lung, kidney and urinary bladder, brain and BM |
Male ddY mice (n = 6) |
i.p.; 120 mg/kg bw analysis: 3, 8, 24 h |
Positive: all organs except brain and BM | Tsuda et al. (2000) | |
| Mutations in liver and oesophagus of gpt delta rats |
Male 344 rats (n = 5) |
Oral; 33, 66 mg/kg bw (5 consecutive doses) Analysis: 6 weeks after dosing |
Positive: dose dependent increase in liver gpt mutations, mainly AT > CG transversions, borderlines increases in GC > AT and AT > GC transitions; limited information in the oesophagus (1/312000 and 22/61500 mutant/surviving clones in controls and NPIP treated rats, respectively); similar mutational profile of liver mutants | Totsuka et al. (2019) | |
| NPYR | |||||
| DNA strand breaks by alkaline elution in liver |
Male Sprague‐Dawley rats treated = 4 control = 16 |
Gavage (single) 15, 45, 135 mg/kg bw analysis: 3 h after dosing |
Positive (linear dose response) | See above | Brambilla et al. (1987) |
| Micronuclei in peripheral blood |
Male CD1 mice (n = 5) |
i.p. 40, 100, 250, 625 mg/kg bw (single) |
Negative | Morita et al. (1997) | |
| DNA breaks by comet assay in stomach, colon, liver, lung, kidney and urinary bladder, brain and BM |
Male ddY mice (n = 6) |
i.p.; 600 mg/kg bw analysis: 3, 8, 24 h |
Positive: all organs except brain and BM | Tsuda et al. (2000) | |
| Mutations in liver of transgenic Sprague‐Dawley (gpt and Spi mutations) | Female Sprague‐Dawley gpt delta rats |
Oral (in drinking water) 200 ppm for 13 weeks N = 5 |
Positive: at the gpt locus; increase in AT > GC transitions Negative: Spi‐mutations |
10‐fold increase in base substitutions but no increase in deletions. Significant increase in GST‐P positive liver cell foci. |
Kanki et al. (2005) |
| NDPheA | |||||
| Micronucleus in peripheral blood | Mouse |
i.p. 500 mg/kg bw 800 mg/kg bw |
Negative | Reviewed in McGregor (1994) | |
| DNA strand breaks in liver by alkaline elution |
Male Sprague‐Dawley rats treated = 4 control = 16 |
Gavage (single) 540 mg/kg bw analysis: 3 h after dosing |
Negative | See above | Brambilla et al. (1987) |
In summary, the genotoxic properties of the acyclic volatile NDMA, NMEA, NDEA and NDPA have been extensively investigated both in vitro and in vivo. Following metabolic activation, these N‐NAs induce gene mutations in both bacteria and mammalian cells in vitro Mutations have also been observed in the liver of transgenic animals with GC > AT transitions being the main mutational class. These base substitutions are consistent with the well‐known miscoding properties of DNA bases alkylated at the O6 position of guanine. Minor fractions include mutations at A:T base pairs and small deletions. MN assays in the liver, but not in the bone marrow or in peripheral blood reticulocytes have provided evidence of chromosomal damage. Finally, induction of DNA strand breaks observed in vitro also occurs in several organs, including liver, colon, lung and kidney.
Information on the genotoxic properties of NDIPA and NMBA are limited to weakly positive results reported in S. Typhimurium strains TA100 and YG7108 (a TA1535 derivative expressing human CYPs), while there appears to be no information on NEIPA and NMVA genotoxicity.
Information on the genotoxicity of the acyclic non‐volatile N‐NAs is even scantier. Induction of mutations in the presence of metabolic activation in S. Typhimurium was shown for NDBA (strain YG7108), NDBzA (TA98 and TA100 strains) and NMAMBA (TA1535 and TA100 strains). Increased levels of DNA breaks in several organs confirmed the in vivo genotoxicity of NDBA whereas NDBzA induced micronuclei and gene mutations (GC > TA transversions) in transgenic mice. Finally, NMA was moderately mutagenic in S. Typhimurium (only in TA104), with a mutational spectrum dominated by AT > CG transversions. The DNA adducts responsible for the base substitutions induced by NDBzA and NMA are currently undefined. The genotoxicity of NEA, NDIBA, NMAMPA and NSAR remains undefined.
The cyclic volatile NMOR, NPIP and NPYR were mutagenic both in vitro and in vivo. For all these N‐NAs, increased levels of DNA strand breaks were observed in several mouse organs (stomach, colon, liver, lung, kidney and urinary bladder). In addition, the clastogenic potential of NMOR has been demonstrated by its ability to induce micronuclei in the bone marrow. The reported in vitro mutagenicity of NPYR has been confirmed in vivo in transgenic rats (increases mainly of AT > GC transitions but also of mutations at G:C base pairs). Finally, the mutagenicity of NTHZ is limited to positive results both in the presence and in the absence of metabolic activation in S. Typhimurium strains TA98 and TA100.
Data on the genotoxicity of cyclic non‐volatile N‐NAs are limited to in vitro data in S. Typhimurium (in a limited number of strains). Positive results were reported for NHPYR and NHMTHZ, whereas NPRO, NHPRO and NTCA were negative. No data were available for NMTHZ, NMTCA, NHMTCA, NOCA, NMOCA and NPIC.
The genotoxic potential of the aromatic volatile NDPheA remains uncertain. The weak mutagenicity reported in the S. Typhimurium TA104 strain (induction of AT > TA transversions) has not been confirmed in assays in cultured mammalian cells. In addition, discrepant results were also reported on NDPheA clastogenicity in in vitro assays. Finally, consistently negative results were reported for induction of micronuclei and DNA breaks in vivo (Table 4).
Table 4.
Summary of the genotoxicity data on the different N‐NAs
| Genotoxicity | In vitro | In vivo | |||
|---|---|---|---|---|---|
| Chromosomal damage | DNA breaks | Gene mutation | |||
| NDMA | + | pos | pos | pos | pos |
| NMEA | + | pos | neg | pos | pos |
| NDEA | + | pos | pos | pos | pos |
| NDPA | + | pos | pos | pos | pos |
| NDIPA | (+) | pos | NA | ||
| NEIPA | NA | NA | NA | ||
| NMBA | (+) | pos | NA | ||
| NMVA | NA | NA | NA | ||
| NDBA | + | pos | neg | pos | NA |
| NDIBA | NA | NA | NA | ||
| NMA | (+) | pos | NA | ||
| NEA | NA | NA | NA | ||
| NDBzA | + | pos | neg | NA | Pos |
| NMAMPA | NA | NA | NA | ||
| NMAMBA | (+) | pos | NA | ||
| NSAR | NA | NA | NA | ||
| NMOR | + | pos | pos | pos | NA |
| NPIP | + | pos | neg | pos | pos |
| NTHZ | (+) | pos | NA | ||
| NPYR | + | pos | neg | pos | pos |
| NHPYR | (+) | pos | NA | ||
| NMTHZ | NA | NA | NA | ||
| NHMTHZ | (+) | pos | NA | ||
| NPRO | (−) | neg | NA | ||
| NHPRO | (−) | neg | NA | ||
| NTCA | (−) | neg | NA | ||
| NMTCA | NA | NA | NA | ||
| NHMTCA | NA | NA | NA | ||
| NOCA | NA | NA | NA | ||
| NMOCA | NA | NA | NA | ||
| NPIC | NA | NA | NA | ||
| NDPheA | (unclear) | pos/neg | neg | neg | NA |
NA: not available; (+): in vitro positive; (−): in vitro negative; +: positive both in vitro and in vivo; pos: positive; neg: negative.
3.1.2.4. Long‐term toxicity
3.1.2.4.1. Acyclic volatile N‐NAs
The evaluated long‐term toxicity/carcinogenicity studies on the acyclic volatile N‐NAs NDMA, NMEA, NDEA, NDPA, NDIPA, NEIPA, NMBA and NMVA are compiled in Table E.1 in Appendix E. Selected studies, considered to be of relevance for assessing the health risks by acyclic volatile N‐NAs, are shown in Table 5.
Table E.1.
Long‐term/carcinogenicity studies on the acyclic (volatile)N‐NAs NDMA, NMEA, NDEA, NDPA, NDIPA, NEIPA, NMBA and NMVA. Note that studies on NDMA and NDEA, applying the compound s.c., i.p., i.v. or i.m. to rats or mice, were not considered
| Reference | Species/Experimental design and doses | Most sensitive endpoint | Highest dose with no effect (mg/kg bw per day) | Lowest dose with effect (mg/kg bw per day) |
|---|---|---|---|---|
| NDMA | ||||
| Magee et al. (1956) |
Rat, albino (M, F) No/sex/group: 4–10 Diet: 0 or 50 ppm; equivalent to 0 or 2.5 mg/kg bw per day (a) Duration: 27–42 weeks Observation: 27–42 weeks |
Hepatic necrosis and fibrosis Liver tumours | 2.5 2.5 | |
| Zak et al. (1960) | Rat, SD (M, F) No/sex/group: > 10 Diet (choline‐deficient): 0 or 125 ppm; equivalent to 0 or 6.25 mg/kg bw per day (a) Duration: up to 224 days | Tumours in liver, lung and kidney | 6.25 | |
| Argus and Hoch‐Ligeti (1961) |
Rat, Wistar (M) No/group: > 20 Gavage: 400 μg/rat (assuming 300 g bw) on 5 days per week; equivalent to 0.95 mg/kg bw per day; no control Duration: 31–48 weeks |
Tumours in liver, lung and kidney | 0.95 | |
| Magee et al. (1962) | Rat, Porton (F) No/group: > 5 Diet: 0, 5, 10, 20 or 50 ppm; equivalent to 0, 0.25, 0.5, 1 or 2.5 mg/kg bw per day (a) Duration: 102–104 weeks (5–20 ppm) or 42 weeks (50 ppm) Observation: 27–42 weeks | Liver tumours | 0.25 | 0.5 |
| Terracini et al. (1967) |
Rat, Porton (M, F) No/sex/group: 5–62 Diet for M: 0, 2 or 5 mg/kg; for F: 0, 2, 5, 10, 20 or 50 mg/kg; equivalent to for M: 0, 0.1, 0.25 mg/kg bw per day; for F: 0, 0.1, 0.25, 0.5, 1.0 or 2.5 mg/kg bw per day (a) Duration: > 52 weeks Observation: up to 120 weeks |
Liver tumours | 0.1 |
0.1 (M) 0.25 (F) |
| Druckrey et al. (1967) | Rat, BD (M, F) No/group: 20 Gavage: 4 mg/kg bw on 5 days/week; equivalent to 2.86 mg/kg bw per day; historical controls available Duration: on average 270 days | HCC, hepatic sarcoma | 2.86 | |
| Hoch‐Ligeti (1968) | Rat, SD (M) No/group: 19 Gavage: 400μg/rat on 5 days/week;(assuming 300 g bw), equivalent to 0.95 mg/kg bw per day; no control Duration: 24 weeks Observation: 525 days | HCC | 0.95 | |
| Geil et al. (1968) | Rat, Holtzman (F) No/group: > 5 Drinking water: 0 or 15 mg/L; equivalent to 0 or 0.75 mg/kg bw per day (a) Duration/tumour induction time: 289–386 days | Liver tumours | 0.75 | |
| Keefer et al. (1973) | Rat, MRC (M) No/group: > 14 Drinking water: 0, 5 or 25 mg/L on 5 days/week; equivalent to 0, 0.18 or 0.9 mg/kg bw per day (a) Duration: 30 weeks Observation: 100 weeks | Liver tumours | 0.18 | |
| Hadjiolov et al. (1974) | Rat, Wistar (M) No/group: 24 Drinking water: 0 or 1.4 mg/kg bw on 5 days/week; equivalent to 0 or 1 mg/kg bw per day Duration: 5 months | Malignant liver tumours | 1 | |
| Terao et al. (1978) | Rat, Wistar (M) No/group: > 14 Diet: 0 or 10 ppm; equivalent to 0 or 0.5 mg/kg bw per day (a) Duration: 54 weeks Observation: 69 weeks | Leydig cell tumours Hepatic effects | 0.5 | 0.5 |
| Arai et al. (1979) | Rat, Wistar (M, F) No/sex/group: > 17 Diet: 0, 0.1, 1, or 10 ppm; equivalent to 0, 0.005, 0.05 or 0.5 mg/kg bw per day (a) Duration: 96 weeks | Nodular hepatic hyperplasia (M, F) HCC (M, F) | 0.005 0.005 | 0.05 0.05 |
| Lijinsky et al. (1981) | Rat, F344 (M, F) No/group: 20 Drinking water: 33.3 mg/L on 5 days/week; equivalent to 1.2 mg/day per day (a) historical controls available Duration: 30 weeks Observation: 70 weeks | HCC, liver sarcoma, leukaemia | 1.2 | |
| Ito et al. (1982) | Rat, Wistar (M) No/group: 7–17 Diet: 0, 0.1, 1 or 10 mg/kg bw per day Duration: 96 weeks | Liver: Hyperplastic nodules, HCC, fibrosarcoma Liver endothelioma |
0.1 1 |
1 10 |
| Brantom 1983 (Thesis) with calculations in Peto et al. (1984, 1991a,b) |
Rat, Wistar (M, F) No/sex/group: 60 Drinking water: 0, 0.033, 0.066, 0.132, 0.264, 0.528, 1.056, 1.584, 2.112, 2.640, 3.168, 4.224, 5.280, 6.336, 8.448, 16.896 ppm Equivalent to for M: 0, 0.002, 0.004, 0.008, 0.02, 0.03, 0.07, 0.1, 0.14, 0.17, 0.2, 0.27, 0.34, 0.41, 0,54, 1.08 mg/kg bw per day (a) For F: 0, 0.003, 0.006, 0.011, 0.02, 0.05, 0.09, 0.14, 0,18, 0.23, 0.28, 0.37, 0.46, 0.55, 0.73, 1.47 mg/kg bw per day (a) Duration: 12 months, 18 months, lifetime |
↓ Survival M/F Liver tumours including HCC (Brantom) M/F Bile epithelial tumour M/F Mesenchymal liver tumours M/F |
0.17/0.23 0.1/0.003 0.1/0.14 |
0.2/0.28 0.002/0.003 0.14/0.006 0.14/0.18 |
| Lijinsky and Reuber (1984) | Rat, F344 (F) No/group: 20 Drinking water on 5 days/wk: 0, 5.5 or 13 mg/L; equivalent to 0, 0.19 or 0.46 mg/kg bw per day (a) Duration: 30 weeks | HCC Liver haemangiosarcoma | 0.19 | 0.19 0.46 |
| Lijinsky et al. (1987) | Rat, F344 (M) No/group: 20 Gavage: 0 or 2 mg/rat (~ 300 g bw) on 2 days/week; equivalent to 0 or 1.9 mg/kg bw per day; Duration: 30 weeks Observation: 63 weeks | HCC, CCC, hepatic haemangiosarcoma, tumours of lung tumours of (alveolar, squamous), kidney (mesenchymal) and nasal mucosa | 1.9 | |
| Fukushima et al. (2005) |
Rat, F344 (M) No/group: > 80 Drinking water: 0, 0.001, 0.01, 0.1, 1 or 10 ppm; equivalent to 0, 0.00005, 0.0005, 0.005, 0.05 or 0.5 mg/kg bw per day (a) Duration: 16 weeks |
↑ Number and size or preneoplastic liver lesions | 0.005 | 0.05 |
| Takayama et al. (1963) | Mouse, ddN (M, F) No/sex/group: > 12 Diet: 50 ppm; equivalent to 7.5 mg/kg bw per day (a) ; no control Duration: 5 months | Lung AD and liver haemangio‐endothelioma | 7.5 | |
| Toth et al. (1964) | Mouse, Balb/c (M, F) No/sex/group: 41–46 Drinking water: 0 or 0.001%; equivalent to 0 or 0.9 mg/kg bw per day (a) Duration: 141 days | ↓Survival tumours in lung and liver | 0.9 | |
| Takayama et al. (1965) | Mouse, ddN (M) No/group: 17–21 Diet: 7.1 or 17.7 mg/kg bw per day; no control Duration: 5 months Observation: ~ 6.5 months | AD/CA in lung and hepatic haemangiosarcoma | 7.1 | |
| Takayama et al. (1965) | Mouse, ICR (M) No/group: 11–17 Diet: 6.7 or 18.9 mg/kg bw per day; no control Duration: 5 months Observation: 6.8–10 months | AD/CA in lung and hepatic haemangiosarcoma | 6.7 | |
| Takayama et al. (1965) | Mouse, C3H/AHe (M) No/group: > 9 Diet: 0 or 5.3 mg/kg bw per day Duration: 5 months Observation: 11 months | AD in lung and kidney HCA/HCC | 5.3 | |
| Terracini et al. (1966) | Mouse (M, F) No/sex/group: > 7 Drinking water: 0 or 0.0025% (3 weeks) and 0.0005% (35 weeks); equivalent to 0 or 4.5 and 0.45 mg/kg bw per day (a) Duration: 38 weeks | Tumours in liver, lung, kidney | 0.45–(4.5) | |
| Clapp et al. (1968) | Mouse, RF (M) No/group: > 50 Drinking water: 0 or 0.94 mg/kg bw per day Mean duration: 366 days Observation: 616 days | ↓ Survival Hepatic haemangiosarcoma and endothelioma, AD of lung |
0.94 0.94 |
|
| Clapp and Toya (1970) | Mouse, RF (M) No/group: 17–262 Drinking water: 0, 0.4, 0.43, 0.91 or 1.8 mg/kg bw per day Duration with increasing dose: 262, 224, 406, 266 or 49 days; respective Cumulative dose: 0, 89, 170, 243 or 87 mg/kg |
↓ Survival Hepatic haemangiosarcoma HCC Lung AD |
0.43 (406 days)–1.8 (49 days) 1.8 (49 days) or 0.43 (406 days) 0.4 (224 days) 0.4 (224 days)–1.8 (49 days) |
|
| Clapp et al. (1971) |
Mouse, Balb/c (M) No/group: 18–82 Drinking water: 0 or 1.7 mg/kg bw per day Duration: 285 days |
Hepatic haemangiosarcoma Lung tumours | 1.7 | |
| Clapp et al. (1971) | Mouse, RF (M) No/group: > 90 Drinking water: 0 or 0.91 mg/kg bw per day Duration: 267 days Cumulative dose: 0 or 243 mg/kg | Hepatic haemangiosarcoma lung tumours | 0.91 | |
| Den Engelse (1974) | Mouse, C3Hf (M, F) No/group: > 17 Drinking water: 0 or 10 ppm, equivalent to 0 or 0.9 mg/kg bw per day (a) Duration: 13 weeks Observation: 58–99 weeks | Hepatoma (M), hepatic haemangioma (F) | 0.9 | |
| Griciute et al. (1981) | Mouse, C57Bl (M, F) No/sex/group: > 30 Gavage: 0.03 mg/mouse (20 g) on 2 days/week; equivalent to 0.43 mg/kg bw per day; no control Duration: 50 weeks Observation: 80 weeks | HCC, hepatic haemangioendotheliosarcoma | 0.43 | |
| Anderson et al. (1986) | Mouse, A/J (M) No/group: 49–100 Drinking water: 0 or 0.5 ppm; equivalent to 0 or 0.05 mg/kg bw per day (a) Duration 12–18 weeks | Papillomas of forestomach (18 weeks) | 0.05 | |
| Tomatis et al. (1964) | Hamster, Syrian Golden (M, F) No/sex/group: > 26 Drinking water: 25 mg/L, (consumption of 100 mL drinking water/kg bw per day assumed) equivalent to 2.5 mg/kg bw per day; no control Duration: 6 weeks; 2 weeks break; 5 weeks treatment; Observation: 70 weeks | HCC, CCC, hepatic haemagioendothelioma | 2.5 | |
| Homburger et al. (1976) |
Hamster, Syrian Golden (M, F) No/group: > 9 Drinking water: 0 or 1 mg/L (consumption of 100 mL drinking water/kg bw per day assumed) equivalent to 0 or 0.1 mg/kg bw per day Duration: 60 weeks |
No significant tumour formation; CA in stomach of 1 animal | 0.1 | |
| Love et al. (1977) |
Hamster, Syrian Golden (M, F) No/sex/group: > 46 Drinking water: 0 or 15 mg/L on 5 days/week; (consumption of 100 mL drinking water/kg bw per day assumed) equivalent to 0 or 1.1 mg/kg bw per day Duration: 19–23 weeks Observation: 19–23 weeks |
HCC, CCC, hepatic Kupffer cell sarcoma | 1.1 | |
| Lijinsky et al. (1987) | Hamster, Syrian Golden (M) No/group: 10–20 Gavage: 0.75 or 1.5 mg/animal on 1–2 days/week; (assuming 135 g bw) equivalent to 0.79 or 1.58 mg/kg bw per day; no control Duration: 4–6.5 weeks (1.58 mg) or 20 weeks (0.79 mg) |
HCC, CCC, tumour of nasal mucosa Haemangiosarcoma in liver |
0.79 |
1.58 (4 weeks) 0.79 (20 weeks) |
| Le Page et al. (1969a) | Guinea pig (M) No/group: 6 Diet: 0, 12.5, 25 or 50 ppm (60 g food/kg bw per day assumed) equivalent to 0, 0.75, 1.5 or 3 mg/kg bw per day Duration: 49 weeks | Tumours in liver | 0.75 | 1.5 |
|
Le Page and Christie (1969b) |
Rabbit (M, F) No/sex/group: 4–8 Diet: 0, 25, 50 or 100 ppm (assuming 75 g feed/kg bwper day (b) ; equivalent to 0, 1.9, 3.8 or 7.5 mg/kg bw per day Duration: up to 83 weeks | ↓ Survival Tumours in liver (hepatocellular and bile epithelial) | 1.9 | 3.8 1.9 (F) |
| Koppang and Rimeslåtten (1976) | Mink (M, F) No/sex/group: > 11 Diet for M: 0, 0.04, 0.06, or 0.13 mg/kg bw per day; for F: 0, 0.05, 0.06, 0.08, 0.17 mg/kg bw per day Duration: 122–670 days | Hepatic venopathy (122 days) M/F Haemangiomas in liver (321–670 days) M/F |
0.06/0.08 0.06/0.08 |
0.13/0.17 0.13/0.17 |
|
Adamson et al. (1982) Thorgeirsson et al. (1994) |
Monkey (4 Rhesus, 2 Cynomolgus) (sex not specified) No animals: 4/6 necropsied i.p. application: 0 or 10 mg/kg bw 1×/2 weeks; equivalent to 0.71 mg/kg bw per day Cumulative dose: 7 g (0.06–12.35) Observation time: 54 (8–118) |
Hepatitis, cirrhosis, hyperplastic nodules | 0.71 | |
| NMEA | ||||
| Druckrey et al. (1967) | Rat, BD (M, F) No/group: 4–11 Drinking water: 1 or 2 mg/kg bw per day; historical controls available Duration/mean tumour induction time: 500 and 360 days | Liver tumours | 1 | |
| Lijinsky et al. (1980) | Rat, F344 (M) No/group: 20 Drinking water: 6 or 30 mg/L on 5 days/week; equivalent to 0.2 or 1.1 mg/kg bw per day (a) ; no control Duration: 30 weeks Observation: ~ 70–120 weeks | Liver tumours (HCC) Tumours of oesophagus and nasal cavity | 0.2 | 0.2 1.1 |
| Lijinsky et al. (1981) | Rat, F344 (sex not specified) No/group: 20 Drinking water: 150 mg/L on 5 days/week; equivalent to 5.4 mg/day/day (a) ; historical controls available Duration: 30 weeks Observation: ~ 30 weeks | ↓ Survival HCC, liver sarcoma, leukaemia, tumours of oesophagus | 5.4 | |
| Lijinsky et al. (1983) | Rat, F344 (F) No/group: 20 Drinking water: 0 or 6 mg/L on 5 days/week; equivalent to 0 or 0.2 mg/day per day (a) Duration: 30 weeks Observation: ~ 30 weeks | Insignificant occurrence of leukaemia and other tumours in oesophagus, stomach, liver | 0.2 | |
| Lijinsky et al. (1987) | Rat, F344 (M) No/group: 16 Gavage: 0 or 2.3 mg/rat (~ 300 g bw) on 2 days/week; equivalent to 0 or 2.2 mg/kg bw per day; Duration: 30 weeks Observation: ~ 45 weeks | ↓ Survival HCC, haemangiosarcoma of liver tumours of lung and nasal mucosa |
2.2 2.2 |
|
| Lijinsky et al. (1987) | Hamster, Syrian Golden (M) No/group: 9–20 Gavage: 0.9 mg/animal on 1 or 2 days/week; (assuming 135 g bw) equivalent to 0.95 or 1.9 mg/kg bw per day; no control Duration: 15–20 (0.95 mg) or 25 (1.9 mg) weeks | ↓ Survival HCA/HCC CCA/CCC; tumour of nasal mucosa | 0.95 | 1.9 0.95 |
| NDEA | ||||
| Argus and Hoch‐Ligeti (1961) |
Rat, Wistar (M) No/group: 25 Gavage: 550 μg/rat (assuming 300 g bw) on 5 days per week; equivalent to 1.31 mg/kg bw per day; no control Duration: 22–35 weeks |
HCC | 1.31 | |
| Rajewsky et al. (1966) | Rat, Wistar (M) No/group: 50 Drinking water: 0 or 5 mg/kg bw per day; Duration: up to 200 days | HCC | 5 | |
| Druckrey et al. (1967) | Rat, BD (M, F) No/sex/group: 4–67 Drinking water: 0.075, 0.15, 0.3, 0.6, 1.2, 2.4, 4.8, 9.6 or 14.2 mg/kg bw per day; historical controls available Duration/tumour induction timer: 68–750 days | Liver tumours, squamous cell carcinoma of oesophagus | 0.075 | 0.15 |
| Reuber and Lee (1968) | Rat, Buffalo (M, F); age at start of treatment: 4, 12, 24 or 52 weeks old No/sex/group: 10–14 Diet: 0.0114%, equivalent to 5.7 mg/kg bw per day(a); no control Duration: 26 weeks | ↓ Body weight (age 4 weeks) HCC (F > M) (age 4 weeks) Hep. nodules (F > M) (age 12 weeks) | 5.7 | |
| Hadjiolov et al. (1972) | Rat, Wistar (M) No/group: 25 Drinking water: 1 mg/rat/days; (assuming 300 g bw) equivalent to 3.3 mg/kg bw per day; no control Duration: 22 weeks Observation: further 10 weeks | HCC, hepatic haemangioendothelial sarcoma | 3.3 | |
| Nixon et al. (1974) | Rat, Wistar (M, F) No/sex/group: 20 Drinking water: 0, 0.2 or 1 mg/kg bw per day Duration: 14–15 months (0.2 mg/kg bw per day) or 7–8 months (2 mg/kg bw per day) | Hepatoma | 0.2 (M, F) | |
| Nixon et al. (1974) | Rat, F344 (M, F) No/sex/group: 16 Drinking water: 0 or ~ 0.1 mg/kg bw per day Duration: 20 months | No significant tumour formation | ~ 0.1 | |
| Kroes et al. (1974) |
Rat, Wistar (M, F) No/sex/group: > 18 Gavage: 0 or 0.005 mg/rat on 5 days/week; (assuming a bw of 300 g/200 g for M/F) equivalent to 0 or 0.012 (M)/0.018 (F) mg/kg bw per day Duration: lifetime |
No significant tumour induction | 0.012/0.018 (M/F) | |
| Takayama et al. (1975) | Rat, Donryu (M) No/group: 24 Drinking water: 50 ppm; equivalent to 2.5 mg/kg bw per day (a) ; no control Duration: 2 weeks Observation: 34–78 weeks | Liver tumours | 2.5 | |
| Reuber (1975) | Rat, Buffalo (M, F) No/sex/group: 14 Diet: 0.0114% (114 ppm); equivalent to 5.7 mg/kg bw per day (a) ; no control Duration: 26 weeks | CA of oesophagus: M > F HCC and sarcoma of liver: F > M | 5.7 | |
| Lijinsky and Taylor (1979) | Rat, SD (M, F) No/sex/group: 6 Drinking water: 70 mg/L on 5 days/week equivalent to 2.5 mg/kg bw per day (a) ; no control Duration: 30 weeks Observation: ~ 30 weeks | ↓ Survival HCC, sarcoma of liver papilloma + CA of oesophagus | 2.5 | |
| Lijinsky et al. (1981) | Rat, F344 (F) No/group: 12–20 Drinking water: 0, 0.45, 1.1, 2.8, 7, 18, 45, or 113 mg/L on 5 days/week; equivalent to 0, 0.02, 0.04, 0.1, 0.25, 0.6, 1.6 or 4.0 mg/kg bw per day (a) Duration: up to 104 weeks | HCC Tumours of oesophagus and stomach | 0.02 (60 weeks) 0.02 (104 weeks) | |
| Lijinsky et al. (1981) | Rat, F344 (M, F randomly allocated to groups) No/group: 20 Drinking water: 45 mg/L on 5 days/week equivalent to 1.62 mg/kg bw per day (a) ; no control Duration: 22 weeks Observation: ~ 30 weeks | ↓ Survival HCC Tumours of oesophagus and forestomach | 1.62 | |
| Lijinsky et al. (1983) | Rat, F344 (F) No/group: 20 Drinking water: 0 or 7 mg/L on 5 days/week; equivalent to 0 or 0.25 mg/day per day (a) Duration: 30 weeks Observation: ~ 30 weeks | ↓ Survival Tumours of oesophagus | 0.25 | |
| Brantom 1983 (Thesis) with calculations in Peto et al. (1991a,b) |
Rat, Wistar (M, F) No/sex/group: 60 Drinking water: 0, 0.033, 0.066, 0.132, 0.264, 0.528, 1.056, 1.584, 2.112, 2.640, 3.168, 4.224, 5.280, 6.336, 8.448, 16.896 ppm Equivalent to for M: 0, 0.002, 0.004, 0.008, 0.02, 0.03, 0.07, 0.1, 0.14, 0.17, 0.2, 0.27, 0.34, 0.41, 0,54, 1.08 mg/kg bw per day (a) For F: 0, 0.003, 0.006, 0.011, 0.02, 0.05, 0.09, 0.14, 0,18, 0.23, 0.28, 0.37, 0.46, 0.55, 0.73, 1.47 mg/kg bw per day (a) Duration: 12 months, 18 months, lifetime |
↓ Survival M/F Liver tumours (including HCC, Brantom) M/F Tumours in oesophagus M | 0.1/0.05 ~ 0.004/–~ 0.02/0.02 | 0.14/0.09 ~ 0.008/0.003 ~ 0.03/0.05 |
| Berger et al. (1987) | Rat, SD (M) No/group: 80 Drinking water: 0, 0.01, 0.032 or 1 mg/kg bw on 5 days/week; equivalent to 0, 0.007, 0.023 or 0.07 mg/kg bw per day Duration: lifetime |
↓ Survival Tumours in liver, gastrointestinal and urinary tract |
0.007 | 0.023 0.007 |
| Lijinsky et al. (1987) | Rat, F344 (M) No/sex/group: 16 Gavage: 2.5 mg/rat (~ 300 g bw) on 2 days/week; equivalent to 2.4 mg/kg bw per day; no control Duration: 20 weeks Observation: ~ 45 weeks | ↓ Survival HCC, tumours of oesophagus and nasal mucosa | 2.4 2.4 | |
| Cortinovis et al. (1991) | Rat, SD (M) No/sex/group/time point: ~ 8 Drinking water: 0 or 5 ppm; equivalent to 0.25 mg/kg bw per day (a) Duration: 10–65 weeks | HCA, HCC and oesophageal papillomas after 40 weeks ↑ No of preneoplastic liver lesions after 15 weeks | 0.25 0.25 | |
| Schmähl et al. (1963) | Mouse, DBA (M, F) No/sex/group: ~ 14 Drinking water: 0 or 13 mg/kg bw per day Mean tumour induction time: 180 days | Hepatoma, hepatic haemangiosarcoma | 13 | |
| Takayama et al. (1965) | Mouse, ICR (M) No/group: 11 Drinking water: 6.01 mg/kg bw per day; no control Duration: 5 months | AD in lung, HCA and hepatic haemangiosarcoma | 6.01 | |
| Takayama et al. (1965) | Mouse, C3H/AHe (M) No/sex/group: 4–10 Drinking water: 0 or 8.46 mg/kg bw per day Duration: 6.6 months | HCC and hepatic haemangiosarcoma | 8.46 | |
| Schmähl and Thomas (1965) | Mouse, DBA (M, F) No/sex/group: 19–28 Drinking water: 0, 3, 8 or 13 mg/kg bw per day Duration/mean tumour induction time: 290, 170 or 180 days | Hep haemangioendothlioma | 3 | |
| Clapp et al. (1970) | Mouse, RF (M) No/sex/group: 30–162 Drinking water: 0, 2, 3.5, 6 or 11.5 mg/kg bw per day Duration: lifetime Mean age at death with tumour: 9.5–25 months | ↓ Survival Tumours in liver, lung, stomach | 2 | |
| Clapp et al. (1971) | Mouse, Balb/c (M) No/group: 15–60 Drinking water: 0, 3.6, 6.7 mg/kg bw per day Duration: 245–285 days | Hepatic haemangiosarcoma; tumours in oesophagus and stomach | 3.6 | |
| Clapp et al. (1971) | Mouse, RF (M) No/group: > 60 Drinking water: 0 or 6 mg/kg bw per day Duration: 270 days | Hepatocellular tumours Tumours in lung, oesophagus and stomach | 6 | |
| Gray et al. (1991) | Mouse, strain not specified (F) No/group: 10 Drinking water: 0, 0.033, 0.066, 0.132, 0.264, 0.528, 1.056, 1.584, 2.112, 2.640, 3.168, 4.224, 5.280, 6.336, 8.448, 16.896 ppm Equivalent to: 0, 0.01, 0.02, 0.04, 0.07, 0.14, 0.29, 0.43, 0.58, 0.72, 0.87, 1.15, 1.44, 1.73, 2.31, 4.62 mg/kg bw per day (c) Duration: ~ 25 months | Malignant tumours in liver (hepatocell.) Tumours in oesophagus stomach Lung tumours | 0.04 0.14 0.29 | 0.07 0.29 0.43 |
| Herrol and Dunham (1963) |
Hamster, Syrian Golden (M, F) No/sex/group: 15 Gavage: 0 or 3.3 mg/animal 2×/wk (assuming 130 g) equivalent to 0 or 3.34 mg/kg bw per day Duration: 7 months |
Tumours of respiratory tract, liver, kidney and ethmoturbinals | 3.34 | |
| Baker et al. (1974) | Hamster, Chinese (M, F) No/sex/group: 20 Drinking water: 0 or 40 mg/L (100 mL drinking water/kg body weight assumed), equivalent to 0 or 4 mg/kg bw per day Duration: 17–26 days | ↓ Survival HCC; CA of stomach and oesophagus | 4 | |
| Lijinsky et al. (1987) | Hamster, Syrian Golden (M) No/group: 10–20 Gavage: 1 mg/animal (~ 135 g bw) on 1 or 2 days/week; equivalent to 1.1 or 2.1 mg/kg bw per day; no control Duration: 20 (1.1 mg) or 25 (2.1 mg) weeks | ↓ Survival HCC and hepatic haemangiosarcoma Tumour of nasal mucosa | 1.1 1.1 | 2.1 2.1 |
| Gray et al. (1991) | Hamster, strain not specified (F) No/group: 10 Drinking water: 0, 0.033, 0.066, 0.132, 0.264, 0.528, 1.056, 1.584, 2.112, 2.640, 3.168, 4.224, 5.280, 6.336, 8.448, 16.896 ppm; equivalent to: 0, 0.003, 0.01, 0.02, 0.03, 0.05, 0.11, 0.16, 0.22, 0.27, 0.33, 0.44, 0.55, 0.66, 0.88 or 1.75 mg/kg bw per day(c) Duration: 22 months | Tumours in liver Tumours in trachea | 0.05 0.27 | |
| Druckrey et al. (1962) |
Guinea pig (M) No/group: 11 Drinking water: 5 mg/kg bw per day; no control Duration/mean tumour induction time: ~ 240 days |
HCA, HCC | 5 | |
| Argus and Hoch‐Ligeti (1963) | Guinea pig (M) No/group: 10 Drinking water: highly variable dosing 0–4.2 mg animal per day (assuming 1.1 kg bw) equivalent to 0–3.8 mg/kg bw per day; no control Duration: 30–40 weeks | Tumours in liver, lung | 0–3.8 | |
| Lombard (1965); Schmähl et al. (1978) | Guinea pig (M) No/group: not specified Route: not specified; 8–40 mg animal/days; (assuming 1.1 kg bw) equivalent to 7.3–36.6 mg/kg bw per day Duration: not specified | HCA | ~ 7.3–36.6 | |
| Arcos et al. (1969) | Guinea pig (M) No/group: ~ 20 Drinking water: 1.2 mg/kg bw per day; no control Duration: 4, 8, 12, 16, 20 or 24 weeks Observation: 12 months | Liver tumours | 1.2 (12 weeks) | |
| Rapp et al. (1965) |
Rabbit, New Zealand (M, F) No/sex/group: 3–13 Drinking water: 0 or 42 mg/L on 6 days/week (assuming 2 kg bw and 200 mL water consumption/days) equivalent to 0 or 3.6 mg/kg bw per day Duration: 52–82 weeks |
CA of liver and lung | 3.6 | |
| Schmähl et al. (1965) | Rabbit, mixed strains (M) No/group: 2 Drinking water: 3.4 mg/kg bw per day; no control Duration: 700–800 days | Hepatic CA | 3.4 | |
| Hirao et al. (1974) |
Dog (mongrel) (M) No/group: ~ 14 Drinking water: 50, 100 or 500 mg/L (assuming 100 mL water consumption/kg bw/days) equivalent to 5, 10 or 50 mg/kg bw per day; no control Duration: 2–50 weeks Observation: 175 weeks |
HCC, CCC and mesenchymal liver tumours (haemangioma, haemangiosarcoma, fibroma, leiomyoma, leiomyosarcoma, haemangioendothelioma) CA of nasal mucosa |
5 | |
| Schmähl et al. (1978) |
Cat, domestic (F) No/sex/group: 10 Milk: 0 or 1.5–2 mg/kg bw per day Duration: ~ 500 days |
HCC, cholangioma | 1.5–2 | |
| Schmähl et al. (1967) |
Pig, Holländer (M, F) No/sex/group: 2 Drinking water: 4.4 mg/kg bw per day; no control Duration: 313–334 days |
Cirrhosis, liver tumours, AD of kidney, CA of ethmoid cavity | 4.4 | |
| Schmähl et al. (1969) |
Pig, Holländer (F) No/group: 2 Drinking water: 1.5–3 mg/kg bw per day; no control Duration: 470 and 594 days |
Hepatoma, CA of ethmoid cavity AD of kidney | 1.5–3 | |
| Graw and Berg (1977) |
Mini‐pig, Göttingen (sex not specified) No/group: 6 Oral application (injection into mouth): 0.4 mg/kg bw on 5 days/wk on 42 weeks/year; equivalent to 0.23 mg/kg bw per day; no control Duration: 5 years |
Liver fibrosis HCA, HCC, Kupffer cell‐sarcoma | 0.23 | |
| Monkey, Cynomolgus, Rhesus (M, F) Diet: 40 mg/kg bw per day on 5 days/week; equivalent to 28.6 mg/kg bw per day; tumours in untreated controls: 7/90 Start of treatment: at birth, 1–8 months post‐partum or adulthood. Duration until tumour appearance: 49(Rh, F), 52 (Rh, m), 31 (Cy, f), 25 (Cy, m) months; total dose: 8.8 g (Rh, F), 10.2 (Rh, m), 7.1 g (Cy, f), 18 g (Cy, m). | HCC in 31/40 animals | 28.6 | ||
| Monkey. Cynomolgus, Rhesus (M, F) i.p application: 40 mg/kg bw on 2 days/months, i.e. 2.7 mg/kg bw per day; Start of treatment: at birth, 1–8 months post‐partum or adulthood Mean duration until tumour appearance: 17 months (except 18 months for Cy,M); mean total dose: 1.1 g (for all except 1.3 g for Cy,M) |
HCC 112/128 |
2.7 |
||
| Thorgeirsson et al. (1994) | Monkey, Rhesus, Cynomolgus, African Green, Rhesus x Cynomolgus (sex not specified) No/group: 10–106 Newborn at first treatment i.p. application: 0.1, 1, 5, 10, 20, 40 every 2 weeks; equivalent to 0.007, 0.07, 0.35, 0.7, 1.4 and 2.8 mg/kg bw per day; untreated controls available Mean duration/tumour induction time: 157 (111–177), 74 (52–109), 38 (14–64), 25(13–39), 16 (6–49) months. Total dose: 0.104 (0.056–0.146), 1.78 (1.66–2.74), 2.70 (1.47–5.81), 2.02 (1.22–4.14), 2.40 (0.83–4.65), 1.59 (0.39–4.08) g | In 4/11 animals | 0.007 | 0.07 |
| Adamson et al. (1979, 1983) Thorgeirsson et al. (1994) |
Monkey, Bush baby G. crassicaudatus (M, F) No/group: 10–14 i.p. application: 0 or 10–30 mg/kg bw per day on 2 days/months, i.e. 0.6–2 mg/kg bw per day; untreated controls available; Mean duration/tumour induction time: 22.9 months (range: 15–32 months); average total dose: 0.75 g (range: 0.3–1.49 g) |
Mucoepidermoid CA of nasal mucosa >> HCC | 0.6–2 | |
| NDPA | ||||
| Druckrey et al. (1967) | Rat, BD (M, F) No/group: 15 Drinking water: 4, 8, 15 or 30 mg/kg bw per day; historical controls available Duration/tumour induction time: 120–300 days | HCC Papilloma/CA of oesophagus CA of tongue | 4 | |
| Althoff et al. (1973) from IARC (1978) | Rat, SD (M, F) No/sex/group: not specified s.c. application: 24.3, 48.7 or 97.4 mg/kg bw/once per week; equivalent 3.5, 7 or 13.9 mg/kg bw per day; no control? Duration: lifetime | AD/CA in kidney | 3.5 | 7 |
| Reznik et al. (1975) | Rat, SD (M, F) No/sex/group: 10 s.c. application: 0, 24.4, 48.7 or 97.4 mg/kg bw on 1 days/week; equivalent to 0, 3.5, 7, or 13.9 mg/kg bw per day Duration: lifetime | ↓ Survival Tumours of nasal cavity Tumours of lung (M) Tumours of liver | 3.5 7 | 3.5 3.5 7 13.9 |
| Lijinsky and Taylor (1979) | Rat, SD (M) No/sex/group: 15 Drinking water: 90 mg/L on 5 days/wk equivalent to 3.2 mg/kg bw/ per daya; no control Duration: 30 weeks Observation: ~ 50 weeks | ↓ Survival HCC, Ppapilloma+CA of oesophagus CA of nasal turbinates |
3.2 3.2 |
|
| Lijinsky et al. (1981) | Rat, F344 (M, F) No/group: 20 Drinking water: 45 mg/L on 5 days/week; equivalent to 1.6 mg/kg bw per daya; historical controls available Duration: 30 weeks Observation: ~ 40 weeks | ↓ Survival CA of oesophagus, forestomach, tongue | 1.6 1.6 | |
| Linjinsky et al. (1983) | Rat, F344 (M, F) No/sex/group: 12–20 Gavage: 0 or 4.4 mg/kg bw for M and 0 or 2.2 mg/kg bw for F on 2 days/week; equivalent to 0 or 1.3 mg/kg bw per day for M and to 0 or 0.62 mg/kg bw per day for F Duration: 30 weeks | ↓ Survival HCC, CA of nasal cavity, oesophagus and forestomach | 1.3/0.62 (M/F) 1.3/0.62 (M/F) | |
| Dickhaus et al. (1977) | Mouse, NMRI (F) No/group: 12–14 s.c. application: 0, 34.4, 68.9 or 137.8 mg/kg bw on 1 days/week; equivalent to 0, 4.9, 9.8 or 19.6 mg/kg bw per day Duration: lifetime | ↓ Survival Tumours in nasal cavity, lung, pharynx, oesophagus and stomach |
4.9 4.9 |
|
| Pour et al. (1973, 1974) | Hamster, Syrian Golden (M, F) No/group: > 19 s.c. application: 0, 3.75, 7.5, 15, 30, or 60 mg/kg 1×/week; equivalent to 0, 0.53, 1.07, 2.14, 4.28 or 8.6 mg/kg bw per day Duration: lifetime | ↓ Survival Tumours of (para)nasal cavities and in upper and lower respiratory tract | 0.53 | 1.07 0.53 |
| Adamson et al. (1979, 1983); Thorgeirsson et al. (1994) | Monkey (4 Rhesus, 2 Cynomolgus) (sex not specified) No/group: 6 i.p. application: 40 mg/kg bw; 2×/month; equivalent to 2.7 mg/kg bw per day Mean duration/tumour latency: 29 months (22–33 months); Total dose 6.97 g (6.07–7.86 g) | HCC 6/6 | 2.7 | |
| NDIPA | ||||
| Druckrey et al. (1967) | Rat, BD (M, F) No/group: ~ 10 Gavage: 25 and 50 mg/kg bw per day; historical controls available Duration/tumour induction time: 430–770 days | Malignant liver tumours | 25 | |
| Lijinsky and Taylor (1979) | Rat, SD (M) No/group: 15 Drinking water: 90 or 600 mg/L on 5 days/wk equivalent to 3.2 or 21.46 mg/day per day(a); no control Duration: 50 weeks for 5.8 mg/kg bw per day or 40 weeks for 38.6 mg/kg bw per day Observation: ~ 50 weeks | ↓ Survival CA of nasal turbinates HCC | 3.2 | 3.2 3.2 21.4 |
| NEIPA | ||||
| Druckrey et al. (1967) | Rat, BD (M, F) No/group: 14 Drinking water: 10 or 20 mg/kg bw per day; historical controls available Mean tumour induction time: 345 and 375 days | HCC, CA of oesophagus, pharynx and forestomach | 10 | |
| NMBA | ||||
| Lijinsky et al. (1980) | Rat, F344 (M, F) No/sex/group: 20 Drinking water: 6.25 (for M) or 16 mg/L (for M and F) on 5 days/week; equivalent to 0.23 mg/kg bw per day (for M) or 0.57 mg/day per day(a) (for M and F); historical controls available Duration: 20–23 weeks Observation: lifetime | ↓Survival Papilloma and CAs of oesophagus, forestomach, oropharynx, tongue | 0.23/0.57 (M/F) 0.23/0.57 (M/F) | |
| Koreeda et al. (1999) | Rat, F344 (M) No/group: 20–27 Drinking water: 15 mg/L; equivalent to 0.75 mg/kg bw per day(a) ; no control Duration: 17–21 weeks | Papilloma and CA of oesophagus | 0.75 | |
| Stoner et al. (2006) |
Rat, F344 (M) No/group: 10–20 s.c. application: 0 or 0.25 mg/kg bw on 1 days/week; equivalent to 0 or 0.04 mg/kg bw per day Duration: 15 weeks Observation: 8 weeks after end of treatment |
Papilloma and CAs of oesophagus | 0.04 | |
| Lijinsky et al. (1988) | Hamster, Syrian Golden (M, F) No/sex/group: 20 Gavage: 0, 2.5 or 5 mg/one per week; unclear if dose is given per animal or kg bw Duration: 23–30 weeks | Papilloma and CA of forestomach, AD of liver, AD and CA of nasal mucosa | At the lower dose but unclear dosage | |
| NMVA | ||||
| Druckrey et al. (1967) | Rat, BD (M, F) No/group: 5–14 Drinking water: 0.3 or 0.6 mg/kg bw per day; historical controls available Duration/mean tumour induction time: 390 or 270 days | CA of oesophagus, tongue, pharynx | 0.3 | |
AD: adenoma; CA: carcinoma: HCA: hepatocellular adenoma; HCC: hepatocellular carcinoma; CCC: cholangiocellular carcinoma.
Applying EFSA default values.
Animal dietary exposure: overview of current approaches used at EFSA (EFSA, 2019b).
Based on suggestions of authors, compound uptake in mg/kg bw per day was calculated as follows: ppm values were multiplied by the density factor of 0.942 and a water consumption of 290 mL/kg bw for female mice and 110 mL/kg bw for female hamsters was assumed.
For NDMA, most of the long‐term studies were conducted in male and female rats of various strains applying a wide dose range, i.e. 0.005–10 mg/kg bw per day (diet), 0.00005–1.47 mg/kg bw per day (drinking water) or 0.95–2.86 mg/kg bw per day (gavage). The shortest duration of the carcinogenicity assays was 5 months while most studies were conducted until the appearance of tumours close to the end of lifetime. The authors reported on tumour formation mostly in liver, lung and kidney (Magee and Barnes, 1956, 1962; Zak et al., 1960; Argus and Hoch‐Ligeti, 1961; Geil et al., 1968; Keefer et al., 1973; Hadjiolov et al., 1974; Lijinsky et al., 1981, 1987; Ito et al., 1982; Brantom, 1983; Lijinsky and Reuber, 1984; Peto et al., 1991a,b). Histopathological analyses specified the liver tumours as hepatocellular carcinoma (HCC) (Druckrey et al., 1967; Hoch‐Ligeti et al., 1968; Arai et al., 1979; Lijinsky et al., 1981, 1987; Ito et al., 1982), Lijinsky and Reuber, 1984; endothelioma (Ito et al., 1982), liver sarcoma (Druckrey et al., 1967; Lijinsky et al., 1981) and cholangiocellular carcinoma (Lijinsky et al., 1987). The hepatic sarcoma comprised fibrosarcoma (Ito et al., 1982) and haemangiosarcoma (Lijinsky et al., 1981 and Reuber, 1984). The tumours in the kidney were described as adenocarcinoma (Argus and Hoch‐Ligeti, 1961), epithelial and partly anaplastic carcinoma (Zak et al., 1960) and in the lung as squamous cell or adenocarcinoma (Argus and Hoch‐Ligeti, 1961). The occurrence of Leydig cell tumours (Terao et al., 1978), carcinoma of the nasal mucosa (Lijinsky, 1987) and leukaemia (Lijinsky et al., 1981) was reported occasionally.
With regard to the development of tumour precursor lesions, Arai et al. (1979) reported on an increase in nodular hepatic hyperplasia in male and female Wistar rats, receiving 0.05 mg/kg bw per day for a period of 96 weeks. When applying an identical dose, Fukushima et al. (2005) described an increase in size and number of preneoplastic liver foci within 16 weeks of treatment in male F344 rats.
The most sensitive endpoint was the occurrence of liver tumours at the lowest dose, i.e. 0.002 and 0.003 mg/kg bw per day in male and female Wistar rats, respectively. In this exceptional study, 15 different dose levels, ranging between 0.002 and 1.47 mg/kg bw per day, were applied for a period of 12–18 months or for lifetime to 60 males and females per dose group (Brantom 1983). The histology of liver tumours was described as hepatocellular nodules, adenoma and carcinoma and biliary cystadenoma. At higher doses, haemangiosarcoma and occasionally Kupffer cell tumours were found.
In male and female mice of various strains, NDMA was applied at doses of 0.05–1.8 mg/kg bw per day (drinking water), 5.3–18.9 mg/kg bw per day (diet) or 0.43 mg/kg bw per day (gavage). The duration of the treatments varied between 7 and 50 weeks. Liver, lung and kidney were the most frequently affected organs (Takayama and Oota, 1963, 1965; Toth et al., 1964; Terracini et al., 1966; Clapp et al., 1968, 1971; Clapp and Toya, 1970; Den Engelse, 1974; Griciute et al., 1981). The benign and malignant liver tumours were mostly HCC and carcinoma, haemangioendothlioma or haemangiosarcoma. Lung tumours were described as adenoma and carcinoma. The most sensitive endpoint in mice was reported by Anderson et al. (1986), i.e. the occurrence of papillomas in the forestomach at 0.05 mg/kg bw per day, given via drinking water to male A/J mice for 12–18 weeks. A further sensitive endpoint was the development of HCC and hepatic haemangiosarcoma in male and female C57Bl mice receiving 0.43 mg/kg bw per day via gavage for a period of 50 weeks (Griciute et al., 1981).
In studies on Syrian Golden hamsters, NDMA was applied at doses of 0.1–2.5 mg/kg bw per day via drinking water or at 0.79–1.58 mg/kg bw per day via gavage for a period of 4–60 weeks (Tomatis et al., 1964; Homburger et al., 1976; Love et al., 1977; Lijinsky, 1987). Hepatocellular and cholangiocellular carcinoma, haemangioendothelioma, haemangiosarcoma and/or Kupffer cell sarcoma developed in the liver (Tomatis et al., 1964; Love et al., 1977; Lijinsky, 1987). Besides hepatic haemangiosarcoma, tumours in the nasal mucosa were reported by Lijinsky (1987), after 0.79 mg/kg bw per day, applied via gavage to male hamsters for 20 weeks; this is considered the most sensitive endpoint in hamster. However, this study lacks a negative control. No significant tumour formation was found after treatment with 0.1 mg/kg bw per day, provided to male and female hamsters via drinking water for 60 weeks (Homburger et al., 1976).
Male guinea pigs developed liver tumours when exposed to 1.5 mg/kg bw per day in the diet for a period of 49 weeks (Le Page and Christie, 1969a).
In female rabbits, hepatocellular and bile epithelial tumours occurred at 1.9 mg/kg bw per day provided by the diet for 83 weeks (Le Page and Christie, 1969b).
Minks were exposed via diet to daily doses of 0.05–0.17 mg/kg bw for 122–670 days (Koppang and Rimeslåtten, 1976). At the highest dose, intrahepatic venopathy and haemangiomas were observed in male and female animals.
Four of six monkeys (four Rhesus, two Cynomolgus) treated once per 2 weeks with 10 mg/kg bw (calculated: 0.71 mg/kg bw per day) via i.p application were necropsied. The histopathological analyses revealed no tumour formation but signs of severe hepatotoxicity, such as hepatitis and cirrhosis. The occurrence of hyperplastic liver nodules was reported as well (Adamson and Sieber, 1983).
NDMA‐induced transplacental carcinogenesis was reported for rats and mice, as given in detail in Section 3.1.2.6.
NMEA was tested in male and female BD and F344 rats at 0.2–5.4 mg/kg bw per day via drinking water or 2.2 mg/kg bw per day via gavage (Druckrey et al., 1967; Lijinsky et al., 1980, 1981, 1983, 1987) for 30–71 weeks. Tumours in liver, oesophagus and nasal mucosa and occasionally also leukaemia were reported. The most sensitive endpoint was the development of liver tumours, including HCC, when male F344 rats received the compound at 0.2 mg/kg bw per day for 30 weeks; however, this study is lacking a negative control but refers to historical control data (Lijinsky and Reuber, 1980).
One study was performed in male Syrian Golden hamsters (Lijinsky et al., 1987). Gavage of 0.95 mg/kg bw per day for 15–20 weeks induced hepatocellular adenoma and carcinoma, cholangiocellular adenoma and carcinoma and tumours of the nasal mucosa.
NDEA was applied to male and female rats of various strains at 0.002–14.2 mg/kg bw per day via drinking water, 5.7 mg/kg bw per day in the diet or 0.012–2.4 mg/kg bw per day by gavage. The duration of the treatment varied from 2 weeks to lifelong. The major tumour site was the liver, followed by the oesophagus, forestomach, stomach, nasal and oral mucosa and the urinary tract (Argus and Hoch‐Ligeti, 1961; Rajewsky, 1966; Druckrey et al., 1967; Reuber and Lee, 1968; Hadjiolov, 1972; Kroes et al., 1974; Nixon et al., 1974; Reuber, 1975; Takayama and Hitachi‐Masahito Yamada, 1975; Lijinsky and Taylor, 1979; Lijinsky et al., 1981, 1983; Brantom, 1983; Berger et al., 1987; Lijinsky, 1987; Cortinovis et al., 1991; Peto et al., 1991a,b). In the liver, benign and malignant tumours of hepatocellular origin predominated with occasional occurrence also of (haemangioendothelial) sarcoma.
Sensitive endpoints were the occurrence of liver tumours at 0.002–0.007 mg/kg bw per day in male and female rats (Brantom, 1983; Berger et al., 1987; Peto et al., 1991a,b). Berger et al. (1987) showed an increased percentage of male Sprague‐Dawley rats with tumours in the liver and the GI and urinary tract when exposed for life to the lowest dose of this study, i. e. 0.007 mg/kg bw per day via drinking water. This study applied three dose levels and 80 males per dose group over the lifetime of the animals. The liver tumours were hepatocellular adenomas and carcinomas. Premalignant liver lesions were eosinophilic/clear cell or mixed cell/basophilic foci, which occurred at a higher incidence when compared to controls. Tumours of the GI tract were mostly squamous cell carcinoma in the oral cavity and stomach; the histology of urinary tract tumours was not specified (Berger et al., 1987). Basal cell papilloma and carcinoma of the oesophagus were also among sensitive endpoints occurring at 0.03 mg and 0.02 mg/kg bw per day in male and female rats, respectively (Brantom, 1983; Lijinsky et al., 1981).
The most sensitive endpoint was reported by Brantom (1983), i.e. the elevated occurrence of liver tumours in female Wistar rats at the lowest dose of 0.003 mg/kg bw per day. This exceptional study comprises 15 dose levels from 0.002 to 1.47 mg/kg bw per day and 60 male and female animals per group, exposed for 12 or 18 months or lifetime. Brantom (1983) described the histology of liver tumours as hepatocellular nodules, adenoma and carcinoma as well as biliary cystadenoma. At higher dose levels, the incidence of hepatic nodules and HCC increased dose dependently.
Male and female mice of various strains were subjected to NDEA treatment at daily doses of 0.01–13 mg/kg bw via drinking water for 5–25 months. Tumours developed in the liver, oesophagus, stomach and the lung (Schmähl et al., 1963; Schmähl and Thomas, 1965; Takayama and Oota, 1965; Clapp et al., 1970, 1971; Gray et al., 1991). The benign and malignant hepatic tumours were described as being hepatocellular or deriving from the Kupffer cells or the haemangioendothelia. The most sensitive endpoint was the development of HCC in female mice (strain not specified) at a dose 0.07 mg/kg bw, provided for about 25 months (Gray et al., 1991).
Hamsters were exposed to NDEA via drinking water (0.003–4 mg/kg bw per day) or gavage (1.1–3.3 mg/kg bw per day) for periods ranging from 17 days to 22 months. The liver was the most frequent tumour site followed by stomach, oesophagus, kidney, trachea and mucosa of nose and ethmoturbinals (Herrold and Dunham, 1963; Baker et al., 1974; Lijinsky et al., 1987; Gray et al., 1991). The most sensitive endpoint was the development of liver tumours in female hamsters of an unspecified strain at 0.05 mg/kg bw per day applied for 22 months (Gray et al., 1991). The authors described the majority of liver tumours as liver cell or bile duct tumours and did not provide further details. A few reports on male guinea pigs, receiving NDEA via drinking water, indicate that hepatocellular adenoma and carcinoma were induced by daily doses of at least 1.2 mg/kg bw (Druckrey et al., 1962; Argus and Hoch‐Ligeti 1963; Lombard, 1965; Arcos et al., 1969). The occurrence of lung tumours was reported as well (Argus and Hoch‐Ligeti, 1963).
Two independent studies showed the induction of malignant liver and lung tumours in male and female rabbits receiving 3.4–3.6 mg/kg bw per day in the drinking water (Rapp et al., 1965; Schmähl and Thomas, 1965).
Hirao et al. (1974) treated male dogs with 5 mg/kg bw per day for about 3 years, which led to the development of hepatocellular and cholangiocellular carcinoma as well as a great variety of benign or malignant mesenchymal liver tumours, such haemangiosarcoma, fibroma, leiomyoma, leiomyosarcoma, haemangioendothelioma. Malignant tumours were found also in the nasal mucosa.
Female domestic cats developed HCC and cholangioma when receiving 1.5–2 mg/kg bw per day via milk for about 500 days (Schmähl et al., 1978).
Schmähl et al. (1967 and 1969) reported on the occurrence of cirrhosis, liver tumours, adenoma in kidney and carcinoma in the ethmoid cavity, when male and female pigs were treated with 1.5–4.4 mg/kg bw per day for about 11 months. Liver fibrosis, hepatocellular adenoma and carcinoma as well as Kupffer cell sarcoma were induced in mini‐pigs (sex not specified) already by 0.23 mg/kg bw per day after a period of 5 years (Graw and Berg, 1977).
In the context of a long‐lasting programme at the National Institute of Health, NDEA was tested in Rhesus, African Green, Rhesus–Cynomolgus hybrids monkeys and in bush babies (Adamson and Sieber, 1979, 1983; Thorgeirsson et al., 1994). NDEA was applied p.o. on 5 days per week to Cynomolgus, Rhesus and African Green monkeys. For the animals, the dose was gradually increased from 10 to 40 mg/kg bw per day with the initial dose at birth, at 1–8 months post‐partum or as adults. After an average latency period of 38 months, HCC had developed in 32 out of 40 treated animals. There was no clear difference between species or males and females (Adamson et al., 1979). In a second approach, the compound was applied i.p. gradually increasing the dose from 10 mg to 40 mg/kg bw on 2 days per months during the first 6 months of life. The treatment was continued until appearance of tumours, which were specified as HCC. There were no differences in the tumour latency period between the three monkey species. In a third approach, NDEA was applied i.p. at 0.1, 1, 5, 10, 20 or 40 mg/kg in 2‐week intervals to Rhesus, African Green and Rhesus x African Green hybrids. At the second lowest dose (calculated: 0.07 mg/kg bw per day), 4 of 11 animals developed hepatocellular adenoma while no tumours appeared in the lowest dose group (calculated: 0.007 mg/kg bw per day). At higher dose levels, all animals per dose group developed adenoma, i. e. at 0.35, 0.7, 1.4 or 2.86 mg/kg bw per day NDEA induced lesions in all 10, 11, 11 and 106 monkeys, respectively. The animals were treated for up to 10 years. The authors reported an average cumulative carcinogenic dose of 2.18 g/kg bw. In a fourth approach, NDEA was applied i.p. at up to 30 mg/kg bw to 14 bush babies (Galago crassicaudatus). Ten animals developed mucoepidermoid carcinoma of the nasal mucosa and two HCCs. The average cumulative carcinogenic dose was 0.75 g (0.3–1.49 g) and the average tumour time was 22.9 months (range 15–32 months).
Transplacental carcinogenesis was reported for NDEA in rats, mice and hamsters (see Section 3.1.2.6).
NDPA was applied to male and female rats of various strains via drinking water (1.6–30 mg/kg bw per day), gavage (0.62–1.3 mg/kg bw per day) or s.c. application (3.5–13.9 mg/kg bw per day) for 120 days to lifetime (Druckrey et al., 1967; Althoff et al., 1973; Reznik et al., 1975; Lijinsky and Taylor, 1979; Lijinsky et al., 1981, 1983). Tumours occurred at many sites, such as liver, nasal cavity/turbinates, lung, tongue, oesophagus and kidney. The most sensitive endpoint was the occurrence of tumours in different organs in female F344 rats, treated with 0.62 mg/kg bw per day via gavage for 30 weeks (Lijinsky et al., 1983)
A single study in mice (females of NMRI strain) showed tumour development in nasal cavity, lung, pharynx, oesophagus and stomach following s.c. applications of 4.9 mg/kg bw per day for lifetime (Dickhaus et al., 1977).
For male and female Syrian Golden hamsters, two reports demonstrated tumour formation in the nasal and paranasal cavities and in the upper and lower respiratory tract at 0.53 mg/kg bw per day, applied s.c. lifelong (Pour et al., 1973, 1974)
Six monkeys (4 Rhesus, 2 Cynomolgus) received NDPA at 13–40 mg/kg bw bimonthly via i.p. application and all of the animals developed HCC (Adamson et al., 1979 and 1983; Thorgeirsson et al., 1994). The daily dose was calculated to be 0.87–2.7 mg/kg bw. The average cumulative carcinogenic dose was 6.97 g (range: 6.07–7.86 g) and the average tumour induction time 28.5 months (range: 22–33 months).
Transplacental carcinogenesis by NDPA was studied in Syrian Golden hamster. For details, see Section 3.1.2.6.1.
NDIPA induced malignant liver tumours in male and female BD rats, treated with 25 mg/kg bw per day by gavage for 1.5–2 years (Druckrey et al., 1967). In second study, a dose of 3.2 mg/kg bw per day, provided via drinking water for about 50 weeks, caused tumour formation in the nasal turbinates of male SD rats (Lijinsky and Taylor, 1979); at 21.4 mg/kg bw per day HCC developed.
For NEIPA, one study reported the induction of HCC and malignant tumours in oesophagus, pharynx and stomach, when male and female BD rats received 10 mg/kg bw per day via drinking water for about 1 year (Druckrey et al., 1967).
NMBA was a potent carcinogen for the oesophagus in F344 rats when applied s.c. at doses of 0.04 mg/kg bw per day or via drinking water at 0.23–0.75 mg/kg bw per day (Lijinsky et al., 1980; Koreeda et al., 1999; Stoner et al., 2006) for 15–20 weeks. The development of papillomas and carcinomas in forestomach, oropharynx and tongue was reported as well (Lijinsky et al., 1980). In one study on male and female Syrian Golden hamsters with unclear dosage, NMBA induced benign and malignant tumours in nasal mucosa, forestomach and the liver (Lijinsky et al., 1988)
NMVA was carcinogenic in the mucosa of tongue, oesophagus and pharynx at 0.3 mg/kg bw per day applied via drinking water to male and female BD rats for approximately 1 year (Druckrey et al., 1967).
In summary, acyclic volatile N‐NAs may induce tumour formation in several mammalian species and many different organs, such as liver, pharynx, oesophagus, forestomach, the upper respiratory tract and the lung. The lowest carcinogenic doses reported were 0.002 mg/kg bw per day for NDMA (liver tumours in rats), 0.2 mg/kg bw per day for NMEA (liver tumours in rats), 0.003 mg/kg bw per day for NDEA (liver tumours in rats), 0.62 mg/kg bw per day for NDPA (liver tumours in rats), 3.2 mg/kg bw per day for NDIPA (tumours in nasal turbinates in rats), 10 mg/kg bw per day for NEIPA (tumours in liver and upper GI tract in rats), 0.04 mg/kg bw per day for NMBA (tumours of oesophagus in rats) and 0.3 mg/kg bw per day for NMVA (tumours in mucosa of upper GI tract in rats). It is noteworthy that in monkeys, NDEA induced hepatocellular adenoma at 0.07 mg/kg bw per day and HCC at 2.7 mg/kg bw per day; NDPA was hepatocarcinogenic at 2.7 mg/kg bw per day.
3.1.2.4.2. Acyclic non‐volatile N‐NAs
The long‐term toxicity/carcinogenicity studies for the acyclic non‐volatile N‐NAs, NDBA, NDIBA, NMA NDBzA, NMAMBA and NSAR are compiled in Table E.1 in Appendix E. No studies could be retrieved for NEA and NMAMPA. Selected studies, considered to be of relevance for assessing the health risks by acyclic (non‐volatile) N‐NAs, are shown in Table 6.
Table 6.
Selected long‐term/carcinogenicity studies on the acyclic non‐volatile N‐NAs NDBA, NDIBA, NMA, NDBzA, NMAMBA and NSAR. For all studies evaluated, see Table E.2 of Appendix E
| Reference | Species/Experimental design and doses | Most sensitive endpoint | Highest dose without effect (mg/kg bw per day) | Lowest dose with effect (mg/kg bw per day) |
|---|---|---|---|---|
| NDBA | ||||
| Lijinsky et al. (1983) | Rat, F344 (M) No./group: 20 Gavage: 0 or 5.4 mg/rat bw 2×/week (assuming 400 g bw), equivalent to 0 or 3.9 mg/kg bw per day (b) Duration: 30 weeks | HCC, CA of forestomach and oesophagus, transitional cell carcinoma of urinary bladder; AD and CA of lung; CA of nasal cavity |
3.9 |
|
| Takayama (1969) | Mouse, ICR (M) No./group: > 29 Diet: 0 or 50 mg/kg, equivalent to 0 or 7.5 mg/kg bw per day (a) Duration: 12–15 months | Hepatoma, papilloma and CA of forestomach, papilloma of oesophagus, AD of lung | 7.5 | |
| Bertram and Craig (1970) | Mouse, C57Bl/6 (M, F) No./sex/group: 50 Drinking water for M: 7.6 or 29.1 mg/kg bw per day; for F: 8.2 or 30.9 mg/kg bw per day; no control. Duration: average of 240 days |
Papilloma/CA of urinary bladder (M) Papilloma/CA of oesophagus; tumours of tongue/forestomach |
7.6 (M) 7.6/8.2 (M/F) |
|
| Althoff et al. (1974) | Hamster, European (M, F) No./sex/group: 5–10 s.c. application: 0, 49, 98, 197, 394 or 788 mg/kg bw 1×/week for M; 0, 93, 187 or 373 mg/kg bw 1×/wk for F; equivalent to 0, 7, 14, 28, 56 or 113 mg/kg bw per day for M and 0, 13, 27 or 53 mg/kg bw per day for F Duration: lifetime | ↓ Body weight tumours in respiratory and upper digestive tract, urinary bladder and (para)nasal cavities |
7/13 (M/F) 7/13 (M/F) |
|
| Ivankovic (1968) | Guinea pig (sex not specified) No./group: 15 Drinking water: 40 mg/kg bw on 5 days/week, equivalent to 28.6 mg/kg bw per day; no control Duration: lifetime | HCC, CCC papilloma and CA of urinary bladder | 28.6 | |
| NDIBA | ||||
| Lijinski et al. (1979) |
Rat, SD (F) No./group: 15 Drinking water: 110 mg/L on 5 days/week equivalent to 3.9 mg/kg bw per day (a) ; no control Duration: 30 weeks Observation: 120 weeks |
Tumours of lung and occasionally in other organs | 3.9 | |
| Althoff et al. (1975) |
Hamster, Syrian Golden (M, F) No./sex/group: 20 s.c. application: 0, 62.5, 125, 250 or 500 mg/kg bw/1× per week; equivalent to 0, 9, 18, 36 or 72 mg/kg bw per day Duration: lifetime |
Tumour of larynx, tumour of nasal mucosa and bronchial tree | 9 | 9 18 |
| NMA | ||||
| Schmähl (1976) |
Rat, SD (M, F) No./sex/group: 48 s.c. application: 0, 2 or 10 mg/kg bw/1× per week; equivalent to 0, 0.3 or 1.4 mg/kg bw per day Duration: 24 weeks |
Papillomas and CA or oesophagus | 0.3 | |
| Schmähl (1976) |
Rat, SD (M, F) No./sex/group: 48 Drinking water: probably 0, 0.3 or 1.5 mg/kg bw per day – unclear documentation Duration: 24 weeks |
Papillomas and CA or oesophagus | 0.3 (?) | |
| Kroeger‐Koepke et al. (1983) |
Rat, F344 (M, F) No./sex/group: 20 Drinking water: 0 or 50 mg/L on 5 days/week; equivalent to 0 or 1.8 mg/kg bw per day (a) Duration: 50 weeks; observation: until tumour occurrence (max until week 120) |
CA of oesophagus and forestomach | 1.8 | |
| Greenblatt et al. (1971) |
Mouse, Swiss (M, F) No./sex/group: 20 Drinking water: 0 or 70 mg/L; equivalent to 0 or 6.3 mg/kg bw per day (a) Duration: 28 weeks Observation: additional 12 weeks |
Lung adenoma, malignant lymphoma | 6.3 | |
| NDBzA | ||||
| Druckrey et al. (1967) |
Rat, BD (M, F) No./group: 10 Diet: 50 or 100 mg/kg bw per day; historical controls available Duration: lifetime |
No tumour formation | 100 | |
| NMAMBA | ||||
| Li et al. (1985) | Rat, Wistar (F) No./group/duration: 4–7 Gavage: 10–200 mg/kg bw/2×/week leading to total doses between 150 and 6,600 mg/kg bw Duration: 46–640 days | Papilloma of oesophagus, AD of liver at 10 months | ~ 5.3 | |
| NSAR | ||||
| Druckrey et al. (1967) | Rat, BD (M, F) No./group: 6–14 Drinking water: 100 or 200 mg/kg bw per day; historical controls available Duration/tumour induction time: 357–631 days | CA of oesophagus | 100 | |
| Sawyer and Marvin (abstract 1974) | Mouse, Swiss ICR (M, F) No./sex/group: 65 Diet: 0 or 0.25%; equivalent to 0 or 375 mg/kg bw per day (a) Duration: 13 months |
↓ Body weight gain and survival CA of nasal region, tumours of lung, small intestine |
375 375 |
|
AD: adenoma; CA: carcinoma; CCC: cholangiocellular carcinoma; HCA: hepatocellular adenoma; HCC: hepatocellular carcinoma.
EFSA default values applied.
In Table 1 of the study, there is a discrepancy between the dose applied two times per week and rat and the total dose applied per rat. For the present calculations, the dose applied two times per week and rat was taken.
Male and female rats of various strains were exposed via drinking water (5–75 mg/kg bw per day) or gavage (3.9 mg/kg bw per day) to NDBA for about 21–30 weeks (Druckrey et al., 1967; Kunze et al., 1969; Kunze and Schauer, 1971; Okajima et al., 1971; Ito, 1973; Lijinsky et al., 1983). All studies reported on the development of tumours in the urinary epithelium, which were specified as benign papilloma or transitional cell carcinoma by some authors. In addition, the development of HCC and tumours in the forestomach, oesophagus, nasal cavity and lung was observed (Druckrey et al., 1967; Ito, 1973; Lijinsky et al., 1983). The most sensitive endpoint was the occurrence of benign and malignant tumours in many organs (urothelium, lung, liver, oesophagus, forestomach, nasal cavity) at 3.9 mg/kg bw per day (note the remark in the table), given for 30 weeks to male F344 rats via gavage (Lijinsky et al., 1983).
Male and female mice developed papilloma and carcinoma of the urinary epithelium, when treated with NDBA via drinking water (7.6–30.9 mg/kg bw per day), diet (7.5 mg/kg bw per day) or s.c. injections (25.7–32 mg/kg bw per day) for about 34–40 weeks (Takayama, 1969; Bertram and Craig, 1970; Wood et al., 1970). Bertram and Craig, (1970) reported that bladder tumours were found predominantly in male C57Bl/6 mice with male/female ratios of 4.4/1 and 8.5/1 at the high‐ and low‐dose levels, respectively. Further tumour sites in mice were tongue, oesophagus, forestomach, liver and lung.
In Syrian and Chinese hamster gavage of 42.9 mg/kg bw per day for 15–50 weeks induced papilloma and carcinoma of the urothelium and tumours in the respiratory tract of Syrian hamsters and the forestomach of the Chinese strain (Althoff et al., 1971). Application by s.c. injections of 20 mg/kg bw per day caused tumour formation in the lung of the Chinese strain and of 7–13 mg/kg bw per day in the respiratory and digestive tract and the urothelium of the European counterpart (Althoff et al., 1974; Reznik et al., 1976).
Guinea pigs developed benign and malignant tumours of the urothelium as well as HCC and CCC at 28.6 mg/kg bw per day, provided via drinking water (Ivankovic, 1968).
Transplacental carcinogenic effects of NDBA were reported for hamsters. For further details, see Section 3.1.2.6.
In summary, the urothelium was the most consistent tumour site in four different rodent species. Occasionally benign lesions and malignancies appeared also in liver, bile ducts, oesophagus, forestomach, nasal cavity and lung. The most sensitive endpoint was tumour formation in the urothelium and other sites at 3.9 mg/kg bw per day, given for 30 weeks to male F344 rats via gavage.
NDIBA mainly affected the respiratory tract, i.e. lung tumours were reported in female SD rats, treated with 3.9 mg/kg bw per day via drinking water and nasal carcinoma and tumours in trachea and lung in F344 rats receiving 15.7 mg/kg bw per day via drinking water (Lijinsky and Taylor, 1979; Lijinsky et al., 1981). When provided by s.c. injections to male and female hamsters, tumours of the larynx were observed at 9 mg/kg bw per day. At a higher dose of 18 mg/kg bw per day, tumorigenesis also occurred in the nasal and bronchial mucosa (Althoff et al., 1975).
The most sensitive endpoint was tumour formation in the lung in four female SD rats and occasionally at other sites in the total collective of 15 animals, exposed to 3.9 mg/kg bw via drinking water for a period of 30 weeks (Luijinsky and Taylor, 1979). The lung tumours were specified as alveolar cell adenoma. However, the study is lacking a negative solvent control. The authors state that the number of animals with induced alveolar cell adenoma, which was not seen in previous control animals (Lijiinsky, 1976), was very small and that NDIBA must be considered a very weak carcinogen.
NMA caused carcinogenesis mainly in the GI tract of rats. To be specific, tumours of the pharynx/mouth, oesophagus and forestomach were observed at 0.3–86 mg/kg bw per day (drinking water), 7.4 mg/kg bw per day (gavage), 10 mg/kg bw per day (diet) or 0.3 mg/kg bw per day (s.c. application) applied for 20–79 weeks (Schmähl, 1976; Kroeger‐Koepke et al., 1983). There were no clear differences between rat strains or male and female rats. A single study in mice showed that 6.3 mg/kg bw per day, provided via drinking water, led to the development of lung adenoma and malignant lymphoma after 28 weeks of treatment (Greenblatt et al., 1971).
The most sensitive endpoint was tumour formation in the oesophagus in male and female SD rats treated with 0.3 mg/kg bw per day via s.c. application for 24 weeks (Schmähl, 1976). In a second study, arm application via drinking water also induced tumours in the oesophagus. The dosage is not clearly documented but presumably 0.3 mg/kg bw per day. Histologically, the tumours were mostly keratinised squamous cell carcinoma or transitions from papilloma to carcinoma occurring at multiple sites in the oesophagus. This indicates that the tumour site was independent of the route of administration.
NDBzA was applied via diet to male and female rats at doses of 50 or 100 mg/kg bw per day for a period of 605 days. No tumour formation could be observed (Druckrey et al., 1967). No further studies could be retrieved.
NMAMBA was synthesised, analysed by gas chromatography/mass spectrometry, as described by Li et al. (1986) and applied to female Wistar rats and female Kunming mice biweekly by gavage (Li et al., 1983). In rats, a dose of about 5.3 mg/mg bw per day led to the development of papilloma in the oesophagus and adenoma in the liver after 10 months, followed by the occurrence of carcinoma in both organs at later time points of investigation. In mice, a considerably higher dose, i.e. about 77 mg/kg bw per day, caused the formation of CA in oesophagus after 5 months of treatment.
NSAR caused the formation of CA in the oesophagus of rats, treated with 100 mg/kg bw per day for up to 631 days (Druckrey et al., 1967). In mice 375 mg/kg bw per day, provided via diet, induced tumours of the nasal region, lung and small intestine after 13 months. There were also adverse effects on body weight gain and survival (Sawyer and Marvin, 1974‐ abstract). To conclude, NSAR is a carcinogen in two different rodent species and for many different organs.
In summary, the lowest carcinogenic doses reported were 3.9 mg/kg bw per day for NDBA (benign and malignant tumours in urothelium, lung, liver, oesophagus, forestomach, nasal cavity of rats), 3.9 mg/kg bw per day for NDIBA (lung tumours of rats), ~ 5.5 mg/kg bw per day for NMAMBA (benign tumours in oesophagus and liver of rats), 0.3 mg/kg bw per day for NMA (benign and malignant oesophagus tumours of rats) and 100 mg/kg bw per day for NSAR (malignant oesophagus tumours in rats). NDBzA did not induce tumour formation at 100 mg/kg bw per day in rats.
3.1.2.4.3. Cyclic and aromatic N‐NAs
The long‐term toxicity and carcinogenicity studies for the cyclic volatile N‐NAs, NMOR, NPIP and NPYR, the cyclic non‐volatile N‐NAs, NHPYR, NPRO, NHPRO and NPIC, and the aromatic (non‐volatile) NDPheA are compiled in Table E.3 in Appendix E. No studies could be retrieved for the cyclic volatile NTHZ, and the cyclic non‐volatile N‐NAs NMTHZ, NHMTHZ, NTCA, NMTCA, NHMTCA, NOCA and NMOCA. Selected studies, considered to be of relevance for assessing the health risks by cyclic and aromatic N‐NAs, are shown in Table 7.
Table E.3.
Long‐term toxicity and carcinogenicity studies for NMOR, NPIP, NPYR, NHPYR, NPRO, NHPRO, NPIC and NDPheA
| Reference | Species/Experimental design and doses | Most sensitive endpoint | Highest dose with no effect (mg/kg bw per day) | Lowest dose with effect (mg/kg bw per day) |
|---|---|---|---|---|
| NMOR | ||||
| Druckrey et al. (1967) | Rat, BD (M, F) No/group: 16 Drinking water: 8 mg/kg bw per day; historical controls available Duration/mean tumour induction time: 165 days | HCC, hep. haemangioendotheliom | 8 | |
| Garcia and Lijinsky (1972) | Rat, MRC (M, F) No/sex/group: 15 Drinking water: 100 mg/L on 5 days/week; equivalent to 3.57 mg/kg bw per day (a) ; no control Duration: 50 weeks Observation/tumour appearance: ~ 50 weeks | ↓ Survival Tumours of liver and nasal cavity | 3.57 3.57 | |
| Lijinsky and Taylor (1975) | Rat, SD (M) No/group: 30 Drinking water: 40 mg/L on 5 days per week; equivalent to 1.43 kg bw per day(a); no control Duration: 30 weeks Observation: up to 100 weeks | HCC, hep. haemangioendothelioma, Kupffer cell sarcoma | 1.43 | |
| Lijinsky et al. (1976) | Rat, SD (M) No/group: 30 Drinking water: 8 or 40 mg/L on 5 days per week; equivalant to 0.29 or 1.43 mg/kg bw per day (a) ; no control Duration: 30 weeks Observation: lifetime | Hepatocellular and haemangioendothelial tumours in liver | 0.29 | |
| Shank and Newberne (1976) | Rat, SD (F in P‐generation; M and F in F1‐ and F2‐generation) No/sex/group in F1/2: > 50 Diet: 0, 5 or 50 ppm; equivalent to 0 or 0.25 or 2.5 mg/kg bw per day (a) Duration: continuously from P to F1‐and F2‐generation Observation in F2: 125 weeks | ↓ Survival in F1+F2 F1+F2: HCC, angiosarcoma of liver and lung | 0.25 0.25 | |
| Mirvish et al. (1976) |
Rat, MRC (M) No/group: > 40 Drinking water: 0 or 150 mg/L on 5 days/week; equivalent to 0 or 5.4 mg/kg bw per day (a) Duration: 40–50 weeks |
↓ Survival HCC, Kupffer cell sarcoma | 5.4 5.4 | |
| Lijinsky et al. (1982) | Rat, F344 (M, F) No/sex/group: 20 Drinking water: 16 (only M) or 40 mg/L (M and F) on 5 days per week; equivalent to 0.57 or 1.43 mg/kg bw per day (a) ; no control Duration: 50 weeks Observation: lifetime | HCC, hep. sarcoma papilloma of oesophagus, leukaemia in M | 0.57 | |
| Lijinsky et al. (1988) | Rat, F344 (F) No/group: > 20 Drinking water: 0, 0.07, 0.18, 0.45, 1.1, 2.6, 6.4, 16, 40 or 100 mg/L on 5 days/week; equivalent to 0, 0.003, 0.006, 0.016, 0.039, 0.093, 0.229, 0.571, 1.429 or 3.571 mg/kg bw per day (a) Duration: 25–100 weeks | ↓ Survival Benign or malignant liver tumours HCC | 0.016 0.016 | 0.039 0.003 0.039 |
| Hecht et al. (1989) | Rat, F344 (F) No/group: 20 Drinking water: 0 or 26.5 mg/L on 5 days/week; equivalent to 0 or 0.95 mg/kg bw per day (a) Duration: 50 weeks Observation: 120 weeks | ↓ Survival HCC, hep. haemagiosarcoma | 0.95 0.95 | |
| Cortinovis et al. (1991) | Rat, SD (M) No/group/time point: ~ 8 Drinking water: 0 or 10 ppm; equivalent to 0 or 0.5 mg/kg bw per day (a) Duration: 10–65 weeks | HCA and HCC after 40 weeks ↑ No of preneoplastic liver lesions after 15 weeks | 0.5 0.5 | |
| Greenblatt et al. (1971) | Mouse, Swiss (M, F) No/sex/group: 20 Drinking water: 0 or 80 mg/L; equivalent to 0 or 7.2 mg/kg bw per day (a) Duration: 28 weeks Observation: 40 weeks | ↓ Survival lung AD and HCC | 7.2 7.2 | |
| Hecht et al. (1989) | Mouse, A/J (F) No/group: 40 Drinking water: 0 or 0.2 μmol/mL (or 23.2 mg/L); equivalent to 0 or 3.48 mg/kg bw per day(a) Duration: 10 weeks Observation: 30 weeks | Lung tumours | 3.48 | |
| Mohr et al. (1974) | Hamster, European (M, F) No/sex/group: 10–20 s.c. application; for M: 0, 21.5, 42.9 or 85.8 mg/kg bw 1×/week; for F: 0, 24.6, 49.3 or 98.5 mg/kg bw 1×/week; equivalent to for M: 0, 3.1, 6.1 or 12.3 mg/kg bw per day; for F: 0, 3.5, 7 or 14.1 mg/kg bw per day Duration: lifetime | ↓ Survival and body weight (M/F) Tumours in nasal cavity, respiratory tract and stomach | 3.1/3.5 3.1/3.5 | |
| Shank and Newberne (1976) | Hamster, Syrian Golden (F in P‐generation; M and F in F1‐ and F2‐generation) No/sex/group in F1/2: > 15 Diet: 0, 5 or 50 ppm; (assuming 6 g feed consumption per day and 135 g bw) equivalent to 0, 0.22 or 2.2 mg/kg bw per day Duration: continuously from P to F1‐ and F2‐generation Observation in F2: 110 weeks | ↓ Survival in F1 + F2 F1 + F2: Nodular hyperplasia of liver | 0.22 0.22 | 2.2 2.2 |
| Reznik et al. (1976) | Hamster, Chinese (M, F) No/sex/group: 20 s.c. application: 0, 8.1, 16.3 or 32.6 mg/kg bw 1×/week; equivalent to 0, 1.1, 2.3 or 4.7 mg/kg bw per day Duration: lifetime |
↓ Survival (M, F) Tumours of forestomach, oesophagus & pharynx in (M, F) Tumours of larynx, trachea, nasopharynx (M, F) |
1.1 |
1.1 1.1 2.3 |
| Ketkar et al. (1983) | Hamster, Syrian Golden (M, F) No/sex/group: 28–50 Drinking water for M: 0, 0.9, 3.4 or 6.1 mg/kg bw per day; for F: 0, 1.1, 3.9 or 8.2 mg/kg bw per day Duration: lifetime | Benign tumours in upper respiratory tract (larynx, trachea) and digestive tract Malignant tumours in upper respiratory tract (larynx, trachea) and digestive tract (mostly HCC, CCC) | −/1.1 |
0.9/1.1 (M/F) 0.9/3.9 (M/F) |
| Lijinsky et al. (1984) | Hamster, Syrian Golden (M) No/group: 20 Gavage: 0 or 5.2 mg/hamster 1×/week; equivalent to 0 or 5.6 mg/kg bw per day (assuming 135 g bw) Duration: 26 weeks Observation: lifetime | ↓ Survival CA of nose, AD of trachea | 5.6 5.6 | |
| Cardesa et al. (1990) | Hamster, Syrian Golden (M, F) No/sex/group: 25–30 Drinking water: 0, 0.001, 0.005 or 0.01%: equivalent to 0, 1, 5, or 10 mg/kg bw per day (consumption of 100 mL drinking water/kg bw per day assumed); Duration: lifetime | ↓ Survival Papilloma in trachea and larynx CA of larynx | 1 (F) 1 (M) | 5 (F) 1 (M/F) 5 (M) |
| NPIP | ||||
| Boyland et al. (1964) | Rat, Albino (M, F) No/sex/group: 16 Drinking water: 0 or 0.2% on 6 days/week; equivalent to 0 or 86 mg/kg bw per day (a) Duration: until tumour appearance (average ~ 190 days) | Malignant tumours of liver and oesophagus | 86 | |
| Druckrey et al. (1967) | Rat, BD (M, F) No/group: 9–20 Drinking water: 5 or 20 mg/kg bw per day; historical controls available Duration/mean tumour induction time at 5 mg/kg bw per day: 280 days | ↓ Survival CA of oesophagus HCC | 5 5 | 20 5 20 |
| Garcia and Lijinsky (1972) | Rat, MRC (M, F) No/sex/group: 15 Drinking water: 100 mg/L on 5 days/week; equivalent to 3.57 mg/kg bw per day (a) ; no control Duration: 50 weeks Observation/tumour appearance: ~ 50 weeks | ↓ Survival Tumours of liver, pharynx, oesophagus and respiratory tract | 3.57 3.57 | |
| Eisenbrand et al. (1980) | Rat, SD (M, F) No/group: 34–78 Drinking water: 0, 0.024, 0.12, 0.6 or 3 mg/kg bw on 5 days/week; equivalent to 0, 0.02, 0.09, 0.4 or 2.1 mg/kg bw per day Duration/mean tumour induction time: ~ 400–800 days in dependence of dose | ↓ Survival Liver tumours (HCC and cholangioma) Squamous cell CA of oesophagus or forestomach | 0.4 0.02 | 2.1 0.02 0.09 |
| Flaks and Challis (1980) | Rat, Leeds strain (M) No/group: 6 Drinking water: 0 or 0.02% on 6 days/week; equivalent to 0 or 8.6–15.4 mg/kg bw per day (a) Duration: 2.5, 5 or 6 months | Preneoplastic liver foci (2.5 months) | 8.6–15.4 | |
| Lijinsky et al. (1981) | Rat, F344 (F) No/group: 20 Drinking water: 0 or 0.9 mM on 5 days/week; equivalent to 0 or 3.7 mg/kg bw per day (a) Duration: 28 weeks Observation/tumour appearance: ~ 40 weeks | ↓ Survival Tumours of forestomach, larynx | 3.7 3.7 | |
| Peto et al. (1984) Gray et al. (1991) | Rat, Colworth (M, F) No/sex/group: 6 Drinking water: 0, 0.18, 0.36, 0.73, 1.45, 2.9, 5.81, 8.71, 11.62, 14.52, 17.42, 23.23, 29.04, 34.85, 46.46, 92.93 ppm; equivalent to 0, 0.009, 0.018, 0.037, 0.074, 0.15, 0.29, 0.44, 0.58, 0.73, 0.87, 1.16, 1.45, 1.74, 2.3 or 4.6 mg/kg bw per day (a) Duration: 30 months |
Malignant tumours in liver Tumours in oesophagus and lower jar |
0.037 | 0.074 Unclear from fig |
| Takayama (1969) | Mouse, ICR (M) No/group: 30–33 Diet: 0 or 50 ppm, equivalent to 0 or 7.5 mg/kg bw per day (a) Duration: 12 months | Squamous CA of forestomach, HCC, tumours of hepatic endothelium, papilloma of oesophagus, AD of lung | 7.5 | |
| Greenblatt and Lijinsky (1972b) | Mouse, Swiss (M, F) No/sex/group: 20 Drinking water: 0 or 0.01% on 5 days/week; equivalent to 0 or 6.4 mg/kg bw per day (a) Duration: 26 weeks Observation: further 12 weeks | AD of lung | 6.4 | |
| Xie et al. (2010) | Mouse, Balb/c (not specified) No/group: 10–20 i.p. application: 0 or 0.2 mmol/kg bw/days; equivalent to 0 or 22.83 mg/kg bw Duration: 8 weeks Observation: 16 weeks after treatment | Alveolar type II epithelial cell tumours of lung, bronchial tumours | 22.83 | |
| Mohr et al. (1974) | Hamster, European (M, F) No/sex/group: 10–20 s.c. application: 0, 11.3, 22.6 or 45.2 mg/kg 1×/week; equivalent to 0, 1.6, 3.2 or 6.5 mg/kg bw per day Duration: lifetime/tumour appearance | ↓ Survival (M, F) ↓ Body weight (M, F) Tumours in nasal cavity, nasopharynx, lung and forestomach (M, F) | 1.6 (control data missing) 1.6 1.6 | |
| Reznik et al. (1976) | Hamster, Chinese (M, F) No/sex/group: 20 s.c. application: 0, 5.7, 11.3 or 22.6 mg/kg bw 1×/week; equivalent to 0, 0.8, 1.6 or 3.2 mg/kg bw per day Duration: lifetime | ↓ Survival (M, F) Tumours of oesophagus, forestomach, tongue, palate, lung and liver (M, F) | 0.8 | 1.6 0.8 |
| Mohr et al. (1979) | Hamster, Syrian Golden (M, F) No/sex/group: 20 s.c. application: 15, 30 or 60 mg/kg bw 1×/week; equivalent to 2.1, 4.3 or 8.6 mg/kg bw per day; no control Tumour appearance after 86 weeks Duration: lifetime | Tumours in trachea | 2.1 | |
| Ketkar et al. (1983) |
Hamster, Syrian Golden (M, F) No/sex/group: 28–50 Drinking water: 0, 0.006, 0.025 or 0.05%: equivalent to 0, 6, 25 or 50 mg/kg bw per day (consumption of 100 mL drinking water/kg bw per day assumed); Duration: lifetime Mean observation/latency: 50–84 weeks |
Tumours in respiratory and digestive tract and liver | 6 | |
| Cardesa et al. (1990) | Hamster, Syrian Golden (M, F) No/sex/group: 25–30 Drinking water: 0, 0.006, 0.025 or 0.05%: equivalent to 0, 6, 25 or 50 mg/kg bw per day (consumption of 100 mL drinking water/kg bw per day assumed); Duration: lifetime | ↓ Survival M/F Papilloma and CA in trachea and larynx (M, F) | 25/6 (M/F) 6 | |
| Adamson et al. (1983); Thorgeirsson et al. (1994) | Monkey, (Cynomolgus, Rhesus, African Green) (M, F) No/group: 12 Oral: 400 mg/kg bw on 5 days/week; equivalent to 7.14–286 mg/kg bw per day; cumulative dose: 1625.91 months (177.02–2662.32 months) Duration/average tumour latency: 87 g (36–145 g) |
HCC 11/12 Toxic hepatitis 1/12 |
286 | |
| Adamson et al. (1979, 1983); Thorgeirsson et al. (1994) | Monkey, (Cynomolgus, Rhesus, African Green) (M, F) No/group: 11 i.p. application: 40 mg/kg bw 1×/week; equivalent to 5.7 mg/kg bw per day; cumulative dose: 42.9 g (26.7–51.5 g); average tumour latency: 141 months (79–239 months) |
HCC 6/10 Toxic hepatitis 4/10 |
5.7 | |
| NPYR | ||||
| Druckrey et al. (1967) | Rat, BD (M, F) No/group: 5–20 Drinking water: 5 or 10 mg/kg bw per day for 150 days and doubled to 10 or 20 mg/kg bw per day; historical controls available Duration/average tumour induction time: 470 or 290 days | HCC | 5–10 | |
| Greenblatt and Lijinsky (1972a) | Rat, MRC (M, F) No/sex/group: 15–35 Drinking water: 0 or 200 mg/L on 5 days/week; equivalent to 0 or 7.14 mg/kg bw per day(a) Duration: 67 weeks (mean survival time 70–79 weeks) | HCC Papillary mesothelial tumours of testis (M) | 7.14 | |
| Lijinsky et al. (1976) | Rat, SD (M, F) No/sex/group: 14–15 Drinking water: 0 or 0.02% on 5 days/week; equivalent to 0 or 7.14 mg/kg bw per day(a); Duration: 50 weeks Tumour appearance: 45–105 weeks | Tumours of oesophagus and nasal mucosa | 7.14 | |
| Preussmann et al. (1977) | Rat, SD (M, F) No/sex/group: 24–62 Drinking water: 0, 0.3, 1, 3 or 10 mg/kg bw per day Duration/tumour induction time: 664–444 days | HCC | 0.3 | 1 |
| Lijinsky et al. (1981) |
Rat, F344 (F) No/group: 20 Drinking water: 0 or 0.9 mM (90 mg/L) on 5 days/week; equivalent to 0 or 3.2 mg/kg bw per day (a) Duration: 28 weeks Tumour appearance: up to 110 weeks |
Tumours of forestomach, cholangioma, lymphangioma of liver | 3.2 | |
| Peto et al. (1984) Gray et al. (1991) | Rat, Colworth (M, F) No/sex/group: 6 Drinking water: 0, 0.56, 1.12, 2.24, 4.49, 8.98, 17.95, 26.9, 35.9, 44.9, 53.9, 71.8, 89.8, 107.7, 143.6 or 287.2 ppm; equivalent to 0, 0.03, 0.06, 0.11, 0.22, 0.45, 0.9, 1.35, 1.8, 2.24, 2.7, 3.6, 4.5, 5.4, 7.2 or 14.4 mg/kg bw per day (a) Duration: 30 months | Malignant tumours in liver) Malignant tumours in oesophagus | 11 0.45 | 0.22 0.9 |
| Hoos et al. (1985) |
Rat, SD (M) No/group: > 50 Drinking water: 0, 1 or 2 mg/kg bw per day Duration: 600 days for 1 mg/kg bw per day (period d100–700) or 300 days for 2 mg/kg bw per day (period days 100–400 or days 400–700) |
HCC | 1 | |
| Michejda et al. (1986) |
Rat, F344 (F) No/group: 20 Drinking water: 0 or 9 mg/animal/week; (assuming 250 g bw) equivalent to 5.1 mg/kg bw per day (a) Duration: 30 weeks |
HCC | 5.1 | |
| Chung et al. (1986) |
Rat, F344 (M) No/group: 20 Drinking water: 0 or 6 mM (600 mg/L); equivalent to 0 or 30 mg/kg bw per day (a) Duration: 83 weeks |
↓ Survival Preneoplastic liver lesions, HCA, HCC | 30 30 | |
| Berger et al. (1987) | Rat, SD (M) No/group: 80 Drinking water: 0, 0.04, 0.133 or 0.4 mg/kg bw on 5 days/wk, i.e. 0, 0.03, 0.1 or 0.3 mg/kg bw per day Duration: lifetime |
Tumours of liver (HCA) and GI tract |
0.03 | 0.1 |
| Greenblatt and Lijinsky (1972b) | Mouse, Swiss (M, F) No/sex/group: 20 Drinking water: 0 or 0.01% on 5 days/week; equivalent to 0 or 6.4 mg/kg bw per day (a) Duration: 26 weeks Observation: further 12 weeks | AD of lung | 6.4 | |
| Shah et al. (1985) | Mouse, Swiss (M) No/group: 20 Gavage: 0 or 50 μg/mouse 5 days/week; (assuming bw of 25 g) equivalent to 0 or 1.43 mg/kg bw per day (a) Duration: lifetime (15–20 months) | Papillary adeno‐CA of lung HCC | 1.43 | |
| Chung et al. (1986) | Mouse, A/J (F) No/group: 40 Drinking water: 0 or 40 mg/L; equivalent to 0 or 6 mg/kg bw per day (a) Duration: 10 weeks | ↑ incidence of lung tumours (insignificant) | 6 | |
| Hecht et al. (1988) | Mouse, A/J (F) No/group: 30 i.p. application: 0 or 100 μmol (10 mg) total dose per mouse; applied on 3 days/week; (assuming 20 g bw) equivalent to 0 or 23.8 mg/kg bw per day; Duration: 7 weeks | Lung tumours | 23.8 | |
| Anderson et al. (1993) | Mouse, strain A (M) No/group: not specified Drinking water: 0, 6.8 or 40 ppm; equivalent to 0, 1.1. or 7.2 mg/kg bw per day (a) Duration: 4 weeks | No significant tumour formation | 7.2 | |
| Hoffmann et al. (1993) |
Mouse, A/J (F) No/group: 30 i.p. application: 3×/week; total dose/mouse: 0, 20 or 100 μmol; (assuming 20 g bw) equivalent to 0, 2 or 10.2 mg/kg bw per day Duration: 7 weeks Observation: 30 weeks |
Lung tumours | 2 | |
| Ketkar et al. (1982) |
Hamster, Syrian Golden (M, F) No/sex/group: 30 Drinking water: 0, 0.00042, 0.0016 or 0.0033% (consumption of 100 mL drinking water/kg bw per day assumed) equivalent to 0, 0.4, 1.6 or 3.3 mg/kg bw per day Duration: lifetime Tumour latency: 57–82 weeks |
Overall tumour incidence liver tumours | 0.4 1.6 | 1.6 (F) 3.3 (M) |
| NHPYR | ||||
| Eisenbrand et al. (1980) | Rat, SD (M, F) No/sex/group: > 10 Drinking water: 0 or 3.5 mg/kg bw on 5 days/week; equivalent to 0 or 2.5 mg/kg bw per day Duration/mean tumour induction time: 711 days | HCC | 2.5 | |
| NPRO | ||||
| Garcia and Lijinsky (1973) | Rat, MRC (M, F) No/sex/group: 15 Drinking water: 0 or 0.015%; equivalent to 0 or 7.5 mg/kg bw per day (a) Duration: 75 weeks | No significant tumour formation | 7.5 | |
| Nixon et al. (1976) | Rat, Wistar (M), weanling No/group: 26 Gavage: 0 or 72.5 mg/rat 1×/wk (assuming 100 g bw) equivalent to 0 or 103 mg/kg bw per day Duration: 4 weeks Observation: lifetime | No significant tumour formation | 103 | |
| Mirvish et al. (1980) |
Rat, MRC (M) No/group: > 35 Drinking water: 0 or 2500 mg/L on 5 days/week; equivalent to 0 or 89.3 mg/kg bw per day (a) Duration: 78 weeks |
No significant tumour formation | 89.3 | |
| Greenblatt and Lijinsky, 1972b | Mouse, Swiss (M, F) No/sex/group: 30 Drinking water: 0, 0.05 or 0.1% on 5 days/week; equivalent to 0, 32.1 or 64.2 mg/kg bw per day (a) Duration: 26 weeks Observation: 38 weeks | No tumour formation in lung | 64.2 | |
| Hecht et al. (1988) | Mouse, A/J (F) No/group: 30 i.p. application: 3×/week; total dose/mouse: 0 or 100 μmol (14.4 mg); (assuming 20 g bw) equivalent to 0 or 34.3 mg/kg bw per day; Duration: 7 weeks | No tumour formation in lung | 34.3 | |
| NHPRO | ||||
| Garcia and Lijinsky, 1973 | Rat, MRC (M, F) No/sex/group: 15 Drinking water: 0 or 0.015%; equivalent to 0 or 7.5 mg/kg bw per day (a) Duration: 75 weeks | No significant tumour formation | 7.5 | |
| Nixon et al. (1976) | Rat, Wistar (M), weanling No/group: 26 Gavage: 0 or 72.5 mg/rat 1×/wk (assuming 100 g bw) equivalent to 0 or 103 mg/kg bw per day Duration: 4 weeks Observation: lifetime | No significant tumour formation | 103 | |
| NPIC | ||||
| Garcia and Lijinsky (1973) | Rat, MRC (M, F) No/sex/group: 15 Drinking water: 0 or 0.015%; equivalent to 0 or 7.5 mg/kg bw per day (a) Duration: 75 weeks | No significant tumour formation | 7.5 | |
| NDPheA | ||||
| Argus and Hoch‐Ligeti (1961) | Rat, Wistar (M) No/group: 25 Gavage: 1.07 mg/rat on 5 days/wk,(assuming 300 g bw) equivalent to 2.54 mg/kg bw per day; no control Duration: 53 weeks Cumulative dose per animal: 244 mg | No tumour formation | 2.54 | |
| Druckrey et al. (1967) |
Rat, BD (M, F) No/group: 20 Drinking water: 120 mg/kg bw per day; historical controls available Duration: > 500 days Observation: 700 days |
No tumour formation | 120 | |
| Boyland et al. (1968) |
Rat, CB (M) No/group: 24 i.p. application: 0 or 2.5 mg/rat/once per week; (assuming 300 g bw) equivalent to 1.2 mg/kg bw per day Duration: 6 months Observation: 2 years |
No significant tumour formation | 1.2 | |
| Cardy et al (1979), NCI/NTP (1979) | Rat, F344 (M, F) No/sex/group: 20–50 Diet: 0, 1,000 or 4,000 mg/kg equivalent to 0, 50 or 200 mg/kg bw per day (a) Duration: 100 weeks | ↓ Survival (F) CA of urinary bladder (M, F) Fibroma in in skin and subcutis (M) | 200 200 | |
| Cardy et al. 1979, NCI/NTP 1979 | Mouse, B6C3F1 (M, F) No/sex/group: 20–50 Diet for M: 0, 10,000 or 20,000 mg/kg equivalent to 0, 1,500 or 3,000 mg/kg bw per day (a) For F: 0, 5,000 mg/kg for 38 weeks, 3 weeks break, and 1,000 mg/kg for 60 weeks: average 2,315 mg/kg; equivalent to 0 or 347 mg/kg bw per day (a) 10,000 mg/kg for 38 weeks, 3 weeks break and finally 4,000 mg/kg for 60 weeks: average 5,741 mg/kg; equivalent to 861 mg/kg bw per day (a) Duration: 38–101 weeks | Inflammation of urinary mucosa (M, F) Insignificant increase in urinary CA (M/F) | 1500/347 (M/F) | 1,500/347 (M, F) 3,000/861 (M/F) |
AD: adenoma; CA: carcinoma, HCA: hepatocellular adenoma; HCC: hepatocellular carcinoma; CCC: cholangiocellular carcinoma.
Applying EFSA default values.
Table 7.
Selected long‐term toxicity and carcinogenicity studies for NMOR, NPIP, NPYR, NHPYR, NPRO, NHPRO, NPIC and NDPheA
| Reference | Species, experimental design and doses | Most sensitive endpoint | Highest dose with no effect (mg/kg bw per day) | Lowest dose with effect (mg/kg bw per day) |
|---|---|---|---|---|
| NMOR | ||||
| Lijinsky et al. (1988) | Rat, F344 (F) No./group: > 20 Drinking water: 0, 0.07, 0.18, 0.45, 1.1, 2.6, 6.4, 16, 40 or 100 mg/L on 5 days/week; equivalent to 0, 0.003, 0.006, 0.016, 0.039, 0.093, 0.229, 0.571, 1.429 or 3.571 mg/kg bw per day (a) Duration: 25–100 weeks | ↓ Survival Benign or malignant liver tumours HCC | 0.016 0.016 | 0.039 0.003 0.039 |
| Cortinovis et al. (1991) | Rat, SD (M) No/group/time point: ~ 8 Drinking water: 0 or 10 ppm; equivalent to 0 or 0.5 mg/kg bw per day (a) Duration: 10–65 weeks | HCA and HCC after 40 weeks ↑ No of preneoplastic liver lesions after 15 weeks |
0.5 0.5 |
|
| Greenblatt et al. (1971) | Mouse, Swiss (M, F) No./sex/group: 20 Drinking water: 0 or 80 mg/L; equivalent to 0 or 7.2 mg/kg bw per day (a) Duration: 28 weeks Observation: 40 weeks | ↓ Survival lung AD and HCC |
7.2 7.2 |
|
| Hecht et al. (1989) | Mouse, A/J (F) No./group: 40 Drinking water: 0 or 0.2 μmol/mL (or 23.2 mg/L); equivalent to 0 or 3.48 mg/kg bw per day (a) Duration: 10 weeks Observation: 30 weeks | Lung tumours |
3.48 |
|
| Ketkar et al. (1983) | Hamster, Syrian Golden (M, F) No./sex/group: 28–50 Drinking water for M: 0, 0.9, 3.4 or 6.1 mg/kg bw per day; for F: 0, 1.1, 3.9 or 8.2 mg/kg bw per day Duration: lifetime |
Benign tumours in upper respiratory tract (larynx, trachea) and digestive tract Malignant tumours in upper respiratory tract (larynx, trachea) and digestive tract (mostly HCC, CCC) |
–/1.1 |
0.9/1.1 (M/F) 0.9/3.9 (M/F) |
| NPIP | ||||
| Eisenbrand et al. (1980) | Rat, SD (M, F) No./group: 34–38 Drinking water: 0, 0.024, 0.12, 0.6 or 3 mg/kg bw on 5 days/week; equivalent to 0, 0.02, 0.09, 0.4 or 2.1 mg/kg bw per day Duration/mean tumour induction time: ~ 400–800 days in dependence of dose | ↓ Survival Liver tumours (HCC and cholangioma) Squamous cell CA of oesophagus or forestomach | 0.4 0.02 | 2.1 0.02 0.09 |
| Peto et al. (1984); Gray et al. (1991) | Rat, Colworth (M, F) No./sex/group: 6 Drinking water: 0, 0.18, 0.36, 0.73, 1.45, 2.9, 5.81, 8.71, 11.62, 14.52, 17.42, 23.23, 29.04, 34.85, 46.46, 92.93 ppm; equivalent to 0, 0.009, 0.018, 0.037, 0.074, 0.15, 0.29, 0.44, 0.58, 0.73, 0.87, 1.16, 1.45, 1.74, 2.3 or 4.6 mg/kg bw per day (a) Duration: 30 months | Malignant tumours in liver, tumours in oesophagus and lower jar | 0.037 | 0.074 Unclear figure in the publication |
| Takayama (1969) |
Mouse, ICR (M) No./group: 30–33 Diet: 0 or 50 ppm, equivalent to 0 or 7.5 mg/kg bw per day (a) Duration: 12 months |
Squamous CA of forestomach, HCC, hepatic endothelial tumours, papilloma of oesophagus, AD of lung | 7.5 | |
| Greenblatt and Lijinsky, (1972b) | Mouse, Swiss (M, F) No./sex/group: 20 Drinking water: 0 or 0.01% on 5 days/week; equivalent to 0 or 6.4 mg/kg bw per day (a) Duration: 26 weeks Observation: further 12 weeks | AD of lung | 6.4 | |
| Cardesa et al. (1990) | Hamster, Syrian Golden (M, F) No./sex/group: 25–30 Drinking water: 0, 0.006, 0.025 or 0.05%: equivalent to 0, 6, 25 or 50 mg/kg bw per day (consumption of 100 mL drinking water/kg bw per day assumed); Duration: lifetime | ↓ Survival Papilloma and CA in trachea and larynx (M, F) | 6/− (M/F) |
25/6 (M/F) 6 (M/F) |
| Adamson et al. (1983); Thorgeirsson et al. (1994) | Monkey, (Cynomolgus, Rhesus, African Green) (M, F) No/group: 12 Oral: 400 mg/kg bw on 5 days/week; equivalent to 7.14–286 mg/kg bw per day; cumulative dose: 1625.91 months (177.02–2662.32 months) Duration/average tumour latency: 87 g (36–145 g) |
HCC 11/12 Toxic hepatitis 1/12 |
286 | |
| Adamson et al. (1979, 1983); Thorgeirsson et al. (1994) | Monkey, (Cynomolgus, Rhesus, African Green) (M, F) No/group: 11 i.p. application: 40 mg/kg bw 1×/week; equivalent to 5.7 mg/kg bw per day; cumulative dose: 42.9 g (26.7–51.5 g); average tumour latency: 141 months (79–239 months) |
HCC 6/10 Toxic hepatitis 4/10 |
5.7 | |
| NPYR | ||||
| Peto et al. (1984); Gray et al. (1991) | Rat, Colworth (M, F) No./sex/group: 6 Drinking water: 0, 0.56, 1.12, 2.24, 4.49, 8.98, 17.95, 26.9, 35.9, 44.9, 53.9, 71.8, 89.8, 107.7, 143.6 or 287.2 ppm; equivalent to 0, 0.03, 0.06, 0.11, 0.22, 0.45, 0.9, 1.35, 1.8, 2.24, 2.7, 3.6, 4.5, 5.4, 7.2 or 14.4 mg/kg bw per day (a) Duration: 30 months | Malignant tumours in liver (hepatocellular), Malignant tumours in oesophagus | 0.11 0.45 | 0.22 0.9 |
| Berger et al. (1987) | Rat, SD (M) No./group: 80 Drinking water: 0, 0.04, 0.133 or 0.4 mg/kg bw on 5 days/week, i.e. 0, 0.03, 0.1 or 0.3 mg/kg bw per day Duration: lifetime |
Tumours of liver (HCA) and of GI tract |
0.03 | 0.1 |
| Shah et al. (1985) | Mouse, Swiss (M) No./group: 20 Gavage: 0 or 50 μg/mouse 5 days/week; (assuming bw of 25 g) equivalent to 0 or 1.43 mg/kg bw per day (a) Duration: lifetime (15–20 months) | Papillary adeno‐CA of lung HCC | 1.43 | |
| Ketkar et al. (1982) | Hamster, Syrian Golden (M, F) No/sex/group: 30 Drinking water: 0, 0.00042, 0.0016 or 0.0033% (consumption of 100 mL drinking water/kg bw per day assumed) equivalent to 0, 0.4, 1.6 or 3.3 mg/kg bw per day; Duration: lifetime; Tumour latency: 57–82 weeks | Overall tumour incidence Liver tumours | 0.4 1.6 | 1.6 (F) 3.3 (M) |
| NHPYR | ||||
| Eisenbrand et al. (1980) | Rat, SD (M, F) No./sex/group: > 10 Drinking water: 0 or 3.5 mg/kg bw on 5 days/week; equivalent to 0 or 2.5 mg/kg bw per day Duration/mean tumour induction time 711 days | HCC | 2.5 | |
| NPRO | ||||
| Mirvish et al. (1980) |
Rat, MRC (M) No./group: > 35 Drinking water: 0 or 2500 mg/L on 5 days/week; equivalent to 0 or 89.3 mg/kg bw per day (a) Duration: 78 weeks |
No significant tumour formation | 89.3 | |
| Greenblatt and Lijinsky, (1972b) | Mouse, Swiss (M, F) No./sex/group: 30 Drinking water: 0, 0.05 or 0.1% on 5 days/week; equivalent to 0, 32.1 or 64.2 mg/kg bw per day (a) Duration: 26 weeks Observation: 38 weeks | No tumour formation in lung | 64.2 | |
| NHPRO | ||||
| Garcia and Lijinsky, (1973) | Rat, MRC (M, F) No./sex/group: 15 Drinking water: 0 or 0.015%; equivalent to 0 or 7.5 mg/kg bw per day (a) Duration: 75 weeks | No significant tumour formation | 7.5 | |
| Nixon et al. (1976) | Rat, Wistar (M), weanling No./group: 26 Gavage: 0 or 72.5 mg/rat 1×/week (assuming 100 g bw) equivalent to 0 or 103 mg/kg bw per day Duration: 4 weeks Observation: lifetime | No significant tumour formation | 103 | |
| NPIC | ||||
| Garcia and Lijinsky, (1973) | Rat, MRC (M, F) No./sex/group: 15 Drinking water: 0 or 0.015%; equivalent to 0 or 7.5 mg/kg bw per day (a) Duration: 75 weeks | No significant tumour formation | 7.5 | |
| NDPheA | ||||
| Cardy et al. 1979, NCI/NTP 1979 | Rat, F344 (M, F) No./sex/group: 20–50 Diet: 0, 1,000 or 4,000 mg/kg equivalent to 0, 50 or 200 mg/kg bw per day (a) Duration: 100 weeks | ↓ Survival (F) CA of urinary bladder (M, F) Fibroma in in skin and subcutis (M) |
50 50 50 |
200 200 200 |
| Cardy et al. 1979, NCI/NTP 1979 | Mouse, B6C3F1 (M, F) No./sex/group: 20–50 Diet for M: 0, 10,000 or 20,000 mg/kg equivalent to 0, 1,500 or 3,000 mg/kg bw per day (a) For F: 0, 5,000 mg/kg for 38 weeks, 3 weeks break, and 1,000 mg/kg for 60 weeks: average 2,315 mg/kg; equivalent to 0 or 347 mg/kg bw per day (a) 10,000 mg/kg for 38 weeks, 3 weeks break and finally 4,000 mg/kg for 60 weeks: average 5,741 mg/kg; equivalent to 861 mg/kg bw per day (a) Duration: 38–101 weeks | Inflammation of urinary mucosa (M, F) Insignificant increase in urinary CA (M/F) |
1,500/347 (M/F) |
1,500/347 (M, F) 3,000/861 (M/F) |
AD: adenoma; CA: carcinoma; CCC: cholangiocellular carcinoma; HCA: hepatocellular adenoma; HCC: hepatocellular carcinoma.
Applying EFSA default values (EFSA, 2012).
With regard to NMOR, several studies in males and females of different rat strains, exposed via drinking water (0.003–8 mg/kg bw per day) or diet (0.25–2.5 mg/kg bw per day) for variable periods (10 weeks to lifelong) showed that the liver is the main target for this NA. The occurrence of HCC, but also of hepatic haemangioendothelioma and haemangiosarcoma as well as Kupffer cell sarcoma was reported (Druckrey et al., 1967; Lijinsky and Taylor, 1975; Lijinsky, 1976b; Mirvish et al., 1976; Lijinsky et al., 1982, 1988; Hecht et al., 1989; Cortinovis et al., 1991). Occasional tumour formation was observed at extrahepatic sites, such as nasal cavity (Garcia and Lijinsky, 1972) or papilloma of the oesophagus (Lijinsky et al., 1982). Shank and Newberne (1976) treated pregnant rats from the time of conception; after females had littered, F1 of both sexes was subjected to long‐term carcinogenicity studies; this was repeated in the F2 generation. Under these experimental conditions, angiosarcoma of liver and lung appeared in F1 and F2 animals. The most sensitive endpoints were seen in female F344 rats with the development of liver tumours (benign and malignant tumours combined) at 0.003 mg/kg bw per day or of HCC at 0.039 mg/kg bw per day (Lijinsky et al., 1988). This study was exceptional by applying nine dose levels from 0.003 to 3.571 mg/kg bw day to more than 20 females per group for 25–100 weeks.
Two studies were performed in mice, treated via drinking water. Tumour formation occurred predominantly in the lung at doses of 3.48 mg/kg bw per day in the A/J strain and 7.2 mg/kg bw per day in the Swiss strain after 10 or 28 weeks of treatment, respectively. The latter mouse strain also developed HCC (Greenblatt et al., 1971; Hecht et al., 1989).
Hamsters were exposed via diet (0.22–2.2 mg/kg bw per day), drinking water (0.9–10 mg/kg bw per day), gavage (5.6 mg/kg bw per day) or s.c. application (1.1–14.1 mg/kg bw per day) for 26 weeks or lifetime. Independent of the route of administration tumours appeared in the upper respiratory tract (nasal cavity, nasopharynx), the lower respiratory tract (larynx, trachea) and the digestive tract (oesophagus, forestomach, stomach, liver, bile ducts) (Mohr et al., 1974; Reznik et al., 1976; Ketkar et al., 1983; Lijinsky et al., 1984; Cardesa et al., 1990). In a multigeneration carcinogenicity study, reaching from pregnant P to F2 generation nodular liver hyperplasia was the predominant lesion in F1 and F2 (Shank and Newberne, 1976). One of the most sensitive endpoints was the formation of benign and malignant tumours in the upper respiratory tract and in the digestive tract at a daily dose of 0.9 mg/kg bw in male Syrian Golden hamsters exposed via drinking water (Ketkar et al., 1983).
The toxic and carcinogenic activity of NPIP was studied in male and female rats of various strains, exposed via drinking water for 2.5–30 months to concentrations ranging from 0.009 to 86 mg/kg bw per day. Tumour formation was reported in liver, oesophagus, forestomach, respiratory tract and lower jaw (Boyland et al., 1964; Druckrey et al., 1967; Garcia and Lijinsky, 1972; Eisenbrand et al., 1980; Flaks and Challis, 1980; Lijinsky and Reuber, 1981; Peto et al., 1984; Gray et al., 1991). One sensitive endpoint was the formation of malignant liver cell tumours (not specified which liver cell type) in male and female Colworth rats after 30 months of treatment, starting at around 0.074 mg/kg bw per day and showing a clear dose dependency (Peto et al., 1984; Gray et al., 1991). However, the most sensitive endpoint was provided by Eisenbrand et al. (1980), who demonstrated the development of liver tumours in male and female SD rats at a dose of 0.02 mg/kg bw per day (no separate report for males and females). The study comprised four dose levels between 0.02 and 2.1 mg/kg bw per day, provided via drinking water to at least 34 animals per group until tumour appearance after ~ 400–800 days. The liver tumours were described as HCC and cholangiomas and showed a dose‐dependent increase. In the lowest dose group, the occasional emergence of leukaemias and reticulosarcomas was reported. At higher dose levels, hepatic haemangioendothelioma occurred as well.
Three independent mouse studies applied NPIP at 6.4 mg/kg bw per day (drinking water), 7.5 mg/kg bw per day (diet) or 22.8 mg/kg bw per day (s.c. application) for 8 weeks to 12 months. In addition to HCC, malignancies in the forestomach and papillomas in the oesophagus, tumours of the bronchial tree and lung parenchyma were observed (Takayama, 1969; Greenblatt and Lijinsky, 1972b; Xie et al., 2010).
Hamsters were treated with NPIP via drinking water (6–50 mg/kg bw per day) or s.c. applications (0.8–8.6 mg/kg bw per day) over lifetime. Irrespective of the route of administration, many tissues/organs were affected by tumour formation, such as nasal cavity, nasopharynx, trachea, larynx, lung, tongue, palate, oesophagus, forestomach and the liver (Mohr et al., 1974; Reznik et al., 1976; Mohr, 1979; Ketkar et al., 1983; Cardesa et al., 1990). The most sensitive endpoint was the tumour formation at many different sites of the respiratory and digestive tract at 0.8 mg/kg bw per day, applied to male and female Chinese hamsters over lifetime (Reznik et al., 1976).
In the context of a study conducted by the National Institute of Health (NIH), NPIP was tested in Cynomolgus, Rhesus and African Green monkey of both sexes. Adamson et al. (1979, 1983) and Thorgeirsson et al. (1994) reported repeatedly on the outcome. Twelve animals received p.o. doses on 5 days per week, which were increased from 10 mg/kg bw to 400 mg/kg bw leading to accumulative dose of 1,626 g (177–2,662 g). After 87 months (range 36–145), HCC had developed in 11 animals. The i.p. doses were 10‐fold lower (1–40 mg/kg bw), were applied once per week and provided an average cumulative dose of 42.9 g (range: 26.7–51.5 g). After an average latency of 141 months (range: 79–239 months), HCC appeared in six animals. Five animals did not develop tumours but died due to a toxic hepatitis.
The transplacental carcinogenic effects of NPIP were studied in Syrian Golden hamsters, as described in detail in Section 3.1.2.6.
Male and female rats of various strains were treated with NPYR via drinking water at doses from 0.03 to 30 mg/kg bw per day for 30–83 weeks or lifelong. The tumour spectrum comprised HCC, cholangioma and lymphangioma in the liver and partly malignant tumours of nasal cavity, oesophagus and forestomach (Druckrey et al., 1967; Greenblatt and Lijinsky, 1972a; Lijinski, 1976a; Preussmann et al., 1977; Lijinsky and Reuber, 1981; Peto et al., 1984; Hoos et al., 1985; Chung et al., 1986; Michejda et al., 1986; Berger et al., 1987; Gray et al., 1991). Hepatocellular tumours in form of adenoma and carcinoma, as well as hepatocellular tumour prestages were among the most frequent findings. Peto et al. (1991) and Gray et al. (1991) reported on the same experiment documenting an enhanced development of HCC in Colworth rats at 0.22 mg/kg bw per day when exposed for 30 weeks. However, the most sensitive endpoint was the occurrence of hepatocellular adenoma in male SD rats, when treated with 0.1 mg/kg bw per day for the entire lifespan (Berger et al., 1987). The comprehensive study applied three dose levels from 0.03 to 0.3 mg/kg bw per day to groups of 80 male SD rats over lifetime.
Mice were subjected to NPYR treatment using drinking water (1.1–7.2 mg/kg bw per day), gavage (1.43 mg/kg bw per day) or i.p. applications (2–23.8 mg/kg bw per day) for 4–26 weeks or lifetime. Tumour formation in the lung was predominant in Swiss as well as in A/J mice (Greenblatt and Lijinsky, 1972b; Shah et al., 1985; Hecht et al., 1988; Hoffmann et al., 1993). However, male strain‐A mice and in one experiment also female A/J mice did not develop lung tumours when treated with 7.2 or 6 mg/kg bw per day, respectively – most probably due to the short durations of treatment of 4–10 weeks (Chung et al., 1986; Anderson et al., 1993). The lowest carcinogenic dose for the lung was 1.43 mg/kg bw per day in male Swiss mice (Shah et al., 1985), when treated over lifetime; under these experimental conditions also HCC were induced by NPYR.
One study in hamsters showed that application of NPYR via drinking water caused an overall increased tumour incidence in female animals at 1.6 mg/kg bw per day and formation of liver tumours in male animals at 3.3 mg/kg bw per day (Ketkar et al., 1982). The tumours developed after 57–82 weeks of treatment.
For NHPYR, Eisenbrand et al. (1980) reported on the development of HCC in male and female SD rats, which were exposed to 2.5 mg/kg bw per day via drinking water for a period of nearly 2 years. This indicates that NHPYR, one of the metabolites of NPYR, induces hepatocarcinogenesis in rats.
NPRO was applied to rats via drinking water (7.5–89.3 mg/kg bw per day) or gavage (103 mg/kg bw per day) for 4–78 weeks and to mice via drinking water (32.1–64.2 mg/kg bw per day) or i.p. application (34.3 mg/kg bw per day) for 7–26 weeks (Greenblatt and Lijinsky, 1972a; Garcia and Lijinsky, 1973; Nixon et al., 1976; Mirvish et al., 1980; Hecht et al., 1988). None of the experimental regimens resulted in significant tumour formation.
In rats, NHPRO did not induce carcinogenesis when applied at doses of 7.5 mg/kg bw per day via drinking water or at 103 mg/kg bw per via gavage for up to 75 weeks (Garcia and Lijinsky, 1973; Nixon et al., 1976).
Garcia and Lijinsky (1973) applied NPIC to male and female MRC rats at 7.5 mg/kg bw per day (drinking water) and reported no significant tumour formation after 75 weeks of treatment.
NDPheA was without carcinogenic effect when provided at 120 mg/kg bw per day via drinking water, at 2.54 mg/kg bw per day by gavage or 1.2 mg/kg bw per day by i.p. application to rats (Argus and Hoch‐Ligeti, 1961; Druckrey et al., 1967; Boyland et al., 1968). At doses of 200 mg/kg bw per day, applied via diet, carcinoma of the urinary bladder occurred in male and female F344 rats after 100 weeks of treatment (NTP, 1979). Male and female B6C3F1 mice developed inflammation of the urinary epithelium at 1,500 mg and 347 mg/kg bw per day and an insignificant increase in urinary carcinoma at 3,000 mg and 861 mg/kg bw per day, respectively (NTP, 1979).
In summary, among the cyclic N‐NAs evaluated, NMOR, NPIP, NPYR and NHPYR are potent carcinogens in rodents, affecting the liver, the respiratory and/or the GI tract at oral doses of at least 0.003 mg/kg bw per day (NMOR), 0.02 mg/kg bw per day (NPIP), 0.1 mg/kg bw per day (NPYR) and 2.5 mg/kg bw per day (NHPYR). Furthermore, NPIP induced HCC in livers of monkeys, treated with 5.7 mg/kg bw per day via i.p. applications. For the cyclic N‐NAs NPRO, NHPRO and NPIC no clear evidence for carcinogenicity could be obtained in rodents, when applied at oral doses of up to 103 mg/kg bw per day (NPRO and NHPRO) or 7.5 mg/kg bw per day (NPIC). The aromatic N‐NA NDPheA induced malignant tumours of the urinary bladder in male and female rats at 200 mg/kg bw per day.
3.1.2.5. N‐NAs carcinogenicity; the structure–activity relationships
The vast majority of N‐NAs that have been tested for carcinogenic activity are carcinogenic. N‐NAs are genotoxic carcinogens. They require metabolic activation to form DNA adducts that are critical for their mutagenic and carcinogenic activity. The well‐established major pathway is α‐hydroxylation (adjacent to the N‐nitroso group), catalysed by CYP enzymes. For example, for N‐nitroso methylamines, the CYP‐mediated hydroxylation (at methyl or methylene carbon) produces alkyldiazonium ions. Alkyldiazonium ions are precursors of reactive electrophilic carbenium ions, which directly react with DNA thereby forming stable adducts mainly with nitrogen and oxygen of guanine, cytosine and thymidine. The structure and number of diazonium ions formed from a specific N‐NA depend on the chemical structure of each individual N‐NA. The resulting DNA adducts depend on the nature of the formed diazonium ion. These different adducts are repaired by different cellular repair mechanisms with different capacity, velocity and accuracy. In the case of N‐nitrosomethyl compounds, additional DNA damage could arise through the generation of formaldehyde via methyl hydroxylation.
The presence of an α‐hydrogen is critical for bioactivation and carcinogenesis of N‐NAs. Most non‐carcinogenic or weakly carcinogenic N‐NAs either have sterically or electronically hindering substituents at, or in the vicinity, of the α‐carbon or have highly hydrophilic substituents. Since the presence of an α‐hydrogen is needed for α‐hydroxylation, it can be mechanistically predicted that substitution(s) that replaces α‐hydrogen in dialkylnitrosamines or leads to high polarity thus decreasing or preventing metabolism by a‐hydroxylation can lead to reduction or elimination of the carcinogenic potential. Some of the substituents that are known or can be expected to reduce/eliminate carcinogenic potential of N‐NAs include: (a) acidic group, fluoro‐group or any bulky/unmetabolisable groups at the α‐carbon, (b) branching of alkyl groups or bulky substituents at or in the vicinity of the α‐carbon, (c) large alkyl groups with total exceeding 15 carbons (carcinogenicity decreases with the increase of carbon atoms), (d) presence of a highly polar group as in N‐nitrosoproline and N‐NAs derived from related compounds.
The above picture is a compendium of both empirical observations on known carcinogenic N‐NAs, and of a huge body of mechanistic studies on in vitro and in vivo systems. For example, the full DNA lesion profiles of potent N‐NAs such as NDMA and NDEA remain unclear, but it is well established that they generate pro‐mutagenic O 6 ‐alkylguanine adducts (i.e. the modification of guanine through the addition of small alkyl‐groups such as e.g. ‐CH3, ‐C2H5) which are most commonly repaired via dealkylation by DNA alkyl transferases (AGT, also known as methyl‐guanine‐methyl‐transferase, MGMT). Other N‐NAs such as NDBA, N‐nitrosodiethanolamine (NDELA), NMEA, 4‐(N‐nitrosomethylamino)‐1‐(3‐pyridyl)‐1‐butanone (NNK) are also known to generate O 6 ‐alkyldeoxyguanosine adducts. Investigations also include the application of theoretical methods (such as the ab initio density functional theory approach) to study the relationship between conformation of alkylated DNA bases and their proneness to successful mispairing and subsequent mutagenicity. A detailed presentation of mechanistic findings regarding the individual N‐NAs considered in the present document is in Section 3.1.1.
The carcinogenic potential is determined by multiple factors and depends on: the ability of the N‐NA to be metabolically activated; the metabolic competence and capacity of the tissue to form diazonium/carbenium ions; the nature and stability of the diazonium/carbenium ion and the DNA‐adducts formed; the capacity, velocity and accuracy of the different cellular repair mechanisms responsible for the repair of the different DNA‐adducts in tissues; susceptibility (metabolic and proliferative) of the tissues exposed (EMA, 2020).
3.1.2.5.1. Predicting carcinogenicity potential for N‐NAs without animal carcinogenicity data
The molecular initiating events central to the carcinogenicity process (i.e. generation of alkylated DNA bases) are essentially identical in mutagenicity tests, such as the Ames assay. Indeed, analyses of large databases of mutagenicity and carcinogenicity results showed that the Ames test has a high predictivity for the qualitative prediction of carcinogenicity of N‐NAs in rodent studies, even higher than for other classes of genotoxic carcinogens (Thresher et al., 2020; Trejo‐Martin et al., 2022).
However, using in vitro mutagenicity data for potency ranking of N‐NAs appears problematic. Studies have shown that the predictive relationship between mutagenic potency in Salmonella and rodent carcinogenicity is, at best, weak. When predicting qualitative carcinogenicity, only qualitative mutagenicity is useful. In addition, the relationship between mutagenic potency predictors and quantitative carcinogenicity is very weak. As a matter of fact, in vitro mutagenicity and in vivo carcinogenicity assay systems coincide for the molecular initiating event (DNA alkylation), but they differ for the plethora of other factors (e.g. ADME, promotion and progression phases, etc.) that surround the initiating event and have a strong influence on the modulation of carcinogenic potency (as well as on the tumour profiles induced in different animal species).
Thus, in vitro assays in bacteria like the Ames assay cannot be used as a quantitative surrogate for carcinogenic potency, but they are very useful for qualitative predictions of carcinogenicity.
Important tools for the prediction of the carcinogenic potential of N‐NAs without in vivo data rely on the knowledge on structure–activity relationships (SARs). One popular technique is read across, that basically involves comparison of an untested chemical with structurally related compounds for which carcinogenic activity is known. Considering the most probable mechanism(s) of action, the structural features and functional properties of the untested chemical are evaluated and compared to those of the reference compounds with focus on how the differences between the untested chemical and reference compounds may affect the potential mechanism of action. These include consideration of: SAR knowledge; TK and toxicodynamic parameters that may affect the delivery of biologically active intermediate to target tissue(s) for interaction with key macromolecules that may contribute to carcinogenesis; and available supportive evidence such as genotoxicity data. The similarity between target and analogue(s) must be intended in a broad sense, such as the presence of common functional group, structural similarity, common chemical classes, similar values of physical–chemical parameters; common precursors and/or breakdown products. A quantitative trend in the experimental data for a given endpoint across chemicals in a category can also allow for quantitative interpolation or extrapolation (trend analysis). For chemicals with a limited knowledge base and information, human expert judgement with delineation of the rationale and possible knowledge gaps is often needed (Cross and Ponting, 2021; Dobo et al., 2022; Thomas et al., 2022)
SAR concepts have permitted the development of several (Quantitative) Structure–Activity Relationships ((Q)SAR) models, implemented in a variety of public and commercial software systems. Particularly relevant is the Cancer Expert System ‘OncoLogicTM’ for predicting carcinogenic potential of substances by mechanism‐based (Q)SAR analysis, developed by the US Environmental Protection Agency (EPA). The system gives semi‐quantitative assessment of concern level for the carcinogenic potential of a target substance together with scientific rationale. OncoLogic has been freely available for use by the general public for around 20 years, and has been recently updated.17
Both for (Q)SAR and for read across analyses, the general provisions outlined in ECHA Guidance R6 (ECHA, 2008) should be followed. Further practical guidance is provided in (ECHA, 2016) for (Q)SAR, and in (ECHA, 2012, 2015) for read across.
3.1.2.5.1.1. N‐NA carcinogenicity predictions
NTHZ, NMTHZ and NHMTHZ
| Structure | CAS no. | N‐NA; acronym; volatility | SMILES |
|---|---|---|---|
|
|
73870‐33‐4 | N‐nitrosothiazolidine; NTHZ; volatile | C1CSCN1N=O |
|
|
70629‐19‐5 | N‐nitroso‐2‐methylthiazolidine; NMTHZ; non‐volatile | CC1N(CCS1)N=O |
|
|
92134‐93‐5 | N‐nitroso‐2‐hydroxymethylthiazolidine; NHMTHZ; non‐volatile | OCC1SCCN1N=O |


The cyclical N‐NAs NTHZ, NMTHZ and NHMTHZ are thiazolidines without carcinogenicity data. Two of them (NTHZ and NHMTHZ) are positive in the Ames test.
No close analogues (i.e. thiazolidines) were found in the CPDB.
The closest analogue with carcinogenicity data is N‐nitrosopyrrolidine (NPYR), which can be considered as a representative of cyclic NA, and whose metabolism is dominated by α‐carbon hydroxylation.
As for NPYR, NTHZ, NMTHZ and NHMTHZ, they have α‐hydrogens suitable for hydroxylation. Hydroxylation is reported for NTHZ, (whereas no metabolic studies are reported for the other thiazolidines).
Given the structural similarity with NPYR and the positive mutagenicity of two of them, the three thiazolidine are predicted to be carcinogenic. Tentatively, they can be assigned the same TD50 18 of NPYR (0.799) (rat). This is a conservative estimate, since it has been observed that heteroatoms in the ring tend to decrease potency (see Oncologic rules13).
NHMTCA, NTCA, NMTCA, NOCA and NMOCA
| Structure | CAS no. | N‐NA; Acronym; volatility | SMILES |
|---|---|---|---|
|
|
99452‐46‐7 | N‐nitroso‐2‐hydroxymethyl‐thiazolidine‐4‐carboxylic acid; NHMTCA; non‐volatile | C1C(N(C(S1)CO)N=O)C(=O)O |
|
|
88381‐44‐6 | N‐nitroso‐thiazolidine‐4‐carboxylic acid; NTCA; non‐volatile | C1C(N(CS1)N=O)C(=O)O |
|
|
103659‐08‐1 | N‐nitroso‐2‐methyl‐thiazolidine 4‐carboxylic acid; NMTCA; non‐volatile | CC1N(C(CS1)C(=O)O)N=O |
|
|
95326‐10‐6 | N‐nitrosooxazolidine‐4‐carboxylic acid; NOCA; non‐volatile | OC(=O)C1COCN1N=O |
|
|
95326‐11‐7 | N‐nitroso‐5‐methyloxazolidine‐4‐carboxylic acid; NMOCA; non‐volatile | CC1C(N(CO1)N=O)C(=O)O |


These chemicals are characterised by a cyclic structure substituted with a carboxyl moiety. Hydrophilic substituents (such as carboxyl) tend to make absorption more difficult and excretion easier.
Their closest analogues NHPRO, NPRO and NPIC have negative carcinogenicity data. In metabolic studies, NHPRO and NPRO are found unchanged, thus pointing to the lack of the usual metabolic pathways that generate DNA reactive species from N‐NAs.
Regarding the chemicals with no experimental carcinogenicity data, NTCA and NMTCA are reported to remain unchanged in metabolic studies, in agreement with what is found for their non‐carcinogenic analogues NHPRO and NPRO. NTCA was also found negative in the Ames test, confirming the lack of metabolic activation to DNA reactive species.
Based on chemical similarity with NHPRO, NPRO and NPIC, and existing metabolic and mutagenicity data, it can be inferred that NHMTCA, NTCA, NMTCA, NOCA and NMOCA are unlikely to pose a carcinogenic risk.
NDBzA
| Structure | CAS no. | N‐NA; Acronym; volatility | SMILES |
|---|---|---|---|
|
|
5336‐53‐8 | N‐nitrosodibenzylamine;NDBzA; non‐volatile | C1=CC=C(C=C1)CN(CC2=CC=CC=C2)N=O |

NDBzA is reported as unable to induce tumours by Druckery et al. (1967), that also reported problems with the solubility of the compound.
However, all genotoxicity studies and expected metabolism would predict carcinogenicity.
NDBzA is genotoxic, being positive in the Ames test and in several other assays, including the MutaMouse assay. In the latter system, the predominant type of NDBzA‐induced mutations were transversions, mainly GC > TA. These may arise from unidentified DNA adducts with benzylation possibly being the primary mechanism. Interestingly, in the Ames test, NDBzA is positive not only in the usual TA100 and TA1535 strains (as the other N‐NAs) (small adducts, point mutations), but also in strain TA98 (large adducts, frameshift mutations).
No metabolic data are available; however, given the above MutaMouse results and in analogy with results reported by Moschel et al. (1979), the ability to benzylate DNA can be hypothesised.
Regarding the estimation of TD50 by read across, a partially similar structure is the carcinogenic N‐methyl‐N‐nitrosobenzamide (CAS 63412‐06‐6), with TD50rat = 3.23, for which a related type of DNA damage, DNA benzoylation, could be hypothesised. This agrees with the assignment to NDBzA of a level of concern of LOW‐MODERATE carcinogenic risk by OncologicTM.
NMAMPA and NMAMBA
| Structure | CAS no. | N‐NA; Acronym; volatility | SMILES |
|---|---|---|---|
|
|
93755‐83‐0 | N‐2‐methylpropyl‐N‐1‐methylacetonylnitrosamine; NMAMPA; non‐volatile | CC(C)CN(C(C)C(=O)C)N=O |
|
|
71016‐15‐4 | N‐3‐Methylbutyl‐N‐1‐methylacetonylnitrosamine; NMAMBA; non‐volatile | CC(C)CCN(C(C)C(=O)C)N=O |
No genotoxicity and metabolic data are available for NMAMPA. Data for NMAMBA are limited to positive results in Salmonella Typhimurium (TA1535 and TA100 strains) in the presence of metabolic activation by rat liver S9.
Based on the presence of α‐hydrogens suitable for hydroxylation as in the other acyclic N‐NAs, they are expected to be carcinogenic.
In the CPDB (interrogated within the OECD QSAR Toolbox), 11 similar acyclic N‐NAs (analogues) with TD50 values for the rat were retrieved. Some are not included in the present EFSA work and contribute to expand the database. For this set of acyclic N‐NAs, TD50 correlated with LogKow (hydrophobic parameter) with R‐square = 0.53. The dependence of TD50 of N‐nitrosamines on hydrophobicity is in agreement with the results of Wishnok et al., 1978.
This model can be used to tentatively estimate the TD50s, as follows:
NMAMPA TD50 = 0.242
NMAMBA TD50 = 0.34
These TD50 estimates are conservative, since bulkiness and branching of the alkyl moieties may decrease the carcinogenic risk.
NEA
| Structure | CAS no. | N‐NA; Acronym; volatility | SMILES |
|---|---|---|---|
|
|
612‐64‐6 | N‐Nitroso‐N‐ethylaniline (NEA); Non‐volatile | CCN(C1=CC=CC=C1)N=O |
NEA is a very close analogue of N‐nitrosomethylaniline (NMA), which is carcinogenic with a TD50 = 0.142.
The ethyl moiety in NEA has α‐hydrogens suitable for hydroxylation, as the methyl in NMA. Based on the close structural similarity and structure–activity considerations, NEA is predicted to be carcinogenic with a TD50 = 0.142 as NMA.
NDIPA, NEIPA, NMBA, NDIBA, NMVA, NSAR
These acyclic N‐NAs are known to be carcinogenic in the rodent bioassay; however, no TD50s values are reported in CPDB.
Read‐across analysis was applied to estimate their TD50s. Inspection of chemical structures shows that all have α‐hydrogens suitable for hydroxylation and subsequent generation of DNA adducts. This supports the hypothesis of genotoxic carcinogenicity, with the same mechanism of action of the other carcinogenic N‐NAs considered in this work. NMBA and NMVA are reported to generate DNA adducts; NMBA is also reported to be positive in the Ames test.
The following TD50s were predicted (Table 8):
Table 8.
TD50s of certain N‐NAs predicted by read across
| N‐NA | TD50 prediction |
|---|---|
| NDIPA | 0.199 |
| NEIPA | 0.147 |
| NMBA | 0.151 |
| NDIBA | 0.376 |
| NMVA | 0.068 |
| NSAR | 0.982 |
TD50s for the first five N‐NAs were derived based on 11 analogues, for which a statistically significant relationship between TD50 and logKow was found (with R‐squared = 0.53). The dependence of TD50 of N‐nitrosamines on hydrophobicity is in agreement with the results of Wishnok et al. (1978).
The higher potency of NMVA is justified by the presence of a methyl, with no steric hindrance. The vinyl moiety may further increase potency.
TD50 for NSAR was inferred from that of the very close analogue N‐nitroso‐n‐methyl‐4‐aminobutyric acid (CAS 61445‐55‐4), with the same COOH moiety that decreases potency.
3.1.2.6. Developmental and reproductive toxicity
3.1.2.6.1. Developmental effects and transplacental carcinogenesis
The studies on developmental toxicity of the acyclic N‐NAs (NDMA, NDEA, NDPA, NDBA, NMA), the cyclic NPIP and the aromatic NDPheA are compiled in Table 9. No studies could be retrieved for several acyclic N‐NAs (NMEA, NDIPA, NEIPA, MVA, NDIBA, NDBzA, NMAMPA, NMAMBA, NSAR) and cyclic N‐NAs (NMOR, NTHZ, NPYR, NHPYR, NMTHZ, NHMTHZ, NPRO, NHPRO, NTCA, NMTCA, NHMTCA, NOCA, NMOCA, NPIC).
Table 9.
Developmental toxicity studies on NDMA, NDEA, NDPA, NDBA NMA, NPIP and NDPheA
| Reference | Species, experimental design and doses | Observed effects | Highest dose with no effect (mg/kg bw per day) | Lowest dose with effect (mg/kg bw per day) | ||
|---|---|---|---|---|---|---|
| P | F1/2 | P | F1/2 | |||
| NDMA | ||||||
| Bhattacharyya (1965) |
Rat, Wistar, pregnant No/group: 2–6 Diet: 50, 100, 200 ppm, equivalent to 4.5, 9 or 18 mg/kg bw per day (a) ; no control Duration: during gestation Observation: 19–50 days |
↓ Survival of P Resorptions | 9 | 4.5 | 18 | 9 |
| Napalkov and Alexandrov (1968) | Rat, pregnant No/group in P: > 5 Single gavage.: 0 or 30 mg/kg bw per day on GD1–20 | ↓ Survival of embryos when treated between GD1–13; Occasional occurrence of kidney tumours in F1 |
30 30 |
|||
| Alexandrov (1968) |
Rat, albino, pregnant No/group: not specified Gavage: 0 or 6.7 mg/kg bw per day on GD1–7, GD8–14 or GD15–21 |
Kidney tumours in P Occasional kidney tumours in F1, exposed on GD15–21 | 6.7 | 6.7 | ||
| Alexandrov (1968) |
Rat, albino, pregnant No/group: not specified Gavage: 0 or 3.4 mg/kg bw on GD1–22 |
Kidney tumours in P Occasional kidney tumours in F1 | 3.4 | 3.4 | ||
| Alexandrov et al. (1974) |
Rat, albino, pregnant No/group: 6 Gavage: 0 or 30 mg/kg bw on GD 3, 9, 10 or 12 |
↓ Survival of embryos | 1 × 30 indep. of GD | |||
| Alexandrov et al. (1974) |
Rat, albino, pregnant No/group: 6 Gavage: 30 mg/kg bw on GD21; no control |
Kidney tumours in 25% ofF1 generation Kidney tumours in dams | 30 | 30 | ||
| Anderson et al. (1978) |
Mouse, CD–1 (F) No/group: 20 Drinking water: 0 or 0.1 ppm; equivalent to 0 or 0.015 mg/kg bw per day (a) Duration: 75 days before mating until end of gestation |
Perinatal death | 0.015 | |||
| Anderson et al. (1989) | Mouse, C3H/HeNCr MTV−, pregnant No/group in P: not specified No/group in F1: 48–68 i.p. application: 7.4 mg/kg bw on GD16 or GD19 | HCC in female F1 (treated on GD16 or 19) HCC, histiocytic and undiff liver sarcoma in male F1 (treated on GD19) | 7.4 7.4 | |||
| Althoff et al. (1977); Althoff and Grandjean (1979) | Hamster, Syrian Golden, pregnant No/group in P: > 18 No/group in F1: > 180 Single s.c. application: 0 or 12.5 mg/kg bw on subgroups of 5 mothers on either GD 8, 10, 12, 14 or 15 Observation: up to 100 weeks | ↓ Survival of F1 Small increase in tumour formation in P and F1 | 12.5 | 12.5 12.5 | ||
| NDEA | ||||||
| Wrba et al. (1967) | Rat, SD, pregnant No/group: ~ 25 Daily s.c. application: 4 or 8 mg/animal on GD 10–21; no control | ↓ Survival of P AD and CA of kidney in P; AD, sarcoma and nephroblastoma of kidney in F1 | 8 not clear | |||
| Sydow (1970) |
Rat, Wistar (M, F) No/sex/group in P: 16–19F (M not specified) No/group in F1: 90–149 Drinking water: 1 mg/animal/days; (assuming 330 and 200 g bw) equivalent to 3 mg/kg bw per day for M and 5 mg/kg bw per day for F; Duration: Mating after 35, 50 or 60 days of treatment (for M and F), continued before and during pregnancy (for F). |
CA of kidney in P (F; treated for 60 days before mating) No effects in F1 | 5 | 5 | ||
| Alexandrov et al. (1974) |
Rat, albino pregnant No/group: 6 Gavage: 0 or 200 mg/kg bw on GD 3, 9, 10 or 12 |
↓ Survival of F1 embryos | 1 × 200 indep. of GD | |||
| Alexandrov et al. (1974) | Rat, albino, pregnant No/group in P: not specified Gavage: 150 mg/kg bw on 21; no control | F1: kidney tumours in 48%; tumours in liver and other organs Kidney tumours in P | 150 | 150 | ||
| Mohr and Althoff, (1965) | Mouse, NMRI, pregnant No of treated P: 15 No of F1: > 7 s.c. application: (assuming 50 g bw) 0 or 80–240 mg/kg bw per day on GD15–20; (total dose and duration not clear in results) Observation of F1: 8 or 12 months | Lung AD and hepatoma in F1 (after 8 months) | 80‐240 | |||
| Diwan and Meier (1976) | Mouse, SWR/J (F) mated with AKR/J (M) No/group in F1: 14–34 Single s.c application: 50 mg/kg bw on GD14, 15, 16, 17, or 18; trioctanoin served as control | Lung AD in F1 treated on GD 16, 17 or 18 | 50 | |||
| Mohr and Althoff, (1965); Mohr et al. (1966) | Hamster, Syrian Golden, pregnant No/group in P: 2–8 No/group in F1: 8–41 Daily s.c. application: 2 mg/animal per day on 1–7 days during second half of gestation (assuming 130 g bw) equivalent to approximately 15.3 mg/kg bw per day with a total dose of 15.3–107.7; no control | Papilloma of trachea in 42% of F1 25 weeks after birth Hepatic cirrhosis in 69% of F1 25 weeks after birth; Papilloma found also in cross‐fostering group | 15.3 not clear | |||
| Mohr et al. (1972) | Hamster, Syrian Golden (F), nursing No/group: 5 s.c. application: 0, 5, 10 or 20 mg/kg bw per day on day 1–30 post delivery | ↓ Survival of P and F1 (M, F) Tumours in respiratory tract in P Tumours in respiratory tract in F1 |
5 |
5 5 | 5 10 | |
| Mohr et al. (1975) | Hamster, Syrian Golden, pregnant No/group: 6 Single s.c. application: 0 or 45 mg/kg bw on GD 12, 13,14 or 15 | Tumours of respiratory tract in 95% of F1 and few mothers | 45 | 45 | ||
| Single s.c. application: 0 or 45 mg/kg bw on GD during first 11 GD | No tumour formation in F1; tumours in respiratory tract in few mothers | 45 | 45 | |||
| Mohr et al. (1995) | Hamster, Syrian Golden Han:AURA, pregnant No/group in P: > 19 No/sex/group in F1: > 40 No/sex/group in F2: > 40 Single i.p. application: 0 or 10 mg/kg bw on GD12, 13 or 14 | Tumours of larynx and trachea in P, treated on GD 12, 13 or 14 Tumours in larynx and trachea, incl. neuroendocrine tumours, in F1, treated on GD14 Lymphoma, uterine CA and laryngotracheal neuroendocrine tumours in F2 deriving from GD13 or GD14‐treated animals | 10 | 10 10 | ||
| NDPA | ||||||
| Althoff et al. (1977); Althoff and Grandjean, (1979) | Hamster, Syrian Golden, pregnant No/group in P: > 18 No/group in F1: > 150 Single s.c. application: 0 or 100 mg/kg bw on subgroups of 5 mothers on either GD 8, 10, 12, 14 or 15 Observation: up to 100 weeks | ↓ post‐natal survival Respiratory tumour formation in P Small increase in respiratory, digestive and endocrine tumours in F1: M > F | 100 | 100 100 | ||
| NDBA | ||||||
| Alexandrov et al. (1974) |
Rat, albino, pregnant No/group: 6 Gavage: 0 or 1200 mg/kg bw on GD 3, 9, 10 or 12 |
↓ Survival of embryos | 1 × 1,200, indep of GD | |||
| Mohr et al. (1972) | Hamster, Syrian Golden (F), nursing No/group: 5 s.c. application: 0, 5, 10 or 20 mg/kg bw per day on day 1–30 post delivery | ↓ Survival of P Tumours in respiratory tract in P Tumours in respiratory tract in F1 |
10 |
5 5 | 20 | |
| Althoff et al. (1976), Althoff and Grandjean, (1979) | Hamster, Syrian Golden, pregnant No/group: > 5 s.c. application: 0 or 30 mg/kg bw on 2–8 days between GD8 and 15 | ↓ Post‐natal survival of offsprings Tumour formation in respiratory tract in P > F1 | 30 | 30 30 | ||
| Single s.c. application: 0 or 30 mg/kg bw on subgroups of 5 mothers on either GD8, 10, 12, 14 or 15 Observation: up to 100 weeks | No significantly increased tumour formation in P Tumour formation in respiratory tract in F1 | 30 | 30 | |||
| NMA | ||||||
| Napalkov and Alexandrov (1968) | Rat, pregnant No/group: not specified Single i.p. application: 0 or 140 mg/kg bw per day on GD1–20 | ↓ Survival of embryos when treated between GD1–15 Microphthalmia, exencephaly or syndactyly on GD9–13 | 140 | |||
| NPIP | ||||||
|
Althoff et al. (1977) Althoff and Grandjean, (1979) |
Hamster, Syrian Golden, pregnant No/group in P: > 5 No/group in F1: > 20 Single s.c. application: 0 or 100 mg/kg bw on GD8, 10, 12, 14 or 15 Observation: up to 100 weeks | Tumours in respiratory tract in 54% of P Tumours in upper respiratory tract in 2–7% of F1: F > M | 100 | 100 | ||
| NDPheA | ||||||
| ECHA (2017) (b) | Rat, SD (M, F) No/sex/group: 10 Gavage: 0, 15, 50 or 150 mg/kg bw per day Duration ‐ M: 2 weeks before and after mating (total 4 weeks) F: ‐ 2 weeks before mating, during the mating period (up to 2 weeks), during gestation, during lactation until d13 post‐partum | ↓ litter size, live birth and viability | 15 | 50 | ||
EFSA default values were applied.
With regard to developmental effects of NDMA, rat dams receiving 9 mg/kg bw per day during gestation, exhibited enhanced resorptions; from 2 dams on 18 mg/kg bw per day, one died on gestation day (GD) 19; (Bhattacharyya, 1965). Napalkov and Alexandrov (1968) observed that prenatal survival was impaired when mothers received a single dose of 30 mg/kg bw between GD1 and 13, while from GD14 onwards, no effect was seen. This observation was substantiated by Alekxandrov (1974) who found that a single NDMA dose of 30 mg/kg bw per day on GD 3, 9, 10 or 12 reduced the survival of embryos. Perinatal death was observed in F1 of mice, when mothers were exposed to 0.015 mg/kg bw per day, starting 75 days before mating and continuing until the end of gestation (Anderson et al., 1978). Also, hamsters displayed reduced survival of F1 in mothers receiving 12.5 mg/kg bw via single s.c. application between GD8 and 15 (Althoff et al., 1977).
NDMA‐induced transplacental carcinogenesis was reported for rat and mouse with an insignificant trend also in hamster. In rat dams and offsprings, kidney tumours formed when treated with a single dose of 30 mg/kg bw between GD1 and 20 or solely on GD21 (Napalkov and Alexandrov, 1968; Aleksandrov et al., 1974). The tumours started to occur from the 47th postnatal week onwards. In more detailed studies, Alexandrov (1968) reported occasional tumour formation in the kidney and some other organs in the second year of life of the F1 generation, receiving 3.4 mg/kg bw on GD1 and 22 or 6.7 mg/kg bw per day on GD15–21 but not when 6.7 mg/kg bw per day were applied on GD1–7 or GD8–14. The dams, however, developed kidney tumours under any condition. Female offsprings of C3H/HeNCr MTV − mice, treated with 7.4 mg/kg bw i.p. on GD16 or GD19, exhibited HCC. During the second year of life, the male offsprings developed HCC and undifferentiated tumours of the liver when exposed on GD19; application on GD16 was without effect (Anderson et al., 1989). In Syrian hamsters, a single s.c. application of 12.5 mg/kg bw on either GD 8, 10, 12, 14 or 15 was weakly carcinogenic in the offsprings (Althoff et al., 1977; Althoff and Grandjean, 1979). After the single s.c. application to dams, the compound was present for at least 2 h in maternal blood, placenta, fetus and amniotic fluid (Althoff et al., 1977).
Regarding developmental effects of NDEA, reduced survival of F1 embryos was independent of whether a single oral dose of 200 mg/kg bw per day was applied to mothers on GD3, 9, 10 or 12 (Alexandrov et al., 1974). While nursing, Syrian hamsters received s.c. applications of NDEA at 5, 10 or 20 mg/kg bw per day from the first to the 30th day post‐delivery. The average survival of dams and offsprings was reduced (Mohr et al., 1972). Tumours developed in the respiratory tract in P and the F1 generation (Mohr et al., 1972). The authors speculate that NDEA may appear in the milk of the treated mothers at sufficiently high amounts to induce tumour formation. Spielhoff et al. (1974) showed that NDEA, applied i.p., appeared in the milk after 30 min, with a maximum at 45 min and disappearance after 120 min.
Transplacental carcinogenesis was induced in the kidney of F1 rats, when mothers received 4 or 8 mg/kg bw on GD10–21 via s.c. application (Wrba et al., 1967) or via gavage of 150 mg/kg bw on GD21 (Alexandrov et al., 1974). The tumours had appeared after about 1 year of life. The very last regimen induced also tumours in the liver and other organs of the offsprings as well as kidney tumours in the dams. On the other hand, NDEA at 5 mg/kg bw per day, provided via drinking water to male and female Wistar rats 35–60 days before mating until the end of the gestational period, was without effect on F1 but induced kidney tumours in dams (Sydow, 1970). The lung was the site of tumour formation in F1 mice of mothers, treated s.c. with 80–240 mg/kg bw per day between GD15 and 20 (Mohr and Althoff, 1965) or with 50 mg/kg bw on GD16, 17 or 18 (Diwan and Meier, 1976). The tumours had appeared at 8–13 months of age. Single treatments with 50 mg/kg bw on GD 14 or 15 were without effect (Diwan and Meier, 1976). The F1 generation of Syrian hamsters developed tumours in the respiratory tract when mothers were treated with 5 mg/kg bw or more on 1 or more days in the second half of the gestational period (Mohr and Althoff, 1965; Mohr et al., 1966, 1975, 1995). Similar to reports on NDMA, at certain gestational periods, the fetus was susceptible to postnatal development of respiratory tract tumours. Interestingly, lymphoma, uterine carcinoma and laryngotracheal neuroendocrine tumours occurred at an increased frequency in the F2‐generation deriving from F1‐animals that had been treated on GD13 or GD14 (Mohr et al., 1995). Following a single s.c. application of 100 mg/kg bw to dams, the compound was present for at least 2 h in maternal blood, placenta, fetus and amniotic fluid of the hamsters (Althoff et al., 1977)
For NDPA data on developmental effects and transplacental carcinogenesis derive from one group studying the compound in Syrian Golden hamster. Reduced post‐natal survival was found in offsprings from mother receiving a single s.c. dose of 100 mg/kg bw on GD 8, 10, 12, 14 or 15. This resulted in slightly increased respiratory, digestive and endocrine tumours, which were more frequent in the male than in the female offsprings. Tumours in the respiratory tract of the P‐generation were reported as well. Following the single s.c. application to dams, the compound was present for at least 2 h in maternal blood, placenta, fetus and amniotic fluid (Althoff et al., 1977; Althoff and Grandjean, 1979).
Regarding developmental effects of NDBA, reduced survival of embryos was observed after a single dose of 1200 mg/kg bw per day on either GD 3, 9, 10 or 12 (Alexandrov et al., 1974). The survival of offspring was also reduced when exposed in utero with 30 mg/kg bw per day on 2–8 days between GD8 and GD15 (Althoff et al., 1976; Althoff and Grandjean, 1979). Nursing Syrian hamsters received s.c. NDBA at 0, 5, 10 or 20 mg/kg bw per day between the first and the 30th day post‐delivery, which reduced survival of dams (Mohr et al., 1972). In addition, tumours in the respiratory tract developed in mothers and the offsprings.
Althoff et al. (1976) and Althoff and Grandjean (1979) examined the transplacental carcinogenic effects of NDBA and injected the compound s.c. into pregnant hamsters at 30 mg/kg bw on 2–8 days between GD8 and GD15 or just as a single dose on GD8, 10, 12, 14 or 15. The animals were observed for up to 100 weeks. Respiratory tumours developed. Single doses of 30 mg/kg bw induced tumours in the F1‐ but not in the P‐generation whereas NDBA application for 2–8 days between GD8 and 15 caused a higher tumour incidence in the P‐ than in the F1‐generation. No macroscopic malformations were observed in the offspring. Following the single s.c. application to dams, the compound was present for at least 2 h in maternal blood, placenta, fetus and amniotic fluid (Althoff et al., 1977).
Napalkov and Alexandrov (1968) studied developmental effects of NMA and reported that prenatal survival was impaired when mothers received a single dose of 140 mg/kg bw between GD1 and 15, while from GD16 onwards, no clear effect was seen. Five of 79 surviving fetuses exhibited abnormalities between GD9 and 13, such as microphthalmia, exencephaly or syndactyly.
Data on transplacental carcinogenesis by NMA could not be found.
No data on the developmental effects of NPIP could be identified in the literature.
The transplacental carcinogenic effects of NPIP were studied in Syrian Golden hamsters. A single s.c. application of 100 mg/kg bw on either GD 8, 10, 12, 14 or 15 elicited a weak carcinogenic effect in the respiratory tract of offsprings. Tumour formation became evident during the second year of life and was more pronounced in the females than in the males. Respiratory tract tumours in P were reported as well (Althoff et al., 1977; Althoff and Grandjean, 1979).
Developmental effects of NDPheA are documented in a study publically available on the ECHA homepage. Male and female SD rats were subjected to gavage of 0, 15, 50 or 150 mg/kg bw per day starting 2 weeks before and ending 2 weeks after mating (for M) or continuing during gestation and lactation until d13 post‐partum (for F). The no‐observed adverse effect level (NOAEL) for toxic effects on offsprings was 15 mg/kg bw per day based on reduced litter size and lower live birth and viability indexes at 50 and 150 mg/kg bw per day.
Data on possible transplacental carcinogenic effects of NDPheA could not be retrieved form the literature.
To summarise, depending on the experimental design of the developmental toxicity study, NDMA, NDEA, NDPA, NDBA, NMA and NDPheA may reduce pre‐ and perinatal survival of offsprings in rat, mouse and/or hamster. With the exception of NMA, malformations were not reported for the N‐NAs tested. In hamsters transfer to the milk of dams and tumour occurrence in the nursed offsprings was reported for NDEA and NDBA.
NDMA, NDEA, NDPA, NDBA and NPIP showed transplacental carcinogenic effects in the offsprings of treated dams in several rat, mouse and/or hamster strains.
3.1.2.6.2. Reproductive effects
With regard to reproductive toxicity of NDMA, a few studies were performed in male rodents. A single i.p. application of 60 mg/kg bw to rats induced necrosis of seminiferous epithelium and reduced the number of mature spermatozoa (Hard and Butler, 1970). In mice one i.p. dose of 6 mg/kg bw did not elicit sperm abnormalities (Wyrobek and Bruce, 1975). The oral application of 0.5 mg/kg bw per day (route not specified) over a period of 12 weeks induced testicular necrosis and reduced the testosterone serum concentration in New Zealand rabbits (Sheweita et al., 2017). From this limited data set, it may be deduced that NDMA affects the rodent testis.
NDEA was applied via the drinking water to female Wistar rats at a daily dose of 5 mg/kg bw. The treatment started 35–60 days before mating and continued during the entire gestational period. No reduced fertility could be observed (Sydow, 1970). In male New Zealand rabbits, however, the application of NDEA at an oral dose of 0.5 mg/kg bw per day for 12 weeks induced testicular necrosis and reduced the testosterone serum concentration (Sheweita et al., 2017).
Male and female SD rats were subjected to gavage of 0, 15, 50 or 150 mg/kg bw per day of NDPheA, starting 2 weeks before and ending 2 weeks after mating (for M) or continuing during gestation and lactation until day 13 post‐partum (for F) (ECHA, 2017). The NOAEL for reproductive performance (mating, fertility and delivery) was the highest dose of 150 mg/kg/days, based on the absence of adverse findings. NDPheA elicited testicular necrosis in male New Zealand rabbits, when applied orally at 0.5 mg/kg bw per day for 12 weeks (Sheweita et al., 2017). This was associated with lipid peroxidation, as determined by increased thiobarbituric acid‐reactive substances (TBARS) and decreased activity of superoxide dismutase (SOD), catalase and glutathione‐S‐transferases (GST) as well as an overall reduced glutathione (GSH) content in the testis. As a result, the testosterone level in the serum was lowered while the oestrogen level was increased.
No studies could be retrieved for NMEA, NDPA, NDIPA, NEIPA, NMBA, MVA, NDBA, NDIBA, NMA, NDBzA, NMAMPA, NMAMBA, NSAR, NMOR, NPIP, NTHZ, NPYR, NHPYR, NMTHZ, NHMTHZ, NPRO, NHPRO, NTCA, NMTCA, NHMTCA, NOCA, NMOCA, and NPIC.
Overall, no impact on female fertility was found for NDEA, while induction of testicular necrosis was reported for NDMA, NDEA and NDPheA.
3.1.2.7. Immunotoxicity
3.1.2.7.1. Immunotoxicology/Effects on the immune system
Several studies showed that N‐NAs induce profound alterations in the immune system of rodents. The humoral responses were reduced in rats and mice after single or multiple doses of NDMA and other N‐NAs. As examples, a single i.p. application of NDMA at 14 mg/kg bw to mice was followed by i.v. injection of approximately 1 × 10⁹ sheep red blood cells (sRBC) on day 2 post‐treatment. NDMA reduced significantly the anti‐sRBC haemagglutinin titre (Waynforth and Magee, 1974). Holsapple et al. (1984) treated female B6C3F1 mice via i.p. application of NDMA at 1 .5, 3.0 and 5.0 mg/kg bw per day for 2 weeks. Twenty‐four hours or 30 days after the last exposure, the spleens were minced and spleen cell suspensions were cultured with either lipopolysaccharide or sRBC. The IgM‐antibody response to LPS or sRBC was inhibited at all NDMA doses applied. Desjardins et al. (1992) treated female CD‐1 mice with 0, 1, 5, 10 and 20 ppm NDMA (equivalent to 0, 0.15, 0.75, 1.5 or 3 mg/kg bw per day) via drinking water over a period of 15–120 days. Reduced survival and ascites occurred in animals in the highest and second highest dose group, respectively. IgM‐mediated response to sRBC was suppressed in animals with 1.5 mg/kg bw per day after 90 or 120 days of treatment. Hard (1981) reported a similar outcome in female Wistar rats, i.e. a single i.p. application of NDMA (60 mg/kg bw) reduced the responsiveness to sRBC; the alteration persisted for at least 10 days.
Johnson et al. (1987) suggested that the B lymphocyte is the primary cellular target of the NDMA‐induced suppressed antibody response. This effect was found to depend on metabolic activation. Haggerty and Holsapple (1990) suggested that the metabolites being capable of suppressing the humoral immune response may be qualitatively and/or quantitatively different from those being hepatotoxic and genotoxic.
Scherf and Schmahl (1975) treated male SD rats with NDMA (0, 0.28, 0.56, 1.12 or 2.25 mg/kg bw) or NMOR (0, 2, 4, 8 or 16 mg/kg bw) via injection (unclear whether s.c. or i.p) once weekly for 12, 18 or 24 weeks. After the last injection, the animals were immunised by inoculation of sRBC and 5 days later the number of IgM‐producing spleen cells was determined by a plaque formation assay. After 18 weeks of treatment, the highest dose of NDMA and NMOR had reduced significantly the immune response.
Kaminski et al. (1989) compared the potency of several N‐NAs in female B6C3F1 mice. Selected compounds with symmetrical aliphatic chains (NDMA, NDEA, NDPA, NDBA) and with an N‐methyl group (NMEA, NMPA, NMBA) were applied i.p. on 7 consecutive days. For sensitisation the animals received i.v. sRBC one day after the last treatment with NA. Four days later spleen cells were removed and subjected to a plaque‐forming assay. The in vivo sRBC antibody response was suppressed by all tested compounds, i.e. NDMA was effective already at 1 mg/kg bw per day, NMBA at 1.5 mg/kg bw per day, NMEA at 15 mg/kg bw per day, NDEA at 24 mg/kg bw per day, NDPA at 50 mg/kg bw per day and NDBA at 200 mg/kg bw per day, and. Based on a calculated effective dose (ED50), it was concluded that (i) dialkylnitrosamines with an N‐methyl group were more immune–toxic than dialkylnitrosamines with symmetric aliphatic chains and (ii) for the symmetric chains, there was an inverse relationship between aliphatic chain length and the immune–toxic potency.
The cell‐mediated immune response was both enhanced and suppressed by NDMA in dependence of the parameter investigated. As examples, Holsapple et al. (1985) treated female B6C3F1 mice via i.p. injections with 1.5, 3.0 and 5.0 mg/kg NDMA daily for 14 days. The animals showed a suppressed lymphoproliferative response to the T‐cell mitogens concanavalin A and phytohaemagglutinin, and mixed lymphocyte response to mitomycin‐treated DBA‐2 spleen cells. The delayed hypersensitivity response to keyhole limpet haemocyanin was determined by alterations in the vascular permeability and was halved at the highest NDMA dose. At the same time, the number of granulocyte/monocyte stem cells was increased dose dependently in bone marrow while the NDMA‐treated mice became less susceptible to Listeria monocytogenes than controls. These data indicate that NDMA suppresses cell‐mediated immunity but elevates the number of bone marrow cells which differentiate to granulocytes or monocytes.
Duke et al. (1985) reported that NDMA induced differentiation and activation of macrophages, e.g. i.p. treatment of female (C57BL/6 × C3H) mice with 1.5, 3.0 or 5.0 mg/kg bw per day altered the activity of bone marrow‐derived macrophages and natural killer cells. As a result, the mice were more resistant against the formation of lung metastases by B16F10 melanoma cells, which had been injected i.v. In a highly similar experimental in vivo model the protective effect of NDMA on lung metastasis formation by B16F10 cells was reported by Thomas et al. (1985). On day 16, the animals showed increased NK cell activity and delayed hypersensitivity. Resistance to challenge with Listeria monocytogenes, Trichinella spiralis or Herpes simplex types I or 2 virus was not significantly impaired. The authors concluded that the elevated NK cell activity may account for these effects. Female B6C3F1 mice, receiving NDMA i.p. at 0.005 mg/kg bw per day for 2 weeks, were more resistant to bacterial challenges. The macrophages, isolated from these animals, showed increased superoxide anion production in vitro following stimulation with either phorbol myristate acetate or opsonised zymosan. Superoxide anion production by bone marrow‐derived macrophages was also enhanced (Edwards et al., 1991).
Myers and Schook (1987) reported that macrophages, isolated from the bone marrow of female B6C3F1 mice, exposed i.p. to NDMA at 1.5 or 5.0 mg/kg bw per day for 2 weeks, showed enhanced cytotoxicity against L929 mouse fibroblasts. Based on several in vitro assays with the macrophages, the authors concluded that NDMA altered the differentiation, maturation as well as the function of these cells. In a further study of the same authors (Myers and Schook, 1987), NDMA‐induced alterations in myelopoiesis were demonstrated, i.e. the generation of colony stimulating factor (CSF)‐2 responsive colonies was increased, while the same cells exhibited a decreased proliferative response to CSF‐1. Furthermore, sera of NDMA‐treated mice showed a decreased CSF‐1 activity.
Desjardins et al. (1992) treated female CD‐1 mice with 1, 5, 10 and 20 ppm NDMA (equivalent to 0.15, 0.75, 1.5 or 3 mg/kg bw per day) via drinking water over a period of 15–120 days. Cellular immune response, monitored by allogeneic stimulation of cells in mixed lymphocyte reaction, was lowered by 1.5 and 3 mg/kg bw per day. The immunosuppression was reversed after stop of treatment.
Kunke and Strunk (1981) tested the NDMA effect in Hartley guinea pigs, receiving NDMA as a single injection of 5 mg/kg bw into the hind leg. Six days later, peritoneal macrophages were isolated and the ex vivo production of the second and fourth components of complement system (C2 and C4) was reduced.
To summarise, rats and mice exposed to NDMA and other N‐NAs tested, exhibited a reduced humoral immune response while the cell‐mediated immune response was suppressed or enhanced depending on the parameters investigated.
3.1.2.8. Other endpoints (e.g. neurotox, other, as appropriate)
No relevant data were retrieved from the literature.
3.1.3. Observations in humans
3.1.3.1. Dietary intake of N‐NAs and cancer
In this section, epidemiological studies on cancer and N‐NA intake were reviewed. Given the available evidence stemming from longitudinal and case–control studies with a large sample size, cross‐sectional and ecological studies were not considered further due to the fact that they are more prone to specific types of bias and to their inherent limitations in identifying causal associations. A quality assessment of the studies was conducted using the Newcastle–Ottawa scale (Wells et al., 2021).
In all the studies on N‐NAs and cancer assessed, selection bias, information bias and confounding were present to some degree. In addition, in all studies, N‐NA intake was estimated from data obtained from food frequency and food history questionnaires. Food intake questionnaires are imperfect measures of exposure, and thus, misclassification of exposure is likely to occur. It is important to note that food frequency questionnaires are used to rank subjects according to food or nutrient intake, but not to estimate absolute levels of intake. Based on the exposure tools used in these studies and in the possibility of residual confounding by other exposure sources (e.g. smoking, occupation) and/or other unmeasured factors (e.g. Helicobacter for gastric cancer, fruits and vegetables intake, chemicals contained in meat other than N‐NAs), the possibility of using data from these studies for hazard characterisation is limited. Therefore, these studies cannot be used to establish tumour target sites and reference points for N‐NAs. However, these studies could support an association between N‐NAs and cancer and they are discussed and summarised below. A detailed description of the studies (including confounding factors taken into consideration in the analysis) and their specific limitations are given in Tables F.9–F.12 and in Annex F.
3.1.3.1.1. Cancers of the digestive system
Oesophageal cancer
In a large cohort study conducted in the Netherlands (N = 120,852) an increased risk was found for NDMA and oesophageal squamous cell carcinoma (T3 vs. T1, HR: 1.76; 95% CI: 1.07–2.90; p‐trend = 0.01) (Keszei et al., 2013). In another cohort study conducted in the UK assessing various types of cancer, subgroup results for oesophageal cancer (55 cases), showed no significant association with NDMA intake (HR, per 1 SD increase: 1.13; 95% CI: 0.77–1.68) (Loh et al., 2011). In a case–control study conducted in the USA, NDMA intake was not statistically significantly associated with oesophageal cancer (T3 vs. T1, OR: 1.86; 95% CI: 0.87–3.95; p‐trend = 0.063) (Rogers et al. 1995). In all three studies, smoking was considered in the multivariate models but the study of Keszei et al. (2013) was the only one that considered both intensity and duration of smoking.
In summary, two cohort studies and one case–control study examined the association between N‐NA intake and oesophageal cancer. The large cohort study reported an association between N‐NA intake and the subtype of squamous cell carcinoma.
Gastric cancer
In a Swedish cohort study (61,433 women), NDMA intake was significantly associated with overall gastric cancer risk (Q5 vs. Q1, HR: 1.96; 95% CI: 1.08–3.58; p‐trend = 0.02) (Larsson et al., 2006). In a cohort study conducted in the UK (23,363), an increased risk (per 1 SD increase of NDMA, HR: 1.13; 95% CI: 1.00–1.28) was found for gastrointestinal tract cancer (oesophagus, stomach, colon, rectum). For stomach cancer alone an increased risk, although not statistically significant, was observed for NDMA intake (per 1 SD increase; HR: 1.13; 95% CI: 0.81–1.57; ncases = 64) (Loh et al., 2011). In a large cohort study conducted in ten European countries (N = 521,457), no association was found between NDMA and both cardia and non‐cardia gastric cancer (HR: 1.0; 95% CI: 0.70–1.43) (Jakszyn et al., 2006). In a cohort study conducted in Finland (N = 9,985), no association was found for stomach cancer and NDMA (Q4 vs. Q1; HR: 0.75; 95% CI: 0.37–1.51) (Knekt et al., 1999). In a Dutch cohort study (N = 120,852), a statistically significant association with NDMA intake was found for gastric non‐cardia adenocarcinoma (GNCA) only in men (HR: 1.06; 95% CI: 1.01–1.10,) No combined estimates were reported (Keszei et al., 2013).
Six case–control studies (Gonzalez et al., 1994; La Vecchia et al., 1995; Pobel et al., 1995; Rogers et al., 1995; De Stefani et al., 1998; Palli et al., 2001) investigated the role of NAs and gastric cancer. A case–control study conducted in Spain assessed the risk for gastric adenocarcinoma and found an increased risk (Q4 vs. Q1, OR: 2.09, CI not reported, p‐trend = 0.007) (Gonzalez et al., 1994). In a case–control study conducted in Italy, high intake of NDMA was associated with an increased risk of gastric cancer (T3 vs. T1, OR: 1.40; 95% CI: 1.1–1.7; p‐trend = < 0.01) (La Vecchia et al., 1995).In a case–control study conducted in France, an increased risk of gastric cancer was reported for the second (T2 vs. T1, RR: 4.13; 95% CI: 0.93–18.27) and third tertile (T3 vs. T1, RR: 7.0; 95% CI: 1.85–26.46, p‐trend = 0.04) of dietary intake of NDMA (Pobel et al., 1995). In a case–control study in Uruguay high dietary NDMA intake was significantly associated with gastric cancer (T4 vs. T1, OR: 3.62; 95% CI: 2.38–5.51) (De Stefani et al., 1998). In a case–control study conducted in Italy, no association was found between NDMA (OR: 1.1; 95% CI: 0.8–1.5) and DMA (OR: 0.9; 95% CI: 0.7–1.3) and gastric cancer (Palli et al., 2001). In a case–control study conducted in Canada, no association was found between DMA and stomach cancer (OR: 0.94; 95% CI: 0.14–6.13) (Rogers et al., 1995).
In summary, an association between N‐NA intake and gastric cancer was found in two of five cohort studies and in four of six case–control studies. However, most of these studies did not control for smoking to a sufficient extent and none controlled for the Helicobacter pylori status, an important risk factor for gastric cancer.
Colorectal cancer
In a cohort study conducted in Finland (N = 9,985) an increased risk was found for NDMA intake and colorectal cancer (Q4 vs. Q1, RR: 2.12; 95% CI: 1.04–4.33; p‐trend = 0.47) (Knekt et al., 1999). In a cohort study conducted in the UK (N = 23,363) on various types of cancer, subgroup results for rectum cancer (137 cases) showed an increased risk for NDMA intake (per 1 SD increase, HR: 1.46; 95% CI: 1.16–1.84) while for colon cancer no statistically significant association was found (per 1 SD increase; HR: 0.99; 95% CI: 0.83–1.18) (Loh et al., 2011). In a case–control study conducted in Canada, NDMA intake was associated with an increased risk of colorectum cancer (Q5 vs. Q1, OR: 1.42; 95% CI: 1.03–1.96; p‐trend = 0.005) (Zhu et al., 2014).
In summary, all studies reported an association between NDMA intake and colorectal or rectal cancer. None of the cohort studies controlled for fruit and vegetable intake, an important risk factor for colorectal cancer, and none of the three studies controlled for other carcinogenic chemicals contained in meat.
Pancreatic cancer
A large cohort study (N = 190,545) conducted in the USA showed an increased risk for pancreatic cancer for high N‐NA intake (Q5 vs. Q1, HR: 1.26; 95% CI: 1.01–1.56; p‐trend = 0.29) (Nöthlings et al., 2005). In a case–control study (N = 957 cases and 938 controls), high intake of NDMA from plant sources, but not from animal sources, was associated with pancreatic cancer (Q4 vs. Q1, OR: 1.93, 95% CI: 1.42–2.61, p‐trend < 0.0001). In the same study, high intake of NDEA from both animal and plant sources (Q4 vs. Q1, OR: 2.28; 95% CI: 1.71–3.04, p‐trend < 0.0001) was associated with an increased risk. No increased risk was found for NDBA and NPYR (Zheng et al., 2019).
In summary, a large cohort study and a case–control study reported an association between intake of some N‐NAs and pancreatic cancer.
Hepatocellular carcinoma
Zheng (2021) investigated in USA, the association between dietary N‐NAs and HCC in a case control study. Cases (N = 827) were histologically or radiologically confirmed incident HCC cases from the MD Anderson Cancer Center in USA. Controls (N = 1,013) were spouses of other than liver cancer patients with no history of liver or GI or lung or head and neck cancers. An increased risk for HCC was found for high intake of NDMA from plant sources (Q4 vs. Q1, OR: 1.54; 95% CI: 1.01–2.34), and NPIP from animal sources (Q4 vs. Q1, OR: 2.52; 95% CI: 1.62–3.94, p‐trend < 0.0001). No increased risk was found for total NDMA and NDMA from animal sources, NDEA, NDBA, NDPA, NMAMBA and NPYR.
In summary, a single large case–control study reported a significant association between dietary NDMA and NPIP and HCC.
3.1.3.1.2. Other cancer types
Head and neck cancer
One cohort study conducted in Finland (N = 9,985) investigated the association between NDMA and head and neck cancer and found no statistically significant association (Q4 vs. Q1, HR: 1.37; 95% CI: 0.50–3.74; p‐trend = 0.43; ncases = 48) (Knekt et al., 1999).
A case–control study in the USA examined the relationship between NDMA intake and laryngeal cancer and found no statistically significant increased risk (T3 vs. T1; OR: 1.70; 95% CI: 0.91–3.18). In the same study, an association between high intake of NDMA and oral cancer was observed (T3 vs. T1; OR: 1.82; 95% CI: 1.10–3.00; p‐trend = 0.118) (Rogers et al., 1995).
A case–control study conducted in Taiwan showed no association between N‐NA intake in adulthood and nasopharyngeal carcinoma. An increased risk was found for total N‐NA intake at the age of 3 years (OR: 2.6, 95% CI 1.0–7.0) and during the weaning period (OR: 3.9, 95% CI 1.4–10.4) (Ward et al., 2000).
In summary, no association was found between head and neck and laryngeal cancer in a cohort study and in one of the two case–control studies, respectively. An association for N‐NA intake was found for oral cancer in the same case–control study and for nasopharyngeal cancer in the second case–control study but only when intake estimates were related to age three and the weaning period. However, the latter is associated with recall bias.
Brain cancer
In a cohort study (N = 230, 655) with combined data from three US prospective cohort studies, NDMA (Q5 vs. Q1, HR: 0.88; 95% CI: 0.57–1.36; p‐trend = 0.73) as well as NPYR intake (T3 vs. T1, HR: 0.81; 95% CI: 0.62–1.05; p‐trend = 0.93) were not associated with the risk of glioma (Michaud et al., 2009).
The case–control study conducted in Germany showed an increased risk for glioma (T3 vs. T1, OR: 2.8; 95% CI: 1.5–5.3, p‐trend = 0.001), NPYR (T3 vs. T1, OR: 3.4; 95% CI: 1.8–6.4, p‐trend ≤ 0.001) and NPIP (T3 vs. T1, OR: 2.7; 95% CI: 1.4–5.2, p‐trend = 0.004). For meningioma, an increased risk was also found for high intakes of NDMA, NPYR and NPIP. However, it was statistically significant only for high intake of NPIP (T3 vs. T1 OR: 2.0; 95% CI: 1.0–3.8) (Boeing et al., 1993).
In a study conducted in Australia, an increased risk for glioma was found only for men (T3 vs. T1 OR: 1.78; 95% CI: 1.12–2.84). (Giles et al., 1994). In a small study conducted in USA and Canada, no association was found between maternal N‐NA intake during pregnancy and the risk of astrocytoma in the offspring (Q4 vs. Q1, OR: 0.8; 95% CI: 0.4–1.6) (Bunin et al., 1994).
In summary, one large cohort study found no association while two of three case–control studies reported an association between N‐NA intake and brain cancer.
Lung cancer
In a cohort study conducted in the UK (N = 23,363), which focused on various types of cancers, subgroup results for lung cancer showed no increased risk for NDMA intake (per 1 SD increase, HR: 1.05; 95% CI: 0.88–1.24, n = 235 cases) (Loh et al., 2011).
In a population case–control study on Hawaii on the relation between diet and lung cancer, an increased risk was found for high intake of NDMA among men (Q4 vs. Q1OR: 3.3; 95% CI: 1.7–6.2, p‐trend = 0.0006) and women (Q4 vs. Q1, OR: 2.7; 95% CI: 1.0–6.9, p‐trend = 0.04) (Goodman et al., 1992).
Two case–control studies conducted in Uruguay showed an increased risk of lung cancer for N‐NA intake. In the first study, high NDMA intake was associated with a threefold increase in risk for lung cancer (Q4 vs. Q1, OR: 3.14; 95% CI: 1.86–5.29, p‐trend < 0.001). In a stratified analysis by histological type, the risk was higher for adenocarcinoma of the lung (Q4 vs. Q1, OR: 4.57; 95% CI: 1.88–11.1, p‐trend < 0.001) (De Stefani et al., 1996).
The second study conducted by the same author but with a larger sample size (866 lung cancer cases and 1346 controls) confirmed the increased risk for lung cancer associated with high intake of N‐NAs (Q4 vs. Q1, OR: 1.89; 95% CI: 1.30–2.73; p‐trend = 0.0002) (De Stefani et al., 2009). However, in the two case–control studies by De Stefani et al. (1996, 2009) in which a stratified analysis was conducted by smoking status the association between N‐NA intake and lung cancer was not confirmed for former and non‐smokers.
In summary, three case–control studies reported an association between N‐NA intake and lung cancer, but this association was not confirmed in the cohort study.
Urinary tract cancer
In a cohort study (N = 481,419) that involved 10 European countries, no statistically significant association of dietary NDMA and bladder cancer was found (Q4 vs. Q1, HR: 1.12; 95% CI: 0.88–1.44; p‐trend = 0.49) (Jakszyn et al., 2011).
In a case–control study in the USA (N = 1,660 cases and 3,246 controls), no association was found for high intake of N‐NAs and bladder cancer (Q5 vs. Q1; OR: 1.03; 95% CI: 0.78–1.36; p‐trend = 0.984). However, in a stratified analysis by smoking status, an increased risk, although not statistically significant, was found for high intake of N‐NAs (OR: 1.52; 95% CI: 0.86–2.66; p‐trend = 0.281) among non‐smokers (Catsburg et al., 2014).
In a case–control study conducted in the USA, an increased risk for lower urinary tract cancer (90% bladder cancer) was observed only for men of Japanese ancestry (T3 vs. T1, OR: 3.0; 95% CI, 1.4–6.4, p‐trend = 0.01) but not for Caucasians (Wilkens et al., 1996).
In summary, one cohort studies and one case–control study reported no association between N‐NA intake and bladder cancer. A case–control study reported an association between N‐NAs and the lower urinary tract cancer.
Prostate cancer
In a cohort study conducted in 10 European countries (N = 139,005), NDMA intake was not associated with prostate cancer (Q5, vs. Q1, HR: 1.04; 95% CI: 0.92–1.18; p‐trend = 0.95) (Jakszyn et al., 2012).
In a cohort study conducted in the UK (N = 23,363) looking at various types of cancer, subgroup results for prostate cancer, showed no significant association with NDMA intake (per 1 SD increase, HR: 1.01; 95% CI: 0.90–1.13) (Loh et al., 2011).
In summary, in two large cohort studies, no association between dietary N‐NAs and prostate cancer was reported.
Breast and ovarian cancer
A cohort study conducted in the UK (N = 23,363) showed no increased risk in various types of cancer with high NDMA intake (Q4, vs. Q1, HR: 1.10; 95% CI: 0.97–1.24). In a subgroup analysis by cancer type, no association was found between NDMA intake and breast cancer (per 1 SD increase, HR: 1.01; 95% CI: 0.84–1.20) or ovarian cancer (per 1 SD increase, HR: 0.96; 95% CI: 0.60–1.53) (Loh et al., 2011).
In summary, in one single cohort study, no association between dietary N‐NAs and breast and ovarian cancer was reported.
Overall, many observational studies examined the possible associations between N‐NA intake and several cancers. Some reported an association with oesophageal, gastric, colorectal, pancreatic, lung, low urinary tract and bladder, brain, oral, nasopharyngeal and liver cancer.
3.1.3.2. Dietary intake of N‐NAs and endpoints other than cancer
No relevant data were found in the literature, except a case–control study that investigated the relationship between birth defects and maternal intake of N‐NAs (Huber et al., 2013) and a case–control study that examined maternal dietary intake and gastroschisis (Torfs et al., 1998). In the study by Huber et al. (2013), cases were mothers (N = 6,544) who gave birth to babies affected by orofacial clefts, limb deficiencies or neural tube defects. Controls were mothers who gave birth to babies without congenital malformations (N = 6,807). After adjusting for maternal daily caloric intake, maternal ethnicity, education, dietary folate intake, high fat diet (> 30% of calories from fat) and state of residence, N‐NA intake was not associated with birth defects (anencephaly, Q4 vs. Q1, OR: 1.06; 95% CI: 0.70–1.60; spina bifida Q4 vs. Q1, OR: 0.91 95% CI: 0.69–1.21‐; Q4 vs Q1, encephalocele, OR: 1.13, 95% CI: 0.60–2.11; cleft lip, with or without cleft palate, Q4 vs. Q1, OR: 0.87, 95% CI: 0.73–1.04). Torfs et al. (1998) conducted a case–control study (55 cases; 182 controls) on gastroschisis (a congenital defect of the abdominal wall) and maternal nutrient intake during the trimester before conception. Cases were infants with a gastroschisis identified by the California Birth Defects Monitoring Program. Controls were infants randomly selected from birth records of the California Department of Vital Statistics from the same countries who were born without birth defects. Two control mothers were age‐matched within a year to each case mother. A food frequency questionnaire (N = 100 food items) was used to assess their diet. After controlling for family income, mother's education level, ethnicity, exposure to solvents, smoking, alcohol, recreational drug use and aspirin and/or ibuprofen, high intake of N‐NAs was associated with an increased risk of gastroschisis (OR: 2.6, 95% CI: 1.3–5.4).
In summary, one case–control study reported an association between N‐NA intake and gastroschisis (Table 10, 11, 12–13).
Table 10.
Epidemiological studies on N‐NAs and digestive system cancers: cohort studies
| Study | Exposure levels μg/day | Population (n) | Cases (n) | Age years | Country | Follow‐up years | Confounding factors | HR(95% CI) | Quality score* |
|---|---|---|---|---|---|---|---|---|---|
| Knekt et al. (1999) | NDMA (Q4 vs. Q1) | 5,274 men | 68 stomach | 15–99 | Finland | 24 | Age, sex, municipality, smoking, energy intake | 0.75 (0.37–1.51) | 7 |
| (no values) | 4,711 women | 73 colorectum | 2.12 (1.04–4.33) | ||||||
| Nöthlings et al. (2005) | N‐NAs | 190,545 | 482 | 45–75 | USA | 7 | Age, sex, ethnicity, time on study, diabetes, smoking, energy intake, family history of pancreatic cancer | 1.26 (1.01–1.56) | 7 |
| Q5 vs. Q1 | multiethnic | Exocrine pancreatic | |||||||
| (no values) | tumour | ||||||||
| Jakszyn et al. (2006) | NDMA (per 1 μg/day | 153,447 men | 314 | 35–70 | 10 European | 6.6 | Age, sex, BMI, education, alcohol, smoking, physical activity, energy intake, fruits and nitrites | 1.00 (0.70–1.43) | 6 |
| increase | 368,010 women | Adenocarcinoma | countries | ||||||
| Gastric cancer | |||||||||
| Larsson et al. (2006) | NDMA | 61,433 women | 156 | 58–92 | Sweden | 18 | Age, education, BMI, energy, alcohol, fruits, vegetables | 1.96 (1.08–3.58)** | 8 |
| Q5(≥ 0.194) vs.Q1(< 0.041) | Stomach | ||||||||
| Loh et al. (2011) | NDMA | 10,783 men | 137 rectum | 40–79 | UK | 11.4 | Age, sex, education, smoking, alcohol, energy intake, physical activity, BMI, menopausal status for women | 1.46 (1.16–1.84) | 7 |
| per 1 standard | 12,580 women | 276 colon | 0.99 (0.83–1.18) | ||||||
| deviation increase | 64 stomach | 1.13 (0.81–1.57) | |||||||
| 55 oesophageal | 1.13 (0.77–1.68) | ||||||||
| 532 GI | 1.13 (1.0–1.28) | ||||||||
|
Keszei et al. (2013) |
NDMA | 58,279 men | 166 | 55–69 | Netherlands | 16.3 | Age, smoking, BMI, education, energy intake, fruits, vegetables | Men, 0.94 (0.59–1.49) | 8 |
| T3 (0.25) vs.*** | 62,573 women | Gastric cardia cancer | Women, 1.02 (0.33–3.14) | ||||||
| T1 (0.04) | 497 | Men, 1.31 (0.95–1.81) | |||||||
| Gastric non‐cardia cancer | Women, 0.90 (0.58–1.42) | ||||||||
| per 0.1 increase | Men, 1.06 (1.01–1.10)** | ||||||||
| T3 vs. T1 | 110 | Men, 2.43 (1.13–5.23)** | |||||||
| Oesophageal squamous cell | Women, 1.21 (0.56–2.62) | ||||||||
| Carcinoma | Combined 1.76 (1.07–2.90)** | ||||||||
| per 0.1 increase | Men, 1.15 (1.05–1.25) | ||||||||
| per 0.1 increase | Women, 1.34 (1.04–1.71) | ||||||||
| T3 vs. T1 | 151 Oesophageal | Men, 0.87 (0.52–1.45) | |||||||
| Adenocarcinoma | Women, 0.92 (0.40–2.14) |
Newcastle–Ottawa scale for quality assessment (nine stars reflect the highest quality); **: p‐trend; ***: values for men.
Table 11.
Epidemiological studies on nitrosamines and digestive system cancers: case–control studies
| Study | Exposure (μg/day) | Cases (n) | Controls (n) | Age years | Country | Confounders | OR (95% CI) | Qualityscore* | |
|---|---|---|---|---|---|---|---|---|---|
| Risch et al. (1985) | NDMA | 246 | 246 | 35–79 | Canada | Total food intake, ethnicity | 0.94 (0.14–6.13) | 4 | |
| 10 | Stomach | Community | |||||||
| Gonzalez et al. (1994) | nitrosamines | 354 | 354 | 31–88 | Spain | Energy intake | 2.09** | 6 | |
| Q4, > 0.23 ng | Adenocarcinoma gastric | Hospital | |||||||
| Q1, < 0.11 ng | |||||||||
| Low vitamin C | 1.98 (1.28–3.08) | ||||||||
| Rogers et al. (1995) | NDMA | 125 | 458 | 20–74 | USA | Age, sex, education, alcohol, smoking, BMI, energy intake | 1.86 (0.87–3.95) | 7 | |
| T3 (> 0.179 ) | Oesophageal | Community | |||||||
| vs. T1 (< 0.06 ) | |||||||||
| Pobel et al. (1995) | NDMA | 92 | 128 | 66.6 | France | Age, sex, occupation, energy intake | 7.0 (1.85–26.46)** | 4 | |
| T3 (0.29) | Adenocarcinoma gastric | 2 centres | 66.5 | ||||||
| T1 (0.19) | |||||||||
| La Vecchia et al. (1995) | NDMA | 746 | 2,053 | 19–74 | Italy | Age, sex, education, family history, food score index, intake of β‐carotene, vitamin C, nitrates, nitrites and total calories | 1.4 (1.1–1.7)** | 6 | |
| T3 (≥ 0.191) | gastric | hospital | |||||||
| T1 (≤ 0.130) | |||||||||
| De Stefani et al. (1998) | NDMA | 340 | 698 | 25–84 | Uruguay | Age, sex, residence, smoking, urban/rural, mate consumption | 3.6 (2.38–5.5) | 7 | |
| Q4(≥ 0.27) vs. | gastric | hospital | |||||||
| Q1(≤ 0.14) | |||||||||
| Palli et al. (2001) | NDMA | 382 | 561 | ||||||
| T3 (0.33) vs | gastric | community | ≤ 79 | Italy | Age, sex, social class, family history, cancer, residence, BMI, energy intake | 1.1 (0.8–1.5) | 6 | ||
| T1 (0.12) | |||||||||
| DMA | |||||||||
| T3 (0.73) vs. | 0.9 (0.7–1.3) | ||||||||
| T1 (0.22) | |||||||||
| Zhu (2014) | NDMA | 1760 | 2,481 | 20–74 | Canada | Age, sex, energy intake, BMI, alcohol, smoking, physical activity, non‐steroidal anti‐inflammatory drugs, education, dietary supplements | 1.42 (1.03–1.96)** | 7 | |
| Q5 (2.29) vs. Q1 (0.03) | Adenocarcinoma | community | |||||||
| Colorectal | |||||||||
| Zheng et al. (2019) | NDMA*** | 957 | 938 | 61.9 | USA | Age, sex, race, education, BMI, alcohol, History of diabetes, smoking, family history of pancreatic cancer | 1.03 (0.78–1.37) 6 | ||
| Q4 (0.99) vs. Q1 (0.28) | Pancreatic ductal | hospital | 60.2 | ||||||
| NDMA (plant sources) | adenocarcinoma | 1.93 (1.42–2.61)** | |||||||
| Q4 (0.12) vs. Q1 (0.04) | |||||||||
| NDMA (animal sources) | 1.17 (0.89–1.54) | ||||||||
| Q4 (0.74) vs. Q1 (0.18) | |||||||||
| NDEA*** | 2.28 (1.71–3.04)** | ||||||||
| Q4 (0.12) | |||||||||
| NDBA | 0.64 (0.48–0.85) | ||||||||
| Q4 (4.54) vs. Q1 (0.80) | |||||||||
| NPYR | 0.79 (0.60–1.05) | ||||||||
| Q4 (0.25) vs. Q1 (0.09) | |||||||||
| Zheng et al. (2021) | NDMA *** | 827 | 1,013 | all age groups | USA | Age, sex, race, education, BMI, alcohol, smoking diabetes, HCV, HBV, total calories | 0.80 (0.53–1.21) 6 | ||
| Q4 (1.20) vs. Q1 (0.28) | Hepatocellular | ||||||||
| NDMA (plant sources) | Carcinoma | 1.54 (1.01–2.34) | |||||||
| NDMA (animal sources) | 1.26 (0.83–2.41) | ||||||||
| NDEA Q4(0.12) vs. Q1 (0.04) | 1.10 (0.72–1.69) | ||||||||
| NDEA (plant sources) | 1.58 (1.03–2.41) | ||||||||
| NDEA (animal sources) | 0.92 (0.60–1.41) | ||||||||
| NDBA Q4 (4.57) vs. Q1 (0.75) + | 0.39 (0.25–0.61)** | ||||||||
| NDPA Q4 (0.32) vs. Q1 (0.04) + | 0.88 (0.56–1.39) | ||||||||
| NMAMBA | 1.24 (0.81–1.87) | ||||||||
| Q4 (0.024) vs. Q1 (0.006) | |||||||||
| NMAMBA (plant sources) | 1.54 (1.01–2.35) | ||||||||
| NMAMBA (animal sources) | 0.83 (0.53–1.28) | ||||||||
| NPYR Q4 (0.25) vs. Q5 (0.09) | 0.89 (0.58–1.37) | ||||||||
| NPYR (plant sources) | 0.75 (0.49–1.16) | ||||||||
| NPYR (animal sources) | 1.04 (0.68–1.59) | ||||||||
| NPIP Q4 (0.02) vs. Q1 (0.005) + | 2.52 (1.62–3.94)** | ||||||||
*: Newcastle–Ottawa scale for quality assessment (nine stars reflect the highest quality); **: p‐trend; ***: per 1,000 kcal/day.
Table 12.
Epidemiological studies on N‐NAs and other cancer: cohort studies
| Study (type) | Exposure levels μg/day | Population (n) | Cases (n) | Age years | Country | Follow‐up years | Confounders | HR (95% CI) | Quality score* |
|---|---|---|---|---|---|---|---|---|---|
| Knekt et al. (1999) | NDMA (Q4vsQ1) | 5,274 men | 48 | 15–99 | Finland | 24 | Age, sex, municipality, smoking, energy intake | 1.37 (0.50–3.74) | 7 |
| (no values) | 4,711 women | Head and neck | |||||||
| Michaud et al. (2009) | NDMA (Q5 vs. Q1) | 47,897 men | 335 | 25–75 | USA | 14–24# | Age, calorie intake, calendar year | 0.88 (0.57–1.36) | 7 |
| NPYR (T3 vs. T1) | 182,758 women | glioma | 0.81 (0.62–1.05) | ||||||
| different values*** | |||||||||
| for each cohort | |||||||||
| Jakszyn et al. (2011) | NDMA | 481,419 | 1,001 | 35–70 | 10 European | 8.7 | Education, BMI, smoking, total energy intake | 1.12 (0.88–1.44) | 7 |
| Q4 (≥ 0.19) vs. | bladder | countries | |||||||
| vs. Q1 (0.05) | |||||||||
| Jakszyn et al. (2012) | NDMA | 139,005 men | 4,606 | 35–70 | 10 European | 11 | Education, marital status, BMI, smoking, protein from dairy, total energy intake | 1.04 (0.92–1.18) | 7 |
| Q1 (0.045) vs | prostate | countries | |||||||
| Q5 (0.87) | |||||||||
|
Loh et al. (2011) |
NDMA | 10,783 men | 3,268 | 40–79 | UK | 11.4 | Age, sex, education, smoking, alcohol, energy intake, physical activity, BMI, menopausal status in women | 1.10 (0.97–1.24) | 7 |
| Q4 (0.126) | 12,580 women | total cancers | Men, 1.18 (1.00–1.40) | ||||||
| vs. Q1 (0.017) | Women, 1.05 (0.86–1.29) | ||||||||
| per SD | Age, sex, education, smoking, alcohol, energy intake, physical activity, BMI, menopausal status in women, vitamin C | 1.06 (1.01–1.12) | |||||||
| Men, 1.09 (1.03–1.16) | |||||||||
| Women, 1.05 (0.96–1.16) | |||||||||
| per SD | 423 Breast | Age, sex, education, smoking, alcohol, energy intake, physical activity, BMI, menopausal status in women | 1.01 (0.84–1.20) | ||||||
| 461 Prostate | 1.01 (0.90–1.13) | ||||||||
| 235 Lung | 1.05 (0.88–1.24) | ||||||||
| 80 Ovarian | 0.96 (0.60–1.53) | ||||||||
| Others § | 1.11 (1.03–1.19) |
*: Newcastle–Ottawa scale for quality assessment (nine stars reflect the highest quality); **: p‐trend; ***: NDMA, Q5 (0.09/0.08), NPYR, T3 (0.03/0.02); #: 3 cohort studies; §: melanoma, bladder, corpus uteri.
Table 13.
Epidemiological studies on N‐NAs and other cancer: case control studies
| Study | Exposure (μg/day) | Cases (n) | Controls (n) | Age years | Country | Confounders | OR (95% CI) | Quality score* |
|---|---|---|---|---|---|---|---|---|
| Goodman et al. (1992) | NDMA | 226 men | 597 | 30–84 | Hawaii | Age, ethnicity, smoking and beta‐carotene | 3.3 (1.7–6.2)** | 7 |
| Q4 (0.70) vs. | 100 women | 268 | USA | 2.7 (1.0–6.9)** | ||||
| Q1 (0.07) | lung cancer | |||||||
|
De Stefani et al. (1996) |
NDMA | 320 | 320 | 30–89 | Uruguay | Age, sex, residence, family history of lung cancer, BMI, smoking and energy intake | 3.14 (1.86–5.29)** | 7 |
| Q4 (≥ 0.27) | lung cancer | hospital | ||||||
| Q1 (≤ 0.13) | ||||||||
|
De Stefani et al. (2009) |
Nitrosamines | 866 | 1,346 | 30–89 | Uruguay | Age, residence, family history, BMI, smoking, energy intake, vegetables, fruits, non‐meat fatty foods, reduced glutathione | 1.89 (1.30–2.73)** | 8 |
| Q4 (> 12.2 ) | lung cancer | hospital | ||||||
| Q1 (≤ 5.4) | males | males | ||||||
| ng/100 g | ||||||||
|
Wilkens et al. (1996) |
Nitrosamines | 195 men | 390 men | 30–93 | Hawaii | Age, smoking, employment in a high‐risk occupation, dark green vegetables in men model, and vitamin C intake in the women model. | 3.0 (1.4–6.4)*** | 8 |
| T3 vs. T1 | ||||||||
| (no values) | 66 women | 132 women | USA | 1.9 (0.6–5.8) | ||||
| Lower urinary | Community | |||||||
| Tract cancer | ||||||||
|
Catsburg et al. (2014) |
Nitrosamines | 1,307 men | 1,237 men | 25‐64 | USA | BMI, smoking, ethnicity, education, history of diabetes, vegetable intake, vitamin A, vitamin C, carotenoid, total serving of food per day | 1.03 (0.78–1.36) | 8 |
| Q5 (≥ 54.5) vs. | 353 women | 349 women | ||||||
| Q1 ( ≤ 14.6) | bladder cancer | community | ||||||
| never smokers | 1.52 (0.86–2.66) | |||||||
| smokers | 0.96 (0.69–1.33) | |||||||
|
Boeing et al. (1993) |
NDMA | 115 glioma | 418 | 25–75 | Germany | Age, sex, smoking, alcohol intake | 2.8 (1.5–5.3)** | 6 |
| NPYR | Community | 3.4 (1.8–6.4)** | ||||||
| NPIP | 2.7 (1.4–5.2)** | |||||||
| NDMA | 81 meningioma | 1.4 (0.7–2.6) | ||||||
| NPYR | 1.8 (0.7–0.33) | |||||||
| NPIP | 2.0 (1.0–3.8) | |||||||
| T3 vs. T1 (no values) | ||||||||
| Bunin et al. (1994) | Nitrosamines | 115 astrocytic glioma | 155 community | 6 years or less | USA, Canada | income level | 0.8 (0.4–1.6) | 3 |
|
Giles et al. (1994) |
NDMA | 416 glioma | 409 community | 20–79 | Australia | Alcohol, smoking | 6 | |
| T3 vs. T1 (no values) | 243 males | 243 males | 1.78 (1.12–2.84) | |||||
| 166 females | 166 females | 1.45 (0.78–2.68) | ||||||
|
Rogers et al. (1995) |
NDMA | 169 laryngeal | 458 community | 20–74 | USA | Age, sex, education, alcohol, smoking, BMI, energy | 1.70 (0.91–3.18) | 7 |
| T3 (> 0.179) vs. T1 (< 0.06) | 351 oral | 1.82 (1.10–3.0) | ||||||
|
Ward et al. (2000) |
Nitrosamines | 375 nasopharyngeal | 327 community | < 75 years | Taiwan | Age, gender, ethnicity, vegetables intake | 5 | |
| Q4 vs. Q1 | ||||||||
| Age 3 | 2.6 (1.0–7.0) | |||||||
| Weaning | 3.9(1.4–10.4) |
*: Newcastle–Ottawa scale for quality assessment (nine stars reflect the highest quality); **: p‐trend; OR only for Japanese ancestry.
3.1.3.3. Intake of N‐NAs via drug contamination and cancer
During the last decade, N‐NAs were detected as impurities in various pharmaceuticals. Putative sources are side reactions from drug syntheses, the breakdown of unstable drug compounds and/or contamination from recycled solvents used in manufacturing. The concentration was generally low with several exceptions (EMA, 2020).
The Panel is aware of epidemiological studies that investigated the association between cancer and NDMA contaminated drugs such as Ranitidine (Adami et al., 2021; Cardwell et al., 2021; Kim et al., 2021; Yoon et al., 2021) and Valsartan (Pottegård et al., 2018; Gomm et al., 2021). The detailed description of these studies is provided in Appendix F.3. These studies are of interest for the present opinion due to the uptake of NDMA via the GI tract and a documentation of the degree of NDMA contamination of the prescribed/used drugs in some of the studies.
Adami et al. (2021) conducted a retrospective cohort study within the Danish Prescription Registry and compared the risk of cancer (oesophageal, stomach, liver, pancreatic cancer) among first users of histamine‐2 receptor blockers (H2RBs). Ranitidine and users of proton pump inhibitors (PPIs) or others H2RBs. No association was observed between use of Ranitidine and cancer types, except for oesophageal adenocarcinoma (Ranitidine vs. others H2RBs, HR: 1.30; 95% CI: 1.01–1.68) (Ranitidine vs. PPIs, HR: 1.27; 95% CI: 1.04–1.56). However, when the analysis was restricted to those with at least 10 prescriptions and 10 years of follow‐up no association was found. Cardwell et al. (2021) conducted a nested case–control study within the Scottish Primary Care Clinical Informatics Unit Research database and an increased risk of bladder cancer was found among Ranitidine users, compared to no users (OR: 1.22;95% CI 1.06–1.40; p‐trend = 0.005). Yoon et al. (2021) conducted a cohort study using the Health Insurance Review and Assessment database in South Korea and found no association between use of ranitidine and overall cancer risk (HR 0.99, 95% CI 0.91–1.07, p = 0.716). Kim et al. (2021) conducted a study, using the Korean database IBM and found an inverse association between ranitidine use and risk of cancers of the oesophagus, stomach, liver, pancreas and colonrectum. Pottegård et al. (2018) conducted a cohort study to investigate the association between the use of contaminated Valsartan products with NDMA and risk of cancer and found no increased risk for overall cancer (HR: 1.09, 95% CI: 0.85–1.41) and cancer subtypes. Gomm et al. (2021), in a large cohort study found no association between exposure to NDMA‐contaminated Valsartan and the overall risk of cancer (HR: 1.01; 95% CI: 0.99–1.03). However, a statistically significant association between exposure to NDMA‐contaminated Valsartan and hepatic cancer (HR 1.16; 95% CI: 1.03; 1.31) was observed.
In summary, the evidence is limited and inconsistent on the association between NDMA contaminated drugs and cancer and the studies conducted so far have many methodological shortcomings (e.g. short follow‐up time, no control for compliance of use and lack of control for important confounding factors such as smoking).
3.1.4. Mode of action
3.1.4.1. The developmental stage and N‐NA‐induced carcinogenesis
NDMA, NDEA, NDPA, NDBA and NPIP showed transplacental carcinogenic effects in the offsprings of treated dams in several rat, mouse and/or hamster strains (for details, see Section 3.1.2.6.1). There are few mechanistic studies on transplacental carcinogenesis by N‐NAs, including studies documenting the transplacental transfer and bioactivation of NDMA and other N‐NAs in tissues of rodent and primate offsprings (for details, see Section 3.1.1). Mohr et al. (1983) described carcinogenesis by NDEA in the F1 generation of Syrian golden hamsters after the compounds had been applied to mothers in the second half of pregnancy. Morphological investigations revealed that the trachea was most affected. Furthermore, the tracheal tissue harboured chromosomal aberrations. The first stages of tumour formation in the trachea were already observed in the prenatal stage (Emura et al., 1980). In an ex vivo culture model, the NDEA‐treated hamster fetal tracheal epithelial developed hyperperplasias, squamous metaplasias or dysplasias (Emura et al., 1980).
Post‐partal exposure may occur via mother milk, as shown by Spielhoff et al. (1974). For details, see Section 3.1.2.6.1. Mohr et al. (1972) treated nursing Syrian hamsters by s.c. applications of NDEA at 5, 10 or 20 mg/kg bw per day from the first to the 30th day post‐delivery. Tumour formation was observed in the respiratory tract in the F1 generation.
Vesselinovitch et al. (1984) studied the impact of post‐natal age on NDEA‐induced carcinogenesis in male and female mice. When treatments started on post‐natal days 1 or 15, significantly more liver tumours (mostly HCC) were found when compared to groups with start of treatment at post‐natal day 47. The authors suggested that the age‐associated susceptibility to DNA‐induced hepatocarcinogenesis may be based on the high‐cell replication rate in post‐natal livers. These assumptions are supported by the fact that partial hepatectomy and the subsequent wave of regenerative DNA synthesis enhanced hepatocarcinogenesis by N‐NAs (Craddock, 1975). Pound and Lawson (1975) described that tumorigenesis in rat livers was enhanced when NDMA was applied 1, 6 or 12 h after partial hepatectomy and was still increased if NDMA was given after an interval of 24–72 h. A two‐third hepatectomy was more efficient than a one‐third hepatectomy.
To conclude, the documented transplacental transfer and bioactivation of N‐NAs in fetal tissues provide a mechanistic explanation for the transplacental carcinogenic effects of NDMA, NDEA, NDPA, NDBA and NPIP in rodents. Furthermore, a high rate of cell replication in the liver of neonatal animals is increasing the susceptibility towards the carcinogenic activity of N‐NAs.
3.1.4.2. Strength, consistency and specificity of the association of the key events and cancer in humans
N‐NAs found in food require metabolic activation by CYP enzymes to exert their toxic and carcinogenic effects, as summarised in Section 3.1.1 on toxicokinetics and DNA adduct formation. As further summarised in that section, human CYP2E1, CYP2A6 and CYP2A13 are the main enzymes involved in metabolic activation of N‐NAs commonly found in food (NDMA, NDEA, NPYR and NPIP). So there is no doubt that this process leading to DNA adduct formation can occur in human tissues in which these CYP enzymes are present. The expression of CYPs in various human tissues has been summarised by Guengerich (2015). CYP2E1 is expressed in liver, lung, oesophagus, small intestine, and brain, CYP2A6 in liver, nasal mucosa, trachea, lung, and oesophagus and CYP2A13 in nasal mucosa, trachea, lung, liver, urinary bladder, bronchi, brain and mammary gland. Consistent with the expression of CYP2E1 in liver, N7‐Me‐Gua and O 6 ‐Me‐Gua, DNA adducts known to be formed upon metabolism of NDMA and other N‐nitrosomethyl compounds, have been identified in the liver of a person who was murdered by an overdose of NDMA (Herron and Shank, 1980). Other studies, summarised in Section 3.1.1, have shown that various human tissues including bronchus, oesophagus, bladder, colon and pancreatic duct can metabolically activate N‐NAs found in food. As noted above, some of these tissues – bronchus, oesophagus and pancreas – are also known to have CYPs that can metabolise N‐NAs, but further studies on extrahepatic tissues are required. In general, the observations described here are consistent with the conclusion that N‐NAs found in food could cause cancer in humans.
Another important aspect is the possible effect of ethanol on N‐NA metabolism and disposition in humans. As outlined in Section 3.1.1.1, several studies demonstrated that in experimental animals, co‐application of N‐NA and ethanol may reduce the hepatic first pass clearance of certain N‐NAs resulting in an increased exposure of extrahepatic tissues (Swann et al., 1984, Anderson et al., 1986, 1995; Chhabra et al., 2000). Few observations point to a similar effect of ethanol in humans, e.g. NDMA was found in blood from individuals consuming meals with alcoholic beverages but not in the absence of alcohol (Swann et al., 1987). Human volunteers received orange juice containing NDMA in the presence or absence of ethanol. In the urine, NDMA concentrations were found only when the juice was co‐administered with ethanol (Spiegelhalder and Preussmann, 1984). This indicates a considerable effect of ethanol on NDMA hepatic first‐pass clearance, consistent with the metabolism of both ethanol and NDMA by CYP2E1. It remains to be studied whether other dietary habits and/or medication may impact on the distribution and metabolism of N‐NA in humans.
3.1.4.3. N‐NA target tissues in different mammalian species
In rodents, the liver is the main target tissue, followed by the upper GI and respiratory tract. Human epidemiological studies relating N‐NAs in food to human cancer report on statistically positive associations between NDMA and NDEA intake and cancer. One large cohort study found a positive and significant association between exposure to a NDMA‐contaminated antihypertensive drug and the risk of hepatic cancer, but this observation requires confirmation by independent studies (Gomm, 2021). This indicates that, epidemiological studies have not consistently identified target tissues that would have been expected based on studies of N‐NA‐treated laboratory animals.
Research is necessary on the presence of the relevant CYP enzymes in human tissues. As an example, comparative in vitro studies show a wide variation among species in their capacity to metabolise NDMA in the same organ. Thus, formation of N7‐alkylguanine was more extensive in liver slices from Syrian golden hamsters than – in decreasing order – in rats, humans, monkeys and trout (Montesano and Hall, 1984). In addition, a remarkable species, organ and substrate specificity of mixed‐function oxidases in their capacity to activate N‐NAs has also been reported, e.g. the ability of human colonic epithelial to metabolise NDMA, while the intestine of rodents cannot do it to any significant extent (Harris et al., 1982). Species, organ‐ and cell type differences have also been ascribed to DNA repair enzymes such as O 6 ‐methylguanine‐DNA methyltransferase (MGMT), which transfers the methyl group from O 6 ‐methylguanine in DNA to a cysteine residue on the protein. As an example, MGMT was found to be about 10 times more active in human liver than in rodent liver (Pegg et al., 1982).
There may be additional differences between human and laboratory animal systems that are relevant to these questions but have not yet been elucidated, and some studies in laboratory animals have yielded results that are not fully explained by the mechanisms cited above. As noted in Section 3.1.2.1.1 on metabolism and toxicokinetics, there are some differences in the pharmacokinetics of NDMA in dogs and pigs vs. that in rats and mice which suggest substantial extrahepatic metabolism of this N‐NA in dogs and pigs. The metabolic pathways and reactive intermediates formed from the higher dialkyl‐nitrosamines such as NDPA, and the cyclic N‐NAs such as NPYR are complex and there are no data available on DNA adducts of these N‐NAs in human tissues. Further research is necessary on the metabolic fate and DNA damage in human tissues of N‐NAs found in food.
NDMA metabolism is saturable by high dosages or the co‐exposure to other CYP2E1 substrates (e.g. ethanol, isopropyl alcohol, etc.), as mentioned above in Section 3.1.4.1. Under these conditions, NDMA clearance is greatly reduced and a higher amount of the N‐NA escapes the liver and may be distributed to extrahepatic organs. In a recent development, whole genome sequencing (WGS) has provided valuable information on putative target tissues of N‐NAs. Mutations in liver tumours arising in mice exposed to NDEA by i.p. injection were investigated by WGS (50 neoplasms from 33 individual C3H mice). Mutational signatures were compared between liver tumours from NDEA‐treated and untreated mice and human HCCs (Connor et al., 2018). Carcinogen‐induced neoplasms in mice harbour high numbers of single‐nucleotide variants in comparison to spontaneous neoplasms (mutation rates of 28.4 vs. 9 per megabase (Mb)). The main mutational classes were AT > TA transversions and AT > GC transitions. These base substitutions are consistent with the mutagenic properties of NDEA identified in relatively short‐term bioassays. NDEA‐induced HCC and dysplastic nodules show notably similar mutational profiles which are distinct from the mutational portrait of neoplasms arising spontaneously in untreated mice. A comparison of the NDEA mutational portraits with signatures identified in a typical cohort of human HCC indicate that the first ones are characterised by a remarkable homogeneity while the latter show a large diversity. These data indicate that human liver cancer has much more complex mutational signatures than that identified in mice following exposure to a single N‐NA.
In a second comparative study between NDEA‐induced HCC in C57Bl6 mice and four different human HCC cohorts, it was confirmed that NDEA‐induced HCC were characterised by (a) an excess of AT > TA transversions and (b) a much higher burden of somatic mutations (∼ 27 mutations per megabase) in comparison to human cohorts (2–6 mutations per megabase). In addition, the NDEA mutational signature was unique and had never been observed in human cancer (Dow et al., 2018).
In a study of NDEA‐induced hepatocarcinogenesis in rats that allowed to also capture developing stages of inflammation and cirrhosis, the HCC stage again carried the highest mutation burden (52.3 missense mutations per megabase). The mutational spectra were characterised by GC > AT transitions and AT > TA transversions. The identified mutational signatures were present in several types of human cancer and only two were present in liver cancer (Chen et al., 2020).
Finally, providing indirect evidence stemming from molecular and epidemiological data, a recent whole‐exome19 sequencing study included 900 colorectal cancer (CRC) cases nested within three large U.S.‐wide prospective studies (namely the Nurses' Health Studies (NHS) I and II and the Health Professionals Follow‐up Study; total sample size, more than 230,000 women and 50,000 men) with extensive baseline and repeated lifestyle and FFQ‐based dietary information, long follow‐up and limited attrition (Gurjao et al., 2021). Comparison with the Catalogue of Somatic Mutations in Cancer (COSMIC) Single Base Substitution (SBS) signatures database20 indicated the highest similarity with four known mutational processes, namely POLE deficiency (SBS10), ageing (SBS1), deficient mismatch repair (SBS15, SBS26) and exposure to alkylating agents (SBS11). The aetiology of the alkylation‐like signature was further addressed by analysing the methylation status of the MGMT promoter in a CRC subset; methylated MGMT promoters was overrepresented in the tumours bearing the SBS11 alkylation signature. Moreover, colorectal cancers enriched with the alkylating signature (compared to other tumours) exhibited KRAS p.G12D, KRAS p.G13D or PIK3CA p.E545K‐mutant colorectal tissue. Prognosis‐wise, patients whose tumours have high alkylation damage had a worse colorectal cancer–specific survival. It is notable that the SBS11 signature had been previously indirectly placed to normal colonic crypts contributing to the landscape of the somatic evolution of the human colonic tissue from health to cancer; a sporadic signature (named SBSC) was found among the signatures of multiple mutational processes in morphologically normal tissue and matched closely to SBS23, which resembles SBS11 (Lee‐Six et al., 2019). These findings support the conclusion that DNA alkylation, in particular of O6‐alkylguanine, is involved in the development and progression of CRC. Moving to a connection with dietary intake, the SBS11 signature was the only signature found to be associated with statistical significance with high intakes of processed (according to IARC a carcinogen for humans; Group1) or unprocessed red meat, but not with other dietary variables and lifestyle factors (body mass index, alcohol consumption, smoking and physical activity). Finally, seeking to establish a link between the alkylating signature and dietary NOCs, SBS11 was originally discovered in patients with prior exposure to temozolomide, an alkylating anti‐cancer agent which induces the same distribution of alkylated bases in DNA as the simpler dietary N‐NAs and in the same proportions.
3.1.4.4. N‐nitrosamines and epigenetic modification contributing to carcinogenesis
In cancer and cancer prestages, silencing of tumour suppressor genes has been reported to occur through methylation of cytosines at CpG sites in the promoter region of the respective gene. In addition, DNA methylation is frequently associated with modifications of repressive histone marks, including methylation of histones H3K9 and H3K27 and deacetylation of lysine residues. Epigenetic inactivation was found to affect frequently DNA repair enzymes such as hMLH1, BRCA1, FANCF or MGMT (Toyota and Suzuki, 2010).
In case of silenced MGMT, unrepaired O6‐MeG adducts may have dramatic biological consequences, such as cytotoxicity, G:C to A:T transition mutations, clastogenicity and carcinogencitiy. These consequences have been documented in experimental rodent models with inactivated MGMT showing enhanced sensitivity towards the carcinogenic activity of alkylating agents, like N‐nitroso‐N‐methylurea (Fahrer and Kaina, 2013).
In humans, silencing of MGMT has been found in many different cancer entities, such as colon, lung, oesophageal and liver cancer and also in tumour prestages of colon, lung and liver, e.g. colorectal cancer and the precursor lesions often show a coincidence of epigenetically silenced MGMT and of G:C to A:T transition mutations in the KRAS oncogene (Fahrer and Kaina, 2013). Therefore, it appears likely that the silencing of MGMT may be an early event in carcinogenesis leading to an increased frequency of mutations and overall elevated genomic instability. In case of exposure with an alkylating N‐NAs, this epigenetic alteration will most probably enhance N‐NA induced formation and progression of cancer.
Some studies investigated whether alkylating agents per se may induce or extend epigenetic modifications of important tumour suppressor genes. In N‐nitrosobis(2‐hydroxypropyl)amine‐induced adenocarcinomas of the rat lung, several tumour suppressor genes were found to be inactivated by aberrant promoter hypermethylation, such as CDKN2A, CDH1, TSLC1, DAL1 and RASSF1A (Tsujiuchi et al., 2014). Liu et al. (2010) studied epigenetic alterations of DAPK1, FHIT, RASSF1A and SOCS3 in lung tumorigenesis, induced by a combination of 3‐methylcholanthrene and NDEA. All four genes were unaltered in normal or hyperplastic tissue but became increasingly methylated the further the lesions had progressed from squamous metaplasia to dysplasia, carcinoma in situ and finally to the stage of an infiltrating carcinoma.
Wang et al. (2023) studied the impact of N‐NAs on alternative splicing of fibroblast growth factor receptor 2 (FGFR2) to the FGFR2IIIc variant which activates epithelial–mesenchymal transition via PI3K‐AKT pathways. The alternative splicing is regulated by the LncRNA UCA1. In oesophageal squamous carcinoma from areas with elevated urinary NDEA concentration, UCA1 expression was significantly decreased. Downregulated UCA1 was associated with the malignant transformation of Het‐1A cells and precancerous lesions of the rat oesophagus, both induced by NMBzA. The authors deduced that N‐NAs may downregulate UCA1, targeting the FGFR2/PI3k‐AKT axis and driving the progression of oesophageal carcinoma.
Bhattacharya et al. (2016) studied the histone H2A and reported that the mono‐ubiquitination of this histone and cellular transformation were inversely related in NDEA‐induced hepatocellular carcinoma of male Sprague‐Dawley rats. The decrease in mono‐ubiquitinated histone H2A may be due to an altered activity of the deubiquitinase Usp21.
Overall, there is evidence that epigenetic modifications occur early in N‐NA‐induced carcinogenesis. However, it remains unclear whether N‐NAs are causally involved in the formation of these epigenetic alterations or rather in the selection for tumour cells with silenced MGMT and other tumour suppressor genes.
3.1.4.5. The mutagenic and carcinogenic potency of N‐NAs
There have been several attempts to rank the carcinogenic potency of N‐NAs according to their genotoxicity/mutagenicity. To exert genotoxic potential, the key step is metabolic activation by α‐hydroxylation and the subsequent formation of highly reactive diazonium ions, which form DNA‐adducts. The details are given in Section 3.1.1. There is consensus that a lower number of α‐hydrogens, substitution of the α‐hydrogen, branched, bulky or un‐metabolisable groups at or near the α‐carbon may reduce or eliminate reactivity with DNA. The structure and the stability of the specific diazonium ion (methyldiazonium, ethyldiazonium, etc.) and the resulting DNA adduct depend on the chemical structure of the individual N‐NA. The relative alkylation rates of DNA are highest for the methyldiazonium ion, followed by the ethyl‐ and propyldiazonium ions (Manso et al., 2008). The different adducts are repaired by various cellular repair mechanisms exhibiting differing capacities and velocities as well accuracy. As a result, many studies report that acyclic N‐NAs with dimethyl‐ and diethyl‐groups are more genotoxic and mutagenic than N‐NAs with longer chains and cyclic N‐NAs (Preussmann and Stewart, 1984). To give one example, in an in vitro study on comparative mutagenicity of various N‐NAs in V79 cells, the microsome‐mediated mutagenic potency of N‐NAs of different chain lengths, such as methyl, ethyl and n‐propyl, was found to be inversely related to the number of carbons in the aliphatic chain. The mutagenicity of the heterocyclic NMOR, NPYR and NPIP was clearly lower than those with short aliphatic chains (Kuroki et al., 1977).
The study of the vast database of carcinogenic effects of N‐NAs has pointed to evidence fundamentally similar to that provided by the study of mutagenic effects. It confirms that the presence of an α‐hydrogen is critical for bioactivation and carcinogenesis of N‐NAs. Most non‐carcinogenic or weakly carcinogenic N‐NAs either have sterically or electronically hindering substituents at, or in the vicinity, of the α‐carbon, or have highly hydrophilic substituents.
The genotoxic/mutagenic potency does not always reflect the carcinogenic potency of N‐NAs. For example, the extent of induced DNA strand breaks, as measured by alkaline elution, was investigated in the liver of rats orally exposed to increasing doses of N‐NAs (Brambilla et al., 1987). A linear dose dependence was observed for all tested N‐NAs. The authors reported that the DNA damaging potency for eight N‐NAs followed the order: NDMA NMEA, NDEA > NMOR, NDBA > NDPA, NPYR and NPIP. For these N‐NAs, there was, however, a relatively poor correlation between their liver DNA‐damaging ability and their hepatocarcinogenic potency. A significant increase in DNA breaks, as measured by a different test, i.e. the comet assays, was also reported in the liver of i.p. treated mice (Tsuda et al., 2000). Although the DNA damaging potency followed a slightly different order (NDMA, NMEA, NDEA > NMOR=NPIP > NDBA, NDPA > NPYR), the same ranking was observed for the first N‐NAs (NDMA, NMEA, NDEA, NMOR).
Looking more closely at the mutagenic and hepatocarcinogenic activity of several N‐NAs, the BMDL10 of NDMA and NDEA, range between 0.010 and 0.035 mg/kg bw per day (see Section 3.1.7). These two N‐NAs form very similar DNA adducts including N7‐Me‐Gua, O 6 ‐Me‐Gua, N7‐EtGua and O 6 ‐EtGua. The consequences of these DNA adducts have been extensively documented both in vitro and in vivo. O 6 ‐Me‐Gua and O 6 ‐EtGua have well‐characterised miscoding properties, which can be reversed by the MGMT repair protein. NMOR, however, is significantly less mutagenic than NDMA, NMEA and NDEA although its BMDL10 of 0.014 mg/kg bw per day lies in the same range as that of NDMA and NDEA. The mechanisms of metabolic activation and DNA adduct formation by NMOR are incompletely characterised. Only one NMOR DNA adduct is known. It is identical to that formed from glyoxal, with a very different kind of chemistry (and presumably also different biology) to that of NDMA and NDEA. To date, this NMOR‐DNA adduct has not been identified in tissues of rats treated with NMOR. Although there is no doubt about the carcinogenic potency of NMOR, the mechanistic aspects are far less clear. In this, it resembles other cyclic N‐NAs.
Several scientific approaches were taken to group or rank N‐NAs according to their tumorigenic potency. One possibility is the use of harmonic means of the TD50 using the TD50 values of the most sensitive tumour target of each positive study. Peto et al. (1984) used actuarially adjusted life table tumour data to compensate reduced survival at high toxic doses and to prevent underestimation of the real tumour incidence. For further details, see Sections 3.1.2.4.1. Gold et al. (1991) comprised the data in CPDB containing TD50 values for > 100 N‐NAs. Based on the TD50, the potency in the CPDB is ranked as follows: NDEA (0.0265) > NMEA (0.0503) > NDMA (0.0959) > NMOR (0.109) > NMA (0.142) > NDPA (0.186) > NDBA (0.691) > NPYR (0.799) > NPIP (1.1; please note that there is a mistake in the database and the value has been recalculated).
The TD50 may provide a reliable reference value where the studies are well documented and comprise at least three dose groups including a low‐dose group and a sufficient number of animals per dose and sex. However, most of the N‐NA studies (e.g. studies on NDPA and NDBA) in the CPDB address only one or two dose groups.
To partly address these problems, the Lhasa carcinogenicity database (LCDB)21 derives TD50 values from CPDB by applying additional criteria, such as exclusion of data sets with a single dose group, no dose–response or non‐linear dose–response curves and/or TD50 values of > 1.000 g/kg bw per day. Furthermore, a method which was independent of life table tumour data was applied (Thresher et al., 2019). Nevertheless, the correlation between CPDB and LCDB TD50 values is high (Thresher et al., 2020). According to the LCDB, the ranking of the TD50 of the carcinogenic N‐NAs is as follows (given in mg per kg bw and day): NDEA (0.0177) > NMA (0.106) > NMOR (0.135) > NDMA (0.177) > NPIP (1.12) > NPYR (2.02) > NHPYR (7.65) > NDPheA (167).
Based on experimental data, cancer slope factors (CSFs) are calculated as parameters for quantitative risk assessment of carcinogenic chemical compounds. CSFs provide a measure of the cancer risk of lifetime exposure and are expressed in units of proportion of a population affected per mg of a substance per kg body weight and day. The greater the slope factor, the greater is the risk for cancer. According to the last update (October 2020) of the California Office of Environmental Health Hazard Assessment (OEHHA) Toxicity Criteria Database,22 the current ranking of CSFs is as follows: NDEA > NMEA > NDMA > NDBA > NPIP > NDPA > NMOR > NPYR > NDPheA.
In summary, attempts to group N‐NAs according to their mutagenic and/or tumorigenic potencies provided partly differing results. Nevertheless, there is convincing evidence regarding the high mutagenic and tumorigenic potencies of NDEA, NDMA and NMEA and probably also NMOR.
3.1.5. Identification of critical effects
3.1.5.1. Acute effects
With regard to human intoxications, two fatal cases of suspected NDMA poisoning are documented. However, information on the dose and the mode and duration of uptake is lacking. Based on the extent of hepatic DNA adducts in one of the victims, it was estimated that the dose was probably greater than 20 mg/kg bw (Herron and Shank, 1980). In humans, there are no further reports on acute N‐NAs intoxications with documentation or estimation of the dose.
Acute toxicity studies were conducted for NDMA, NMEA, NDEA, NDPA, NDBA, NMA, NSAR, NMOR, NPIP, NPYR and NPRO in several rodent species. The lowest LD50 values of acyclic N‐NAs ranged between 17.7 mg/kg bw of NDMA (hamster, s.c. application) and 3,500 mg/kg bw for NSAR (mouse, i.p. application). For the cyclic N‐NAs, the lowest LD50 doses reached from 60 mg/kg bw of NPIP (rat, i.v. application) to > 2,000 mg/kg bw of NDPheA (rat, gavage). For details, see Section 3.1.2.1.
The liver is the main target for the acute effect of most of the acyclic and cyclic N‐NAs, tested so far. The acute symptoms, described in experimental animals, may be due to the metabolic activation of N‐NAs to highly reactive intermediates which may form adducts not only with DNA, but also with RNA (Lee and Lijinsky, 1966), proteins or other macromolecules (Kroeger‐Koepke et al., 1981a,b). This may cause disruption and loss of the integrity of cell membranes, leading to cytotoxicity and cell death in the organs with high activity of the respective CYP isoforms (Preussmann and Stewart, 1984). Accordingly, for NDMA, NDEA and NMOR, the necrosis was predominant in the centrolobular region of the hepatic lobule, at the site with high expression of the CYP isoforms.
Among all N‐NAs tested, the lowest dose required to induce acute adverse effects in experimental animals, was 1.9 mg/kg bw of NDMA, which induced hepatocellular vacuolation and necrosis in rats. This dose is far above the NDMA dose causing cancer in the liver of experimental animals (see also Section 3.1.2.4.1). Likewise, the carcinogenic doses of other N‐NAs are considerably lower than those eliciting acute effects. Therefore, the CONTAM Panel is considering acute toxicity of N‐NAs to be of no relevance for the risk assessment of N‐NAs.
3.1.5.2. Genotoxicity
For most dialkyl and cyclic N‐NAs, the initial and critical step for genotoxicity is an α‐ hydroxylation step catalysed by CYP 2E1 and other CYP isoenzymes. This process generates – via intermediates – highly reactive electrophiles which may form DNA adducts (for details, see Section 3.1.1).
Regarding the acyclic volatile N‐NAs, NDMA, NMEA, NDEA and NDPA lead to gene mutations in bacteria and mammalian cells in vitro and in the liver of transgenic animals. The major mutational class was GC > AT transitions consistent with O6‐alkylguanine being the main pre‐mutagenic adduct induced by these N‐NAs. Micronucleus formation in the liver provided direct evidence for chromosomal damage by all four compounds. In addition to liver damage, all these N‐NAs induced DNA strand breaks in several organs. NDIPA and NMBA were mutagenic in bacteria in the presence of metabolic activation, but in vivo genotoxicity data are lacking. The genotoxicity of NEIPA and NMVA has remained undefined. Both compounds have an α‐hydrogen suitable for hydroxylation, suggesting a genotoxic potential.
In the group of acyclic non‐volatile N‐NAs, NDBA induced mutations in S. Typhimurium and increased levels of DNA breaks in several organs. NDBzA showed micronuclei formation in rat liver and increased hepatic mutation frequencies in lacZ transgenic MutaMouse system. The predominant NDBzA‐induced mutations were mainly GC > TA transversions probably due to unidentified DNA adduct (s). NMA was moderately mutagenic in S. Typhimurium. The DNA adducts responsible for the base substitutions induced by NMA are not yet identified. In vitro studies showed that NMAMBA was mutagenic in bacteria (S. Typhimurium), requiring metabolic activation. The genotoxicity of NDIBA, NEA, NMAMPA and NSAR has remained undefined. NDIBA, NEA, NMAMPA and NSAR harbour α‐hydrogens suitable for hydroxylation, suggesting that the compounds may be genotoxic.
Considering cyclic/aromatic N‐NAs, the following conclusions were drawn: (i) NMOR, NPIP and NPYR were mutagenic in vitro and in vivo and increased levels of DNA strand breaks in several mouse organs, such as stomach, colon, liver, lung, kidney and urinary bladder. The clastogenic potential of NMOR is documented by micronuclei formation in the bone marrow. (ii) NTHZ, NHPYR and NHMTHZ were found to be mutagenic in several S. Typhimurium strains. NTHZ induced positive responses also in a repair deficient rec‐strain of Bacillus subtilis and in a DNA repair assay in primary rat hepatocytes. Genotoxicity studies on NMTHZ were not reported. Based on a structural similarity to NPYR, a genotoxic potential may be assumed for NMTHZ. (iii) Information on the genotoxicity of NPRO and NHPRO is limited to in vitro tests with S. Typhimurium which provided negative results. NPRO and NHPRO show a cyclic structure substituted with a hydrophilic carboxyl moiety probably impairing absorption and enhancing secretion. In metabolic studies, NHPRO and NPRO were found mostly unchanged, indicating a lack of metabolic pathways to generate DNA reactive species. (iv) NTCA was not mutagenic in several strains of S. Typhimurium with or without metabolic activation. No data are available for NMTCA and NHMTCA. NTCA, NMTCA and NHMTCA are all characterised by a cyclic structure substituted with a hydrophilic carboxyl moiety, which may impair absorption and facilitate excretion. No genotoxicity data are available for NOCA, NMOCA and NPIC. Based on chemical similarity with NHPRO, NPRO and existing metabolic and mutagenicity data, it can be assumed that NTCA, NMTCA, NHMTCA, NOCA, NMOCA and NPIC are unlikely to be genotoxic. (v) The genotoxicity of NDPheA was studied to an insufficient extent to draw any conclusions. Details on the genotoxicity of the acyclic and cyclic N‐NAs are given in Section 3.1.2.3.
Overall, the CONTAM Panel concluded that there is (i) evidence for in vitro and in vivo genotoxicity of NDMA, NMEA, NDEA, NDPA, NDBA, NDBzA, NMOR, NPIP and NPYR; (ii) evidence for genotoxicity limited to in vitro studies for NDIPA, NMBA, NMA, NMAMBA, NTHZ, NHPYR and NHMTHZ; (iii) indirect evidence (gained by read‐across and SAR analyses) that NEIPA, NMVA, NDIBA, NEA, NMAMPA, NSAR and NMTHZ may exert genotoxic activity; (iv) experimental and/or indirect evidence (gained by read‐across and SAR analyses) that NPRO, NHPRO, NTCA, NMTCA, NHMTCA, NOCA, NMOCA and NPIC may not exert significant genotoxic activity; and (v) no sufficient information to conclude on the genotoxic potential of NDPheA.
3.1.5.3. Carcinogenicity
Clear experimental evidence for carcinogenicity was obtained for all acyclic volatile N‐NAs (NDMA, NMEA, NDEA, NDPA, NDIPA, NEIPA, NMBA, NMVA) and for several acyclic non‐volatile N‐NAs (NDBA, NDIBA, NMA, NMAMBA, NSAR). The acyclic non‐volatile N‐NAs NEA and NMAMPA were not tested in long‐term carcinogenicity assays. For NDBzA, one long‐term study was reported in 1967 which did not show carcinogenic activity. However, based on structural alerts and/or similarities to other carcinogenic N‐NAs, for all three acyclic non‐volatile N‐NAs carcinogenicity has been predicted. Among the group of cyclic/aromatic N‐NAs, few compounds (NMOR, NPIP, NPYR, NHPYR, NDPheA) were found to be carcinogenic in long‐term animal assays, while NPRO, NHPRO and NPIC did not show any carcinogenic activity in vivo. The remaining cyclic/aromatic N‐NAs (NTHZ, NMHTZ, NHMTHZ, NTCA, NMTCA NHMTCA, NOCA, NMOCA) were not tested in long‐term studies. Based on chemical similarities and existing metabolic and mutagenicity data (Section 3.1.2.5.1), (i) NTHZ, NMHTZ, NHMTHZ are predicted to be carcinogenic and (ii) NTCA, NMTCA, NHMTCA, NOCA, NMOCA may not pose a carcinogenic risk. Therefore, the CONTAM Panel considered the carcinogenic activity for 23 of 32 N‐NAs evaluated in this opinion, i.e. NDMA, NMEA, NDEA, NDPA, NDIPA, NEIPA, NMBA, NMVA, NDBA, NDIBA, NMA, NEA, NMAMPA, NMAMBA, NSAR, NMOR, NPIP, NTHZ, NPYR, NHPYR, NMTHZ, NHMTHZ and NDPheA.
Conflicting data were obtained for NDBzA. One long‐term animal experiment provided no evidence for carcinogenicity, despite positive genotoxicity data.
Liver is the main site of cancer induction in studies on NDMA given orally to rat, mouse, hamster, guinea pig, rabbit, mink, blue fox, duck, rainbow trout, guppy, frog, mastomys and newt (Preussmann and Stewart, 1984). Also, NMEA, NDEA, NMOR, NPIP and NPYR exert carcinogenic effects mainly in the liver, as observed in many different experimental animal species. The mechanistic base is the intrahepatic activation of these N‐NAs to unstable intermediates which produce promutagenic DNA adducts. Furthermore, the detoxification reactions do not compete effectively with metabolic activation in the liver. At high doses, the metabolic capacity of the liver may be overwhelmed leading to tumour formation also in extrahepatic tissues (see also Section 3.1.1). In rodents, the carcinogenic effects of NMBA, NMVA, NMA, NMAMBA and NSAR are evident mainly in the oesophagus and of NDPA, NDIPA, NEIPA, NDBA and NDIBA in many different organs and tissues. The reasons for the predominantly extrahepatic tumour formation by NMBA, NMVA, NMA, NMAMBA and NSAR are unclear.
Human epidemiological studies (for details, see Section 3.1.3) provided no clear associations between dietary NDMA or NDEA intake and cancer in digestive organs or at any other site. Likewise, the evidence for an association between exposure to N‐NAs contaminated drug and hepatic cancer have so far remained inconclusive. Section 3.1.4 discussed whether species‐specific differences in the activities of the relevant CYP enzymes and DNA repair enzymes or other not yet identified mechanisms in N‐NA exposed tissues might account for the divergence in the target tissues.
3.1.5.4. Developmental, reproductive toxicity and transplacental carcinogenicity
There is experimental evidence that NDMA and NDEA cross the placental barrier in hamsters and NDMA also in Erythrocebus monkeys. In the latter species, O 6 ‐Me‐Gua adducts were found in DNA of liver and other organs of the fetus, indicating the capacity for metabolic activation of NDMA in fetal tissues of primates. NDMA, NDEA, NDPA, NDBA and NPIP showed transplacental carcinogenic effects in the offsprings of treated dams in several rat, mouse and/or hamster strains (for details, see Section 3.1.2.6.1). The lowest carcinogenic dose in F1 of each of the N‐NAs tested ranged from 3.4 mg/kg bw per day of NDMA (given to dams by gavage on GD 1‐22) and 100 mg/kg of either NDPA or NPIP (applied to dams as single s.c. application between GD 1 and 21).
In dependence on the experimental design of the developmental toxicity study, NDMA, NDEA, NDPA, NDBA, NMA and NDPheA reduced pre‐ and perinatal survival of offsprings in rat, mouse and/or hamster. Dams were treated mostly on single or several days during gestation. In very few studies, the treatment started before mating and/or was prolonged during lactation. The lowest dose of each of the N‐NAs tested with adverse effects in F1 ranged from 0.015 mg/kg bw per day of NDMA, applied to murine dams via drinking water 75 days before mating until birth, to the single gavage of 200 mg/kg bw of NDEA to pregnant rats (for details, see Section 3.1.2.6).
Malformations were not reported for the N‐NAs tested with the exception of NMA, which induced microphthalmia, exencephaly or syndactyly when dams received 140 mg/kg bw via single i.p. application between GD 1‐20.
With regard to reproductive toxicity, there are few reports that high doses of NDMA and NDEA induce testicular necrosis in rats and rabbits (for details, see Section 3.1.2.6.2). As a result, testosterone levels and numbers of mature spermatozoa were decreased.
To conclude, reports on transplacental carcinogenesis as well as developmental and reproductive toxicity show effects of N‐NAs, tested at high doses in several rodent species. However, the studies often applied one dose only, do not cover several critical phases and are limited in number and quality to conclude on potential risks for human health.
Overall, the CONTAM Panel considers the carcinogenicity of NDMA, NMEA, NDEA, NDPA, NDIPA, NEIPA, NMBA, NMVA, NDBA, NDIBA, NMA, NEA, NMAMPA, NMAMBA, NSAR, NMOR, NPIP, NTHZ, NPYR, NHPYR, NMTHZ, NHMTHZ and NDPheA as the critical endpoint to estimate the possible risks posed to human health by N‐NA intake via food. With the exception of NDPheA, a genotoxic mode of carcinogenic action is assumed for these N‐NAs.
As reported in Section 3.2, 13 N‐NAs were found to occur in food, i.e. NDMA, NMEA, NDEA, NDPA, NDBA, NMA, NSAR, NMOR, NPIP, NPYR, NPRO, NTCA and NMTCA. Ten of these 13 N‐NAs exert carcinogenic activity, i.e. NDMA, NMEA, NDEA, NDPA, NDBA, NMA, NSAR, NMOR, NPIP and NPYR. These 10 carcinogenic N‐NAs (TCNAs) are of relevance for the assessment of risk to human health related to the presence of N‐NAs in food.
3.1.6. Dose–response analysis
As outlined in Section 3.1.5, the 10 carcinogenic N‐NAs occurring in food (TCNAs) are of relevance for the risk assessment, i.e. NDMA, NMEA, NDEA, NDPA, NDBA, NMA, NSAR, NMOR, NPIP and NPYR (TCNAs).
The following studies report on the most sensitive endpoints for the TCNAs and may enable dose–response analyses.
NDMA increased the occurrence of liver tumours at 0.002 or 0.003 mg/kg bw per day in male and female Wistar rats, respectively. The compound was applied via drinking water over lifetime (Brantom, 1983). The liver tumours comprised hepatocellular nodules, adenoma and carcinoma as well as biliary cystadenoma. The study comprises 15 different dose levels between 0.002 and 1.47 mg/kg bw per day and 60 males and females per dose and has been considered suited for dose–response analyses by BMD modelling.
NMEA induced liver tumours, including HCC, when male F344 rats received the compound at 0.2 mg/kg bw per day for 30 weeks (Lijinsky and Reuber, 1980). However, the study comprised no untreated control and only two dose levels. No studies on NMEA, starting with low dose levels and suited for a dose–response analyses, were identified.
In two independent studies, NDEA induced hepatocellular tumours at 0.002–0.007 mg/kg bw per day in female rats (Brantom, 1983; Berger et al., 1987). In Berger et al. (1987), NDEA increased the percentage of male Sprague Dawley rats with tumours in the liver and the GI and urinary tract when exposed for life to the lowest dose of this study, i.e. 0.007 mg/kg bw per day via drinking water. This study applied three dose levels and 80 males per dose group over the lifetime of the animals. The most sensitive endpoint was reported by Brantom (1983), i.e. the occurrence of liver tumours at 0.003 mg/kg bw per day in female Wistar rats, treated via drinking water over lifetime. The histology of the tumours was described as hepatocellular nodules, adenoma and carcinoma, and biliary cystadenoma. The study comprises 15 different dose levels between 0.002 and 1.47 mg/kg bw per day and 60 males and females per dose. Based on these outstanding experimental settings, the study by Brantom (1983) was considered more suited for dose–response analyses by BMD modelling than the study by Berger et al. (1987).
For NDPA, the most sensitive endpoint was the tumour occurrence in different organs in female F344 rats, treated with 0.62 mg/kg bw per day via gavage for 30 weeks (Lijinsky et al., 1983). However, the study included only one dose level, allowing no dose–response analyses. No study, starting with low dose levels and suitable for deriving a dose–response relationship, was identified.
NDBA was tested in one dose study (Lijinsky et al., 1983); at 3.9 mg/kg bw per day, the occurrence of benign and malignant tumours in many organs (urothelium, lung, liver, oesophagus, forestomach, nasal cavity) was increased in male F344 rats, treated for 30 weeks via gavage. No study, starting with low‐dose levels and suited for a dose–response analyses, was identified.
For NMA, the most sensitive endpoint identified was tumour formation in the oesophagus in male and female SD rats treated with 0.3 or 1.4 mg/kg bw per day via s.c. application for 24 weeks (Schmähl, 1976). In a parallel study, NMA was applied at two different dose levels via drinking water which induced keratinised squamous cell carcinoma in the oesophagus. The lowest tumorigenic dosage is not clearly documented but presumably was 0.3 mg/kg bw per day. No study being suitable for a dose–response analyses, was identified for NMA.
In a one dose study with no negative control group included, NSAR caused the formation of CA in the oesophagus of rats, treated with 100 mg/kg bw per day (Druckrey et al., 1967). In a one‐dose study with a negative control group, 375 mg/kg bw per day in the diet induced tumours of the nasal region, lung and small intestine in mice. Analyses of dose–response relationships were not possible.
The most sensitive endpoint for NMOR was reported for female F344 rats developing liver tumours (benign and malignant tumours combined) at 0.003 mg/kg bw per day and HCC at 0.039 mg/kg bw per day (Lijinsky et al., 1988). The study comprises nine doses ranging from 0.003 to 3.571 mg/kg bw per day, applied via drinking water to more than 20 female F344 rats per dose group for up to 100 days. Based on these experimental settings, the study was selected for dose–response analyses by BMD modelling.
In two independent studies, NPIP enhanced the formation of malignant liver tumours at 0.02–0.074 mg/kg bw per day in male and female rats (Peto et al., 1984; Gray et al., 1991; Eisenbrand et al., 1980). In the study of Peto et al. (1984) and Gray et al. (1991), the formation of malignant liver tumours (not specified which liver cell type) in male and female Colworth rats started around 0.074 mg/kg bw per day, showing a clear dose dependency. The lowest dose was 0.009 and the highest 4.6 mg/kg bw per day, applied to six animals per sex and group. Eisenbrand et al. (1980) used four doses (0.02–2.1 mg/kg bw per day) and 17–39 male and female SD rats per group. The malignant liver tumours were specified as HCC. Due to the high number of animals per group, the Eisenbrand et al. (1980), study was considered better suited for BMD analyses than the study of Peto et al. (1984) and Gray et al. (1991).
The most sensitive endpoint for NPYR was the occurrence of hepatocellular adenoma as well as tumours in the GI tract in male SD rats, when treated with 0.1 mg/kg bw per day for the entire lifespan (Berger et al., 1987). The study comprises a negative control, three dose levels from 0.03 to 0.3 mg/kg bw per day and 80 animals per group. In comparison to the other reports on NPYR, the Berger et al. (1987), study was considered adequate for BMD modelling calculations.
To conclude, well‐documented dose–response studies with a negative control group are available for NDMA, NDEA, NMOR, NPIP and NPYR.
3.1.7. Benchmark dose modelling
Data on five carcinogenic N‐NAs, mentioned above, i.e. NDEA, NDMA, NMOR, NPYR and NPIP, occurring in food allow for dose–response modelling of liver tumour incidence (benign and malignant tumours combined) which has been identified as the most critical effect following oral exposure of animals to these N‐NAs (see Section 3.1.6). A BMD analysis was performed using the EFSA web tool, which is based on the R‐package PROAST 70.0. following updated guidance from the EFSA Scientific Committee on BMD modelling (EFSA Scientific Committee, 2017b). A detailed description of the BMD analysis performed by the Panel can be found in Annex B. The default benchmark response (BMR) for quantal data were selected, i.e. an extra risk of 10%. Using model averaging, the resulting lowest BMD, BMDL10,for the liver tumour incidence was for NDEA 10 μg/kg bw per day (Brantom, 1983), NDMA 35 μg/kg bw per day, NMOR 14 μg/kg bw per day, NPYR 127 μg/kg bw per day and NPIP 62 μg/kg bw per day.
For NDEA, the AIC (Akaike information criteria) of the models available (minimum AIC) is more than two units larger than that of the full model. This may indicate a problem in the data, in particular when the difference is much larger than two units (e.g. > 5). Due to the high number and range of doses used in the selected study (Brantom, 1983), high mortality might interfere with the endpoint selected (liver tumour development) at higher doses and individual outlying animals distort the response of one or more treatment groups. This could lead to fluctuations in the responses among treatment groups at higher doses that are larger than expected from random sampling error, resulting in an AIC difference with the full model larger than 2 units. However, since the scatter in responses does not result in a wide BMD CI no further action was considered. The BMD CI with full data set is robust (10–21 μg/kg bw per day) and a reference point of 10 μg/kg bw per day was derived for NDEA. In addition, if the BMDL10 analysis is limited to the lowest five doses from the Brantom (1983), study, the fitting of the model is acceptable and the BMDL10 remains very similar (BMDL10 8.6 μg/kg bw per day). Finally, in accordance with Brantom (1983) study, the dose–response analysis from another study with a lower number of doses (Berger et al., 1987) resulted in acceptable fits and gave a BMDL10 value of 28 μg/kg per day.
3.1.8. Use of BMDL and TD50 data for possible grouping of carcinogenic potency
The CONTAM Panel has also been considering the carcinogenic potency values of N‐NAs quantified by TD50 values, as reported by the CPDB (Gold et al., 1991). The TD50 values indicate the lifetime dose at which tumours would be observed in 50% of animals which would have remained tumour‐free without treatment. The TD50 values are averages calculated by the harmonic mean of the most potent TD50 values taken from target organs in each positive experiment for a specific species. In case of one positive experiment only, the most potent TD50 value from the experiment is reported. If more than one experiment was positive, the TD50 value gives the harmonic mean of the most potent TD50 value from each positive experiment for a selected tumour target site.
BMDL10–BMDU10 and the BMDL50–BMDU50 ranges calculated from the selected, high‐quality rat carcinogenicity studies were contrasted and complemented with the TD50 values present in CPDB. TD50s not available in CPDB were predicted by read across (see Section 3.1.2.5.1). The considered values are summarised in Table 14.
Table 14.
TD50s and BMD values (when available) for carcinogenic N‐NAs occurring in food
| N‐NAs | TD50 mg/kg/day | BMDL10–BMDU10 mg/kg per day any liver tumour | BMDL50–BMDU50 mg/kg per day any liver tumour | Reference for BMD analyses |
|---|---|---|---|---|
| NDMA (Av) | 0.0959 | 0.035–0.063 (f) | 0.110–0.137 (f) | Brantom (1983) |
| NMEA (Av) | 0.0503 | |||
| NDEA (Av) | 0.0265 |
0.0100.021 (f) |
0.036–0.063 (f) |
Brantom (1983) |
| NDPA (Av) | 0.186 | |||
| NDBA (Anv) | 0.691 | |||
| NMA (Anv) | 0.142 | |||
| NSAR (Anv) | 0.982 (a) | |||
| NMOR (Cv) | 0.109 | 0.014–0.038 | 0.076–0.113 | Lijinsky et al. (1988) |
| NPIP (Cv) | 1.11 |
0.062–0.213 |
1.2–5.34 | Eisenbrand et al. (1980) |
| NPYR (Cv) | 0.799 | 0.127–0.264 | 0.361–1.3 | Berger et al. (1987) |
Av: acyclic volatile; Cv: Cyclic volatile; Anv:Acyclic non‐volatile; f: females (if not indicated sex values are averaged for both sexes).
Predicted.
Comparison of TD50 and BMDL10 values pointed to a similar trend in potency, going from smaller, simpler and mostly volatile N‐NAs (more potent) to larger, more complex and mostly non‐volatile ones (less potent).
Despite the variability of the original carcinogenicity data, NDEA, NMEA, NDMA and possibly NMOR are in the group of highest concern by any criterion while the remaining N‐NAs may have somewhat lower carcinogenic potency.
In a conservative approach for the risk characterisation, a carcinogenic potency equal to NDEA, which induces rat liver tumours (benign and malignant) at the lowest BMDL10 value, will be attributed to the remaining nine N‐NAs in Table 14 (see Section 3.4). Additionally, in an alternative approach, the ratio between the lowest BMDL10 of the group with the highest concern (0.010 mg/kg day for NDEA, NMEA, NDMA and NMOR) and the lowest BMDL10 of the remaining N‐NAs (0.062 mg/kg per day for NDPA, NDBA, NMA, NPYR, NPIP, NSAR) was used to estimate a potency factor of 0.2.
3.2. Occurrence data
3.2.1. Occurrence data on food submitted to EFSA
For the dietary exposure assessment of N‐NAs, analytical results on N‐NAs in food were used as stored in the EFSA occurrence database by 3 July 2021. In total, 2,817 analytical results were available, which were provided by the national authorities of four MSs:Czech Republic (n = 1334), Denmark (n = 891), Germany (n = 514) and Hungary (n = 78) between 2003 and 2021. The number of results reported per year and per country are shown in Table C.2 in Annex C. Data availability (number of samples and percentage of left‐censored data), i.e. results below the limit of detection (LOD) or quantification (LOQ) per compound and food category at the level 1 of the Foodex2 classification are detailed in Table 15. The raw occurrence data set on N‐NAs as extracted from the EFSA data warehouse is available at the EFSA Knowledge Junction community in Zenodo.23
Table 15.
Number of analytical results (N) and % of left‐censored (% LC) data per N‐NA compound and per food category at the level 1 of the Foodex2 classification in the EFSA database
| N‐NA | Alcoholic beverages | Coffee, cocoa, tea and infusions | Fish, seafood, amphibians, reptiles and invertebrates | Grains and grain‐based products | Meat and meat products | Seasoning, sauces and condiments | Water and water‐based beverages | Total N | |||||||
|---|---|---|---|---|---|---|---|---|---|---|---|---|---|---|---|
| N | % LC | N | % LC | N | % LC | N | % LC | N | % LC | N | % LC | N | % LC | ||
| NDMA | 405 | 58 | 88 | 19 | 43 | 100 | 9 | 100 | 171 | 91 | 13 | 46 | 79 | 100 | 808 |
| NMEA | 60 | 100 | 43 | 100 | 9 | 100 | 144 | 100 | 256 | ||||||
| NDEA | 73 | 99 | 43 | 98 | 9 | 100 | 171 | 99 | 296 | ||||||
| NDPA | 60 | 100 | 43 | 100 | 9 | 100 | 144 | 87 | 256 | ||||||
| NDBA | 73 | 97 | 43 | 100 | 9 | 100 | 144 | 100 | 269 | ||||||
| NMOR | 73 | 96 | 43 | 100 | 9 | 100 | 45 | 100 | 170 | ||||||
| NPIP | 73 | 100 | 43 | 100 | 9 | 100 | 144 | 78 | 269 | ||||||
| NPYR | 73 | 100 | 43 | 100 | 9 | 100 | 170 | 95 | 295 | ||||||
| NTCA * | 99 | 8 | 99 | ||||||||||||
| NMTCA * | 99 | 53 | 99 | ||||||||||||
| Total | 890 | 88 | 344 | 72 | 1,331 | 13 | 79 | 2,817 | |||||||
Compounds non‐carcinogenic and therefore not included in the final risk assessment.
The high percentage of left‐censored data for several compounds and food categories could be due to the absence of these compounds but be also due to LODs and LOQs that are higher than the concentration in which these substances are present in food and water. To address this uncertainty, left‐censored data were treated using the substitution method as recommended in the ‘Principles and Methods for the Risk Assessment of Chemicals in Food’ (WHO, 1996). This is the same method as indicated in the EFSA scientific report ‘Management of left‐censored data in dietary exposure assessment of chemical substances’ (EFSA, 2010a). The guidance suggests that the lower bound (LB) and upper bound (UB) approach should be used for chemicals likely to be present in the food (e.g. naturally occurring contaminants, nutrients and mycotoxins). The LB is obtained by assigning a value of zero (minimum possible value) to all samples reported as lower than the LOD (< LOD) or LOQ (< LOQ). The UB is obtained by assigning the numerical value of the LOD to values reported as < LOD and of the LOQ to values reported as < LOQ (maximum possible value), depending on whether LOD and/or LOQ are reported by the laboratory. In addition, the middle bound (MB) was obtained by assigning the numerical value of LOD/2 to values reported as < LOD and LOQ/2 to values reported as < LOQ (maximum possible value), depending on whether LOD and/or LOQ are reported by the laboratory.
Based on the analytical results, a mean LB, MB and UB occurrence value was calculated at each level of the FoodEx2 classification. Details on the available occurrence data at the different FoodEx2 classification levels are provided in Table C.3 in Annex C.
3.2.2. Occurrence data on food selected from the literature
A total of 239 scientific papers from between 1976 and 2021 from EU and non‐EU countries, concerning the occurrence of N‐NA compounds in food and water were retrieved using the criteria included in the protocol as well as additional expert searches.
The following criteria were then applied to identify data of a sufficient quality to be considered in the exposure assessment:
Data provided by articles published in peer‐reviewed journals
Products sampled from the market
Data having sufficient information on the food category to be classified within the FoodEx classification
Analytical data with sufficiently low LODs/LOQs and reported for individual N‐NAs
With the above criteria, 41 relevant published articles out of 239 were retrieved and reviewed.
In total, more than 10,000 analytical results were available for 14 N‐NAs from 14 food categories at the level 1 of the FoodEx2 classification and for 62 foods at the level 3 of the FoodEx2 classification. Details on the available literature data are provided in Table C.5 in Annex C.
For the dietary exposure assessment of N‐NAs, relevant analytical results on N‐NAs in food from the literature search reported in Table C.5 of Annex C were selected according to the following additional quality criteria:
Products sampled from 1990 onwards
Data with information on the percentage of left censorship and the total number of samples analysed
Data with defined information about the mean concentration of N‐NAs calculated on all available analytical results (data with results expressed as undefined range/interval i.e. < 0.1, 0.1 < C < 1.0, etc. or mean concentration calculated only on quantified analytical results were not taken into consideration).
Non‐EU data for food products not produced in EU were also considered (e.g. cocoa)
An exception to the criteria 2 and 3 was made for data included in Yurchenko and Mölder 2006 for processed fish as no other data source was available with the exception of NDEA.
The same exception was made for data on cooked unprocessed meat available in Yurchenko and Mölder (2007) to be included in one of the exposure scenarios to take into consideration the effect of cooking on N‐NAs formation.
Concentration data on raw meat and fish in Yurchenko and Mölder (2007 and 2006), 100% LC, were not considered in the calculation of average concentration for cooked meat and fish, as they were considered not representative of the concentrations to which the population is exposed when consuming these foods after cooking. Concentration data in cooked spiced meat from Yurchenko and Mölder (2007) were also excluded as considered not representative of concentration in meat.
Data on vegetable oils from in Yurchenko and Mölder (2006) were excluded due to uncertainty of the presence of N‐NAs in these foods as described in Section 1.3.3.
Data on NDMA, NDPA and NDBA in cheese from Dellisanti et al. (1996) satisfied all the above criteria but were excluded as they were considered not representative of this food category being related to only one specific type of cheese.
In accordance with the above criteria and considerations, a total of 3,976 analytical results were selected for several food categories from EU countries between 1990 and 2021 for 13 N‐NA compounds. No data were available for NEA after applying the above selection criteria.
Data (number of samples and % of left‐censored data) made available for their possible use in the exposure assessment per compound and food category at the level 1 of the Foodex2 classification are detailed in Table 16. Additional 27 analytical results from non‐EU countries were taken into consideration for NDBA (n = 9, ND = 0%) in unsweetened spirits and liqueurs and for NDMA (n = 6, nd = 50%), NPYR (n = 6, nd = 33%) and NPIP (n = 6, nd = 83%) in cocoa ingredients.
Table 16.
Number of analytical results (N)* and % of left censored (% LC) for the data extracted from the literature per N‐NA compound and per food category at the level 1 of the Foodex2 classification from EU countries
| N‐NA | Alcoholic beverages | Meat and meat products | ||
|---|---|---|---|---|
| N | % LC | N | % LC | |
| NDMA | 1,242 | 92.6 | 309 | 24 |
| NMEA | 47 | 75 | ||
| NDEA | 89 | 85 | ||
| NMA | 82 | 66 | ||
| NSAR | 74 | 78 | ||
| NMOR | 62 | 90 | ||
| NPIP | 95 | 76 | ||
| NPYR | 117 | 38 | ||
| NPRO** | 91 | 37 | ||
| NTCA** | 87 | 3 | ||
| NMTCA** | 86 | 9 | ||
Additional 1335 analytical results from Yurchenko and Mölder (2006) on processed fish and 260 from Yurchenko and Mölder (2007) on unprocessed cooked meat (including data for NDBA and NDPA) not included in this table as no information on left censorship was available but included in the exposure assessment as described in Section 3.3.
Compounds non‐carcinogenic and therefore not included in the risk assessment.
It is noted that, in the reviewed articles, only the mean value was provided for each food category analysed with almost always no indication of the way left censorship was handled (when available this information is reported in Table C.5 of Annex C). Therefore, the same occurrence value was used in the LB, MB and UB dietary exposure assessment scenarios. The uncertainty linked to the left censorship of literature data and of the data extracted from the EFSA database was assessed in the uncertainty analysis (Section 3.5).
3.3. Dietary exposure assessment for humans
3.3.1. Selection of the concentration data from the available data sources used in the dietary exposure assessment
Occurrence data extracted from literature described in the previous section were considered to complement the N‐NA concentration data available through EFSA's chemical contaminant occurrence database.
Occurrence data extracted from literature (from EU countries) were grouped based on the sampling year indicated by the article as follows: from year 2000 onwards and from year 1990 to 1999. Mean occurrence values within these groups of articles, for the same food category and N‐NA compound were averaged by weighing the values against the total number of samples in the relevant articles. Each set of data obtained is indicated as ‘data source’ in the following text.
If concentration data were available from more than one available data source, priority was given in the following order: occurrence data from the EFSA database, occurrence data from literature sampled from 2000 onwards and from 1990 to 1999.
For two specific food categories, tequila and cocoa ingredients, for which no other data source was available, occurrence data from literature from non‐EU countries were used on the basis that the raw primary commodity is of non‐EU origin.
For both, occurrence data from EFSA database and occurrence data from literature, averages calculated for specific food categories on 100% left‐censored results or on less than six samples, were not retained. These analytical results were included in the calculation of averages for food categories at higher levels of the Foodex2 classification in case at least six samples and one quantifiable result were available.
If for specific food categories occurrence data from the EFSA database were 100% left censored but if selected literature data were reported with quantified results priority was given to the latter.
As a consequence of this process, 81 analytical results from Eerola (1998) and 1242 results from Lachenmeier (2007) were not used in the final exposure assessment as occurrence data from the EFSA database or more recent literature data were available for the same food categories.
Overall occurrence data were available for 13 N‐NA compounds as indicated in Table C.3 of Annex C.
Based on overall availability and following the selection criteria described in the above sections, no occurrence data were available for any of the N‐NA compounds for the following food categories:
‘Fruit and fruit products’, ‘Fruit and vegetable juices and nectars (including concentrates)’, ‘Grains and grain‐based products’, ‘Legumes, nuts, oilseeds and spices’, ‘Milk and dairy products’, ‘Starchy roots or tubers and products thereof, sugar plants’, ‘Vegetables and vegetable products’ and ‘Water and water‐based beverages’.
Table C.3 in Annex C contains the mean LB, MB, UB occurrence values and the mean literature values (for the year ranges ‘≥ 2000’ and ‘1990–1999’ and for the included data from non‐EU countries) available for each compound and each Foodex2 classification level and the selected concentration to be used in the dietary exposure assessment.
Overall among 13 N‐NAs, for which occurrence data were available, only the 10 N‐NAs considered to be carcinogenic and thus relevant for the risk assessment, were included for the exposure: NDMA, NMEA, NDEA, NDPA, NDBA, NMA, NSAR, NMOR, NPIP and NPYR (see Section 3.1.5).
Table 17 shows the availability of data for each compound and food category at level 1 of the Foodex2 classification for the food categories included in the dietary exposure assessment as well as the source of the data (occurrence data from literature or from EFSA DB).
Table 17.
Data availability and source of the data for each compound and food category at level 1 of the Foodex2 classification for the food categories included in the dietary exposure assessment
| N‐NAs | Alcoholic beverages | Coffee, cocoa, tea and infusions | Fish, seafood, amphibians, reptiles and invertebrates | Meat and meat products | Seasoning, sauces and condiments |
|---|---|---|---|---|---|
| NDMA | EFSA DB |
‐ Non‐EU‐Lit (Oliveira et al., 1995) ‐ EFSA DB |
‐ EU Lit ≥ 2000 (Yurchenko and Mölder, 2006) |
‐ EU‐Lit ≥ 2000 ‐EFSA DB |
EFSA DB |
| NMEA |
‐EU Lit ≥ 2000 (Hermmann et al., 2015a) |
||||
| NDEA | EFSA DB |
‐ EU Lit ≥ 2000 (Yurchenko and Mölder, 2006) ‐ EFSA DB |
‐ EU lit ≥ 2000 ‐ EFSA DB |
||
| NDPA | ‐ EFSA DB | ||||
| NDBA |
‐ Non‐EU‐Lit (Ramirez‐Guizar et al., 2020) ‐ EFSA DB |
‐ EU‐Lit ≥ 2000 (Yurchenko and Mölder, 2006) |
‐ EU Lit ≥ 2000 |
||
| NMA |
‐ EU‐Lit ≥ 2000 (Hermmann et al., 2015a) |
||||
| NSAR |
‐ EU‐Lit ≥ 2000 (Hermmann et al., 2015a) |
||||
| NMOR | ‐ EFSA DB |
‐ EU‐Lit ≥ 2000 (Hermmann et al., 2015a) |
|||
| NPIP |
‐ Non‐EU‐Lit Oliveira et al., 1995 |
‐ EU‐Lit ≥ 2000 (Yurchenko and Mölder 2006) |
‐ EU‐Lit ≥ 2000 ‐ EFSA DB |
||
| NPYR |
‐ Non‐EU‐Lit Oliveira et al., 1995 |
‐ EU‐Lit ≥ 2000 (Yurchenko and Mölder, 2006) |
‐ EU Lit ≥ 2000 (Hermmann et al., 2015a; Yurchenko and Mölder, 2007)* ‐ EFSA DB |
Table 18 shows occurrence ranges for each N‐NA in the food categories included in the dietary exposure assessment.
Table 18.
Occurrence ranges of each N‐NA for the food categories included in the dietary exposure assessment (μg/kg)
| N‐NA | Alcoholic beverages | Coffee, cocoa, tea and infusions | Fish, seafood, amphibians, reptiles and invertebrates | Meat and meat products | Seasoning, sauces and condiments | |||||
|---|---|---|---|---|---|---|---|---|---|---|
| Beer and beer‐like beverage | Unsweetened spirits and liqueurs | Cocoa and coffee imitate beverages | Cocoa and coffee imitate ingredients | Processed fish and seafood | Cooked unprocessed fish* | Processed meat | Cooked unprocessed meat* | Malt extract | ||
| NDMA | Min LB | 0.034 | 0.692 | 0.006 | 0.060 | 0.810 | 1.107 | 0.019 | 0.072 | 0.241 |
| Max LB | 0.090 | 0.692 | 0.031 | 0.556 | 1.990 | 1.107 | 1.120 | 1.362 | 0.241 | |
| Min UB | 0.098 | 0.692 | 0.006 | 0.060 | 0.810 | 1.107 | 0.603 | 1.040 | 0.310 | |
| Max UB | 0.186 | 0.692 | 0.033 | 0.593 | 1.990 | 1.107 | 8.284 | 1.837 | 0.310 | |
| NMEA | Min LB | 0.070 | 0.079 | |||||||
| Max LB | 0.097 | 0.079 | ||||||||
| Min UB | 0.070 | 0.079 | ||||||||
| Max UB | 0.097 | 0.079 | ||||||||
| NDEA | Min LB | 0.005 | 0.016 | 0.015 | 0.004 | 0.004 | ||||
| Max LB | 0.031 | 0.500 | 0.015 | 0.140 | 0.640 | |||||
| Min UB | 0.258 | 0.080 | 0.308 | 0.010 | 0.444 | |||||
| Max UB | 0.284 | 0.500 | 0.308 | 3.901 | 1.874 | |||||
| NDPA | Min LB | 0.036 | 0.075 | |||||||
| Max LB | 0.188 | 0.075 | ||||||||
| Min UB | 0.408 | 0.439 | ||||||||
| Max UB | 0.559 | 0.439 | ||||||||
| NDBA | Min LB | 0.019 | 4.900 | 0.070 | 0.162 | 0.273 | 0.270 | |||
| Max LB | 0.024 | 4.900 | 0.350 | 0.162 | 0.273 | 0.280 | ||||
| Min UB | 0.293 | 4.900 | 0.070 | 0.162 | 0.273 | 0.270 | ||||
| Max UB | 0.302 | 4.900 | 0.350 | 0.162 | 0.273 | 0.280 | ||||
| NMA | Min LB | 0.120 | 0.184 | |||||||
| Max LB | 0.270 | 0.184 | ||||||||
| Min UB | 0.120 | 0.184 | ||||||||
| Max UB | 0.270 | 0.184 | ||||||||
| NSAR | Min LB | 0.210 | 1.636 | |||||||
| Max LB | 3.342 | 1.636 | ||||||||
| Min UB | 0.210 | 1.636 | ||||||||
| Max UB | 3.342 | 1.636 | ||||||||
| NMOR | Min LB | 0.012 | 0.002 | 0.020 | ||||||
| Max LB | 0.015 | 0.030 | 0.020 | |||||||
| Min UB | 0.311 | 0.002 | 0.020 | |||||||
| Max UB | 0.319 | 0.030 | 0.020 | |||||||
| NPIP | Min LB | 0.012 | 0.120 | 0.630 | 0.908 | 0.047 | 0.239 | |||
| Max LB | 0.012 | 0.120 | 2.900 | 0.908 | 0.822 | 1.390 | ||||
| Min UB | 0.012 | 0.120 | 0.630 | 0.908 | 0.358 | 0.503 | ||||
| Max UB | 0.012 | 0.120 | 2.900 | 0.908 | 0.906 | 1.390 | ||||
| NPYR | Min LB | 0.036 | 0.360 | 1.130 | 1.780 | 0.087 | 0.258 | |||
| Max LB | 0.036 | 0.360 | 4.190 | 1.780 | 2.875 | 11.810 | ||||
| Min UB | 0.036 | 0.360 | 1.130 | 1.780 | 0.087 | 2.580 | ||||
| Max UB | 0.036 | 0.360 | 4.190 | 1.780 | 5.215 | 11.810 | ||||
| TCNAs | Min LB | 0.070 | 5.592 | 0.031 | 0.540 | 2.696 | 3.971 | 1.468 | 2.841 | 0.241 |
| Max LB | 0.151 | 5.592 | 0.054 | 0.556 | 9.620 | 3.971 | 5.244 | 17.239 | 0.241 | |
| Min UB | 0.985 | 5.592 | 0.033 | 0.540 | 2.984 | 4.264 | 4.502 | 7.868 | 0.310 | |
| Max UB | 1.090 | 5.592 | 0.054 | 0.593 | 9.620 | 4.264 | 17.074 | 17.603 | 0.310 | |
| TCNAs with potency factor | Min LB | 0.055 | 1.672 | 0.016 | 0.156 | 1.208 | 1.691 | 0.379 | 0.708 | 0.241 |
| Max LB | 0.136 | 1.672 | 0.031 | 0.556 | 3.692 | 1.691 | 2.010 | 4.946 | 0.241 | |
| Min UB | 0.751 | 1.672 | 0.016 | 0.156 | 1.368 | 1.984 | 1.593 | 2.996 | 0.310 | |
| Max UB | 0.849 | 1.672 | 0.033 | 0.593 | 3.692 | 1.984 | 9.421 | 5.150 | 0.310 | |
Food category included in dietary exposure assessment scenario 2.
In order to include all foods likely to contain N‐NAs in the dietary exposure assessment, the selected mean concentration value for a Foodex2 level was assigned to additional foods in the same food categories for which the N‐NAs concentration was considered to be similar. For example, the average NDMA concentration available for the category ‘Cured seasoned pork meat’, calculated on concentrations available for Bacon and Cured ham, was assigned to other types of Cured seasoned pork meat such as Tiroler speck and Pancetta for which a specific concentration value was not available. This extrapolation was applied up to level 2 of the foodex2 classification depending on the specific category where it was considered applicable. For example, it needs to be noted that when for meat and meat products concentrations, values were only available for the foodex2 level 2 category ‘Processed whole meat products’ the same concentration was used for all other processed meat categories such as Sausages and Meat specialties.
The mean concentrations for each of the FoodEx2 codes reported in the Comprehensive Database (4186 Foodex2 codes across all N‐NAs) used in the dietary exposure assessment are provided in Table C.6 in Annex C.
3.3.2. Current dietary exposure
Among 13 N‐NAs, for which occurrence data were available (see Sections 3.2.1 and 3.2.2), 10 N‐NAs are considered to be carcinogenic and thus relevant for the risk assessment: NDMA, NMEA, NDEA, NDPA, NDBA, NMA, NSAR, NMOR, NPIP and NPYR (see Section 3.1.5).
Dietary exposure to these N‐NAs was assessed through two different scenarios:
Scenario 1
In this scenario, the dietary exposure assessment was based on all food categories for which consumption data and occurrence data on N‐NAs were available as listed in Table 16 with the exception of cooked unprocessed meat and fish. The choice to estimate a scenario that did not include cooked unprocessed meat and fish is linked to the uncertainty about the representativeness of occurrence data available for these categories for which only one source reference was available with limited information about the sampling (Yurchenko and Mölder, 2006, 2007) as described in Section 3.2.2. In particular, there is some uncertainty from the description provided in the article regarding the potential presence or absence of nitrite/nitrate added in the products that were cooked and/or bought already as cooked and if data could be fully representative of the effect of different types of cooking (e.g. different types of grilling or frying) in the production of N‐NAs.
Scenario 2
In this scenario, the dietary exposure assessment was based on all food categories for which consumption data and occurrence data on N‐NAs were available as listed in Table 16 including cooked unprocessed meat and fish.
The decision to estimate a scenario that included cooked unprocessed meat and fish is linked to the evidence found in literature that although unprocessed and uncooked meat contain trace amounts of N‐NAs (EFSA CONTAM Panel, 2020), the process of cooking (baking, frying, grilling, microwaving) may generate considerable amounts of N‐NAs to which the final consumer is exposed. For a description of the evidence found in literature, see Section 1.3.
Data on cooked unprocessed meat were obtained from Yurchenko and Mölder (2007) for the compounds for which this study provided information (NDMA, NDEA, NPYR, NPIP and NDBA) while for NMEA, NDPA, NMA, NSAR and NMOR, concentration in processed meat was used as a proxy for concentrations in cooked unprocessed meat. The latest approach was also used for concentrations of NMEA, NDPA, NMA, NSAR and NMOR in cooked unprocessed fish, that is concentrations in processed fish were used as a proxy as no other data were available.
Results
Tables 19, 20, 21, 22–22 show the summary statistics of the estimated chronic dietary exposure for each age group to the individual and total TCNAs following the conservative approach of attributing the same potency to all N‐NAs (equal to NDEA) and to the total carcinogenic N‐NAs using group potency factors (see Section 3.1.8) for the two scenarios.
Table 19.
Scenario 1: Mean LB, MB and UB chronic dietary exposure (ng/kg bw per day) to the individual and total TCNAs across European dietary surveys by age group (in brackets the number of surveys included in the range*)
| Mean | Infants (11) | Toddlers (15) | Children (19) | Adolescents (21) | Adults (22) | Elderly (19) | Very elderly (14) | |||||||||||||||
|---|---|---|---|---|---|---|---|---|---|---|---|---|---|---|---|---|---|---|---|---|---|---|
| LB | MB | UB | LB | MB | UB | LB | MB | UB | LB | MB | UB | LB | MB | UB | LB | MB | UB | LB | MB | UB | ||
| NDMA | Min | < 0.1 | < 0.1 | < 0.1 | 0.1 | 0.5 | 0.8 | 0.1 | 0.6 | 1.1 | 0.1 | 0.3 | 0.6 | 0.2 | 0.4 | 0.5 | 0.1 | 0.2 | 0.3 | 0.1 | 0.4 | 0.5 |
| Max | 0.3 | 1.6 | 3.2 | 0.6 | 2.6 | 5.2 | 0.8 | 2.6 | 4.8 | 0.5 | 2.1 | 3.9 | 0.6 | 1.4 | 2.4 | 0.4 | 1.2 | 2.0 | 0.4 | 1.4 | 2.5 | |
| NMEA | Min | < 0.1 | < 0.1 | < 0.1 | < 0.1 | < 0.1 | < 0.1 | < 0.1 | < 0.1 | < 0.1 | < 0.1 | < 0.1 | < 0.1 | < 0.1 | < 0.1 | < 0.1 | < 0.1 | < 0.1 | < 0.1 | < 0.1 | < 0.1 | < 0.1 |
| Max | 0.1 | 0.1 | 0.1 | 0.2 | 0.2 | 0.2 | 0.2 | 0.2 | 0.2 | 0.1 | 0.1 | 0.1 | 0.1 | 0.1 | 0.1 | 0.1 | 0.1 | 0.1 | 0.1 | 0.1 | 0.1 | |
| NDEA | Min | < 0.1 | < 0.1 | < 0.1 | < 0.1 | 0.1 | 0.1 | < 0.1 | < 0.1 | 0.1 | < 0.1 | 0.2 | 0.3 | < 0.1 | 0.3 | 0.5 | < 0.1 | 0.1 | 0.2 | < 0.1 | 0.1 | 0.2 |
| Max | 0.1 | 1.4 | 2.7 | 0.2 | 1.3 | 2.6 | 0.2 | 1.4 | 2.8 | 0.1 | 1.0 | 1.9 | 0.1 | 1.2 | 2.3 | 0.1 | 1.1 | 2.1 | 0.1 | 1.2 | 2.4 | |
| NDPA | Min | < 0.1 | < 0.1 | < 0.1 | < 0.1 | 0.1 | 0.1 | < 0.1 | 0.1 | 0.1 | < 0.1 | 0.1 | 0.2 | < 0.1 | 0.1 | 0.1 | < 0.1 | < 0.1 | < 0.1 | < 0.1 | < 0.1 | 0.1 |
| Max | 0.1 | 0.3 | 0.4 | 0.2 | 0.7 | 1.2 | 0.2 | 0.7 | 1.1 | 0.1 | 0.4 | 0.6 | 0.1 | 0.3 | 0.5 | 0.1 | 0.3 | 0.4 | 0.1 | 0.3 | 0.5 | |
| NDBA | Min | < 0.1 | < 0.1 | < 0.1 | 0.1 | 0.1 | 0.1 | 0.1 | 0.1 | 0.1 | 0.1 | 0.2 | 0.2 | 0.2 | 0.4 | 0.4 | 0.2 | 0.2 | 0.2 | 0.1 | 0.1 | 0.1 |
| Max | 0.3 | 0.3 | 0.3 | 0.7 | 0.7 | 0.7 | 0.6 | 0.6 | 0.6 | 0.4 | 0.5 | 0.6 | 0.8 | 1.3 | 2.0 | 0.9 | 1.1 | 1.4 | 1.3 | 1.6 | 1.9 | |
| NMA | Min | < 0.1 | < 0.1 | < 0.1 | < 0.1 | < 0.1 | < 0.1 | < 0.1 | < 0.1 | < 0.1 | 0.1 | 0.1 | 0.1 | < 0.1 | < 0.1 | < 0.1 | < 0.1 | < 0.1 | < 0.1 | < 0.1 | < 0.1 | < 0.1 |
| Max | 0.2 | 0.2 | 0.2 | 0.4 | 0.4 | 0.4 | 0.3 | 0.3 | 0.3 | 0.2 | 0.2 | 0.2 | 0.2 | 0.2 | 0.2 | 0.2 | 0.2 | 0.2 | 0.2 | 0.2 | 0.2 | |
| NSAR | Min | < 0.1 | < 0.1 | < 0.1 | 0.3 | 0.3 | 0.3 | 0.1 | 0.1 | 0.1 | 0.3 | 0.3 | 0.3 | 0.2 | 0.2 | 0.2 | 0.1 | 0.1 | 0.1 | 0.1 | 0.1 | 0.1 |
| Max | 2.9 | 2.9 | 2.9 | 2.9 | 2.9 | 2.9 | 3.0 | 3.0 | 3.0 | 1.9 | 1.9 | 1.9 | 1.8 | 1.8 | 1.8 | 1.9 | 1.9 | 1.9 | 1.8 | 1.8 | 1.8 | |
| NMOR | Min | < 0.1 | < 0.1 | < 0.1 | < 0.1 | < 0.1 | < 0.1 | < 0.1 | < 0.1 | < 0.1 | < 0.1 | < 0.1 | < 0.1 | < 0.1 | 0.1 | 0.2 | < 0.1 | < 0.1 | < 0.1 | < 0.1 | < 0.1 | < 0.1 |
| Max | < 0.1 | 0.1 | 0.1 | 0.1 | 0.2 | 0.3 | 0.1 | 0.1 | 0.2 | < 0.1 | 0.2 | 0.3 | 0.1 | 0.8 | 1.5 | < 0.1 | 0.4 | 0.8 | < 0.1 | 0.4 | 0.7 | |
| NPIP | Min | < 0.1 | < 0.1 | < 0.1 | 0.1 | 0.2 | 0.3 | 0.1 | 0.1 | 0.2 | 0.1 | 0.1 | 0.2 | 0.1 | 0.1 | 0.1 | 0.1 | 0.1 | 0.1 | 0.1 | 0.1 | 0.1 |
| Max | 0.5 | 0.6 | 0.7 | 1.1 | 1.4 | 1.7 | 0.9 | 1.1 | 1.3 | 0.6 | 0.7 | 0.8 | 0.4 | 0.6 | 0.7 | 0.4 | 0.5 | 0.6 | 0.3 | 0.4 | 0.5 | |
| NPYR | Min | < 0.1 | < 0.1 | < 0.1 | 0.3 | 0.4 | 0.5 | 0.3 | 0.4 | 0.5 | 0.1 | 0.3 | 0.4 | 0.1 | 0.2 | 0.3 | 0.1 | 0.1 | 0.2 | < 0.1 | 0.2 | 0.4 |
| Max | 0.6 | 1.7 | 2.8 | 1.4 | 3.5 | 5.8 | 1.5 | 2.3 | 4.0 | 0.9 | 1.5 | 2.3 | 0.7 | 1.2 | 1.9 | 0.6 | 1.1 | 1.7 | 0.8 | 1.1 | 1.9 | |
| TCNAs | Min | < 0.1 | < 0.1 | < 0.1 | 1.5 | 2.4 | 3.3 | 0.7 | 1.4 | 2.1 | 1.4 | 2.3 | 3.2 | 1.8 | 2.6 | 3.4 | 1.1 | 1.5 | 1.8 | 1.0 | 1.7 | 2.1 |
| Max | 4.1 | 6.6 | 9.2 | 6.7 | 12.0 | 17.2 | 6.0 | 10.7 | 15.5 | 4.4 | 7.9 | 11.4 | 4.1 | 7.9 | 12.1 | 3.9 | 6.5 | 9.2 | 3.2 | 6.3 | 9.5 | |
| TCNAs with PF | Min | < 0.1 | < 0.1 | < 0.1 | 0.5 | 1.2 | 1.8 | 0.2 | 0.8 | 1.3 | 0.4 | 1.1 | 1.8 | 0.6 | 1.2 | 1.8 | 0.4 | 0.6 | 0.8 | 0.3 | 0.8 | 1.0 |
| Max | 1.0 | 3.2 | 5.3 | 2.2 | 5.4 | 9.1 | 1.9 | 5.4 | 9.0 | 1.3 | 4.1 | 6.9 | 1.5 | 4.3 | 7.1 | 1.2 | 3.1 | 5.0 | 1.1 | 3.1 | 5.4 | |
Mean estimates based on dietary surveys/population classes with less than six observations may not be statistically robust (EFSA, 2011) and are thus not included in this table.
Table 20.
Scenario 2: Mean LB, MB and UB chronic dietary exposure (ng/kg bw per day) to the individual and total TCNAs across European dietary surveys by age group (in brackets the number of surveys included in the range*)
| Mean | Infants (11) | Toddlers (15) | Children (19) | Adolescents (21) | Adults (22) | Elderly (19) | Very elderly (14) | |||||||||||||||
|---|---|---|---|---|---|---|---|---|---|---|---|---|---|---|---|---|---|---|---|---|---|---|
| LB | MB | UB | LB | MB | UB | LB | MB | UB | LB | MB | UB | LB | MB | UB | LB | MB | UB | LB | MB | UB | ||
| NDMA | Min | 0.6 | 0.8 | 0.9 | 2.1 | 2.9 | 3.7 | 2.3 | 3.0 | 3.7 | 1.3 | 2.0 | 2.6 | 1.5 | 2.2 | 2.5 | 1.4 | 1.8 | 1.9 | 1.3 | 1.9 | 2.4 |
| Max | 5.0 | 5.8 | 6.5 | 8.8 | 11.0 | 13.3 | 7.1 | 8.2 | 10.4 | 4.5 | 5.5 | 7.3 | 3.4 | 3.8 | 4.6 | 2.6 | 3.5 | 4.4 | 2.4 | 3.5 | 4.6 | |
| NMEA | Min | 0.1 | 0.1 | 0.1 | 0.2 | 0.2 | 0.2 | 0.2 | 0.2 | 0.2 | 0.1 | 0.1 | 0.1 | 0.1 | 0.1 | 0.1 | 0.1 | 0.1 | 0.1 | 0.1 | 0.1 | 0.1 |
| Max | 0.4 | 0.4 | 0.4 | 0.5 | 0.5 | 0.5 | 0.5 | 0.5 | 0.5 | 0.3 | 0.3 | 0.3 | 0.2 | 0.2 | 0.2 | 0.2 | 0.2 | 0.2 | 0.2 | 0.2 | 0.2 | |
| NDEA | Min | 0.3 | 0.3 | 0.3 | 0.8 | 0.9 | 1.1 | 0.8 | 1.0 | 1.2 | 0.5 | 0.7 | 0.9 | 0.5 | 0.9 | 1.4 | 0.4 | 0.7 | 0.9 | 0.4 | 0.7 | 1.0 |
| Max | 1.9 | 3.3 | 4.7 | 2.7 | 4.1 | 5.8 | 2.5 | 3.2 | 4.6 | 1.6 | 2.1 | 3.1 | 1.2 | 2.0 | 3.1 | 0.8 | 1.7 | 2.7 | 0.9 | 2.0 | 3.2 | |
| NDPA | Min | 0.1 | 0.2 | 0.3 | 0.2 | 0.7 | 1.3 | 0.2 | 0.7 | 1.1 | 0.1 | 0.4 | 0.7 | 0.1 | 0.4 | 0.7 | 0.1 | 0.3 | 0.5 | 0.1 | 0.3 | 0.5 |
| Max | 0.4 | 1.2 | 2.0 | 0.5 | 1.7 | 2.9 | 0.5 | 1.5 | 2.6 | 0.3 | 0.9 | 1.5 | 0.2 | 0.7 | 1.2 | 0.2 | 0.5 | 0.9 | 0.2 | 0.7 | 1.1 | |
| NDBA | Min | 0.2 | 0.2 | 0.2 | 0.8 | 0.8 | 0.8 | 0.8 | 0.8 | 0.8 | 0.6 | 0.6 | 0.6 | 0.6 | 0.8 | 0.8 | 0.5 | 0.6 | 0.6 | 0.5 | 0.5 | 0.5 |
| Max | 1.3 | 1.3 | 1.3 | 2.1 | 2.1 | 2.1 | 1.7 | 1.7 | 1.8 | 1.1 | 1.1 | 1.1 | 1.2 | 1.8 | 2.4 | 1.2 | 1.4 | 1.8 | 1.7 | 2.0 | 2.3 | |
| NMA | Min | 0.1 | 0.1 | 0.1 | 0.4 | 0.4 | 0.4 | 0.4 | 0.4 | 0.4 | 0.2 | 0.2 | 0.2 | 0.2 | 0.2 | 0.2 | 0.2 | 0.2 | 0.2 | 0.2 | 0.2 | 0.2 |
| Max | 0.8 | 0.8 | 0.8 | 1.1 | 1.1 | 1.1 | 1.0 | 1.0 | 1.0 | 0.6 | 0.6 | 0.6 | 0.5 | 0.5 | 0.5 | 0.4 | 0.4 | 0.4 | 0.4 | 0.4 | 0.4 | |
| NSAR | Min | 0.8 | 0.8 | 0.8 | 2.4 | 2.4 | 2.4 | 2.6 | 2.6 | 2.6 | 1.6 | 1.6 | 1.6 | 1.6 | 1.6 | 1.6 | 1.5 | 1.5 | 1.5 | 1.3 | 1.3 | 1.3 |
| Max | 8.6 | 8.6 | 8.6 | 9.9 | 9.9 | 9.9 | 8.0 | 8.0 | 8.0 | 5.7 | 5.7 | 5.7 | 3.9 | 3.9 | 3.9 | 3.5 | 3.5 | 3.5 | 4.1 | 4.1 | 4.1 | |
| NMOR | Min | < 0.1 | < 0.1 | < 0.1 | 0.1 | 0.1 | 0.1 | < 0.1 | 0.1 | 0.1 | < 0.1 | < 0.1 | < 0.1 | < 0.1 | 0.1 | 0.2 | < 0.1 | < 0.1 | 0.1 | < 0.1 | < 0.1 | < 0.1 |
| Max | 0.1 | 0.1 | 0.2 | 0.1 | 0.3 | 0.4 | 0.1 | 0.2 | 0.3 | 0.1 | 0.2 | 0.3 | 0.1 | 0.8 | 1.6 | 0.1 | 0.4 | 0.8 | 0.1 | 0.4 | 0.7 | |
| NPIP | Min | 0.7 | 0.7 | 0.8 | 2.3 | 2.5 | 2.7 | 2.4 | 2.6 | 2.8 | 1.3 | 1.4 | 1.5 | 1.4 | 1.4 | 1.5 | 1.2 | 1.3 | 1.4 | 1.2 | 1.2 | 1.3 |
| Max | 4.6 | 4.7 | 4.9 | 8.5 | 8.8 | 9.0 | 6.9 | 7.0 | 7.1 | 4.4 | 4.5 | 4.5 | 3.2 | 3.3 | 3.3 | 2.3 | 2.3 | 2.4 | 2.4 | 2.5 | 2.5 | |
| NPYR | Min | 3.9 | 4.3 | 4.6 | 11.7 | 13.0 | 14.3 | 12.8 | 14.1 | 15.4 | 7.3 | 7.8 | 8.4 | 7.5 | 8.0 | 8.6 | 6.4 | 6.9 | 7.4 | 5.9 | 6.4 | 6.9 |
| Max | 34.5 | 34.5 | 34.5 | 49.2 | 49.8 | 50.3 | 42.9 | 43.4 | 43.9 | 28.8 | 29.1 | 29.4 | 20.2 | 20.5 | 20.7 | 13.4 | 13.7 | 14.0 | 15.2 | 16.0 | 16.9 | |
| TCNA | Min | 6.8 | 7.4 | 8.1 | 21.0 | 24.0 | 26.9 | 22.8 | 25.7 | 28.6 | 13.1 | 15.1 | 17.2 | 13.6 | 16.4 | 19.1 | 12.0 | 14.6 | 16.7 | 10.9 | 13.0 | 15.1 |
| Max | 53.0 | 55.7 | 59.1 | 81.8 | 87.7 | 93.7 | 70.6 | 73.4 | 76.3 | 47.3 | 49.2 | 51.2 | 33.5 | 35.2 | 37.3 | 23.8 | 26.6 | 29.3 | 25.7 | 29.2 | 32.6 | |
| TCNA with PF | Min | 2.2 | 2.5 | 2.7 | 7.4 | 8.7 | 10.0 | 7.6 | 8.9 | 10.2 | 4.4 | 5.6 | 6.8 | 4.4 | 6.2 | 7.1 | 3.9 | 4.6 | 5.0 | 3.6 | 4.9 | 6.2 |
| Max | 14.4 | 16.7 | 19.1 | 21.1 | 25.0 | 29.0 | 18.6 | 20.6 | 23.3 | 11.5 | 12.8 | 15.7 | 8.8 | 10.5 | 13.5 | 7.0 | 9.0 | 10.9 | 6.9 | 9.2 | 11.5 | |
Mean estimates based on dietary surveys/population classes with less than six observations may not be statistically robust (EFSA, 2011) and are thus not included in this table.
Table 21.
Scenario 1: P95 LB, MB and UB chronic dietary exposure (ng/kg bw per day) to the individual and total TCNAs across European dietary surveys by age group (in brackets the number of surveys included in the range*)
| P95 | Infants (9) | Toddlers (13) | Children (19) | Adolescents (20) | Adults (22) | Elderly (19) | Very elderly (10) | |||||||||||||||
|---|---|---|---|---|---|---|---|---|---|---|---|---|---|---|---|---|---|---|---|---|---|---|
| LB | MB | UB | LB | MB | UB | LB | MB | UB | LB | MB | UB | LB | MB | UB | LB | MB | UB | LB | MB | UB | ||
| NDMA | Min | 0 | 0 | 0 | 0.3 | 2.5 | 4.4 | 0.3 | 2.4 | 4.4 | 0.3 | 1.1 | 1.9 | 0.9 | 1.5 | 2.1 | 0.7 | 1.1 | 1.4 | 0.7 | 1.4 | 1.6 |
| Max | 1.1 | 6.8 | 13.4 | 3.3 | 9.8 | 19.5 | 3.8 | 7.6 | 14.9 | 1.9 | 6.3 | 11.9 | 2.3 | 4.5 | 8.2 | 1.6 | 3.9 | 7.7 | 1.4 | 6.2 | 12.3 | |
| NMEA | Min | 0 | 0 | 0 | 0.1 | 0.1 | 0.1 | 0.1 | 0.1 | 0.1 | 0.1 | 0.1 | 0.1 | 0.1 | 0.1 | 0.1 | < 0.1 | < 0.1 | < 0.1 | < 0.1 | < 0.1 | < 0.1 |
| Max | 0.6 | 0.6 | 0.6 | 0.6 | 0.6 | 0.6 | 0.5 | 0.5 | 0.5 | 0.3 | 0.3 | 0.3 | 0.3 | 0.3 | 0.3 | 0.3 | 0.3 | 0.3 | 0.2 | 0.2 | 0.2 | |
| NDEA | Min | 0 | 0 | 0 | 0.1 | 0.4 | 0.4 | 0.1 | 0.2 | 0.2 | 0.1 | 0.7 | 1.2 | 0.1 | 1.0 | 2.1 | 0.1 | 0.6 | 1.3 | 0.1 | 0.6 | 1.1 |
| Max | 0.3 | 8.6 | 17.1 | 0.9 | 6.1 | 12.2 | 0.7 | 5.4 | 10.6 | 0.4 | 3.7 | 7.2 | 0.5 | 4.2 | 8.2 | 0.3 | 4.3 | 8.6 | 0.3 | 1.9 | 3.8 | |
| NDPA | Min | 0 | 0 | 0 | 0.2 | 0.4 | 0.6 | 0.1 | 0.3 | 0.4 | 0.1 | 0.3 | 0.5 | 0.1 | 0.2 | 0.4 | 0.1 | 0.2 | 0.3 | 0.1 | 0.2 | 0.2 |
| Max | 0.8 | 1.8 | 2.6 | 0.7 | 2.0 | 3.7 | 0.7 | 1.8 | 3.2 | 0.5 | 1.2 | 1.9 | 0.5 | 1.0 | 1.6 | 0.5 | 0.9 | 1.4 | 0.2 | 0.6 | 0.9 | |
| NDBA | Min | 0 | 0 | 0 | 0.5 | 0.5 | 0.5 | 0.3 | 0.3 | 0.3 | 0.4 | 0.4 | 0.4 | 0.7 | 1.3 | 1.8 | 0.5 | 0.7 | 0.8 | 0.3 | 0.4 | 0.5 |
| Max | 1.7 | 1.7 | 1.7 | 1.9 | 1.9 | 2.2 | 1.8 | 1.8 | 2.0 | 1.2 | 1.5 | 2.4 | 5.0 | 5.5 | 8.4 | 4.8 | 5.0 | 5.3 | 4.3 | 4.4 | 4.9 | |
| NMA | Min | 0 | 0 | 0 | 0.2 | 0.2 | 0.2 | 0.2 | 0.2 | 0.2 | 0.2 | 0.2 | 0.2 | 0.1 | 0.1 | 0.1 | 0.1 | 0.1 | 0.1 | 0.1 | 0.1 | 0.1 |
| Max | 1.2 | 1.2 | 1.2 | 1.0 | 1.0 | 1.0 | 0.9 | 0.9 | 0.9 | 0.6 | 0.6 | 0.6 | 0.6 | 0.6 | 0.6 | 0.6 | 0.6 | 0.6 | 0.3 | 0.3 | 0.3 | |
| NSAR | Min | 0 | 0 | 0 | 1.1 | 1.1 | 1.1 | 0.3 | 0.3 | 0.3 | 1.0 | 1.0 | 1.0 | 0.9 | 0.9 | 0.9 | 0.9 | 0.9 | 0.9 | 0.8 | 0.8 | 0.8 |
| Max | 19.2 | 19.2 | 19.2 | 13.7 | 13.7 | 13.7 | 11.9 | 11.9 | 11.9 | 7.6 | 7.6 | 7.6 | 7.2 | 7.2 | 7.2 | 7.8 | 7.8 | 7.8 | 2.9 | 2.9 | 2.9 | |
| NMOR | Min | 0 | 0 | 0 | < 0.1 | < 0.1 | < 0.1 | < 0.1 | < 0.1 | < 0.1 | < 0.1 | < 0.1 | < 0.1 | < 0.1 | 0.4 | 0.9 | < 0.1 | 0.2 | 0.3 | < 0.1 | < 0.1 | < 0.1 |
| Max | 0.1 | 0.1 | 0.1 | 0.2 | 1.0 | 1.8 | 0.2 | 0.9 | 1.7 | 0.1 | 0.7 | 1.4 | 0.3 | 3.6 | 6.9 | 0.2 | 2.0 | 3.7 | 0.1 | 1.2 | 2.4 | |
| NPIP | Min | 0 | 0 | 0 | 0.6 | 1.0 | 1.4 | 0.6 | 0.7 | 0.9 | 0.4 | 0.5 | 0.6 | 0.4 | 0.5 | 0.6 | 0.4 | 0.4 | 0.4 | 0.5 | 0.6 | 0.8 |
| Max | 1.9 | 2.2 | 2.9 | 3.9 | 3.9 | 4.0 | 3.8 | 3.9 | 4.0 | 2.1 | 2.2 | 2.5 | 1.7 | 1.8 | 2.2 | 1.5 | 1.6 | 2.0 | 1.1 | 1.2 | 1.3 | |
| NPYR | Min | 0 | 0 | 0 | 1.0 | 2.8 | 3.4 | 0.9 | 1.7 | 2.3 | 0.6 | 1.2 | 2.0 | 0.5 | 1.1 | 1.5 | 0.5 | 0.8 | 1.2 | 1.6 | 1.7 | 2.2 |
| Max | 2.2 | 6.2 | 10.8 | 7.1 | 8.1 | 13.3 | 7.0 | 7.4 | 11.2 | 3.8 | 4.5 | 7.2 | 3.1 | 4.3 | 7.3 | 2.7 | 3.5 | 5.5 | 3.1 | 4.0 | 4.8 | |
| TCNAs | Min | 0 | 0 | 0 | 6.6 | 12.4 | 17.3 | 3.1 | 6.1 | 8.9 | 4.4 | 7.2 | 9.7 | 4.8 | 9.9 | 13.0 | 3.7 | 7.2 | 9.8 | 3.0 | 5.6 | 6.4 |
| Max | 26.6 | 42.5 | 54.8 | 19.6 | 32.9 | 46.5 | 18.3 | 30.5 | 41.9 | 12.4 | 21.4 | 30.2 | 13.1 | 24.5 | 39.0 | 13.2 | 21.3 | 30.7 | 10.0 | 14.2 | 22.1 | |
| TCNAs with PF | Min | 0 | 0 | 0 | 2.0 | 5.5 | 9.3 | 1.0 | 3.5 | 6.2 | 1.2 | 3.4 | 5.6 | 1.9 | 4.4 | 7.1 | 1.6 | 3.3 | 4.3 | 1.5 | 2.7 | 3.7 |
| Max | 6.2 | 19.2 | 31.3 | 6.9 | 16.7 | 29.6 | 6.5 | 14.8 | 24.5 | 3.8 | 10.9 | 18.8 | 4.6 | 14.2 | 24.1 | 3.8 | 10.3 | 17.6 | 2.8 | 7.4 | 13.2 | |
*: 95th percentile estimates based on dietary surveys/population classes with less than 60 observations may not be statistically robust (EFSA, 2011) and are thus not included in this table.
Table 22.
Scenario 2: P95 LB, MB and UB chronic dietary exposure (ng/kg bw per day) to the individual and total TCNAs across European dietary surveys by age group (in brackets the number of surveys included in the range*)
| P95 | Infants (9) | Toddlers (13) | Children (19) | Adolescents (20) | Adults (22) | Elderly (19) | Very elderly (10) | |||||||||||||||
|---|---|---|---|---|---|---|---|---|---|---|---|---|---|---|---|---|---|---|---|---|---|---|
| LB | MB | UB | LB | MB | UB | LB | MB | UB | LB | MB | UB | LB | MB | UB | LB | MB | UB | LB | MB | UB | ||
| NDMA | Min | 3.1 | 3.7 | 3.8 | 5.5 | 7.0 | 9.6 | 5.5 | 6.5 | 8.2 | 3.9 | 5.6 | 6.6 | 4.0 | 4.9 | 6.1 | 3.2 | 4.1 | 4.2 | 3.2 | 4.0 | 4.7 |
| Max | 16.3 | 16.3 | 20.0 | 18.7 | 22.4 | 28.1 | 14.2 | 16.7 | 22.9 | 9.5 | 11.0 | 16.2 | 7.8 | 8.7 | 10.6 | 5.4 | 7.3 | 9.9 | 5.5 | 7.9 | 13.2 | |
| NMEA | Min | 0.2 | 0.2 | 0.2 | 0.5 | 0.5 | 0.5 | 0.4 | 0.4 | 0.4 | 0.3 | 0.3 | 0.3 | 0.3 | 0.3 | 0.3 | 0.2 | 0.2 | 0.2 | 0.2 | 0.2 | 0.2 |
| Max | 1.0 | 1.0 | 1.0 | 1.1 | 1.1 | 1.1 | 0.9 | 0.9 | 0.9 | 0.6 | 0.6 | 0.6 | 0.5 | 0.5 | 0.5 | 0.4 | 0.4 | 0.4 | 0.3 | 0.3 | 0.3 | |
| NDEA | Min | 1.1 | 1.2 | 1.4 | 2.1 | 2.5 | 3.0 | 2.0 | 2.5 | 3.0 | 1.5 | 2.2 | 3.1 | 1.3 | 2.2 | 3.5 | 1.0 | 1.7 | 2.8 | 1.1 | 1.6 | 2.4 |
| Max | 6.7 | 11.5 | 18.4 | 6.7 | 9.6 | 14.2 | 5.4 | 7.6 | 12.3 | 3.6 | 4.8 | 8.3 | 3.1 | 5.3 | 9.3 | 1.9 | 4.6 | 8.9 | 2.0 | 3.2 | 4.6 | |
| NDPA | Min | 0.3 | 0.9 | 1.6 | 0.6 | 1.9 | 3.2 | 0.5 | 1.6 | 2.7 | 0.4 | 1.1 | 1.9 | 0.3 | 0.9 | 1.5 | 0.2 | 0.7 | 1.2 | 0.2 | 0.7 | 1.2 |
| Max | 1.2 | 3.4 | 5.7 | 1.2 | 3.6 | 6.2 | 1.0 | 3.0 | 5.2 | 0.6 | 2.0 | 3.3 | 0.6 | 1.6 | 2.7 | 0.5 | 1.2 | 2.0 | 0.3 | 1.1 | 1.9 | |
| NDBA | Min | 0.9 | 0.9 | 0.9 | 1.9 | 1.9 | 2.1 | 1.6 | 1.7 | 1.8 | 1.2 | 1.2 | 1.2 | 1.3 | 1.8 | 2.2 | 1.1 | 1.1 | 1.2 | 0.8 | 0.8 | 0.9 |
| Max | 3.6 | 3.6 | 3.6 | 4.1 | 4.1 | 4.1 | 3.2 | 3.3 | 3.7 | 2.2 | 2.2 | 2.6 | 5.5 | 5.9 | 9.0 | 5.2 | 5.5 | 5.9 | 4.7 | 4.7 | 5.0 | |
| NMA | Min | 0.5 | 0.5 | 0.5 | 1.0 | 1.0 | 1.0 | 0.9 | 0.9 | 0.9 | 0.7 | 0.7 | 0.7 | 0.6 | 0.6 | 0.6 | 0.5 | 0.5 | 0.5 | 0.5 | 0.5 | 0.5 |
| Max | 2.4 | 2.4 | 2.4 | 2.5 | 2.5 | 2.5 | 2.0 | 2.0 | 2.0 | 1.4 | 1.4 | 1.4 | 1.1 | 1.1 | 1.1 | 0.8 | 0.8 | 0.8 | 0.7 | 0.7 | 0.7 | |
| NSAR | Min | 3.4 | 3.4 | 3.4 | 6.7 | 6.7 | 6.7 | 6.1 | 6.1 | 6.1 | 5.0 | 5.0 | 5.0 | 4.6 | 4.6 | 4.6 | 4.0 | 4.0 | 4.0 | 3.6 | 3.6 | 3.6 |
| Max | 27.4 | 27.4 | 27.4 | 23.5 | 23.5 | 23.5 | 18.4 | 18.4 | 18.4 | 12.6 | 12.6 | 12.6 | 10.4 | 10.4 | 10.4 | 9.8 | 9.8 | 9.8 | 6.6 | 6.6 | 6.6 | |
| NMOR | Min | 0.1 | 0.1 | 0.1 | 0.2 | 0.2 | 0.2 | 0.1 | 0.1 | 0.1 | 0.1 | 0.1 | 0.1 | 0.1 | 0.5 | 0.9 | 0.1 | 0.2 | 0.4 | 0.1 | 0.1 | 0.1 |
| Max | 0.3 | 0.3 | 0.3 | 0.3 | 1.0 | 1.9 | 0.3 | 1.0 | 1.8 | 0.2 | 0.8 | 1.4 | 0.4 | 3.6 | 6.9 | 0.2 | 2.0 | 3.8 | 0.1 | 1.3 | 2.4 | |
| NPIP | Min | 3.0 | 3.1 | 3.2 | 5.9 | 6.2 | 6.6 | 5.6 | 5.9 | 6.1 | 3.7 | 3.9 | 4.0 | 3.4 | 3.5 | 3.5 | 2.9 | 3.1 | 3.2 | 2.8 | 2.9 | 3.0 |
| Max | 15.5 | 15.5 | 15.5 | 18.9 | 18.9 | 18.9 | 13.7 | 13.8 | 14.2 | 9.4 | 9.4 | 9.5 | 7.2 | 7.2 | 7.3 | 5.0 | 5.0 | 5.0 | 5.0 | 5.0 | 5.0 | |
| NPYR | Min | 20.2 | 20.2 | 21.2 | 35.1 | 37.5 | 40.3 | 35.4 | 37.1 | 37.9 | 24.2 | 25.1 | 26.0 | 22.1 | 22.7 | 23.3 | 19.0 | 19.5 | 19.8 | 18.5 | 19.1 | 19.2 |
| Max | 126.0 | 126.0 | 126.0 | 127.3 | 127.3 | 127.3 | 101.0 | 101.0 | 101.0 | 67.2 | 67.3 | 67.4 | 50.6 | 50.7 | 50.9 | 37.4 | 37.4 | 37.4 | 34.5 | 34.5 | 34.5 | |
| TCNA | Min | 31.3 | 32.1 | 34.7 | 60.2 | 66.5 | 71.6 | 58.4 | 63.2 | 67.9 | 40.0 | 43.8 | 47.7 | 37.2 | 40.0 | 42.9 | 31.8 | 33.8 | 39.4 | 31.1 | 33.1 | 36.7 |
| Max | 192.8 | 194.8 | 196.9 | 196.6 | 201.3 | 208.9 | 155.6 | 158.8 | 165.1 | 105.1 | 107.5 | 112.0 | 80.0 | 84.0 | 87.4 | 59.0 | 60.0 | 61.4 | 55.6 | 56.3 | 58.6 | |
| TCNA with PF | Min | 10.3 | 10.8 | 13.3 | 18.4 | 20.5 | 23.5 | 16.1 | 18.9 | 22.1 | 12.0 | 15.1 | 17.4 | 10.5 | 12.8 | 16.1 | 8.8 | 11.6 | 12.8 | 8.5 | 10.2 | 12.2 |
| Max | 45.6 | 46.4 | 54.4 | 45.6 | 50.4 | 62.8 | 36.2 | 40.9 | 48.0 | 25.1 | 27.0 | 31.0 | 22.1 | 25.2 | 33.8 | 13.9 | 16.9 | 22.4 | 13.3 | 15.6 | 19.8 | |
*: 95th percentile estimates based on dietary surveys/population classes with less than 60 observations may not be statistically robust (EFSA, 2011) and are thus not included in this table.
Detailed mean and 95th percentile dietary exposure estimates for the two scenarios for all age classes and population groups and dietary surveys are presented in Tables C.7 and C.8 in Annex C. The special population groups ‘Pregnant women’ and ‘Lactating women’ resulted in mean and P95 exposure within the range of the adult population group and thus will not be further discussed. The special subpopulation group ‘vegetarians’ (one survey) resulted in mean and P95 exposure lower than all other population groups (the maximum across the compounds at the P95 UB is below 1 ng/kg bw per day).
Looking at the dietary exposure to TCNAs, in scenario 1, the TCNA mean MB dietary exposure ranged from < 0.1 ng/kg bw per day in infants to 12.0 ng/kg bw per day in toddlers. The TCNA P95 UB dietary exposure ranged from 0 to 54.8 ng/kg bw per day, both in infants. The TCNA mean MB dietary exposure with potency factors ranged from < 0.1 ng/kg bw per day in infants to 5.4 ng/kg bw per day in toddlers and children. The TCNA P95 UB dietary exposure with potency factors ranged from 0 ng/kg bw per day in infants to 31.3 ng/kg bw per day in infants. The highest P95 dietary exposure to TCNAs assessed using potency factors was 1.7 times lower than the highest P95 dietary exposure to TCNA assessed without using potency factors (both found in infants).
In scenario 2, the TCNA mean MB dietary exposure ranged from 7.4 ng/kg bw per day in infants to 87.7 ng/kg bw per day in toddlers. The TCNA P95 UB dietary exposure ranged from 34.7 ng/kg bw per day in infants to 208.8 ng/kg bw per day in toddlers. The TCNA mean MB dietary exposure with potency factors ranged from 2.5 ng/kg bw per day in infants to 25.0 ng/kg bw per day in toddlers. The TCNA P95 UB dietary exposure with potency factors ranged from 12.2 ng/kg bw per day in the very elderly to 62.8 ng/kg bw per day in toddlers. The highest P95 dietary exposure to TCNAs assessed using potency factors was 3.3 times lower than the highest P95 dietary exposure to TCNAs assessed without using potency factors (both found in toddlers).
Mean MB dietary exposure to TCNAs in scenario 2 was about 4.7 times higher than in scenario 1 while the P95 UB dietary exposure to TCNAs in scenario 2 was about three times higher than in scenario 1.
Looking at the dietary exposure to individual TCNAs, in scenario 1, the highest mean MB dietary exposure estimate for NPYR was 3.5 ng/kg bw per day in toddlers, for NSAR 3.0 ng/kg bw per day in other children, for NDMA 2.6 ng/kg bw per day in toddlers and other children, for NDBA 1.6 ng/kg bw per day in the very elderly, and for NDEA and NPIP 1.4 ng/kg bw per day in other children and toddlers, respectively. The mean MB dietary exposure of the other N‐NAs was below 0.1 ng/kg bw per day. In general, toddlers and other children were exposed at higher levels than the other age groups. The highest P95 UB dietary exposures for NDMA were 19.5 ng/kg bw per day in toddlers, for NSAR 19.2 ng/kg bw per day in infants, for NDEA 17.1 ng/kg bw per day in infants, for NPYR 31.2 ng/kg bw per day in toddlers. The P95 UB dietary exposure estimates for the other N‐NAs were all below 10 ng/kg bw per day.
In scenario 2, the highest mean MB dietary exposure estimate for NPYR was 49.8 ng/kg bw, for NDMA 11.0 ng/kg bw per day, for NSAR 9.9 ng/kg bw per day, for NPIP 8.7 ng/kg bw per day, for NDEA 4.1 ng/kg bw per day and for NDBA 2.1 ng/kg bw per day, all found in toddlers. The mean MB dietary exposure of the other N‐NAs was below 2 ng/kg bw per day. In general, toddlers and other children were exposed at higher levels than the other age groups. The highest P95 UB dietary exposures for NPYR were 127.3 ng/kg bw per day in toddlers, for NDMA 28.1 ng/kg bw per day in toddlers, for NSAR 27.4 ng/kg bw per day in infants, for NPIP 18.9 ng/kg bw per day in toddlers, for NDEA 18.4 ng/kg bw per day in infants. The P95 UB dietary exposure estimates for the other N‐NAS were all below 10 ng/kg bw per day.
Appraising the contribution of the different compounds and the respective food groups to the total LB exposure is based on measured values not influenced by the percentage and magnitude of the left‐censored data. Graphs 1 and 2 show the absolute and relative contributions of the individual TCNAs to the total LB dietary exposure of infants, toddlers and adults across surveys for scenarios 1 and 2.
Graph 1.
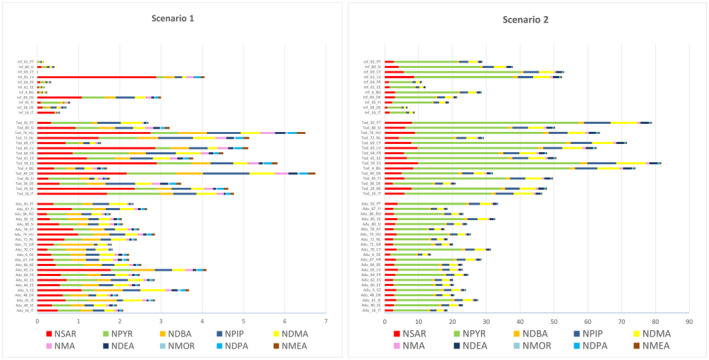
Mean LB dietary exposure to the individual TCNAs for infants, toddlers and adult surveys (ng/kg bw per day) for scenario 1 and 2
Graph 2.
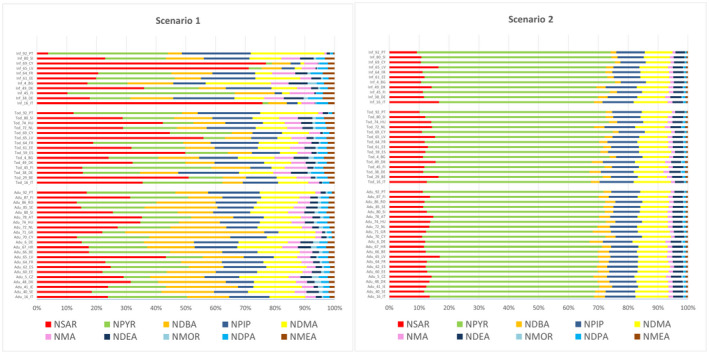
Percentage contribution to the mean LB dietary exposure of the individual TCNAs for infants, toddlers and adult surveys for scenarios 1 and 2
In scenario 1, the main contributor for most of the infant, adult and toddler surveys to the LB mean of the dietary exposure was NSAR (from 4% to 77%) while in scenario 2, it was NPYR (from 52% to 65%).
In scenario 1, five N‐NAs contributed to more than 80% of the mean LB dietary exposure to TCNAs in almost all of these surveys, namely NSAR, NPYR, NDBA, NPIP and NDMA.
In scenario 2, four N‐NAs contributed to more than 85% of the mean LB dietary exposure to TCNA in all of these surveys, namely NPYR, NSAR, NPIP and NDMA.
Graphs 3 shows the contribution of each food category at the level 1 of the Foodex2 classification to the mean LB dietary exposure to TCNAs across surveys for scenarios 1 and 2.
Graph 3.
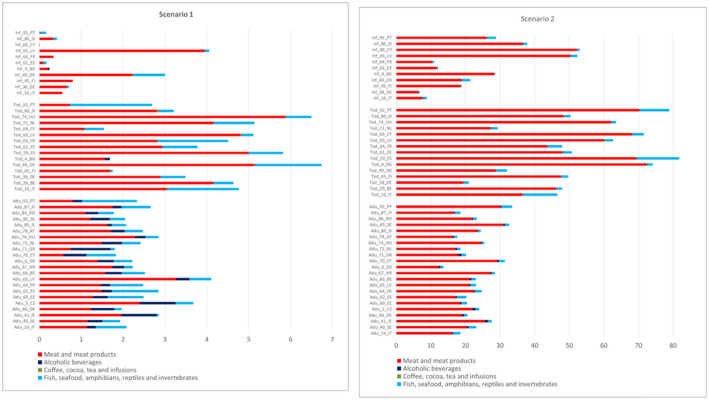
Contribution of each food category at the level 1 of the Foodex2 classification to the mean LB dietary exposure to TCNAs, across for infants, toddlers and adult surveys for scenarios 1 and 2 (ng/kg bw per day)
For both scenarios, at FoodEx2 level 1, meat and meat products was shown to be the main contributing food category to the TCNAs dietary exposure for all age groups. In scenario 1, meat and meat products accounts from 7% to 100% of the TCNA dietary exposure across surveys. In scenario 2, meat and meat products accounts from 20% to 99% of the TCNA dietary exposure across all surveys.
In scenario 2, cooked unprocessed meat contributed from 70% to 98% to the dietary exposure to TCNAs across surveys, while processed meat from less than 1% to 16%. Cooked unprocessed fish contributes from 1% to 18% while processed fish and seafood from less than 1% to 5%.
In scenario 1, ‘Fish, seafood, amphibians, reptiles and invertebrates’ (processed fish and seafood) was also a main contributing food category for all age groups, and ‘Alcoholic beverages’ (beer and unsweetened spirits and liqueurs) for adults, the elderly and the very elderly.
In scenario 1, ‘Fish, seafood, amphibians, reptiles and invertebrates’ (processed fish and seafood) contributed from 0 to 85% to the TCNA dietary exposure across surveys. ‘Alcoholic beverages’ (beer and unsweetened spirits and liqueurs) contributed from 0% to 59% to the TCNA dietary exposure across surveys.
For the individual compounds, in both scenarios, the main contributing food category at the Foodex2 level 1 was meat and meat products for all N‐NAs. ‘Alcoholic beverages’ (beer and unsweetened spirits and liqueurs) was also a main contributor for NDBA, NDMA and NMOR in adolescents, adults, elderly and very elderly in both scenarios. ‘Fish, seafood, amphibians, reptiles and invertebrates’ (processed fish and seafood categories only) was also a main contributor in scenario 1 for NDMA, NPIP and NPYR in all age groups and for NDEA in adults, the elderly and the very elderly and in scenario 2 for NDMA and NPIP in all age groups.
Table 23 shows the total number of surveys across all age groups in which each food category contributed more than 10% to the dietary exposure of each individual N‐NA and to the total TCNAs in the two scenarios. Details of the number of surveys per contribution class at the level 1 of the foodex 2 classification for each age class for the two scenarios are given in Table C.9 and C.10 of Annex C.
Table 23.
Number of surveys (out of 121) across all age groups in which each food category contributed more than 10% to the LB dietary exposure of each individual N‐NAs and to the TCNAs in the two scenarios
| Scenario 1 | Scenario 2 | |||||||||
|---|---|---|---|---|---|---|---|---|---|---|
| N‐NAs | Alcoholic beverages | Coffee, cocoa, tea and infusions | Fish, seafood, amphibians, reptiles and invertebrates | Meat and meat products | Seasoning, sauces and condiments | Alcoholic beverages | Coffee, cocoa, tea and infusions | Fish, seafood, amphibians, reptiles and invertebrates | Meat and meat products | Seasoning, sauces and condiments |
| NDBA | 62 | 27 | 117 | 52 | 33 | 121 | ||||
| NDEA | 27 | 71 | 121 | 0 | 0 | 121 | ||||
| NDMA | 59 | 0 | 108 | 115 | 1 | 6 | 0 | 96 | 121 | 0 |
| NDPA | 121 | 121 | ||||||||
| NMA | 121 | 121 | ||||||||
| NMEA | 121 | 121 | ||||||||
| NMOR | 66 | 121 | 51 | 121 | ||||||
| NPIP | 1 | 109 | 121 | 0 | 88 | 121 | ||||
| NPYR | 1 | 108 | 116 | 0 | 10 | 121 | ||||
| NSAR | 121 | 121 | ||||||||
| TCNAs | 41 | 0 | 89 | 121 | 0 | 0 | 0 | 23 | 121 | 0 |
Detail contributions of food categories at the foodex2 level 3 classification for the two scenarios are given in Table C.11 and C.12 of Annex C. Ranges of contribution across surveys for food categories reclassified based on their included subcategories (e.g. processed vs. unprocessed meat and fish) for each age class in each scenario are detailed in Table C.13 in Annex C.
It is to be noted that meat and meat products was the only food category for which data were available for NDPA, NMA, NMEA and NSAR.
As described in Section 3.3.1, for both scenarios, the following food categories were not included in the dietary exposure assessment of any of the N‐NAs due to lack of occurrence data: ‘Fruit and fruit products’; fruit and vegetable juices and nectars (including concentrates); grains and grain‐based products; legumes, nuts, oilseeds and spices; milk and dairy products; starchy roots or tubers and products thereof; sugar plants; vegetables and vegetable products; water and water‐based beverages.
3.4. Risk characterisation
As explained in Section 3.1.8, the CONTAM Panel selected the BMDL10 of 10 μg/kg bw per day for the induction of any liver tumour (benign and malignant tumours combined) in female rats as a reference point for the risk characterisation of the NDEA, but also of the TCNAs, by applying a conservative approach in which the same potency has been attributed to all of them.
Comparison of the chronic dietary exposure to NDEA and to TCNAs and across dietary surveys and age groups for the scenarios 1 and 2 reported in Section 3.3.2 (Tables 19, 20, 21, 22–22) to the BMDL10 of 10 μg/kg bw per day, results in the MOE values presented in Tables 24, 25, 26, 27–27.
Table 24.
Margin of exposure (MOE) values based on the mean dietary exposure to N‐NAs for the incidence of any liver cancer across dietary surveys and age groups for scenario 1
|
Mean |
Infants (11) | Toddlers (15) | Children (19) | Adolescents (21) | Adults (22) | Elderly (19) | Very elderly (14) | |||||||||||||||
|---|---|---|---|---|---|---|---|---|---|---|---|---|---|---|---|---|---|---|---|---|---|---|
| LB | MB | UB | LB | MB | UB | LB | MB | UB | LB | MB | UB | LB | MB | UB | LB | MB | UB | LB | MB | UB | ||
| NDMA | Min | 7.2E+07 | 8.1E+06 | 4.3E+06 | 1.3E+05 | 2.2E+04 | 1.3E+04 | 1.5E+05 | 1.8E+04 | 9,305 | 1.1E+05 | 2.9E+04 | 1.6E+04 | 4.5E+04 | 2.6E+04 | 1.9E+04 | 6.7E+04 | 4.7E+04 | 3.7E+04 | 1.2E+05 | 2.8E+04 | 2.2E+04 |
| Max | 3.9E+04 | 6,140 | 3,089 | 1.6E+04 | 3,822 | 1,940 | 1.2E+04 | 3,808 | 2,064 | 2.2E+04 | 4,754 | 2,582 | 1.6E+04 | 7,125 | 4,085 | 2.5E+04 | 8,501 | 4,900 | 2.3E+04 | 7,223 | 4,058 | |
| NMEA | Min | 4.3E+07 | 4.3E+07 | 4.3E+07 | 4.7E+05 | 4.7E+05 | 4.7E+05 | 5.9E+05 | 5.9E+05 | 5.9E+05 | 3.4E+05 | 3.4E+05 | 3.4E+05 | 5.8E+05 | 5.8E+05 | 5.8E+05 | 1.3E+06 | 1.3E+06 | 1.3E+06 | 1.0E+06 | 1.0E+06 | 1.0E+06 |
| Max | 1.1E+05 | 1.1E+05 | 1.1E+05 | 4.9E+04 | 4.9E+04 | 4.9E+04 | 5.4E+04 | 5.4E+04 | 5.4E+04 | 9.2E+04 | 9.2E+04 | 9.2E+04 | 1.1E+05 | 1.1E+05 | 1.1E+05 | 1.2E+05 | 1.2E+05 | 1.2E+05 | 1.2E+05 | 1.1E+05 | 1.2E+05 | |
| NDEA | Min | 6.4E+08 | 2.8E+06 | 2.5E+06 | 8.1E+05 | 1.3E+05 | 8.4E+04 | 6.3E+05 | 2.4E+05 | 1.5E+05 | 6.7E+05 | 6.4E+04 | 3.9E+04 | 5.5E+05 | 3.8E+04 | 2.1E+04 | 1.1E+06 | 8.2E+04 | 4.2E+04 | 4.8E+05 | 7.6E+04 | 4.1E+04 |
| Max | 1.4E+05 | 7,315 | 3,681 | 4.0E+04 | 7,488 | 3,887 | 4.3E+04 | 6,897 | 3,621 | 7.9E+04 | 1.0E+04 | 5,371 | 7.0E+04 | 8,231 | 4,372 | 1.1E+05 | 9,167 | 4,724 | 1.1E+05 | 8,331 | 4,233 | |
| NDPA | Min | 3.3E+07 | 1.5E+07 | 9.3E+06 | 3.3E+05 | 1.3E+05 | 8.4E+04 | 5.7E+05 | 1.8E+05 | 1.1E+05 | 2.7E+05 | 1.0E+05 | 6.6E+04 | 5.3E+05 | 1.8E+05 | 1.1E+05 | 1.1E+06 | 4.0E+05 | 2.4E+05 | 6.4E+05 | 3.0E+05 | 2.0E+05 |
| Max | 7.5E+04 | 3.5E+04 | 2.3E+04 | 4.6E+04 | 1.4E+04 | 8,078 | 4.8E+04 | 1.5E+04 | 8,881 | 6.76E+04 | 2.6E+04 | 1.6E+04 | 7.5E+04 | 3.2E+04 | 2.0E+04 | 8.2E+04 | 3.6E+04 | 2.3E+04 | 7.8E+04 | 3.5E+04 | 2.2E+04 | |
| NDBA | Min | 1.5E+07 | 1.5E+07 | 1.5E+07 | 9.2E+04 | 9.2E+04 | 9.2E+04 | 1.5E+05 | 1.5E+05 | 1.5E+05 | 6.9E+04 | 6.5E+04 | 6.4E+04 | 4.1E+04 | 2.8E+04 | 2.3E+04 | 6.1E+04 | 5.4E+04 | 5.0E+04 | 8.2E+04 | 7.0E+04 | 6.8E+04 |
| Max | 3.7E+04 | 3.7E+04 | 3.7E+04 | 1.4E+04 | 1.4E+04 | 1.4E+04 | 1.6E+04 | 1.6E+04 | 1.6E+04 | 2.5E+04 | 2.2E+04 | 1.7E+04 | 1.2E+04 | 7,444 | 4,972 | 1.2E+04 | 9,304 | 7,102 | 7,550 | 6,198 | 5,258 | |
| NMA | Min | 2.1E+07 | 2.1E+07 | 2.0E+07 | 2.5E+05 | 2.5E+05 | 2.5E+05 | 2.9E+05 | 2.9E+05 | 2.9E+05 | 1.6E+05 | 1.6E+05 | 1.6E+05 | 2.7E+05 | 2.7E+05 | 2.7E+05 | 6.1E+05 | 6.1E+05 | 6.1E+05 | 5.7E+05 | 5.7E+05 | 5.7E+05 |
| Max | 5.2E+04 | 5.2E+04 | 5.2E+04 | 2.8E+04 | 2.8E+04 | 2.8E+04 | 3.1E+04 | 3.1E+04 | 3.1E+04 | 5.0E+04 | 5.0E+04 | 5.0E+04 | 5.5E+04 | 5.5E+04 | 5.5E+04 | 6.1E+04 | 6.1E+04 | 6.1E+04 | 5.4E+04 | 5.4E+04 | 5.4E+04 | |
| NSAR | Min | 1.7E+06 | 1.7E+06 | 1.7E+06 | 3.7E+04 | 3.7E+04 | 3.7E+04 | 1.6E+05 | 1.6E+05 | 1.6E+05 | 3.7E+04 | 3.7E+04 | 3.7E+04 | 4.2E+04 | 4.2E+04 | 4.2E+04 | 8.5E+04 | 8.5E+04 | 8.5E+04 | 6.8E+04 | 6.8E+04 | 6.8E+04 |
| Max | 3,465 | 3,465 | 3,465 | 3,450 | 3,450 | 3,450 | 3,368 | 3,368 | 3,368 | 5,159 | 5,159 | 5,159 | 5,620 | 5,620 | 5,620 | 5,372 | 5,372 | 5,372 | 5,454 | 5,454 | 5,454 | |
| NMOR | Min | 2.7E+08 | 2.7E+08 | 2.8E+08 | 2.4E+06 | 2.4E+06 | 2.4E+06 | 3.4E+06 | 3.0E+06 | 2.6E+06 | 1.9E+06 | 1.1E+06 | 8.2E+05 | 8.0E+05 | 1.2E+05 | 6.7E+04 | 2.0E+06 | 3.9E+05 | 2.2E+05 | 2.6E+06 | 9.7E+05 | 6.0E+05 |
| Max | 4.9E+05 | 1.6E+05 | 8.6E+04 | 1.6E+05 | 6.2E+04 | 3.4E+04 | 1.7E+05 | 7.0E+04 | 4.0E+04 | 2.8E+05 | 6.1E+04 | 3.4E+04 | 1.2E+05 | 1.2E+04 | 6,481 | 2.2E+05 | 2.4E+04 | 1.3E+04 | 2.5E+05 | 2.8E+04 | 1.5E+04 | |
| NPIP | Min | 2.9E+07 | 1.3E+07 | 8.7E+06 | 8.0E+04 | 4.9E+04 | 4.0E+04 | 9.4E+04 | 7.5E+04 | 6.2E+04 | 1.0E+05 | 6.9E+04 | 5.2E+04 | 1.2E+05 | 8.6E+04 | 6.9E+04 | 1.5E+05 | 1.2E+05 | 1.1E+05 | 1.4E+05 | 9.1E+04 | 6.9E+04 |
| Max | 2.2E+04 | 1.8E+04 | 1.5E+04 | 8,906 | 7,209 | 6,055 | 1.1E+04 | 9,420 | 7,411 | 1.8E+04 | 1.5E+04 | 1.2E+04 | 2.3E+04 | 1.8E+04 | 1.4E+04 | 2.7E+04 | 2.0E+04 | 1.6E+04 | 3.2E+04 | 2.5E+04 | 1.9E+04 | |
| NPYR | Min | 4.7E+07 | 4.7E+07 | 4.8E+07 | 3.5E+04 | 2.4E+04 | 1.9E+04 | 3.5E+04 | 2.6E+04 | 2.1E+04 | 6.8E+04 | 3.9E+04 | 2.7E+04 | 7.2E+04 | 4.2E+04 | 2.9E+04 | 1.1E+05 | 7.3E+04 | 5.6E+04 | 2.5E+05 | 4.7E+04 | 2.6E+04 |
| Max | 1.8E+04 | 6,018 | 3,609 | 7,345 | 2,847 | 1,713 | 6,674 | 4,366 | 2,497 | 1.1E+04 | 6,800 | 4,421 | 1.3E+04 | 8,523 | 5,237 | 1.7E+04 | 9,359 | 5,766 | 1.3E+04 | 9,097 | 5,361 | |
| TCNAs | Min | 9.5E+05 | 6.3E+05 | 4.7E+05 | 6,481 | 4,091 | 2,989 | 1.5E+04 | 7,329 | 4,872 | 7,169 | 4,378 | 3,151 | 5,616 | 3,811 | 2,903 | 8,732 | 6,856 | 5,644 | 1.0+04 | 5,837 | 4,874 |
| Max | 2,466 | 1,514 | 1,092 | 1,483 | 8.4E+02 | 581 | 1,678 | 930 | 644 | 2,252 | 1,259 | 874 | 2,435 | 1,265 | 825 | 2,570 | 1,530 | 1,089 | 3,160 | 1,594 | 1,056 | |
| TCNAs with PF | Min | 4.2E+06 | 1.4E+06 | 8.2E+05 | 2.2E+04 | 8,387 | 5,687 | 4.6E+04 | 1.3E+04 | 7,457 | 2.5E+04 | 9,098 | 5,537 | 17,241 | 8,402 | 5,555 | 2.7E+04 | 1.7E+04 | 1.2E+04 | 3.0E+04 | 1.3E+04 | 9,708 |
| Max | 1.0E+04 | 3,171 | 1,880 | 4,544 | 1,859 | 1,098 | 5,348 | 1,855 | 1,109 | 7,609 | 2,447 | 1,458 | 6,779 | 2,335 | 1,411 | 8,608 | 3,230 | 1,988 | 9,253 | 3,247 | 1,864 | |
Table 25.
Margin of exposure (MOE) values based on the P95 chronic dietary exposure to N‐NAs for the incidence of any liver cancer across dietary surveys and age groups for scenario 1
| P95 | Infants (9)* | Toddlers (13) | Children (19) | Adolescents (20) | Adults (22) | Elderly (19) | Very elderly (10) | |||||||||||||||
|---|---|---|---|---|---|---|---|---|---|---|---|---|---|---|---|---|---|---|---|---|---|---|
| LB | MB | UB | LB | MB | UB | LB | MB | UB | LB | MB | UB | LB | MB | UB | LB | MB | UB | LB | MB | UB | ||
| NDMA | Min | – | – | – | 3.0E+04 | 4,006 | 2,295 | 3.6E+04 | 4,136 | 2251 | 2.9E+04 | 9,127 | 5,195 | 1.1E+04 | 6,878 | 4,781 | 1.4E+04 | 8,818 | 7,156 | 4.9E+04 | 8,828 | 6,314 |
| Max | 9,049 | 1,481 | 744 | 2,802 | 882 | 471 | 2,647 | 1,310 | 669 | 5,307 | 1,599 | 842 | 4,429 | 2,236 | 1,217 | 6,284 | 2,580 | 1,299 | 6,163 | 1,614 | 811 | |
| NMEA | Min | – | – | – | 8.2E+04 | 8.2E+04 | 8.2E+04 | 1.2E+05 | 1.2E+05 | 1.2E+05 | 9.9E+04 | 9.9E+04 | 9.9E+04 | 1.4E+05 | 1.4E+05 | 1.4E+05 | 2.0E+05 | 2.0E+05 | 2.0E+05 | 2.2E+05 | 2.2E+05 | 2.2E+05 |
| Max | 1.8E+04 | 1.8E+04 | 1.8E+04 | 1.8E+04 | 1.8E+04 | 1.8E+04 | 2.0E+04 | 2.0E+04 | 2.0E+04 | 3.2E+04 | 3.2E+04 | 3.2E+04 | 3.5E+04 | 3.5E+04 | 3.5E+04 | 3.7E+04 | 3.7E+04 | 3.7E+04 | 5.4E+04 | 5.4E+04 | 5.4E+04 | |
| NDEA | Min | – | – | – | 1.6E+05 | 2.3E+04 | 2.3E+04 | 8.8E+04 | 5.0E+04 | 4.4E+04 | 1.1E+05 | 1.5E+04 | 8,505 | 1.1E+05 | 9,542 | 4,832 | 1.5E+05 | 1.6E+04 | 7,856 | 1.1E+05 | 1.7E+04 | 8,745 |
| Max | 3.1E+04 | 1,165 | 584 | 1.2E+04 | 1,633 | 818 | 1.4E+04 | 1,841 | 940 | 2.3E+04 | 2,721 | 1,389 | 2.1E+04 | 2,362 | 1,221 | 3.4E+04 | 2,316 | 1,168 | 3.2E+04 | 3,527 | 1,768 | |
| NDPA | Min | – | – | – | 6.1E+04 | 2.5E+04 | 1.6E+04 | 9.9E+04 | 3.6E+04 | 2.2E+04 | 7.0E+04 | 3.2E+04 | 1.9E+04 | 1.1E+05 | 4.5E+04 | 2.8E+04 | 1.9E+05 | 6.2E+04 | 3.8E+04 | 1.2E+05 | 6.5E+04 | 4.1E+04 |
| Max | 1.2E+04 | 5,541 | 3,841 | 1.4E+04 | 4,927 | 2,734 | 1.5E+04 | 5,446 | 3,165 | 2.1E+04 | 8,564 | 5,178 | 2.2E+04 | 1.0E+04 | 6,325 | 2.1E+04 | 1.1E+04 | 7,098 | 3.2E+04 | 1.5E+04 | 9.9E+03 | |
| NDBA | Min | – | – | – | 2.0E+04 | 2.0E+04 | 2.0E+04 | 3.3E+04 | 3.3E+04 | 3.3E+04 | 2.8E+04 | 2.5E+04 | 2.5E+04 | 1.4E+04 | 7.6E+03 | 5.6E+03 | 2.2E+04 | 1.5E+04 | 1.2E+04 | 3.1E+04 | 2.8E+04 | 2.2E+04 |
| Max | 6,025 | 6,025 | 6,025 | 5,284 | 5,284 | 4,500 | 5,668 | 5,668 | 5,011 | 8,661 | 6,702 | 4,154 | 1,997 | 1,816 | 1,184 | 2,075 | 2,008 | 1,875 | 1,825 | 1,573 | 1,382 | |
| NMA | Min | – | – | – | 4.4E+04 | 4.4E+04 | 4.4E+04 | 6.0E+04 | 6.0E+04 | 6.0E+04 | 4.7E+04 | 4.7E+04 | 4.7E+04 | 7.1E+04 | 7.1E+04 | 7.1E+04 | 1.2E+05 | 1.2E+05 | 1.2E+05 | 1.3E+05 | 1.3E+05 | 1.3E+05 |
| Max | 8,696 | 8,696 | 8,696 | 1.0E+04 | 1.0E+04 | 1.0E+04 | 1.1E+04 | 1.1E+04 | 1.1E+04 | 1.6E+04 | 1.6E+04 | 1.6E+04 | 1.8E+04 | 1.8E+04 | 1.8E+04 | 1.8E+04 | 1.8E+04 | 1.8E+04 | 2.5E+04 | 2.5E+04 | 2.5E+04 | |
| NSAR | Min | – | – | – | 8,835 | 8,835 | 8,835 | 3.1E+04 | 3.1E+04 | 3.1E+04 | 1.0E+04 | 1.0E+04 | 1.0E+04 | 1.2E+04 | 1.2E+04 | 1.2E+04 | 1.2E+04 | 1.2E+04 | 1.2E+04 | 1.3E+04 | 1.3E+04 | 1.3E+04 |
| Max | 520 | 520 | 520 | 730 | 730 | 730 | 839 | 839 | 839 | 1,310 | 1,310 | 1,310 | 1,391 | 1,391 | 1,391 | 1,277 | 1,277 | 1,277 | 2,505 | 2,505 | 2,505 | |
| NMOR | Min | – | – | – | 4.3E+05 | 4.3E+05 | 4.3E+05 | 4.6E+05 | 4.6E+05 | 4.6E+05 | 4.8E+05 | 4.7E+05 | 4.7E+05 | 2.1E+05 | 2.2E+04 | 1.2E+04 | 3.7E+05 | 5.6E+04 | 3.0E+04 | 4.5E+05 | 3.6E+05 | 3.6E+05 |
| Max | 1.1E+05 | 1.1E+05 | 1.1E+05 | 5.1E+04 | 1.1E+04 | 5540 | 5.9E+04 | 1.1E+04 | 5,848 | 9.1E+04 | 1.3E+04 | 7,086 | 3.1E+04 | 2,787 | 1,459 | 5.4E+04 | 5,098 | 2,671 | 7.4E+04 | 7,256 | 3,816 | |
| NPIP | Min | – | – | – | 1.7E+04 | 9.6E+03 | 7.0E+03 | 1.7E+04 | 1.4E+04 | 1.2E+04 | 2.7E+04 | 2.0E+04 | 1.6E+04 | 2.2E+04 | 1.9E+04 | 1.6E+04 | 2.6E+04 | 2.5E+04 | 2.2E+04 | 3.1E+04 | 2.5E+04 | 1.8E+04 |
| Max | 5,333 | 4,477 | 3,403 | 2,576 | 2,576 | 2,347 | 2,619 | 2,593 | 2,486 | 4,770 | 4,560 | 4,053 | 5,971 | 5,477 | 4,609 | 6,832 | 6,343 | 4,950 | 8,994 | 8,300 | 7,444 | |
| NPYR | Min | – | – | – | 9,838 | 3,526 | 2,940 | 1.1E+04 | 5,730 | 4,282 | 1.8E+04 | 8,530 | 4,934 | 2.1E+04 | 9,285 | 6,482 | 1.9E+04 | 1.23E+04 | 8,539 | 6.7E+04 | 8,189 | 4,725 |
| Max | 4,448 | 1,601 | 924 | 1,258 | 1,095 | 753 | 1,430 | 1,360 | 890 | 2,642 | 2,222 | 1,398 | 3,191 | 2,306 | 1,372 | 3,758 | 2,876 | 1,817 | 3,248 | 2,515 | 1,496 | |
| TCNAs | Min | – | – | – | 1,523 | 803 | 580 | 3,242 | 1,639 | 1,129 | 2,290 | 1,396 | 1,036 | 2,089 | 1,012 | 771 | 2,727 | 1,398 | 1,022 | 3,337 | 1,789 | 1,563 |
| Max | 376 | 235 | 183 | 511 | 304 | 215 | 546 | 328 | 238 | 809 | 467 | 331 | 765 | 409 | 256 | 756 | 470 | 326 | 999 | 704 | 452 | |
| TCNAs with PF. | Min | – | – | – | 4,897 | 1,825 | 1,080 | 9,747 | 2,858 | 1,626 | 8,118 | 2,945 | 1,781 | 5,161 | 2,256 | 1,416 | 6,430 | 3,014 | 2,341 | 6,772 | 3,730 | 2,672 |
| Max | 1,614 | 520 | 320 | 1,445 | 599 | 338 | 1,527 | 674 | 408 | 2,655 | 920 | 533 | 2,194 | 705 | 414 | 2,600 | 974 | 568 | 3,546 | 1,354 | 756 | |
– indicates zero exposure.
Table 26.
Margin of exposure (MOE) values based on the mean exposure to N‐NAs for the incidence of any liver cancer across dietary surveys and age groups for scenario 2
| Mean | Infants (11) | Toddlers (15) | Children (19) | Adolescents (21) | Adults (22) | Elderly (19) | Very elderly (14) | |||||||||||||||
|---|---|---|---|---|---|---|---|---|---|---|---|---|---|---|---|---|---|---|---|---|---|---|
| LB | MB | UB | LB | MB | UB | LB | MB | UB | LB | MB | UB | LB | MB | UB | LB | MB | UB | LB | MB | UB | ||
| NDMA | Min | 1.6E+04 | 1.3E+04 | 1.1E+04 | 4,767 | 3,459 | 2,714 | 4,405 | 3,318 | 2,724 | 7,599 | 5,056 | 3,788 | 6,642 | 4,515 | 3,988 | 7,111 | 5,670 | 5,375 | 7,846 | 5,235 | 4,178 |
| Max | 1996 | 1738 | 1539 | 1,141 | 908 | 754 | 1,407 | 1,219 | 959 | 2,211 | 1,824 | 1,376 | 2,921 | 2,617 | 2,193 | 3,843 | 2,864 | 2,282 | 4,163 | 2,860 | 2,178 | |
| NMEA | Min | 1.7E+05 | 1.7E+05 | 1.7E+05 | 4.8E+04 | 4.8E+04 | 4.8E+04 | 4.9E+04 | 4.9E+04 | 4.9E+04 | 8.4E+04 | 8.4E+04 | 8.4E+04 | 8.7E+04 | 8.7E+04 | 8.7E+04 | 1.2E+05 | 1.2E+05 | 1.2E+05 | 1.1E+05 | 1.1E+05 | 1.1E+05 |
| Max | 2.7E+04 | 2.7E+04 | 2.7E+04 | 2.0E+04 | 2.0E+04 | 2.0E+04 | 2.2E+04 | 2.2E+04 | 2.2E+04 | 3.7E+04 | 3.7E+04 | 3.7E+04 | 4.8E+04 | 4.8E+04 | 4.8E+04 | 6.2E+04 | 6.2E+04 | 6.2E+04 | 5.1E+04 | 5.1E+04 | 5.1E+04 | |
| NDEA | Min | 3.9E+04 | 3.5E+04 | 3.1E+04 | 1.3E+04 | 1.1E+04 | 9,029 | 1.2E+04 | 9,755 | 8,275 | 2.1E+04 | 1.4E+04 | 1.1E+04 | 2.0E+04 | 1.1E+04 | 7,228 | 2.4E+04 | 1.4E+04 | 1.1E+04 | 2.5E+04 | 1.4E+04 | 9,685 |
| Max | 5,349 | 3,075 | 2,129 | 3,706 | 2,418 | 1,721 | 3,963 | 3,136 | 2,197 | 6,342 | 4,748 | 3,270 | 8,459 | 5,017 | 3,175 | 1.2E+04 | 6,046 | 3,662 | 1.2E+04 | 5,046 | 3,152 | |
| NDPA | Min | 1.5E+05 | 4.9E+04 | 2.9E+04 | 4.2E+04 | 1.3E+04 | 7,974 | 5.1E+04 | 1.5E+04 | 8,855 | 7.4E+04 | 2.4E+04 | 1.5E+04 | 8.2E+04 | 2.5E+04 | 1.5E+04 | 1.2E+05 | 3.7E+04 | 2.2E+04 | 1.0E+05 | 3.1E+04 | 1.8E+04 |
| Max | 2.5E+04 | 8,403 | 5,045 | 2.0E+04 | 5,880 | 3,450 | 2.2E+04 | 6,539 | 3,850 | 3.5E+04 | 1.1E+04 | 6,547 | 4.3E+04 | 1.4E+04 | 8,442 | 5.1E+04 | 1.8E+04 | 1.1E+04 | 4.3E+04 | 1.5E+04 | 9,362 | |
| NDBA | Min | 4.6E+04 | 4.6E+04 | 4.6E+04 | 1.3E+04 | 1.2E+04 | 1.2E+04 | 1.2E+04 | 1.2E+04 | 1.2E+04 | 1.8E+04 | 1.7E+04 | 1.6E+04 | 1.6E+04 | 1.3E+04 | 1.2E+04 | 1.9E+04 | 1.7E+04 | 1.7E+04 | 2.2E+04 | 2.0E+04 | 2.0E+04 |
| Max | 7,648 | 7,648 | 7,648 | 4,765 | 4,765 | 4,765 | 6,060 | 5,724 | 5,423 | 9,438 | 9,413 | 9,244 | 8,044 | 5,688 | 4,122 | 8,562 | 6,993 | 5,672 | 5,913 | 5,051 | 4,408 | |
| NMA | Min | 8.3E+04 | 8.3E+04 | 8.3E+04 | 2.4E+04 | 2.4E+04 | 2.4E+04 | 2.3E+04 | 2.3E+04 | 2.3E+04 | 4.1E+04 | 4.1E+04 | 4.1E+04 | 4.2E+04 | 4.2E+04 | 4.2E+04 | 5.2E+04 | 5.2E+04 | 5.2E+04 | 5.2E+04 | 5.2E+04 | 5.2E+04 |
| Max | 1.2E+04 | 1.2E+04 | 1.2E+04 | 9,463 | 9,463 | 9,463 | 9,952 | 9,952 | 9,952 | 1.6E+04 | 1.6E+04 | 1.6E+04 | 2.1E+04 | 2.1E+04 | 2.1E+04 | 2.6E+04 | 2.6E+04 | 2.6E+04 | 2.2E+04 | 2.2E+04 | 2.2E+04 | |
| NSAR | Min | 1.3E+04 | 1.3E+04 | 1.3E+04 | 4,194 | 4,194 | 4,194 | 3,871 | 3,871 | 3,871 | 6,201 | 6,201 | 6,201 | 6,118 | 6,118 | 6,118 | 6,870 | 6,870 | 6,870 | 7,882 | 7,882 | 7,882 |
| Max | 1,160 | 1,160 | 1,160 | 1,014 | 1,014 | 1,014 | 1,248 | 1,248 | 1,248 | 1,767 | 1,767 | 1,767 | 2,572 | 2,572 | 2,572 | 2,865 | 2,865 | 2,865 | 2,419 | 2,419 | 2,419 | |
| NMOR | Min | 6.8E+05 | 6.8E+05 | 6.8E+05 | 1.6E+05 | 1.6E+05 | 1.6E+05 | 2.0E+05 | 2.0E+05 | 2.0E+05 | 2.5E+05 | 2.3E+05 | 2.3E+05 | 2.7E+05 | 9.3E+04 | 5.7E+04 | 4.2E+05 | 2.0E+05 | 1.4E+05 | 3.9E+05 | 3.1E+05 | 2.6E+05 |
| Max | 1.2E+05 | 1.0E+05 | 6.5E+04 | 7.2E+04 | 3.9E+04 | 2.6E+04 | 7.8E+04 | 4.3E+04 | 3.0E+04 | 1.3E+05 | 5.6E+04 | 3.2E+04 | 8.7E+04 | 1.2E+04 | 6.4E+03 | 1.5E+05 | 2.3E+04 | 1.3E+04 | 1.6E+05 | 2.7E+04 | 1.4E+04 | |
| NPIP | Min | 1.5E+04 | 1.4E+04 | 1.3E+04 | 4,333 | 4,030 | 3,766 | 4,084 | 3,832 | 3,610 | 7,659 | 7,235 | 6,856 | 7,387 | 6,983 | 6,621 | 8,066 | 7,610 | 7,203 | 8,571 | 8,092 | 7,663 |
| Max | 2,196 | 2,120 | 2,049 | 1,174 | 1,143 | 1,113 | 1,448 | 1,429 | 1,410 | 2,268 | 2,233 | 2,199 | 3,095 | 3,056 | 3,018 | 4,366 | 4,286 | 4,141 | 4,208 | 4,079 | 3,958 | |
| NPYR | Min | 2,539 | 2,347 | 2,182 | 856 | 769 | 698 | 779 | 709 | 650 | 1,378 | 1,277 | 1,190 | 1,331 | 1,243 | 1,166 | 1,561 | 1,448 | 1,350 | 1,682 | 1,562 | 1,458 |
| Max | 290 | 290 | 290 | 203 | 201 | 199 | 233 | 230 | 228 | 347 | 344 | 341 | 494 | 488 | 483 | 744 | 728 | 714 | 656 | 623 | 593 | |
| TCNAs | Min | 1,479 | 1,343 | 1,230 | 476 | 417 | 371 | 439 | 390 | 350 | 765 | 661 | 582 | 733 | 610 | 523 | 836 | 687 | 600 | 914 | 767 | 660 |
| Max | 189 | 180 | 169 | 122 | 114 | 107 | 142 | 136 | 131 | 212 | 203 | 195 | 299 | 284 | 268 | 420 | 377 | 341 | 389 | 343 | 306 | |
| TCNAs with PF | Min | 4,574 | 4,072 | 3,669 | 1,356 | 1,149 | 996 | 1,318 | 1,124 | 979 | 2,296 | 1,797 | 1,476 | 2,276 | 1,619 | 1,406 | 2,564 | 2,169 | 2,015 | 2,785 | 2,030 | 1,623 |
| Max | 696 | 598 | 525 | 474 | 400 | 345 | 538 | 484 | 430 | 870 | 781 | 637 | 1,138 | 949 | 738 | 1,423 | 1,115 | 917 | 1,443 | 1,085 | 866 | |
Table 27.
Margin of exposure (MOE) values based on the P95 chronic dietary exposure to N‐NAs for the incidence of any liver cancer across dietary surveys and age groups for scenario 2
| P95 | Infants (9) | Toddlers (13) | Children (19) | Adolescents (20) | Adults (22) | Elderly (19) | Very elderly (10) | |||||||||||||||
|---|---|---|---|---|---|---|---|---|---|---|---|---|---|---|---|---|---|---|---|---|---|---|
| LB | MB | UB | LB | MB | UB | LB | MB | UB | LB | MB | UB | LB | MB | UB | LB | MB | UB | LB | MB | UB | ||
| NDMA | Min | 3,263 | 2,700 | 2,608 | 1,809 | 1,438 | 1,042 | 1,809 | 1,535 | 1,222 | 2,543 | 1,772 | 1,523 | 2,530 | 2,021 | 1,636 | 3,139 | 2,423 | 2,396 | 3,122 | 2,483 | 2,115 |
| Max | 615 | 615 | 500 | 536 | 447 | 356 | 704 | 598 | 437 | 1,052 | 911 | 616 | 1,285 | 1,149 | 947 | 1,850 | 1,368 | 1,008 | 1,826 | 1,266 | 756 | |
| NMEA | Min | 4.1E+04 | 4.1E+04 | 4.1E+04 | 1.9E+04 | 1.9E+04 | 1.9E+04 | 2.3E+04 | 2.3E+04 | 2.3E+04 | 3.1E+04 | 3.1E+04 | 3.1E+04 | 3.9E+04 | 3.9E+04 | 3.9E+04 | 4.7E+04 | 4.7E+04 | 4.7E+04 | 4.7E+04 | 4.7E+04 | 4.7E+04 |
| Max | 9,771 | 9,771 | 9,771 | 9,251 | 9,251 | 9,251 | 1.1E+04 | 1.1E+04 | 1.1E+04 | 1.7E+04 | 1.7E+04 | 1.7E+04 | 2.1E+04 | 2.1E+04 | 2.1E+04 | 2.8E+04 | 2.8E+04 | 2.8E+04 | 3.0E+04 | 3.0E+04 | 3.0E+04 | |
| NDEA | Min | 9,220 | 8,224 | 7,344 | 4,706 | 4,058 | 3,324 | 4,962 | 3,994 | 3,364 | 6,702 | 4,564 | 3,236 | 7,587 | 4,548 | 2,896 | 9,825 | 6,046 | 3,553 | 9,024 | 6,251 | 4,228 |
| Max | 1,482 | 873 | 543 | 1,482 | 1,043 | 704 | 1,841 | 1,313 | 810 | 2,799 | 2,086 | 1,209 | 3,218 | 1,885 | 1,072 | 5,239 | 2,172 | 1,118 | 5,122 | 3,135 | 2,193 | |
| NDPA | Min | 3.2E+04 | 1.1E+04 | 6,345 | 1.7E+04 | 5,241 | 3,133 | 2.2E+04 | 6,333 | 3,736 | 2.8E+04 | 9,068 | 5,374 | 3.6E+04 | 1.2E+04 | 6,831 | 4.4E+04 | 1.4E+04 | 8,481 | 4.9E+04 | 1.4E+04 | 8,543 |
| Max | 8,497 | 2,982 | 1,747 | 8,255 | 2,784 | 1,625 | 1.0E+04 | 3,325 | 1,916 | 1.6E+04 | 5,105 | 3,000 | 1.7E+04 | 6,325 | 3,705 | 1.9E+04 | 8,401 | 4,982 | 2.9E+04 | 8,817 | 5,166 | |
| NDBA | Min | 1.1E+04 | 1.1E+04 | 1.1E+04 | 5,291 | 5,237 | 4,828 | 6,229 | 6,040 | 5,530 | 8,228 | 8,228 | 8,228 | 7,565 | 5,607 | 4,465 | 9,185 | 8,973 | 8,058 | 1.2E+04 | 1.2E+04 | 1.1E+04 |
| Max | 2,802 | 2,802 | 2,802 | 2,428 | 2,428 | 2,428 | 3,163 | 2,993 | 2,702 | 4,499 | 4,489 | 3,850 | 1,811 | 1,708 | 1,113 | 1,940 | 1,821 | 1,708 | 2,143 | 2,110 | 1,992 | |
| NMA | Min | 1.9E+04 | 1.9E+04 | 1.9E+04 | 9,943 | 9,943 | 9,943 | 1.1E+04 | 1.1E+04 | 1.1E+04 | 1.5E+04 | 1.5E+04 | 1.5E+04 | 1.7E+04 | 1.7E+04 | 1.7E+04 | 2.1E+04 | 2.1E+04 | 2.1E+04 | 2.2E+04 | 2.2E+04 | 2.2E+04 |
| Max | 4,169 | 4,169 | 4,169 | 4,024 | 4,024 | 4,024 | 4,991 | 4,991 | 4,991 | 7,377 | 7,377 | 7,377 | 9,106 | 9,106 | 9,106 | 1.2E+04 | 1.2E+04 | 1.2E+04 | 1.4E+04 | 1.4E+04 | 1.4E+04 | |
| NSAR | Min | 2,964 | 2,964 | 2,964 | 1,483 | 1,483 | 1,483 | 1,645 | 1,645 | 1,645 | 2,001 | 2,001 | 2,001 | 2,161 | 2,161 | 2,161 | 2,491 | 2,491 | 2,491 | 2,809 | 2,809 | 2,809 |
| Max | 364 | 364 | 364 | 425 | 425 | 425 | 544 | 544 | 544 | 794 | 794 | 794 | 959 | 959 | 959 | 1,025 | 1,025 | 1,025 | 1,507 | 1,507 | 1,507 | |
| NMOR | Min | 1.3E+05 | 1.3E+05 | 1.3E+05 | 6.0E+04 | 6.0E+04 | 5.9E+04 | 8.2E+04 | 8.2E+04 | 8.2E+04 | 1.2E+05 | 1.1E+05 | 1.1E+05 | 1.2E+05 | 2.1E+04 | 1.1E+04 | 1.5E+05 | 4.6E+04 | 2.5E+04 | 1.9E+05 | 1.8E+05 | 1.8E+05 |
| Max | 3.9E+04 | 3.9E+04 | 3.9E+04 | 3.3E+04 | 1.0E+04 | 5,384 | 3.9E+04 | 1.0E+04 | 5,686 | 6.1E+04 | 1.3E+04 | 7,001 | 2.7E+04 | 2,778 | 1,457 | 4.9E+04 | 5,071 | 2,663 | 7.0E+04 | 7,851 | 4,201 | |
| NPIP | Min | 3,292 | 3,198 | 3,109 | 1,683 | 1,614 | 1,522 | 1,772 | 1,689 | 1,649 | 2,702 | 2,590 | 2,523 | 2,961 | 2,898 | 2,860 | 3,433 | 3,216 | 3,136 | 3,573 | 3,477 | 3,310 |
| Max | 643 | 643 | 643 | 529 | 529 | 529 | 732 | 722 | 706 | 1,065 | 1,061 | 1,056 | 1,389 | 1,381 | 1,369 | 1,999 | 1,999 | 1,987 | 2,017 | 2,017 | 2,017 | |
| NPYR | Min | 494 | 494 | 471 | 285 | 267 | 248 | 283 | 270 | 264 | 414 | 399 | 384 | 453 | 440 | 429 | 528 | 512 | 504 | 541 | 525 | 520 |
| Max | 79 | 79 | 79 | 79 | 79 | 79 | 99 | 99 | 99 | 149 | 149 | 148 | 197 | 197 | 196 | 268 | 267 | 267 | 290 | 290 | 290 | |
| TCNAs | Min | 320 | 311 | 288 | 166 | 150 | 140 | 171 | 158 | 147 | 250 | 229 | 210 | 269 | 250 | 233 | 314 | 296 | 254 | 322 | 302 | 273 |
| Max | 52 | 51 | 51 | 51 | 50 | 48 | 64 | 63 | 61 | 95 | 93 | 89 | 125 | 119 | 114 | 169 | 167 | 163 | 180 | 178 | 171 | |
| TCNAs with PF | Min | 967 | 925 | 750 | 544 | 489 | 425 | 623 | 529 | 453 | 835 | 661 | 575 | 956 | 784 | 621 | 1,138 | 864 | 779 | 1,175 | 981 | 819 |
| Max | 220 | 215 | 184 | 219 | 199 | 159 | 276 | 245 | 208 | 398 | 370 | 323 | 453 | 397 | 296 | 721 | 592 | 447 | 750 | 641 | 505 | |
At the mean exposure, in the scenario 1, the MOEs ranges (maximum–minimum) obtained were from 6.4 × 10⁸ – 4 × 10⁴ (LB) and from 2.5 × 10⁶ – 3,621 (UB) for NDEA. For TCNAs, MOEs were 9.5 × 10⁵ – 1,483 (LB) and 4.7 × 10⁵ – 581 (UB).
In the scenario 2, the MOEs were 3.9 × 10⁴ – 3,706 (LB) and 3.1 × 10⁴ – 1,721 (UB) for NDEA. For TCNAs, the MOEs were 1,479 – 122 (LB) and 1,230 − 107 (UB) for TCNAs.
At the P95 exposure, excluding some infant surveys with P95 exposure equal to zero, in scenario 1, the MOE ranges (maximum‐minimum) obtained were 1.6 × 10⁵ – 1.2 × 10⁴ (LB) and 4.4 × 10⁴ – 584 (UB) for NDEA. For TCNAs the MOEs were 3,337 ‐ 376 (LB) and 1,563 − 183 (UB). In scenario 2, the MOEs were 9,825 – 1,492 (LB) and 7,344 – 543 (UB) for NDEA. For TCNAs the MOEs were 322 – 51 (LB) and 288 – 48 (UB).
For substances that are both genotoxic and carcinogenic, the EFSA Scientific Committee stated that an MOE of 10,000 or higher, if based on the BMDL10 from an animal carcinogenicity study, would be of low concern from a public health point of view (EFSA, 2005). Considering the TCNAs, most of the MOEs are lower than 10,000 for both exposure scenarios which raises a health concern for all age groups. According to the two scenarios, the MOEs for toddlers, infants and adolescents are lower compared to other age groups.
Even in an alternative scenario attributing a potency factor of 0.2 to NDBA, NDPA, NMA, NPYR, NPIP and NSAR (Section 3.1.8), most of the MOEs for the TCNAs would remain lower than 10,000 in both exposure scenarios.
3.5. Uncertainty analysis
The purpose of the uncertainty analysis is to identify and quantify the major uncertainties of the risk assessment and combine them to assess the overall certainty of the final conclusion, as recommended in EFSA's guidance on uncertainty analysis (EFSA Scientific Committee, 2018a). In a first step, sources of uncertainties related to hazard identification and characterisation and exposure to N‐NAs were listed and discussed (Appendix G). Subsequently, it was considered which of those sources of uncertainty would have most impact on the outcome of the hazard identification and characterisation and the exposure estimations. The potential impact of the most important uncertainties affecting the exposure assessment was explored by sensitivity analysis using a simplified exposure model. Results from this were used to inform expert judgements of the combined impact of all uncertainties affecting the exposure assessment, expressed as probability bounds,24 using the semi‐formal structured methods of Expert Knowledge Elicitation (semi‐formal EKE, Annex B.8 of EFSA Scientific Committee (2018b)). The combined impact of all uncertainties affecting the hazard assessment was also quantified using probability bounds, elicited by semi‐formal EKE. The probability bounds for exposure and hazard were then combined by probability bounds analysis (Section 14.1 of EFSA Scientific Committee, 2018a) to quantify their combined impact on risk characterisation, expressed as lower and upper probability bounds for the MOE. These calculated probabilities were then submitted to a final step, in which the assessors checked for any other identifiable sources of uncertainty, to arrive at their assessment of overall uncertainty for the final conclusions, expressed as bounded probabilities for the MOE being less than 10,000. The protocol for an Expert Knowledge Elicitation on the Uncertainty of the Risk Assessment of N‐NAs in Food describes the detailed evidence and documents the results of the EKEs (Annex E).
3.5.1. Objectives of the uncertainty analysis
Assessments must say what sources of uncertainty have been identified and characterise their overall impact on the assessment conclusion. It is recommended to quantify the overall uncertainty of conclusions using probability to avoid the ambiguity of qualitative approaches. However, the conclusions may subsequently be reported without probabilities if legislation or risk managers require that, providing that the associated probabilities are somewhere defined (EFSA Scientific Committee, 2018a). The present uncertainty analysis was conducted with the objective to address the risk assessment question on the risks for human health related to the presence of N‐NAs in food.
The risk for human health in CONTAM opinions for substances that are genotoxic and carcinogenic is addressed by assessing whether the MOE exceeds the value of 10,000 when either the mean or the 95th percentile of the daily exposures is considered. Risk managers have indicated that the P95 exposure is more important for decision‐making, in order to protect the majority of the population. The uncertainty analysis therefore focussed on the MOE for the P95 exposure.
Specifically, the uncertainty analysis assessed the probability that the MOE for the 95th percentile of exposure in the EU population would be below 10,000, if all identified uncertainties affecting the exposure assessment, hazard assessment and risk characterisation were resolved.
The MoE is calculated as the ratio of the reference point and the P95 exposure estimate for the EU population in each age group. The uncertainties pertaining to each of these two components were identified and quantified separately and combined for the overall uncertainty assessment.
The uncertainty analysis focused on NDEA, because it is the N‐NA inducing tumours at the lowest reference point for liver tumour induction, and sufficient data are available for this N‐NA. The analysis focussed mainly on the exposure age group of toddlers, because the estimated P95 MOE for TCNAs was lower for toddlers than other age groups. In subsequent steps, other age groups and the exposure to the total N‐NAs were considered.
The uncertainty analysis was conducted following the guidance of the EFSA Scientific Committee, 2018a, on uncertainty analysis in scientific assessments. The analysis follows the guidance for case‐specific assessments (Section 4 of EFSA Scientific Committee, 2018a) although it does contain some standardised elements (e.g. using a threshold MOE of 10,000 to identify the level of concern). The combined impact of uncertainties on the principal conclusions in each part of the assessment was quantified using % probabilities. These are reported below as % certainty for the more probable outcome for each conclusion, following EFSA's guidance on communication of uncertainty (EFSA, 2019c).
3.5.2. Hazard identification and characterisation
Following the evaluation and prioritisation of the uncertainties in the hazard identification and characterisation, it was decided that no major uncertainties are present, and therefore, all sources of uncertainty were assessed collectively, first for NDEA only and second including the other N‐NAs.
For NDEA alone, the uncertainty was assessed with the following EKE question: What would be the relative change of the Reference Point for NDEA if all uncertainties affecting the hazard assessment were to be resolved, e.g. by obtaining perfect information/studies on all aspects of hazard identification and characterisation?
The relative change was expressed as a multiplicative factor to be applied to the reference point because the reference point is the established basis for assessing the MOE. The reference point for NDEA is the BMDL10 of 10 μg/kg bw per day. The BMDL10 already addresses statistical uncertainty in estimating the BMD from the study data, so the multiplicative factor only quantifies the combined impact of other uncertainties identified by the Panel.
The Panel's plausible range for the multiplicative factor on the BMDL10 was 0.95–1.0, i.e. the Panel considered with at least 98% certainty (i.e. at least 98% probability) that the relative change was between 0.95 and 1.0. The upper bound of 1 reflects the Panel's assessment that it is not plausible (less than 1% probability) that resolving the identified uncertainties would increase the reference point. Similarly, the lower bound of 0.95 reflects the Panel's assessment of uncertainty about overestimation of doses due to loss of water from water bottles in the drinking water study on which the reference point was based. The Panel judged that resolving this uncertainty (e.g. if water losses had been prevented) might reduce the reference point by up to 5% (a multiplicative factor of 0.95). The Panel evaluated the indirect approach for confirming the NDEA concentrations at the lower doses, that were below the LOQ of the analytical method, and considered that this would not add to the uncertainty in the RP.
Uncertainties affecting the hazard assessment for other N‐NAs were assessed with the following EKE question: What is your probability that none of the other N‐NAs being considered (NDMA, NMEA, NDPA, NDBA, NMA, NSAR, NMOR, NPIP, NPYR) would have a Reference Point below 10 μg/kg bw per day (the BMDL 10 of NDEA) if all uncertainties affecting the hazard assessment were to be resolved, e.g. by obtaining perfect information/studies on all aspects of hazard identification and characterisation? The EKE was framed in this manner in order to assess whether it is conservative to apply the reference point for NDEA (10 μg/kg bw per day) to other N‐NAs for which no specific BMDL10 is available.
The Panel considered with 95–99% certainty that the BMDL10 for any N‐NA that is detected in food with limited data for carcinogenicity would not be lower than 10 μg/kg bw per day. This reflects the Panel's assessment of the available hazard data.
3.5.3. Dietary exposure assessment
Following the evaluation and prioritisation of the uncertainties in the exposure estimates, the Panel considered that two issues could have major impact on the certainty regarding the final conclusion:
The high number of left‐censored data.
The lack of data on important food categories.
The potential impact of these two issues on the exposure assessment for toddlers was explored quantitatively by conducting sensitivity analysis with a simplified version of scenario 2 of the exposure model (Annex E). Results from this model were used to inform judgements in an EKE addressing all the uncertainties affecting the exposure assessment and also when extrapolating from the Member State toddler populations considered in the assessment to the whole European population of toddlers.
The question addressed in the EKE was: What is the relative change of the 95 th percentile of the daily exposures of European toddlers regarding the NDEA after assuming perfect measurements for all food items in comparison to the existing assessment (scenario 2) (expressed as middle bound) including all food categories?
The relative change was expressed as a multiplicative factor to be applied to the maximum middle bound (MB) estimate of the P95 exposure for toddlers from the exposure assessment to obtain the actual 95th percentile for toddlers in the whole of the EU. The Panel's plausible range for this factor was 0.3–8, i.e. the Panel considered with at least 98% certainty that the relative change is between 0.3 and 8.
The main sources of uncertainty influencing this assessment were as follows:
Underestimating/overestimating the exposure
Left‐censored data in the surveys;
The use of data from literature: missing information on how left censorship was dealt within the reported averages in some references and detailed information on cooked meat and fish products;
Effect of cooking on the n‐na content of food categories.
Underestimating the exposure
Missing food categories on the exposure, in particular vegetables, cereals and milk and dairy products.
Overestimating the exposure
The use of the maximum approach on the estimation for the whole European population of the toddlers.
Among all these uncertainties, the effect of missing food categories, which would lead to higher exposures, was judged to be the most important. This is reflected in the selection of the range of 0.3–8 which extends more in the upwards than the downwards direction.
Additional uncertainties affecting the assessment of exposure of other age groups to NDEA, and of all age groups to the other N‐NAs, is considered as part of the assessment of overall uncertainty below.
3.5.4. Overall uncertainty
The final phase is the characterisation of overall uncertainty. This was considered first for NDEA and toddlers, and then for other age groups and other N‐NAs.
MOE for toddlers and NDEA
Risk characterisation for NDEA is performed by the Margin of Exposure (MOE) approach. The MOE is calculated as the ratio of the reference point to the estimated P95 exposure for EU toddlers.
The plausible ranges assessed by the panel provided lower and upper 1% probability bounds25 for the multiplicative factors quantifying uncertainty for the reference point (BMDL10 for NDEA) and for the P95 exposure. These were combined using probability bounds analysis (Section 14.1 of EFSA (2018a)) to obtain probability bounds for the MOE, as described below (for a more technical description, see Annex E).
For the ‘best’ case estimate (upper probability bound for the MOE):
Divide the upper probability bound for the reference point by the lower probability bound for P95 exposure to obtain an upper probability bound for the MOE:
where ‘Estimated P95 exposure’ refers to the maximum middle bound P95 exposure of European toddlers to NDEA. The result of this calculation was an upper bound of 3472 for the MOE.
Add the maximum probabilities for values above the upper bound for the reference point and below the lower bound for the P95 exposure (here: 1% + 1% = 2%).
Subtract from 100% to obtain the minimum probability (% certainty) that the MOE would be below the calculated upper bound if all the uncertainties were resolved.
For the ‘worst’ case estimate (lower probability bound for the MOE):
Divide the lower probability bound for the reference point by the upper bound for P95 exposure to obtain a lower probability bound for the MOE:
The result of this calculation was a lower bound of 124 for the MOE.
Add the maximum probabilities for values outside the two bounds (here: 1% + 1% = 2%).
Subtract from 100% to obtain the minimum probability (% certainty) that the MOE would be above the calculated value if all the uncertainties were resolved.
The probability bounds calculations require no assumptions about the distributions for hazard or exposure, nor about any dependency between them (EFSA Scientific Committee, 2018a). No additional sources of uncertainty were identified, beyond those taken into account in earlier steps of the uncertainty analysis. Therefore, based on the calculated upper probability bound for the MOE, the Panel considered with a minimum of 98% certainty that the MOE for the P95 EU toddler exposure to NDEA is less than 3,472, which is less than the threshold MOE of 10,000. In conclusion, the Panel considered with at least 98% certainty that the MOE for the P95 EU toddler exposure to NDEA is less than 10,000.
MOE for other age groups and NDEA
The Panel did not identify any reasons why the multiplicative factors for the P95 exposure of other age groups would differ substantially from the multiplicative factor elicited for toddlers. The procedure described above was therefore repeated using the relevant estimated P95 exposures for all age groups other than toddlers, applying the multiplicative factors that were elicited for toddlers' P95 exposure (Annex E). The resulting upper bound for the MOE for the P95 exposure to NDEA was less than 10,000 for each of the age groups except the very elderly, where it was 10,417. An additional semi‐formal EKE was therefore conducted with the following question: ‘What is your probability that the P95 exposure to NDEA for EU very elderly is less than 1 ng/kg bw per day?’, since an exposure of 1 ng/kg bw per day would result in an MOE of 10,000. The Panel judged that there was less than 1% probability that the P95 exposure to NDEA for EU very elderly is less than 1 ng/kg bw per day. Substituting this into the probability bounds calculation for the very elderly results in at least 98% certainty that the MOE for this age group is below 10,000. Therefore, for each of the populations other than toddlers, the Panel concluded with at least 98% certainty that the MOE for the P95 exposure to NDEA is less than 10,000.
Other N‐NAs
The draft Opinion contains tabulated MOEs for each of the other N‐NAs separately, as well as for NDEA.
The experts noted that, even if the Reference Point for NDEA is conservatively assumed to apply also to the other N‐NAs, there are important differences in the uncertainties affecting the exposure assessment for N‐NAs other than NDEA. In particular, occurrence data are available for fewer food categories, and the occurrence levels of other N‐NAs could be higher than NDEA.
The Panel considered that there is too much uncertainty about the reference point and exposure to make conclusions on the individual MOEs of N‐NAs other than NDEA. Nevertheless, including the other N‐NAs can only increase the cumulative risk and reduce the MOE compared to NDEA alone. Therefore, the Panel concluded with at least 98% certainty that the MOE for the P95 exposure is less than 10,000 for the sum of all the N‐NAs considered in this assessment.
4. Conclusions
Overall, the CONTAM Panel concluded that:
A total of 32 N‐NAs have been investigated for their presence in food. Carcinogenicity was identified for 23 N‐NAs i.e. NDMA, NMEA, NDEA, NDPA, NDIPA, NEIPA, NMBA, NMVA, NDBA, NDIBA, NMA, NEA, NMAMPA, NMAMBA, NSAR, NMOR, NPIP, NTHZ, NPYR, NHPYR, NMTHZ, NHMTHZ and NDPheA. The carcinogenicity was considered as the critical endpoint to estimate the possible risks posed to human health by N‐NA intake via food.
Based on occurrence data provided to EFSA and literature data selected based on quality criteria, 10 out of the 23 carcinogenic N‐NAs were detected in food, i.e. NDMA, NMEA, NDEA, NDPA, NDBA, NMA, NSAR, NMOR, NPIP and NPYR (TCNAs). These carcinogenic N‐NAs were considered for the risk assessment.
Toxicokinetics
Experimental animals
Only limited data are available; most information is related to biotransformation, while less is known on absorption, distribution and excretion.
Absorption
NDMA, NDEA, NPYR, NHTZ and NPRO are rapidly and extensively absorbed in the enteric tract following oral exposure; there is evidence for a similar absorption for NMEA, NDPA, NDBA, NSAR, NHPRO, NTCA, NMTCA and NDPheA, while no information is available for NMBA, NMVA, NMA, NMOR and NPIP.
Distribution
After absorption, N‐NAs are generally rapidly distributed to the liver and to other organs.
According to a limited database, plasma protein binding is low.
Metabolism
Metabolism is an important determinant of N‐NAs genotoxicity and carcinogenicity and occurs not only in liver but also in several extrahepatic organs (gastro‐enteric and respiratory tracts, pancreatic ducts, biliary ducts, urinary bladder).
With some exceptions (NMVA, NSAR, NPRO, NHPRO, NTCA, NMTCA, NDPheA), the oxidation of the α‐carbon atom (ω‐1 for NDBA) near to the –NO group of the parent N‐NA or its metabolites is the key metabolic reaction giving rise to reactive DNA‐binding intermediates; CYP2E1 and CYP2As are the most involved enzymes with evidence of the participation of non‐CYP oxidases in extrahepatic tissues.
CYP‐mediated denitrosation has been reported for a number of N‐NAs (NDMA, NDEA, NMEA, NDPA, NMBA, NMA, NMOR, NTHZ, NDPheA) and is generally considered a detoxification pathway; only a few N‐NAs (NDBA, NDPA) are reported to undergo phase II metabolism (glucuronidation).
The extent of biotransformations (mainly driven by liver) is largely affected by the nature of the compound; overall, based on a limited database, most of the N‐NAs covered by this Opinion are extensively metabolised with the exception of NTCA, NMTCA, NHPRO, NPRO, NSAR, NMA which are metabolised to a lesser extent (10–50%).
Hepatic clearance and hence oral bioavailability may also be affected by species and by conditions limiting the extent of N‐NA metabolism; the co‐exposure to ethanol or other CYP2E1 substrates may allow amounts of, e.g. NDMA and possibly other N‐NAs to escape the liver biotransformations and distribute to extrahepatic organs/tissues.
Excretion
Overall, unmetabolised N‐NAs and their stable metabolites (e.g. glucuronides) are mainly and rapidly excreted via urine; for NTCA, NMTCA, NHPRO, NPRO, NSAR and NMA urinary excretion accounts for up to 90% of the administered dose.
Biliary excretion is considered of minor importance and has been documented for NDMA, NDEA, NDPA, NPYR and NDPheA.
Maternal transfer
Direct or indirect evidence for transfer via milk has been provided for NDMA, NDEA, NDBA; no information could be retrieved for the remaining N‐NAs covered in this Opinion.
Placental transfer of the parent compound (NDMA, NDEA, NDBA) or the parent compound and some metabolites (NDPA) has been demonstrated; no information could be retrieved for the remaining N‐NAs covered in this Opinion.
No relevant information concerning absorption, distribution, metabolism or excretion could be retrieved for NDIPA, NEIPA, NDIBA, NEA, NDBzA, NMAMPA, NMAMBA.
Humans
Only a few in vivo data are available and most concern NDMA.
Measurable levels of N‐NAs are found in biological fluids (blood, gastric juice, urine and breast milk) but their origin (endogenous/exogenous) cannot be identified.
Based on a limited number of studies on human volunteers, the ingestion of a meal with known NDMA content would lead to an increase in NDMA concentration in biological fluids only in case of co‐exposure to ethanol, which would decrease the hepatic metabolism of the N‐NA.
In vitro N‐NA metabolism occurs in liver and several extrahepatic tissues.
According to a number of in vitro investigations, CYP2E1 and CYP2As are mostly involved in N‐NAs metabolism, while CYP2B and CYP1A1 play a minor role.
The in vivo extrapolation of the in vitro hepatic NDMA intrinsic clearance measured in human liver microsomes resulted in a calculated hepatic extraction ratio of about 90%, which is very similar to that measured in vivo in the rat.
Metabolic Activation and DNA Adduct Formation
NDMA, NDEA and NMEA are metabolically activated by α‐hydroxylation, catalysed mainly by CYP2E1 and CYP2A6. The resulting α‐hydroxy‐N‐nitrosamines spontaneously decompose to methyl‐ or ethyldiazonium ions, which produce DNA adducts such as 7‐Me‐Gua and O 6 ‐Me‐Gua and the corresponding ethyl‐DNA adducts.
The alkyl groups from the O 6 position of guanine are mainly removed by the O 6 ‐Me‐Gua‐DNA‐methyltransferase. If unrepaired O 6 ‐alkylguanines may lead to GC > AT mutations. Ethylation at O 4 of thymine induced by NDEA is also associated with mutations at A:T base pairs.
The structurally diverse N‐NAs, i.e. NDPA, NDBA, NMA, NSAR, NMOR, NPIP and NPYR, undergo α‐hydroxylation catalysed mainly by CYPs. The resulting α‐hydroxy‐N‐nitrosamines, diazonium ions and stable products range from hydroxylated alkyl chains to more complex cyclic structures. All of the diazonium ions formed are electrophilic and may react with DNA leading to the formation of different kinds of DNA adducts. The biological consequences of some of these DNA adducts have not been fully elucidated.
The metabolic activation of NDPA and NDBA may also involve β‐hydroxylation and ω‐hydroxylation, respectively. Several DNA‐reactive metabolites are generated by these pathways.
There is evidence for a similar overall mechanism of DNA‐adduct formation and repair in experimental animals and humans.
Biomarkers of exposure
A few studies reported measurements of the levels of N‐NAs in humans (urine, blood, tissues, etc.).
In a study of a human murdered by intentional poisoning with NDMA, the hepatic DNA samples contained high levels of 7‐Me‐Gua and O 6 ‐Me‐Gua. These results confirm the identical metabolic activation process in a human and in laboratory animals.
The aforementioned DNA adducts were generally higher in individuals from areas with a high risk of gastric cancer compared to those in individuals from areas with a lower cancer incidence. Most of these studies, however, do not specifically identify N‐NAs as their source.
Adductome analysis has implicated NPIP in the aetiology of oesophageal cancer in an area of high incidence in China. A mutational signature identified by whole exome sequencing of oesophageal tumours from the high‐risk area was similar to the NPIP induced mutational pattern in experimental animals and was weakly correlated with N 2 ‐THP‐dGua levels, the main DNA adduct produced by NPIP in the blood of oesophageal cancer patients.
It is unclear, however, to which extent exposure to N‐NAs reflects their endogenous formation or occurs via food/water.
Toxicity in experimental animals
Acute toxicity
The acute toxicity of the acyclic volatile N‐NAs tested (NDMA, NMEA, NDEA, NDPA, NDIPA, NEIPA, NMVA) was highest for NDMA and NMVA with LD50 values of ≥ 17.7 mg/kg bw. Within the acyclic non‐volatile N‐NAs investigated (NDBA, NDIBA, NMA, NEA, NSAR), NMA and NEA were the most toxic compounds with LD50 values of ≥ 150 mg/kg bw. For the cyclic/aromatic N‐NAs, the lowest LD50 values reported were 60 mg/kg bw for NPIP, followed by NMOR, NPRO and NPYR. NTHZ and NDPheA exerted significant acute toxicity at doses above 1,000 mg/kg bw. The acute toxicity of N‐NAs appears to be relatively independent of the species, strain and sex of the animals tested as well as of the route of administration.
The doses of N‐NAs required to induce acute adverse effects in experimental animals are far above the doses which induce carcinogenesis.
Genotoxicity
The acyclic volatile N‐NAs NDMA, NMEA, NDEA, NDPA are genotoxic both in in vitro and in vivo assays, while the evidence for NDIPA and NMBA is limited to in vitro assays. The genotoxic/carcinogenic potential of NEIPA and NMVA is supported by QSAR read‐across analyses.
The genotoxicity of acyclic non‐volatile N‐NAs has been demonstrated for NDBA, NDBzA (in vitro and in vivo) and NMA, NMAMBA (only in vitro). QSAR/read across indicate the genotoxic/carcinogenic potential of NDIBA and NSAR.
Genotoxic properties characterise the cyclic volatile N‐NAs NMOR, NPIP, NPYR (both in vitro and in vivo) and NTHZ (in vitro).
No indication of genotoxicity is provided for the cyclic non‐volatile N‐NAs either by in vitro assays (NPRO, NHPRO) or in silico studies (NPIC). The genotoxic potential of aromatic N‐NA NDPheA remains uncertain.
No information on the genotoxic potential for NMVA, NEIPA, NEA, NMAMPA, NMTHZ, NMTCA, NHMTCA, NOCA, NMOCA, NPIC could be retrieved from the literature search.
With regard to the carcinogenic N‐NAs occurring in food, eight (NDMA, NMEA, NDEA, NDPA, NDBA, NMOR, NPIP and NPYR) are genotoxic both in vitro and in vivo. The genotoxic potential of the remaining two (NMA and NSAR) is limited to in vitro assays and QSAR/read‐across analysis, respectively.
Carcinogenicity
The acyclic volatile N‐NAs NDMA, NMEA, NDEA, NDPA, NDIPA, NEIPA, NMBA, and NMVA induced tumour formation in several mammalian species and many different organs, such as liver, pharynx, oesophagus, forestomach, the upper respiratory tract and the lung. In monkeys, NDEA and NDPA induced hepatocellular carcinoma (HCC).
The acyclic non‐volatile N‐NAs NDBA, NDIBA, NMA, NMAMBA and NSAR were carcinogenic in many rodent organs/tissues, including liver, the upper and lower respiratory tract, oesophagus and/or forestomach. NDBzA did not induce tumour formation in rodents.
The cyclic volatile N‐NAs caused tumour formation in rat liver, the respiratory and/or the gastrointestinal tract (NMOR, NPIP, NPYR and NHPYR). Furthermore, NPIP induced HCC in livers of monkeys. For the cyclic N‐NAs NPRO, NHPRO and NPIC, no clear evidence for carcinogenicity could be obtained in rodents. NDPheA induced malignant tumours of the urinary bladder in male and female rats.
Overall, NDMA, NMEA, NDEA, NDPA, NDIPA, NEIPA, NMBA, NMVA, NDBA, NDIBA, NMA, NMAMBA, NSAR, NMOR, NPIP, NPYR, NHPYR and NDPheA are carcinogenic in experimental animals. Genotoxic mechanisms are the underlying mode of action for the carcinogenic activity of N‐NAs, except for NDPheA. The most frequent target organ is the liver followed by the upper digestive, urinary and the respiratory tract.
For a number of N‐NAs information on carcinogenicity and mutagenicity is lacking. Based on a large database of N‐NAs with known carcinogenic potency (parametrised as TD50s), knowledge of the most likely mode of action and wide genotoxicity and toxicokinetic information, carcinogenic activity was predicted for NEA, NMAMPA, NMAMBA, NTHZ, NMTHZ, NHMTHZ and NDBzA, and lack of carcinogenic potential for NTCA, NMTCA, NHMTCA, NOCA and NMOCA. TD50s were also predicted for NMVA, NEIPA, NMBA, NDIPA, NDIBA and NSAR, whose carcinogenic activity was known but for which TD50s were not reported.
With regard to the individual TCNAs, experimental data allowed to derive BMDL10 values (in mg/kg bw per day) for NDMA (0.035), NDEA (0.01), NMOR (0.014), NPIP (0.062) and NPYR (0.127). For nine carcinogenic N‐NAs, TD50 values (in mg/kg bw per day) were reported: NDMA (0.0959), NMEA (0.05), NDEA (0.0265), NDPA (0.186), NDBA (0.691), NMA (0.142), NMOR (0.109), NPIP (1.11) and NPYR (0.799). The TD50 was predicted only for NSAR (0.982). By any criterion, NDEA, NMEA, NDMA and possibly NMOR are in the group of highest carcinogenic potency.
Developmental and reproductive effects and transplacental carcinogenesis
NDMA, NDEA, NDPA, NDBA, NMA and NDPheA reduced pre‐ and perinatal survival of offspring in rat, mouse and/or hamster. With the exception of NMA, malformations were not reported for the N‐NAs tested. NDMA, NDEA, NDPA, NDBA and NPIP showed transplacental carcinogenic effects in the offspring of treated dams in several rat, mouse and/or hamster strains. These studies are limited in number and quality, ruling out conclusions on the potential risks for human health.
Effects on the immune system
Rats and mice exposed to NDMA and other N‐NAs tested, exhibited a reduced humoral immune response while the cell‐mediated immune response was suppressed or enhanced, depending on the experimental design and the parameters investigated. However, these studies are limited in number and quality, ruling out conclusions on the potential risks for human health.
Observations in humans in epidemiological studies
The studies in humans are all observational studies investigating associations between intake of N‐NAs (in particular NDMA and NDEA) and cancer. Some reported associations with oesophageal, gastric, colorectal, lung, pancreatic, low urinary tract and bladder, brain, oral, nasopharyngeal and liver cancer. Due to limitations in study design, these studies cannot be used to establish tumour target sites and reference points for N‐NAs.
Mode of action
Mechanistic explanation for the transplacental carcinogenic effects of N‐NAs in rodents was provided by reports on transplacental transfer and bioactivation in fetal tissues. In neonatal animals, high rates of liver cell replication increase the susceptibility towards the hepatocarcinogenic activity of N‐NAs.
N‐NAs found in food require metabolic activation by CYP enzymes to exert their toxic and carcinogenic effects. The key step is metabolic activation by α‐hydroxylation and the subsequent formation of highly reactive diazonium ions which can form DNA‐adducts. A genotoxic mechanism, based on DNA adducts formation by N‐NAs metabolites, is the main mode of action for the carcinogenic activity of N‐NAs.
In rodents, the liver is the main target tissue for the carcinogenic activity of N‐NAs, followed by the upper gastrointestinal and respiratory tract. However, these tissues have not been identified consistently as N‐NA targets in human epidemiological studies. This may be due to species‐specific differences in absorption, distribution and elimination and species‐/tissue‐specific differences in bioactivation and repair of DNA adducts.
Analysis of 900 human colorectal cancer (CRC) cases identified the mutational signature of DNA O 6 ‐alkylguanine, the most mutagenic adduct induced by N‐NAs. This signature was associated with the development of CRC and with high intakes of processed and unprocessed red meat.
As expected from structure–activity knowledge, acyclic N‐NAs with dimethyl‐ and diethyl‐groups were reported to be more genotoxic and mutagenic than N‐NAs with longer chains and cyclic N‐NAs. Even though the genotoxic/mutagenic potency does not always reflect the carcinogenic potency, convincing evidence for high mutagenicity as well as tumorigenicity was gained for NDEA, NDMA and NMEA and possibly NMOR.
BMDL modelling
Well‐documented dose–response studies with a negative control group are available for NDMA, NDEA, NMOR, NPIP and NPYR. Dose–response modelling of liver tumour incidence (benign and malignant tumours combined), the most critical effect following the oral exposure of animals to these N‐NAs, was performed by the panel. BMDL10 for the liver tumour incidence was 10 μg/kg bw per day for NDEA, 35 μg/kg bw per day for NDMA, 14 μg/kg bw per day for NMOR, 127 μg/kg bw per day for NPYR and 62 μg/kg bw per day for NPIP.
Potency
In a conservative approach, the CONTAM Panel applied the same carcinogenic potency to all TCNAs. In an alternative approach, the ratio between the lowest BMDL10 of N‐NAs with the highest concern (0.010 mg/kg day for NDEA, NMEA, NDMA and NMOR) and the lowest BMDL10 of the remaining N‐NAs (0.062 mg/kg per day for NDPA, NDBA, NMA, NPYR, NPIP, NSAR) was used to calculate a potency factor of 0.2 between the two subgroups.
Despite the differences in experimental systems, NDEA, NMEA, NDMA and possibly NMOR are the most potent by any criterion measured.
Occurrence and exposure
Regarding available analytical methods, a comprehensive approach useful to identify/quantify both volatile and non‐volatile N‐NAs in all food types that can contain residues of these contaminants (i.e. meat products, dairy products, seafood, vegetables and alcoholic beverages) is still not available.
Most published methods are applicable for meat product analysis, with detection limits in the range of 0.003–20 μg/kg, and are based on gas chromatography detecting mainly volatile N‐NAs. Recent advances in food analysis introduced liquid chromatography/mass spectrometry, allowing the determination of both volatile and non‐volatile N‐NAs. However, this approach was applied with good performances only for meat product analysis.
Considering the individual TCNAs, 2,817 results for food samples analysed from four European countries between 2003 and 2021 were available for the assessment. Besides the EFSA occurrence data set, the CONTAM Panel had also considered the selection based on quality criteria of additional evidence of analytical results from EU countries (n = 3,976) and non‐EU countries (n = 27), published between 1990 and 2021.
From this data set, the dietary exposure assessment was performed for the following food categories: ‘Alcoholic beverages, Coffee, cocoa, tea and infusions’, ‘Fish, seafood, amphibians, reptiles and invertebrates’, ‘Meat and meat products’ and ‘Seasoning, sauces and condiments’. Percentage of left‐censored data in these food categories at Level 1 of the FoodEx2 classification, across N‐NAs, ranged from 3% to 99%.
No occurrence data were available to EFSA or selected from the literature for any of the individual TCNAs for the following food categories: ‘Fruit and fruit products’, ‘Fruit and vegetable juices and nectars (including concentrates)’, ‘Grains and grain‐based products’, ‘Legumes, nuts, oilseeds and spices’, ‘Milk and dairy products’, ‘Starchy roots or tubers and products thereof, sugar plants’, ‘Vegetables and vegetable products’, ‘Water and water‐based beverages’.
Among the five food categories considered in the dietary exposure assessment, ‘Meat and meat products’ was the only food category for which data were available for all individual TCNAs.
NDMA was the only N‐NA for which data were available for all five FoodEx2 Level 1 food categories. Data were available for three food categories for NPYR, NPIP, NDEA and NDBA; for two food categories for NMOR and one food category for NSAR, NMEA, NDPA and NMA.
Although unprocessed and uncooked meat may contain trace amounts of N‐NAs, evidence is found in the literature which shows the increased presence of N‐NAs in these foods after cooking (baking, frying, grilling, microwaving), indicating that cooking generates N‐NAs.
However, data availability on cooked unprocessed meat and fish are limited and there is also some uncertainty regarding the potential presence or absence of nitrite/nitrate added in the products that were cooked and/or bought already as cooked. For this reason, the Panel decided to estimate exposure using two scenarios, excluding (scenario 1) or including cooked unprocessed meat and fish (scenario 2).
In scenario 1 (excluding cooked unprocessed meat and fish), the mean MB dietary exposure to TCNAs ranged from < 0.1 ng/kg bw per day in infants to 12.0 ng/kg bw per day in toddlers. The P95 UB dietary exposure to TCNAs ranged from zero in infants to 54.8 ng/kg bw per day in infants. The mean MB dietary exposure TCNAs with potency factors ranged from < 0.1 ng/kg bw per day in infants to 5.4 ng/kg bw per day in toddlers and children. The P95 UB dietary exposure to TCNAs with potency factors ranged from zero in infants to 31.3 ng/kg bw per day in infants. The highest P95 dietary exposure to TCNAs assessed using potency factors was 1.7 times lower than the highest P95 dietary exposure to TCNA assessed without using potency factors (both found in infants).
In scenario 2 (including cooked unprocessed meat and fish), the mean MB dietary exposure to TCNAs ranged from 7.4 ng/kg bw per day in infants to 87.7 ng/kg bw per day in toddlers. The P95 UB dietary exposure to TCNAs ranged from 34.7 ng/kg bw per day in infants to 208.8 ng/kg bw w per day in toddlers. The mean MB dietary exposure to TCNAs with potency factors ranged from 2.5 ng/kg bw per day in infants to 25.0 ng/kg bw per day in toddlers. The highest P95 dietary exposure to TCNAs assessed using potency factors was 3.3 times lower than the highest P95 dietary exposure to TCNA assessed without using potency factors (both found in toddlers).
In both scenarios, NPYR, NSAR, NDMA, NPIP and NDEA are the five individual N‐NAs contributing the most to the highest mean exposure to TCNAs across surveys and age groups (> 80%).
In both scenarios, the highest P95 UB exposure to TCNAs calculated using potency factors was two to three times lower than the one calculated without using potency factors.
The highest P95 UB dietary exposure to TCNA in scenario 2 was about three times higher than in scenario 1.
In both scenarios, Meat and meat products at FoodEx2 Level 1 is the main contributing food category to the dietary exposure to TCNAs for all age groups, from 7 to 100% in scenario 1 and from 20 to 99% in scenario 2.
For the individual TCNAs, in both scenarios the main contributing food category at the Foodex2 level 1 was ‘Meat and meat products’. ‘Alcoholic beverages’ (beer and unsweetened spirits and liqueurs) was also a main contributor for NDBA, NDMA and NMOR in adolescents, adults, elderly and very elderly in both scenarios. ‘Fish, seafood, amphibians, reptiles and invertebrates’ (processed fish and seafood categories only) was also a main contributor in scenario 1 for NDMA, NPIP and NPYR in all age groups and for NDEA in adults, elderly and very elderly and in scenario 2 for NDMA and NPIP in all age groups.
Due to the uncertainty with regard to the high proportion of results below LOD/LOQ and/or only limited availability of data considered in the dietary exposure assessment of TCNAs, the CONTAM Panel noted that exposure calculations should be interpreted with caution.
Risk characterisation
The CONTAM Panel characterised the risk for scenario 1 (excluding cooked unprocessed meat and fish) and scenario 2 (including cooked unprocessed meat and fish). The NDEA BMDL10 of 10 μg/kg bw per day, for increased incidence of liver tumours (benign and malignant tumours combined) in rodents, was used as the reference point for the TCNAs in the MOE approach. MOE values ranged, at the P95 exposure (minimum LB–maximum UB), in scenario 1 from 3,337 to 183 and in scenario 2 from 322 to 48, across dietary surveys (excluding some infant surveys with P95 exposure equal to zero) and age groups.
The CONTAM Panel concluded that these calculated MOEs for the TCNAs are below 10,000 in both scenarios which raises a health concern.
Attributing a lower potency factor to NMA, NDPA, NDBA, NSAR, NPIP, NPYR occurring in food would not change the above conclusion.
Overall uncertainty in the risk
The assessment of P95 exposure was subject to significant sources of uncertainty, which could make the true value up to a factor of 3 lower or a factor of 8 higher. The uncertainty contributing most to the potentially large underestimation was the lack of occurrence data for important food categories, especially vegetables, cereals and milk and dairy products.
Only minor uncertainties were identified for the Reference Point (BMDL10) for NDEA. The toxicity of some other N‐NAs was more uncertain due to limitations in the available toxicity data.
Taking account of the identified uncertainties, the Panel concluded that the MOE for TCNAs at the P95 exposure is highly likely (98%–100% certain26) to be less than 10,000 for all age groups.
5. Recommendations
The CONTAM Panel recommends to:
Fill the gaps in ADME for N‐NAs relevant to human exposure.
Fully characterise the metabolic activation pathways and DNA adducts formed in human and animal tissues.
Determine the relative mutagenic potencies of some N‐NAs present in food for which the genotoxic/carcinogen mechanisms have not been fully clarified (e.g. NMOR, NPIP and NPYR). This would include (i) the use of metabolic activation systems of human origin, (ii) characterisation of DNA adducts and (iii) comparison of mutational spectra obtained by whole genome sequencing with mutational signatures present in human cancer.
Perform epidemiological studies implementing molecular approaches including ‐omics techniques on the association between N‐NAs and cancer. More accurately control confounding factors (e.g. use of medicines, other carcinogenic chemicals in food, occupational exposure, smoking)
Standardise a sensitive analytical method to quantify the carcinogenic N‐NAs, both volatile and non‐volatile, in different food products.
Obtain data on the possible occurrence of carcinogenic N‐NAs in food other than the TCNAs.
Collection of data on N‐NAs in processed foods other than processed meat (i.e. raw meats, vegetables, cereals, milk and dairy products, fermented foods, pickled preserves, spiced foods, etc.) and of products cooked in different ways, with and without the addition of nitrate and nitrite. In addition, more data on human milk are needed to enable the exposure assessment in infants.
Documentation provided to EFSA
EMA e‐mail 17 January 2023 with comments provided by the Nitrosamines Safety Operational Expert Group (NS OEG) of the Non‐clinical working party.
Abbreviations
- AD
adenoma
- ADME
absorption, distribution, metabolism and excretion
- AGT
Angiotensinogen
- ALP
alkaline phosphatase
- ALT
Alanine transaminase
- ANS
The EFSA Panel on Food Additives and Nutrient Sources Added to Food
- AST
aspartate transaminase
- ATSDR
Agency for Toxic Substances and Disease Registry
- AUC
area under the curve
- BDI
benzene diazonium ion
- BMD
benchmark dose
- BMDL10
benchmark dose lower bound at 10% BMR
- BMDU10
benchmark dose upper bound at 10% BMR
- BMI
body mass index
- BMR
benchmark response value
- CA
carcinoma
- CCC
cholangiocellular carcinoma
- CHMP
Committee for Medicinal Products for Human Use
- CI
chemical ionisation
- CI
confidence interval
- CONTAM
The EFSA Panel on Contaminants and in the Food Chain
- COSMIC
Catalogue of Somatic Mutations in Cancer
- CPDB
Carcinogenic Potency Database
- CRC
colorectal cancer
- CSF
colony stimulating factor
- DDEC
diethyldithiocarbamate
- DLLME
dispersive liquid–liquid micro‐extraction
- DNA
deoxyribonucleic acid
- ECHA
European Chemicals Agency
- E249
potassium nitrite
- E250
sodium nitrite
- ED50
median effective dose
- EKE
expert knowledge elicitation
- EMA
European Medicines Agency
- EPA
Environmental Protection Agency
- EtGua
Ethyl guanine
- FID
flame ionisation detector
- FLD
fluorescence detection
- GC
gas chromatography
- GD
gestational day
- GI
gastrointestinal
- GNCA
gastric non‐cardia adenocarcinoma
- GPx
glutathione‐peroxidases
- GSH
glutathione
- GST
glutathione‐S‐transferases
- GV
guideline value
- HCA
hepatocellular adenoma
- HCC
hepatocellular carcinoma
- HPLC
high pressure liquid chromatography
- HSSPME
head space solid‐phase micro‐extraction
- IARC
International Agency for Research on Cancer
- IBASLE
ice bath assisted solid liquid extraction
- LB
lower bound
- LCDB
Lhasa carcinogenicity database
- LD50
median lethal dose
- LOAEL
lowest observed adverse effect level
- LLE
liquid–liquid extraction
- LOD
limit of detection
- LOQ
limit of quantification
- MAE
microwave‐assisted extraction
- MGMT
methyl‐guanine‐methyl‐transferase
- MN
micronucleus
- MoE
margin of exposure
- MS
mass spectroscopy
- NADPH
reduced nicotinamide adenine dinucleotide phosphate
- NCD
nitrogen chemiluminescence detection
- NDBA
N‐nitrosodibutylamine
- NDBzA
N‐nitrosodibenzylamine
- NDEA
N‐nitrosodiethylamine
- NDELA
N‐nitrosodiethanolamine
- NDIBA
N‐nitrosodiisobutylamine
- NDIPA
N‐nitrosodiisopropylamine
- NDMA
N‐nitrosodimethylamine
- NDPA
N‐nitrosodipropylamine
- NDPheA
N‐nitrosodiphenylamine
- NEA
N‐nitrosoethylaniline
- NEIPA
N‐nitrosoethylisopropylamine
- NHMTCA
N‐nitroso‐2‐hydroxymethyl‐thiazolidine‐4‐carboxylic acid
- NHMTHZ
N‐nitroso‐2‐hydroxymethylthiazolidine
- NHPRO
N‐nitrosohydroxyproline
- NHPYR
N‐nitroso‐3‐hydroxypyrrolidine
- NHS
Nurses' Health Studies
- NIH
National Institute of Health
- NMA
N‐nitrosomethylaniline
- NMAMBA
N‐nitroso‐N‐(1‐methylacetonyl)‐3‐methyl‐butylamine
- NMAMPA
N‐nitroso‐N‐(1‐methylacetonyl)‐2‐methyl‐propylamine
- NMBA
N‐nitrosomethylbutylamine
- NMBzA
N‐Nitrosomethylbenzylamine
- NMEA
N‐nitrosomethylethylamine
- NMOR
N‐nitrosomorpholine
- NMOCA
N‐nitroso‐5‐methyloxazolidine‐4‐carboxylic acid
- NMTCA
N‐nitroso‐2‐methyl‐thiazolidine‐4‐carboxylic acid
- NMTHZ
N‐nitroso‐2‐methylthiazolidine
- NMVA
N‐Nitrosomethylvinylamine
- N‐NAs
N‐nitrosamines
- NNK
4‐(N‐nitrosomethylamino)‐1‐(3‐pyridyl)‐1‐butanone
- NO
nitric oxide
- NOAEL
no‐observed adverse effect level
- NOCA
N‐nitrosooxazolidine‐4‐carboxylic acid
- NOX
nitrosating agents
- NPIC
N‐nitrosopipecolic acid
- NPIP
N‐nitrosopiperidine
- NPRO
N‐nitrosoproline
- NPYR
N‐nitrosopyrrolidine
- NSAR
N‐nitrososarcosine
- NTCA
N‐nitroso‐thiazolidine‐4‐carboxylic acid
- NTHZ
N‐nitrosothiazolidine
- NTP
National toxicology programme
- OECD
Organisation for Economic Co‐operation and Development
- PCI
positive chemical ionisation
- PF
potency factor
- PHWE
pressurised hot water extraction
- QSAR
quantitative structure–activity relationships
- RBC
red blood cells
- SAR
structure‐activity relationships
- SBS
single base substitution
- SCCS
Scientific Committee on Consumer Safety
- SD
standard deviation
- SLE
solid/liquid extraction
- SLLE
solid‐supported liquid–liquid extraction
- SMC
silica monolith capillary
- SOD
superoxide dismutase
- SPE
solid‐phase extraction
- SWE
superheated water extraction
- TBARS
thiobarbituric acid‐reactive substances
- TCNA
ten carcinogenic N‐NAs occurring in food
- TD50
median toxic dose
- TEA
thermal energy analyser
- TGR
TransGenic Rodent
- TK
toxicokinetic
- UB
upper bound
Appendix A – Levels of N‐NAs and their DNA adducts in humans
Table A.2. Levels of DNA adducts in humans
| Endpoint | Test item | Results | Comments | Reference |
|---|---|---|---|---|
|
O 6 ‐Me‐Gua and O 6 ‐EtGua in DNA from oesophageal and/or stomach mucosa of patients from high cancer risk in China (Lin‐Xian County) |
O 6‐Me‐Gua by radioimmunoassay in 37 cancer patients from China (22 oesophageal mucosa with no sign of tumour invasion, 11 samples of mucosa from the cardiac stomach, 4 oesophageal tumours) and 12 tissue samples from France and Germany hospitals (4 oesophageal mucosa, 2 oesophageal tumours, 1 oesophageal muscle; 1 stomach tumour; 1 colon mucosa, 2 colon tumours) LOD: 25 fmol 06‐Me‐Gua/mg DNA (around 100 molecules/cell) 12.5 fmol 06‐EtGua/mg DNA. |
Lin‐Xian County (China) Positive O 6 ‐Me‐Gua: 27/37 samples (17 samples in the range 5–50 fmol/mg DNA; 10 showed higher levels, up to 160 fmol/mg DNA), 10 samples below LOD. France and Germany Positive O 6 ‐Me‐Gua: 5 samples below 45 fmol O 6 ‐Me‐Gua/mg DNA Negative: 7 samples below LOD Negative O 4 ‐EtGua Significant difference between DNA O 6 ‐Me‐Gua levels in tissue samples from China vs. those from Europe. |
Similar levels of the repair enzyme MGMT in China and European samples. Several N‐NAs (NDMA, NDEA) found in food constituents. consumed in Lin‐Xian County; higher urinary excretion of N‐NAs and nitrate in subjects from this area as compared to Fan‐xian County (a low‐risk area with respect to both oesophageal and stomach cancer) reported in Lu et al. (1985). |
Umbenhauer et al. (1985) |
| 06‐Me‐Gua in DNA of oesophageal or stomach mucosa of Chinese patients (Lin‐Xian) | 38 human samples (27 oesophageal mucosa and 11 samples stomach mucosa) and 20 fetal oesophageal mucosa from Beijing hospital | The levels of O 6 ‐Me‐Gua in fetal oesophageal mucosa were very low while positive results were found on samples from Lin‐Xian (no data provided). | The amounts of 06‐Me‐Gua in DNA of oesophageal or stomach mucosa of patients from Lin‐Xian were higher than that from Europe (Lyon and Essen). A subset of the data are reported in Umberhauer et al, 1985. | Lu et al. (1986) |
|
06‐Me‐Gua in human placental DNA from 20 women |
10 smoking and 10 non‐smoking women; O 6 ‐Me‐Gua by immunoassay/HPLC; LOD: 0.5 μmol O 6 ‐Me‐Gua/mol dG |
Positive for O 6 ‐Me‐Gua: 2/10 and 3/10 DNA samples from smoking and non‐smoking respectively (range: 0.6–1.6 μmol O 6 ‐Me‐Gua/mol dG). |
No apparent relationship between MGMT and O 6 ‐Me‐Gua concentrations in the 20 subjects. No apparent relationship between smoking history and O 6 ‐Me‐Gua concentration. |
Foiles et al. (1988) |
| O 6 ‐Me‐Gua in DNA from gastric and colorectal mucosa of patients with GI disorders |
35 patients from Manchester area O 6 ‐Me‐Gua by radioimmunoassay in 53 samples LOD: 0.010 μmoles O 6 ‐Me‐Gua/mole dA |
Low levels of 06‐Me‐Gua (range 0.01 > 0.30 μmoles/mole dA) Negative: no detectable alkylation of the tissue DNA in 13/35 individuals (36%). Positive: 5/6 of the gastric cancer samples; the DNA of the associated mucosa being alkylated less frequently (2/7) and to a lesser extent. Positive: 1/7 CRC DNA and to a lower extent than the DNA of the adjacent mucosa (8/10 samples). |
No apparent association with smoking or alcohol consumption. Heterogeneous patterns both within and between individuals. |
Hall et al. (1991) |
| O 6 ‐Me‐Gua, O 4 ‐MeThy and O 4 ‐EtThy in leucocytes and liver samples |
3 leucocyte and 3 liver DNA samples from Japanese living in the Tokyo area Method: HPLC and immunoprecipitation by monoclonal antibodies LOD: 1 fmol (1 adduct/108 dG/dThy) |
leucocyte samples Positive: O 6 ‐Me‐Gua (all samples) Negative: O 4 ‐MeThy and O 4 ‐EtThy liver samples Positive: O 6 ‐Me‐Gua (2 samples) Positive: O 4 ‐MeThy and O 4 ‐EtThy (all samples) |
Kang et al. (1992) | |
|
O 6 ‐Me‐Gua in peripheral blood leucocyte DNA |
407 individuals from 17 populations in 13 countries with different gastric cancer rates. Only non‐smoker subjects in the range 55–64 years LOD: 0.05 fmol O6‐Me‐Gua/μg DNA Sera analyses for H. pylori antibodies and pepsinogen A |
Positive for O 6 ‐Me‐Gua: 21 samples (5%) up to 0.26 fmol/ug DNA (0.42 μmol/mol G). High prevalence (16/21) of positive samples in the Japan and Portugal populations with extremely high gastric cancer rates (102 tested); 2 positive samples came from USA; single positive samples came from Germany, Iceland and UK. The median concentration of O 6 ‐Me‐Gua in the positive samples did not differ from that in the intermediate and low risk populations. |
O 6 ‐Me‐Gua in blood leucocyte DNA was significantly more frequent in individuals from the two populations with high gastric cancer mortality rates. Association between the presence of O 6 ‐Me‐Gua and a low level of serum pepsinogen A, a marker of severe atrophic gastritis. Lack of a significant association between the presence of adducts and H. pylori antibodies. |
EUROGAST Study Group (1994) |
| O 6 ‐Me‐Gua, O 4 ‐MeThy and O 4 ‐EtThy in human leucocytes and liver samples |
15 leucocyte and 15 liver DNA samples from Japanese living in the Tokyo area Method: HPLC and immunoprecipitation by monoclonal antibodies LOD: 1 fmol (1 adduct/108 dG/dThy) |
leucocyte samples Positive: O 6 ‐Me‐Gua (all samples) (range: 0.7–4.6 adducts/108 dG) Negative: O 4 ‐Me‐Thy and O 4 ‐Et‐Thy liver samples Positive: O 6 ‐Me‐Gua (13/15 samples) (range: 1.1–6.7 adducts/107 dG). Positive: O 4 ‐MeThy and O 4 ‐EtThy (all samples)(range: 0.1–14 adducts and 0.5–140 adducts/107 dThy, respectively). |
No history of therapeutic exposure to alkylating agents No significant difference in DNA adducts levels between smokers and non‐smokers |
Kang et al. (1995) |
| O 6 ‐Me‐Gua in paired normal and tumour DNA samples from the colorectal tissues |
O 6 ‐Me‐Gua quantified by radioimmunoassay LOD: 0.01 pmol O6‐Me‐Gua/mol dG. |
The frequencies of DNA adduction were 33%. 52% and 48% for normal DNA and 58%, 32% and 63% for tumour DNA isolated from the cecum, sigmoid colon and rectum, respectively. | No association between the presence of O 6 ‐Me‐Gua in DNA and the incidence of Ki‐ras mutations or GC > AT transitions in mutated Ki‐ras genes. | Jackson et al. (1996) |
|
O 6 ‐Me‐Gua in normal and tumour samples of CRC patients |
62 CRC patients (30 men and 32 women; median age: 72 years) within Manchester area Measurements of O6‐Me Gua by radioimmunoassay LOD: 0.01 μmol O6‐Me‐Gua/mol dG. |
Positive for O 6 ‐Me‐Gua: 27/62 (43%) and 30/58 (52%) of normal and tumour DNA samples, respectively. < 0.01–0.94 and < 0.01–0.151 μmol O 6 ‐Me‐Gua /mol dG for normal. and tumour DNA, respectively. O 6 ‐Me‐Gua levels in normal DNA lower in the proximal colon than in the sigmoid colon or rectum. |
DNA alkylation varied within the large bowel (possibly due to in situ N‐NAs formation) and was highest in areas of the colon and rectum where the highest incidence of large bowel tumours occurs. | Povey et al. (2000) |
| O 6 ‐Me‐Gua, O 6 ‐EtGua, O 6 ‐PropylGua, O 6 ‐ButylGua in 24 gastric cancer patients from an area of Central Italy with a high incidence of gastric cancer |
Measurements of DNA adducts by HRGC‐NICI‐SIR in paired samples of stomach tumour and non‐involved mucosa Measurements of H. pylori by CagA antibodies Measurements of DMA and NDMA concentrations in foods sampled from local markets in Italy. |
Positive: 5/24 and 3/24 for O 6 ‐Me‐Gua 2/24 and 1/24 for O 6 ‐ButylGua 1/24 and 8/24 for O6‐Propyl‐gua 0/24 and 3/24 for O 6 ‐EtGua in tumour DNA and normal mucosa, respectively. O6‐alkylguanine levels higher in non‐involved mucosa than in paired tumour tissue samples (2.08 fmol/μg DNA in 54.2% of the samples). |
No association with age, family history of gastric cancer, H. pylori antibodies and tumour histopathological stage. Estimated intakes of NDMA and DMA correlated with total levels of O 6 ‐alkyl guanines in non‐involved gastric mucosa. 22/24 gastric cancer patients were infected with H. pylori, thus precluding a comparison between subgroups. |
Palli et al. (2001) |
| Adductome analysis (including THP‐dG DNA adduct induced by NPIP) in human samples from subjects inhabiting areas with high (Cixian) and low (Shijiazhuang) incidence of oesophageal cancer. |
DNA samples from surgical specimens of apparently non‐tumorous lesions from subjects inhabiting areas with high (Cixian; n = 7) and low (Shijiazhuang; n = 8) incidences of oesophageal cancer. DNA adductome analysis by UPLC‐QTOF/MS |
Multiple DNA adducts were detected in samples from both areas but appeared to be more abundant in samples from the high‐incidence area. PCA analysis identified a clear clustering of DNA adducts identified in high‐ and low‐incidence areas. |
The THP‐dG DNA adduct induced by NPIP was identified as a significant contributor to oesophageal cancer in the high‐incidence area of Cixian. | Totsuka et al. (2019) |
| In vitro genotoxicity induced by NPIP. |
Ames test (TA100 and TA1535 in the presence of S9 mix) Analysis of the Global Mutational Profiles |
Positive: both strains. G:C to A:T transitions are significantly higher in NPIP‐exposed clones (77 clones) than in control clones (50 clones). |
||
| In vivo genotoxicity induced by NPIP. | Two groups of male gpt F344 delta rats (n = 5 per group) were orally administered 5 consecutive doses of 33 or 66 mg of NPIP/kg per week for 4 weeks. A third group (control group, n = 5) was treated with distilled water. The rats were sacrificed at 14 weeks of age (6 weeks after NPIP administration). |
Positive: dose‐dependent increase of NPIP‐induced mutation in the liver and oesophagus. Same mutational spectrum in the two organs. Mainly A:T to C:G transversions but also G:C to A: T and A:T to G:C transitions. |
||
|
Mutational spectra in oesophageal cancer patients inhabiting areas with high (Cixian; n = 7) and low (Shijiazhuang; n = 8) incidences of oesophageal cancer. |
Whole exome sequencing of 25 human oesophageal tumours /peripheral blood paired samples Subjects who had no history of smoking or drinking. |
Similar mutational pattern as in transgenic rats. Identical number of somatic variants in the high and low areas of oesophageal cancer risk. Mutational signatures were highly similar to signatures in the COSMIC database: signature 1 (related to aging), 13 (APOBEC overactivity), 5 and 17. In particular Signature C was similar to signature 17 with an unknown aetiology. Signature C was weakly correlated with THPdG levels in the blood of oesophageal patients. |
The weak correlation of a specific mutational signature with THPdG levels in the blood of oesophageal patients suggests that NPIP‐induced DNA adducts are partly involved in oesophageal carcinogenesis. No clear separation was observed between the high‐ and low‐incidence areas on the basis of the mutational signatures, suggesting that there was no difference in the aetiology of oesophageal cancer between these areas. |
DMA: dimethylamine; GLC/TEA: gas–liquid and high‐pressure liquid chromatography/thermal energy analyser; HRGC‐NICI‐SIR: high‐resolution gas chromatography/mass spectrometry with negative‐ion chemical ionisation and selection recording; MGMT: O 6 ‐Me‐Gua DNA methyltransferase; NDBA: N‐nitrosodibutylamine; NDEA: N‐nitrosodiethylamine; NDMA: N‐nitrosodimethylamine; NDPA: N‐nitrosodipropylamine; NPIP: N‐nitrosopiperidine; NPYR: N‐nitrosopyrrolidine; NPRO: N‐nitrosoproline; NSAR: N‐nitrososarcosine; O 6 ‐EtGua: O 6 ‐Etguanine; O 4 ‐EtThy: O 4 ‐Ethylthymine; O 6 ‐Me‐Gua: O 6 ‐Methylguanine; O 4 ‐MeThy: O 4 ‐Methylthymine; O 6 ‐propylGua: O 6 ‐propylguanine; O 6 ‐butylGua: O 6 ‐butylguanine; THP‐dG: N2‐(3,4,5,6‐Tetrahydro‐2H‐pyran‐2‐yl) deoxyguanosine; UPLC‐QTOF/MS: ultraperformance liquid chromatography‐quadrupole time‐of‐flight mass spectrometer.
Appendix B – Studies on genotoxicity
Appendix C – Acute toxicity studies
Appendix D – Repeated dose toxicity studies
Appendix E – Long term toxicity/carcinogenicity studies
Table E.2.
Long‐term/carcinogenicity studies on acyclic (non‐volatile) N‐NAs NDBA, NDIBA, NMA and NSAR
| Reference | Species/Experimental design and doses | Most sensitive endpoint | Highest dose with no effect (mg/kg bw per day) | Lowest dose with effect (mg/kg bw per day) |
|---|---|---|---|---|
| NDBA | ||||
| Druckrey et al. (1967) | BD rat (M, F) No/group: 10–16 Drinking water: 10, 20, 37.5 or 75 mg/kg bw per day; historical controls available Mean duration/tumour induction time: 150–540 days | HCC, papilloma and CA of pharynx, oesophagus and urinary bladder | 10 | |
| Okajima et al. (1971), taken from IARC (1978) | Rat, Wistar (sex not specified) No/sex/group: not specified Drinking water: 0.01 or 0.05%; equivalent to 5 or 25 mg/kg bw per day(a); controls not specified Duration: not specified | Urinary bladder tumours | 5 | 25 |
| Kunze et al. (1969); Kunze and Schauer (1971) | Rat, Wistar (F) No/group: 30 Drinking water: 20 mg/kg bw per day; no control Duration/tumour appearance: after 145 days | Papilloma and CA of urinary bladder | 20 | |
| Ito (1973) | Rat, Wistar (M) No/group: 12 Drinking water: 0.05% equivalent to 25 mg/kg bw per day (a) ; no control Duration: 28 weeks | Transitional cell CA of urinary bladder; Tumours of liver and oesophagus | 25 | |
| Lijinsky et al. (1983) | Rat, F344 (M) No/group: 20 Gavage: 0 or 5.4 mg/rat bw 2×/wk (assuming 400 g bw), equivalent to 0 or 3.9 mg/kg bw per day (b) Duration: 30 weeks | HCC, CA of forestomach and oesophagus, transitional cell carcinoma of urinary bladder; AD and CA of lung; CA of nasal cavity | 3.9 | |
| Takayama (1969) | Mouse, ICR (M) No/group: > 29 Diet: 0 or 50 mg/kg, equivalent to 0 or 7.5 mg/kg bw per day (a) Duration: 12–15 months | Hepatoma, papilloma and CA of forestomach, papilloma of oesophagus, AD of lung | 7.5 | |
| Bertram and Craig (1970) | Mouse, C57Bl/6 (M, F) No/sex/group: 50 Drinking water for M: 7.6 or 29.1 mg/kg bw per day; for F: 8.2 or 30.9 mg/kg bw per day; no control. Duration: average of 240 days | Papilloma/CA of urinary bladder (M) Papilloma/CA of oesophagus, tumours of tongue/forestomach | 7.6 (M) 7.6/8.2 (M/F) | |
| Wood et al. (1970) | Mouse, IFxC57 (M, F) No/sex/group: 12–17 s.c. application: 0 or 10 μL (9 mg) every second week; (assuming 25 g bw for M and 20 g bw for F) equivalent to 0 or 25.7 mg/kg bw per day for M and 0 or 32 mg/kg bw per day for F Duration: 40 weeks | Papilloma/CA or urinary bladder, lung AD |
25.7/32 |
|
| Althoff et al. (1971) | Hamster, Syrian Golden (M) No/group: 100 Gavage: 300 mg/kg bw once/week; equivalent to 42.9 mg/kg bw per day; no control Duration: 15–50 weeks | Papilloma and CA of urinary bladder, trachea and lung | 42.9 | |
| Althoff et al. (1971) | Hamster, Chinese (M) No/group: 100 Gavage: 300 mg/kg bw once/wk equivalent to 42.9 mg/kg bw per day; no control Duration: 15–50 weeks | Papilloma and CA of urinary bladder and forestomach | 42.9 | |
| Althoff et al. (1974) | Hamster, European (M, F) No/sex/group: 5 (M), 10 (F) s.c. application: 0, 49, 98, 197, 394 or 788 mg/kg bw 1×/wk for M; 0, 93, 187 or 373 mg/kg bw 1×/wk for F; equivalent to 0, 7, 14, 28, 56 or 113 mg/kg bw per day for M and 0, 13, 27 or 53 mg/kg bw per day for F Duration: lifetime | ↓ Body weight Tumours in respiratory and upper digestive tract, urinary bladder and (para)nasal cavities | 7/13 (M/F) 7/13 (M/F) | |
| Reznik et al. (1976) | Hamster, Chinese (M, F) No/sex/group: 20 s.c. application: 0, 71, 142 or 284 mg/kg bw/week; equivalent to 0, 10, 20 or 40,2 mg/kg bw per day Duration: 15–50 weeks | ↓ Survival (M) Lung tumours (M) | 10 | 10 20 |
| Ivankovic (1968) |
Guinea pig (sex not specified) No/group: 15 Drinking water: 40 mg/kg bw on 5 days/wk, equivalent to 28.6 mg/kg bw per day; no control Duration: lifetime |
HCC, CCC Papilloma and CA of urinary bladder | 28.6 | |
| NDIBA | ||||
| Lijinski et al. (1979) | Rat, SD (F) No/group: 15 Drinking water: 110 mg/L on 5 days/wk equivalent to 3.9 mg/day per day (a) ; no control Duration: 30 weeks Observation: 120 weeks | Tumours of lung and occasionally in other organs | 3.9 | |
| Lijinski et al. (1981) | Rat, F344 (sex not specified) No/group: 20 Drinking water: 440 mg/L on 5 days/week; equivalent to 15.7 mg/day per day (a) ; reference to historical controls Duration: 50 weeks Observation: ~ 70 weeks | CA of nose, tumours of trachea and lung | 15.7 | |
| Althoff et al. (1975) | Hamster, Syrian Golden (M, F) No/sex/group: 20 s.c. application: 0, 62.5, 125, 250 or 500 mg/kg bw/1×/week; equivalent to 0, 9, 18, 36 or 72 mg/kg bw per day Duration: lifetime | Tumours of larynx Tumours of nasal mucosa and bronchial tree | 9 |
9 18 |
| NMA | ||||
| Boyland et al. (1964) | Rat, Albino (M, F) No/sex/group: 16 Drinking water: 0 or 0.2% (after 7 months reduced to 0.1%) on 6 days/week; equivalent to 0 or 86 to 43 mg/kg bw per day (a) Duration: until tumour appearance (average ~ 390 days) | Malignant tumours of oesophagus | 43–86 | |
| Druckrey et al. (1967) | Rat, BD (M, F) No/group: 20 Diet: 10 mg/kg bw per day; historical controls available Duration: lifetime; average tumour induction time: 450 days | ↓ Survival CA of oesophagus and urinary bladder | 10 10 | |
| Goodall et al. (1970) | Rat, albino (M) No/group: 20 Gavage: 7.5 mg/rat 2×/week; (assuming 300 g bw); equivalent to 7.1 mg/kg bw per day; no control Duration: lifetime Tumour latency: average 89 weeks | Papilloma of mouth/pharynx, oesophagus and forestomach | 7.1 | |
| Goodall et al. (1970) | Rat, albino (M, F) No/sex/group: 16–17 Drinking water: 2 mg/rat 5×/wk (assuming 300 g bw) equivalent to 4.8 mg/kg bw per day; no control Duration: 52 weeks Tumour latency: average 67–75 weeks | Papilloma and CA of mouth/pharynx, oesophagus and forestomach (M, F) Tumour in intestinal tract (M) |
4.8 4.8 |
|
| Schmähl (1976) | Rat, SD (M, F) No/sex/group: 48 s.c. application: 0, 2 or 10 mg/kg bw/1× per week; equivalent to 0, 0.3 or 1.4 mg/kg bw per day Duration: 24 weeks | Papillomas and CA or oesophagus | 0.3 | |
| Schmähl (1976) | Rat, SD (M, F) No/sex/group: 48 Drinking water: probably 0, 0.3 or 1.5 mg/kg bw per day – unclear documentation Duration: 24 weeks | Papillomas and CA or oesophagus | 0.3 (?) | |
| Kroeger‐Koepke et al. (1983) |
Rat, F344 (M, F) No/sex/group: 20 Drinking water: 0 or 50 mg/L on 5 days/week; equivalent to 0 or 1.8 mg/kg bw per day (a) Duration: 50 weeks Observation: until tumour occurrence (max until wk 120) |
CA of oesophagus and forestomach | 1.8 | |
| Michejda et al. (1986) |
Rat, F344 (F) No/group: 20 Drinking water: 0 or 5 mg/animal/wk (assuming 250 g bw) equivalent to 0 or 2.9 mg/kg bw per day(a) Duration: 20 weeks Observation: until tumour occurrence |
Tumours of oesophagus and tongue | 2.9 | |
| Greenblatt et al. (1971) |
Mouse, Swiss (M, F) No/sex/group: 20 Drinking water: 0 or 70 mg/L; equivalent to 0 or 6.3 mg/kg bw per day (a) Duration: 28 weeks Observation: additional 12 weeks |
Lung adenoma, malignant lymphoma | 6.3 | |
| NDBzA | ||||
| Druckrey et al. (1967) |
Rat, BD (M, F) No/group: 10 Diet: 50 or 100 mg/kg bw per day; historical controls available Duration: lifetime |
No tumour formation | 100 | |
| NMAMBA | ||||
| Li et al. (1985) | Rat, Wistar (F) No/group/duration: 4–7 Gavage: 10–200 mg/kg bw 2×/wk leading to total doses between 150 and 6,600 mg/kg bw Duration: 46–640 days | Papilloma of oesophagus, AD of liver at 10 months | ~ 5.3 | |
| Li et al. (1985) | Mouse, Kunming (F) No/group/duration: 7–25 Gavage: 5 mg to 10 mg/mouse 2×/wk, leading to total doses of 45–670 mg/mouse Duration: 28–317 days | Papilloma and CA of oesophagus at 5 months, hyperplasia and AD in the liver at 5 months | ~ 77 | |
| NSAR | ||||
| Druckrey et al. (1967) | Rat, BD (M, F) No/group: 6–14 Drinking water: 100 or 200 mg/kg bw per day; historical controls available Duration/tumour induction time: 357–631 days | CA of oesophagus | 100 | |
| Sawyer and Marvin (abstract 1974) | Mouse, Swiss ICR (M, F) No/sex/group: 65 Diet: 0 or 0.25%; equivalent to 0 or 375 mg/kg bw per day (a) Duration: 13 months | ↓ Body weight gain and survival CA of nasal region, tumours of lung and small intestine | 375 375 | |
AD: adenoma; CA: carcinoma, HCA: hepatocellular adenoma; HCC: hepatocellular carcinoma; CCC: cholangiocellular carcinoma.
EFSA default values applied.
In table 1 of the study there is a discrepancy between the dose applied 2 times per week and rat and the total dose applied per rat. For the present calculations the dose applied 2 times per week and rat was taken.
Appendix F – Epidemiological studies
F.1 Cancers of digestive system organs
F.1.1 Cohort studies
Knekt et al. (1999) investigated the risk of colorectal and other gastrointestinal (GI) cancers following exposure to NDMA, using a cohort of healthy adult Finnish men and women in the Finnish Mobile Clinic survey (1966–1972). Dietary intake was assessed by a dietary history questionnaire. Cancers of the GI tract were identified by the nationwide Finish Cancer Registry. Mean daily intake of NDMA was 0.052 μg from the diet and 0.071 μg from beer. Dietary NDMA was provided mainly by smoked and salted fish and cured meat and sausages. An increased risk of colorectal cancer was found for high intake of smoked and salted fish (Q3 vs. Q1, HR: 2.58, 95% CI 1.21–5.51) and cured meat (HR: 1.84, 95% CI 0.98–3.47). However, for cured meat it did not reach statistical significance. After adjustment for confounding factors, an increased risk for colorectal cancer was observed for high intake of NDMA (Q4 vs. Q1, HR: 2.12; 95% CI: 1.04–4.33; p‐trend = 0.47) but no association was found between intake of NDMA and stomach cancer. The main limitations of the study were the lack of adjustment for important confounders (e.g. Helicobacter pylori infection status, alcohol).
Nothlings et al. (2005) conducted a multi‐ethnic cohort study (African American, Latino, Japanese American, Native Hawaiian, Caucasian) in Hawaii and Los Angeles to investigate the association between intake of meat, other animal products and N‐NAs and pancreatic cancer. Subjects were enrolled in the study between 1993 and 1996. Incident pancreatic cancer cases were identified by record linkages to the Hawaii Tumour Registry, the Cancer Surveillance Program for Los Angeles County and the California State Cancer Registry. Follow‐up of the cohort for cancer incidence were done by active contact with the subjects and computerised linkages to cancer registries and death certificate files. A quantitative food frequency questionnaire was used in the study. Intakes of pork and of total red meat were both associated with a 50% increase in risk (Q5 vs. Q1; both p‐trend < 0.01). However, the strongest association was found for processed meat (Q5 vs. Q1, HR: 1.68; 95% CI: 1.35–2.07; p‐trend < 0.01) after adjusting for confounding factors. An analysis based on estimated intake of N‐NAs from processed meat, showed an increased risk for pancreatic cancer for high N‐NA intake (HR: 1.26; 95% CI: 1.01–1.56; p‐trend = 0.29). The main limitations of the study are: the lack of information on values for N‐NAs and the lack of control for other potential confounding factors (e.g. BMI).
Jakszyn et al. (2006) investigated the association between the estimated dietary intake of NDMA in relation to gastric cancer risk. Data were obtained from the large European Prospective Investigation into Cancer and Nutrition (EPIC) study. Enrolment took place between 1992 and 1998. The follow‐up data were obtained mainly from population cancer registries. Dietary intake was assessed by different instruments (semi‐quantitative food frequency questionnaire, 7‐day record, non‐quantitative food frequency). Mean (SD) exposure to NDMA was 0.19 (0.31) μg/day in the controls and 0.26 (0.34) μg/day among cases. There was no association between NDMA intake and gastric cancer (HR per 1 μg/day increase: 1.00; 95% CI: 0.7–1.43). No association was found for cardia gastric cancer (T3 vs. T1, HR: 0.73; 95% CI: 0.3–1.79) or non‐cardia gastric cancer (T3 vs. T1, HR: 1.09; 95% CI: 0.69–1.73). A limitation of the study is the possible misclassification in the exposure due to country‐specific questionnaires and different sources of information to estimate NDMA from food (country‐specific values when available). Other limitations are the differences in follow‐up procedures, the lack of information on loss of follow‐up and lack of control in the analysis for Helicobacter pylori infection status.
Larsson et al. (2006) investigated the associations between intake of red meat, poultry and fish, processed meat (bacon or side pork, sausage or hotdogs, ham or salami), NDMA and risk of stomach cancer. Data were obtained from the Swedish Mammography Cohort established between 1987 and 1990. Dietary exposure was assessed through a 67‐item food frequency questionnaire. Incident cases were ascertained through the National and Regional Swedish Cancer registries. Completeness of follow‐up of the cohort was obtained. In the Cox PH models, after adjustment for possible confounding factors, an increased risk was observed for high intake of NDMA (RR Q5 vs. Q1: 1.96; 95% CI: 1.08–3.58; p‐trend = 0.02). The association between NDMA and gastric cancer did not differ according to level of vitamin C or vitamin E intake. After controlling for confounding factors an increased risk was also observed for high intake of processed meat (HR: 1.66; 95% CI: 1.13–2.45, p‐trend = 0.01), bacon or side pork (HR: 1.55; 95% CI: 1.00–2.41, p‐trend = 0.05) and ham or salami (HR: 1.48; 95% CI: 0.99–2.22, p‐trend = 0.01). The limitation of the study was the lack of control for important confounding factors (e.g. smoking, Helicobacter pylori infection status).
Loh et al. (2011) conducted a cohort study (1993–1997) to investigate the association between dietary NOCs (NDMA), endogenous NOC, dietary nitrite and cancer incidence in the (EPIC)–Norfolk, United Kingdom, study. Incident cancer cases were identified through the National Health Service Central Register and through the East Anglian Cancer Registry. An assessment of baseline diet was carried out using a 131‐item food frequency questionnaire. The estimated mean intake of NDMA in the population of the study was 57 ng per day. After adjustments for potential confounding factors, NDMA intake was not associated with total cancer incidence (Q4 vs. Q1, HR: 1.10; 95% CI: 0.97–1.24). In a stratified analysis by sex, a borderline increased risk was observed for total cancer among men (Q4 vs. Q1, HR: 1.18; 95% CI: 1.0–1.40) but not among women (HR: 1.05; 95% CI: 0.86–1.29; p‐trend = 0.83). NDMA intake (as continuous variable) was borderline associated with GI cancers (oesophagus, stomach, colon and rectum) (HR per 1 standard deviation increase of NDMA: 1.13; 95% CI: 1.00–1.28). For specific cancer sites, an increased risk was found for rectum cancer (HR per 1 standard deviation increase: 1.46; 95% CI: 1.16–1.84, p‐trend = 0.001). No association was found between NDMA intake and cancers of the colon, stomach, oesophageal, breast, prostate, lung and ovary. Cancers of the skin (melanoma) bladder, corpus uteri, pancreas and kidney were categorised as ‘others’. NDMA intake (as continuous variable) was associated with increased risk of ‘other cancers’ (HR per 1 standard deviation increase of NDMA: 1.11; 95% CI: 1.03–1.19). In this study, plasma vitamin C concentrations had an effect‐modifier role between cancer risk and NDMA exposure (p‐for interaction: 0.006). In subjects with plasma vitamin C levels of 50 μmol/L the cancer risk associated with NDMA intake was lower. A limitation of this study is the small number of cases of some sites, the lack of information on loss of follow‐up and the lack of control for some possible confounding factors (e.g. fruits and vegetables), Helicobacter pylori infection status for gastric cancer.
Keszei et al. (2013) studied the relationship between risks of oesophageal cancer and gastric cancer subtypes and dietary NDMA intake in the Netherlands Cohort Study (1986–2002). At baseline a questionnaire on dietary factors (150‐item food frequency questionnaire) and other risk factors were completed by study participants. Incidence cases of cancer were identified by linkage to the Netherlands Cancer Registry and the Nationwide Network and Registry of Histopathology and Cytopathology in the Netherlands. The main sources of NDMA intake in this cohort were beer and processed meat. Mean intake of NDMA was 0.084 μg/day for men and 0.04 μg/day for women. For the statistical analysis a subgroup cohort was used (N = 1947 men and 2085 women). In the multivariate model, after controlling for confounding factors, an increased risk was found for oesophageal squamous cell carcinoma (T3 vs. T1: HR: 1.76; 95% CI: 1.07–2.90; p‐trend = 0.01). When the analysis was conducted separately for men and women, the association was seen only for men (T3 vs. T1, HR: 2.43; 95% CI: 1.13–5.23; p‐trend = 0.01). In the multivariable adjusted model using NDMA as a continuous a statistically significant increase in risk for oesophageal squamous cell carcinoma was also found for women (HR: 1.34; 95% CI: 1.04–1.71 per 0.1 μg/day NDMA increment). For gastric non‐cardia adenocarcinoma a statistically positive association was found for men (HR: 1.06; 95% CI: 1.01–1.10 per 0.1 μg/day NDMA increment) but not among women. No association was found between NDMA intake and oesophageal adenocarcinoma and NDMA intake and gastric cardia cancer. The limitation of the study is the low number of cases and the lack of control for Helicobacter pylori infection status for gastric cancer.
F.1.2 Case–controls
Risch et al. (1985) conducted a case–control study from 1979 to 1982 to explore the role of diet on gastric cancer. Cases were matched by age, sex, residence and birth year. Cases were subjects with newly diagnosed gastric cancer that were resident in either Newfoundland, Manitoba, or the Toronto, Ontario metropolitan area. Cases in Newfoundland and Manitoba were obtained from tumour registries, while in Toronto, identification was through examination of medical records in hospitals treating individuals with stomach cancer. Histologic confirmation was obtained from all cases included in the study. In Newfoundland and Manitoba, controls were identified through door‐to‐door while in metropolitan Toronto, they were identified through municipal enumeration lists. Response rate was 44% for cases and 58% for controls. A medical history questionnaire and a diet history questionnaire (94 food items) were administrated to the participants of the study. Continuous conditional logistic regression techniques for matched studies were employed to analyse the data. No association was found for NDMA and stomach cancer (OR: 0.94; 95% CI, 0.14–6.13). The limitation of the study is the lack of control for important confounding factors (e.g. smoking, Helicobacter pylori) and the low response rate.
Gonzalez et al. (1994) conducted a case–control study (1988–1989) to investigate the association between nutrients, nitroso compounds and the risk of gastric cancer in four provinces of Spain (15 hospitals). In this study, histologically confirmed gastric adenocarcinoma and controls matched by sex, age and area of residence were included. A dietary history method (77 items) was used to assess dietary intake. Response rate of cases and controls was 100%. After adjusting for energy intake, an increased risk was found for subjects with high intake of N‐NAs (OR: 2.09; p‐trend = 0.007). When cases were stratified by histological type, a significant association was found for high intake of N‐NAs in both intestinal (Q4 vs. Q1; OR: 1.77, p‐trend = 0.101) and diffuse types (Q4 vs. Q1, OR: 2.09, p‐trend = 0.133). A lower risk for gastric cancer was found for subjects with high intake of N‐NAs and high intake of vitamin C (OR: 1.17, 95% CI: 0.74–1.85). The limitation of the study was the lack of control for important confounding factors (e.g. smoking, Helicobacter pylori) and the lack of confidence intervals for the risk estimates in the main analysis.
Rogers et al. (1995) investigated the association between foods and beverages containing NDMA and laryngeal, oesophageal and oral cancer in a case–control study in western Washington state. Newly diagnosed cancers were identified by using the Cancer Surveillance System. Controls were ascertained using random digit dialling of households in the same three‐county area and they were frequency matched by age and sex to the oral cancer cases. Participants completed a food frequency questionnaire (125 items). Median intake of NDMA for cases and controls was 0.2 μg/day. The response rate for cases were 83% and 82% among controls. After adjusting for potential confounding factors, an increased risk was found for high NDMA intake and laryngeal cancer, oesophagus cancer and oral cavity cancer, nonetheless it was only statistically significant for oral cavity (T3 vs. T1; OR: 1.82; 95% CI: 1.10–3.00; p‐trend = 0.118). In a stratified analysis by levels of vitamin C, subjects with low vitamin C intake (including supplements) were at an increased risk of oesophagus cancer (OR: 2.96, p < 0.05). For all cancer sites combined (laryngeal, oesophageal, oral cavity) NDMA consumption was associated with a 79% increased risk (p‐trend = 0.037). The main limitation of the study was the high levels of missing information for NDMA.
Pobel et al. (1995) conducted a hospital‐based case–control study in Marseille (1985–1988), and included 92 histologically confirmed cases of adenocarcinoma and 128 controls, matched by sex and age. Cases were identified in the departments of gastroenterological surgery of eight major hospitals in Marseille. Controls were subjects undergoing functional re‐education for trauma or injuries in two specialised medical centres. Diet was assessed by dietary history method. The mean daily intake of NDMA was 0.55 μg (SD: 0.87) for cases and 0.33 μg (SD: 0.50) for controls. After controlling for confounding factors, a significant increase risk of gastric cancer was reported for the second (0.23 μg/day) (T2 vs. T1, RR: 4.13; 95% CI: 0.93–18.27) and third tertile (T3 vs. T1, RR: 7.0; 95% CI: 1.85–26.46, p‐trend = 0.04) of dietary intake of NDMA. No protective effect was found for vitamin C intake. Potential limitations of this study are the small sample size, the lack of control for important confounding factors such as smoking and the fact that controls were from a different study base.
La Vecchia et al. (1995) conducted a case–control study (1985–1993) to investigate the association between NDMA and gastric cancer. They included incident cases of gastric cancer and hospital controls. Controls were patients admitted to the same hospital for acute, non‐neoplastic, non‐digestive tract diseases, unrelated to long‐term modifications of diet. The response rate was 95% for both cases and controls. A 29‐item food frequency questionnaire was used to assess dietary intake. The mean intake of NDMA in the population studied was 0.18 μg. After controlling for confounding factors, an increased risk was found for high intake of NDMA (T3 vs. T1, OR: 1.40; 95% CI: 1.1–1.7; p‐trend ≤ 0.01). The effect was stronger for males (OR: 1.75; 95% CI: 1.3–2.3) and younger subjects (< 60 years) (OR: 1.79; 95% CI: 1.3–2.4). The limitation of the study was the lack of control for important confounding factors such as smoking habits and alcohol consumption.
De Stefani et al. (1998) conducted a case–control study in Uruguay to assess the role of dietary N‐NAs, heterocyclic amines and gastric cancer. In the period 1993–1996, newly diagnosed and microscopically confirmed gastric cancer cases (79.4% cancer in the antrum and pylorus, 20% cancer of the cardia, 20% whole stomach, 30% with cancer of the corpus) admitted to the four major hospitals in Montevideo were enrolled in the study. Controls were selected from the same hospitals and in the same period as the cases. The response rate of cases and controls were 94.2% and 91.5%, respectively. A short food frequency questionnaire was used for exposure assessment (29 items). High dietary NDMA intake was significantly associated with an increased risk of gastric cancer (Q4 vs. Q1, OR: 3.62; 95% CI: 2.38–5.51, p‐trend = > 0.001), after controlling for confounding factors. When dietary items were entered as continuous variables and adjusted simultaneously for each other, NDMA intake remained statistically significantly associated (OR: 1.58; 95% CI: 1.25–2.0). The limitation of the study was the lack of control for education and there was a clear difference between cases and controls.
Palli et al. (2001) conducted a case–control study in Italy (1985–1987) to investigate the role of diet on gastric cancer. Cases were histologically confirmed gastric cancer and controls were enrolled from a random sample of the population. Diet was assessed by using a food frequency questionnaire (181 food items). After controlling for confounding factors, an increased risk, although not statistically significant, was found high dietary intake of NDMA (T3 vs. T1, OR: 1.1; 95% CI: 0.8–1.5) and gastric cancer. The limitation of the study was the lack of control in the analysis for smoking habits and alcohol consumption.
Zhu et al. (2014) examined the association between N‐NA intake and colorectal cancer risk in case–control study carried out in Newfoundland and Labrador and Ontario, Canada. Cases were pathologically confirmed adenocarcinoma identified from familial Colorectal cancer registries (1997–2006). Controls consisted of a random sample of each provincial population and were selected using random digit dialling. Controls were frequency‐matched with cases on sex and age. The response rates for the study were 65.0% for cases and 53.5% for controls. Participants were asked to complete a 170‐item self‐administered food frequency questionnaire. Median daily intake of NDMA among controls was 0.20 μg/day. In the multivariate analysis, high intake of NDMA intake was associated with an increased risk of colorectal cancer (Q5 vs. Q1, OR: 1.42; 95% CI: 1.03–1.96; p‐trend = 0.005), specifically for rectal carcinoma (OR: 1.61; 95% CI: 1.11–2.35; p‐trend = 0.01). An increased risk for colorectal cancer was also found for NDMA‐containing meats (OR: 1.47; 95% CI: 1.03–2.10; p‐trend = 0.20). There was evidence of effect modification between dietary vitamin E and NDMA. Individuals with high NDMA and low vitamin E intakes had a significantly higher risk (OR: 3.01; 95% CI: 1.43–6.51; p for interaction = 0.017). There was no interaction with vitamin C. The limitation of study is low response rate of cases and controls and the fact that cases completed the questionnaire after a long period after diagnosis leading to a high possibility of recall bias.
Zheng et al. (2019) examined the association between N‐nitroso compounds intake and pancreatic cancer risk in Texas, USA. Cases were pathologically confirmed pancreatic ductal adenocarcinoma (2002–2009). Frequency‐matched controls were cancer‐free individuals recruited from friends and genetically unrelated family members (usually spouses or in‐laws) of patients diagnosed with cancers excluding the ones related to tobacco smoking (pancreatic cancer, lung cancer, head and neck cancer). The overall response rates for the study was 78% for both cases and controls. During study recruitment, two different versions of Harvard semi‐quantitative food frequency questionnaire were used to assess dietary habits (84 and 131 food items). After adjustment for confounders, a significantly increased risk for pancreatic cancer was found for NDEA (Q4 vs. Q1, OR: 2.28; 95% CI: 1.71–3.04, p‐trend < 0.0001) for both animal and plant sources and N‐NDMA from plant sources (Q4 vs. Q1, OR: 1.93, 95% CI: 1.42–2.61, p‐trend < 0.0001). No association was found for NDBA, NPYR, NTCA, NTHZ, NPIP, NPRO and pancreatic cancer. No effect modification by dietary vitamin C, E or red meat intake, or by alcohol intake level was seen. The limitation of the study was the lack of information on risk estimates by smoking status and the source of controls.
Zheng (2021) investigated the relationship between dietary N‐NOCs and HCC. Cases (N = 827) were histologically or radiologically confirmed incident HCC cases from the MD Anderson Cancer Center in USA. Controls (N = 1013) were spouses of cancer patients with no history of liver or GI or lung or head and neck cancers. Cases and controls were recruited from 2004 to 2018. Dietary intake was assessed by two different semiquantitative food frequency questionnaires (originally with 84 food items and an updated version with 131 food items). Clinical variables were retrieved from their medical records. Underlying cirrhosis was determined by pathological findings (diagnostic biopsies) and CT scans. Information regarding demographics, lifestyle factors including smoking status and smoking intensity, family histories of cancers. Blood samples from cases and controls were tested for Hepatitis C virus and Hepatitis B virus. High intake of NDEA from plant sources (Q4 vs. Q1, OR: 1.58; 95% CI: 1.03–2.41), high intake of NDMA from plant sources (Q4 vs. Q1, OR: 1.54; 95% CI: 1.01–2.34) and NPIP from animal sources (Q4 vs. Q1, OR: 2.52; 95% CI: 1.62–3.94, p‐trend < 0.0001) were all associated with increased HCC risk. No increased risk was found for total NDEA (Q4 vs. Q1, OR: 1.10; 95% CI: 0.72–1.69, p‐trend = 0.32) and NDEA from animal sources (Q4 vs. Q1, OR: 0.92; 95% CI = 0.60–1.41, p‐trend = 0.58), total NDMA (Q4 vs. Q1, OR: 0.80; 95% CI: 0.53–1.21, p‐trend = 0.22) and NDMA from animal sources (Q4 vs. Q1, OR: 1.26; 95% CI: 0.83–1.91), NDBA (Q4 vs. Q1, OR: 0.39; 95% CI: 0.25–0.61, p‐trend < 0.001), NDPA (Q4 vs. Q1, OR: 0.88; 95% CI: 0.56–1.39, p‐trend = 0.74) and NMAMBA (Q4 vs. Q1, OR: 1.24; 95% CI: 0.81–1.87, p‐trend = 0.20) from animal sources and total NPYR (Q4 vs. Q1, OR: 0.89; 95% CI: 0.58–1.37, p‐trend = 0.76), NPYR from plant (Q4 vs. Q1, OR: 0.75; 95% CI: 0.49–1.16, p‐trend = 0.24) and animal sources (Q4 vs. Q1, OR: 1.04; 95% CI: 0.68–1.59, p‐trend = 0.88). It is important to note that in the multivariate analysis in which N‐NA intake from plant origin were included as a covariate, N‐NA intake from animal origin and red and processed meat were considered as a confounding factor. The limitations of the study are as following: response rate was not reported, not all cases were histologically confirmed, controls were not sampled from the community and no matching between cases and controls were reported, values for NOCs were not available for all foods in the questionnaire.
F.2 Other cancers
F.2.1 Cohort studies
Knekt et al. (1999) investigated the risk of Head and Neck cancer (HNC) and NDMA (1966–1972), using a cohort of healthy adult Finnish men and women in the Finnish Mobile Clinic survey. A dietary history interview was used to assess dietary habits of the volunteers. Mean daily intake of NDMA was 0.052 μg of NDMA from the diet and 0.071 μg from beer. After adjustment for confounding factors, no significant association was observed between NDMA intake (Q4 vs. Q1, HR: 1.37; 95% CI: 0.50–3.74; p‐trend = 0.43) and HNC cancer. The limitation of the study was the low power (48 incident HNC cancer cases).
Michaud et al. (2009) combined data from three US prospective cohort studies (Nurses' Health Study (NHS)) I, NHS II and male Health Professionals Follow‐Up Study (HPFS) (1976–2002) and examined the association between NDMA and NPYR and glioma. Dietary intake was assessed by three different food frequency questionnaires ranging from 61 to 131 food items. Estimates from each cohort were pooled by using a random effects model, and only combined effects were presented. After controlling for confounding factors, high intake of NDMA (Q5 vs. Q1, HR: 0.88; 95% CI: 0.57–1.36; p‐trend = 0.73) and NPYR (T3 vs. T1, HR: 0.81; 95% CI: 0.62–1.05; p‐trend = 0.93) were not associated with the risk of glioma. No effect modification was observed by intake of vitamins C or E or other antioxidant measures. The limitations of the study were: the assessment of vital status that was mainly based on family members report or using mortality data; misclassification of the exposure due to different food‐frequencies questionnaires; the potential confounders were not taken into consideration (e.g. smoking, BMI, fruit and vegetable intake, ionising radiation, occupation).
Jakszyn et al. (2011) investigated the association between red meat consumption, dietary N‐NAs and haem iron, and the risk of bladder cancer among participants in the European Prospective Investigation into Cancer and Nutrition (EPIC) study that involved 23 centers among 10 European countries (1992–1998). Country‐specific food frequency questionnaires containing up to 260 food items were used to assess dietary intake. Follow‐up was based on population‐cancer registries in seven of the participating countries: Denmark, Italy, the Netherlands, Spain, Sweden, United Kingdom and Norway. In France, Germany and Greece, a combination of methods was used, including health insurance records, cancer and pathology hospital registries and active follow‐up. All models were stratified by age at recruitment, sex and center and adjusted for confounding factors. No statistically significant associations were found between NDMA and bladder cancer (Q4 vs. Q1, HR: 1.12; 95% CI: 0.88–1.44; p‐trend = 0.49). No association was found for red and processed meat (HR: 1.15; 95% CI: 0.90–1.45; p‐trend = 0.49) and haem iron (HR: 1.10; 95% CI: 0.88–1.39; p‐trend = 0.39). The limitation of the study is the lack of control for fruits and vegetable intake.
Jakszyn et al. (2012) investigated the association between NDMA and endogenous N‐nitroso compounds (ENOC) and haem iron and the risk of prostate cancer among men, recruited in eight European countries within the EPIC (1992–1998). Prostate cancer cases were identified through population‐based cancer registries and a combination of methods including health insurance records, cancer and pathology hospital registries and active follow‐up. Country‐specific food frequency questionnaires were used to assess dietary intake (up to 260 items). After adjusting for confounding factors, no association was found between prostate cancer risk and NDMA (Q5 vs. Q1, HR: 1.04; 95% CI: 0.92–1.18; p‐trend = 0.95). After stratifying for stage, a borderline increased risk was found for localised prostate cancer risk (Q5 vs. Q1, HR: 1.23; 95% CI: 0.99–1.53; p‐trend = 0.19). No association was found between ENOC and haem iron intake and prostate cancer risk. The limitation of this study is the lack of a clear method of data adjustment for confounders. Risk estimates reported in the text and abstract do not correspond to data in the tables. No adjustments were made by important risk factors (e.g. family history of prostate cancer).
F.2.2. Case–control studies
Goodman (1992) conducted a population case–control study on Hawaii (1983–1985) to investigate the association between diet and lung cancer. Participants were residents of Oahu (Caucasian, Japanese, Chinese, Filipino, Hawaiian/part‐Hawaiian). Cases were individuals with histologically confirmed lung cancer. Controls were identified through different random‐digit dialling, from lists of Oahu residents and from Oahu residents registered with the Health Care Financing Administration. Controls were matched by sex and age with cases. Response rate was 70% (men) and 63% (women) among cases and 71% (men) and 67% (women) among controls. A dietary history method was used to assess dietary intake (130 items). In the multivariate analysis, after controlling for confounding factors an increased risk of lung cancer was found for high intake of NDMA among men (Q4, vs. Q1, OR: 3.3; 95% CI: 1.7–6.2, p‐trend = 0.0006) and women (Q4 vs. Q1, OR: 2.7; 95% CI: 1.0–6.9, p‐trend = 0.04). The limitation of this study is the low response rate between cases and controls.
De Stefani et al. (1996) conducted a case–control study in Uruguay (1994–1995) to investigate the association between dietary intake of NDMA and lung cancer. Incidence histologically confirmed lung cancer cases were identified in the 7 major hospitals in Montevideo. Controls were selected from the admission register of the same hospital. Controls were frequency matched by age, sex and residence with cases. Among the 320 lung cancer cases, only 13 patients were women. A semi‐quantitative food frequency questionnaire (70 items) was used to assess dietary intake. After adjusting for confounding factors, high NDMA intake was associated with a threefold increase in risk for lung cancer (Q4 vs. Q1, OR: 3.14; 95% CI: 1.86–5.29, p‐trend < 0.001). In a stratified analysis by histological type, the risk was higher for adenocarcinoma of the lung (Q4 vs. Q1, OR: 4.57; 95% CI: 1.88–11.1, p‐trend < 0.001). Salted meat was the food that contained most of the NDMA. When the analysis was stratified by smoking status, the association between NDMA and lung cancer was not statistically significant anymore for former (OR: 2.25; 95% CI: 0.77–6.58) and non‐smokers (OR: 3.42; 95% CI: 0.76–15.4) The limitations of the study were the lack of information on the response rate of cases and controls and the lack of histological reports for 15% of cases.
De Stefani et al. (2009) undertook a case–control study among Uruguayan males, on meat intake and related mutagens and the risk of lung cancer (1996–2004). Newly diagnosed microscopically confirmed lung cancer cases and controls were drawn from the four major public hospitals in Montevideo. Response rate among cases and controls were 97.7% and 97.3% respectively. A food frequency questionnaire (64 food items) was used to assess dietary intake. After adjusting for confounding factors, an increased risk was found for high intake of total meat, red meat and processed meat. N‐NAs (OR: 1.89; 95% CI: 1.30–2.73; p‐trend = 0.0002) and benzo[a]pyrene from meat were associated with the risk of lung cancer. When the analysis was stratified by smoking status, the association between NDMA and lung cancer was not statistically significant anymore for former smokers (OR: 1.66; 95% CI: 0.89–3.08). The association remained only for current smokers (OR: 1.67; 95% CI: 1.07–2.60).
Wilkens et al. (1996) conducted a case–control study to evaluate dietary intake of nitrites and N‐NAs in relation to cancers of the lower urinary tract. Cases were Caucasians (53%) or of Japanese ancestry (47%) who had been diagnosed with a lower urinary tract cancer (90% urinary bladder; 7% renal pelvis, 3 % ureter) between 1979 and 1986 at the seven largest civilian hospitals on the Island of Oahu. Response rates were 89% for controls and 73% for cases. Controls were selected from the Health Surveillance Program of the Hawaii State Department of Health and frequency matched to cases for sex, age and ethnic group. A dietary history (29‐item questionnaire) was used to assess dietary intake. Mean intake of N‐NAs among males was 0.27 μg/day (cases) and 0.23 μg/day (controls) and among females 0.14 μg/day (cases) and 0.13 μg/day (controls). After controlling for confounding factors, an increased risk was only observed for men of Japanese ancestry (T3 vs. T1, OR: 3.0; 95% CI, 1.4–6.4, p‐trend = 0.01). The limitation of the study was the use of a very short dietary questionnaire.
Catsburg et al. (2014) examined the role of dietary sources of NOCs and NOC precursors as potential bladder cancer risk factors using data from the Los Angeles Bladder Cancer Study. Bladder cancer cases were histologically confirmed and identified through the Los Angeles County Cancer Surveillance Program, the population‐based Surveillance, Epidemiology and End Results (SEER) cancer registry of Los Angeles County. Controls were frequency matched by age, sex and ethnicity (non‐Hispanic white, Hispanic, African American). Forty food groups were included in the dietary section of the structured health questionnaire. In the multivariate analysis, no association was found for high intake of N‐NA (Q5 vs. Q1, OR: 1.03; 95% CI: 0.78–1.36; p‐trend = 0.984). In a stratified analysis by smoking status, an increased risk, although not statistically significant, was found for N‐NAs (OR: 1.52; 95% CI: 0.86–2.66; p‐trend = 0.281) among non‐smokers but not among smokers (OR: 0.96; 95% CI: 0.69–1.33; p‐trend = 0.701). High intake of haem iron was also associated with an increased risk of bladder cancer among non‐smokers. No data regarding the response rate among controls were provided.
Boeing et al. (1993) conducted a case–control study (1987–1988) with incident and histologically confirmed cases of meningioma and glioma that were identified in two clinics in Rhein‐Neckar‐Odenwald area of Germany. Controls were randomly selected from the residential registers of the study area. A food frequency questionnaire (42 items) was used to assess dietary intake. Response rate was 97.8% among cases and 72% among controls. After controlling for possible confounding factors, an increased risk for glioma, with a dose–response, was found for medium and high intake of N‐nitroso‐dimethylamine (NDMA) (T3 vs. T1 OR: 2.8; 95% CI: 1.5–5.3, p‐trend = 0.001), NPYR (T3 vs. T1 OR: 3.4; 95% CI: 1.8–6.4, p‐trend < 0.001) and NPIP (T3 vs. T1 OR: 2.7; 95% CI: 1.4–5.2, p‐trend = 0.004). For meningioma, an increased risk was also found for high intakes of NDMA, NPYR and NPIP. However, it was only statistically significant for high intake of NPIP (T3 vs. T1 OR: 2.0; 95% CI: 1.0–3.8). The limitations of the study are: the low number of cases of meningioma; differences of response rate between cases and controls and the control in the multivariate model for very few confounding factors.
Giles (1994) conducted in Australia, a population‐based case–control study on 416 histologically confirmed primary gliomas (20–70years) diagnosed between 1987 and 1991 in 14 hospitals in Melbourne. Controls (N = 409) were selected from a random sample of people registered on the Victorian Electoral Roll and resident in the same area from which cases were recruited and matched to cases by sex and age. Dietary intake was assessed by a food frequency questionnaire (59 food items). The response rate in the study was 86% among cases and 65% among controls. After adjusting for alcohol and tobacco, an increased risk was observed for high intake of NDMA among in men (T3 vs. T1 OR: 1.78; 95% CI: 1.12–2.84) but not for women (T3 vs. T1 OR: 1.45; 95% CI: 0.78–2.68). In a subgroup analysis, women with low levels of beta‐carotene and high levels on NDMA intake were at an increased risk of glioma (T3 vs. T1 OR: 3.1; 95% CI: 1.1–9.0). The limitations of the study are the low response rate of controls; the lack of adjustments for other dietary items such as vegetables intake and the use of proxy interviews.
Bunin et al., 1994 conducted a case–control study of maternal diet during pregnancy and risk of astrocytoma. The study included 155 cases and 155 controls (< 6 years). Cases were registered in the Children's Cancer Group, a cooperative group of paediatric oncology from North America and Canada. Controls were selected by random‐digit dialling matched to cases by telephone area code. A food frequency questionnaire (53 items) was used to assess diet during pregnancy. After controlling for income levels, no association was found between maternal diet and risk of astrocytoma in the offspring including the intake of N‐NAs (Q4 vs. Q1, OR = 0.8; 95% CI: 0.4–1.6). The limitations of the study are the small sample size, the high possibility of misclassification of exposure due to recall bias and the lack of control for smoking and other confounding factors.
Ward et al. (2000) conducted a case–control study in Taiwan to investigate the association between N‐NA intake and nasopharyngeal carcinoma. Cases (N = 375) of nasopharyngeal carcinoma were identified in two referral hospitals in Taipei. Controls (N = 327) were selected from the same district or township as the cases using the National Household Registration System. They were matched to the cases by gender and in 5‐year groups. A food frequency questionnaire (66 food items) was used to assess subjects dietary intake as adults. Mother of cases (N = 96) and controls (N = 120) were also interviewed about their children's diet at age 10, age 3 and weaning period using a food frequency questionnaire of 33 foods. Foods were categorised as low in N‐NAs for values of 0, medium low for values 0–1 ppb and high for values of 5 ppb or more. The CYP2E1 genotype was determined, but they were not able to evaluate effect modification because of the low prevalence of homozygosity. After adjustments for age, gender, ethnicity and vegetable intake, high intake of N‐NAs from soybean products was not associated with nasopharyngeal carcinoma in any age. However, total N‐NAs intake in age 3 (OR: 2.6, 95% CI 1.0–7.0) and weaning (OR: 3.9, 95% CI 1.4–10.4) were associated with an increased risk. Intake of N‐NAs during adulthood was not associated with an increased risk of nasopharyngeal carcinoma. The limitation of the study is the recall bias, the low and different response rates of mothers of cases (47.3 %) and controls (63.2%) and the lack of control for smoking in the multivariate models.
F.3 N‐NA intake via drug contamination
Adami et al. (2021) conducted a retrospective cohort study within Danish Prescription Registry and compared the risk of cancer (oesophageal, stomach, liver, pancreatic) among first users of histamine‐2 receptor blockers (H2RBs) Ranitidine (N = 103,565) vs. users of others H2RBs (N = 182,497) and vs. users of proton pump inhibitors (PPIs) (N = 807,725). No differences were observed for any cancer except for oesophageal adenocarcinoma (Ranitidine vs. others H2RBs, HR: 1.30; 95% CI: 1.01–1.68) (Ranitidine vs. PPIs, HR: 1.27; 95% CI: 1,04–1.56). However, when the analysis was restricted to those with at least 10 prescriptions and 10 years of follow‐up no association was found. Limitations were the low number of cancer events and no control for important confounders such as smoking, diet, alcohol, BMI and occupation.
Cardwell et al. (2021) conducted a nested case–control study within the Scottish Primary Care Clinical Informatics Unit Research database (N = 3,260 cases and 14,037 controls). Bladder cancer cases were frequency matched to 5 controls. Information on use of Ranitidine, other histamine‐2 receptor agonists and proton pump inhibitors were identified from prescribing records. An increased risk of bladder cancer was found in ranitidine users, compared with no users (OR: 1.22;95% CI 1.06–1.40 p‐trend = 0.005), and the effect was greater with prolonged use ( > 3 years) of ranitidine (OR: 1.43; 95% CI 1.05–1.94) after adjusting for comorbidities and smoking. Limitations were no control for important confounders such as diet, BMI and occupation.
Yoon et al. (2021) conducted a cohort study using the Health Insurance Review and Assessment (HIRA) database in South Korea. They compared users of Ranitidine (N = 88,416) with users of Famotidine (N = 10,129) ( > 1 year exposure). They found no association between use of Ranitidine and overall cancer risk (HR 0.99, 95% CI 0.91–1.07, p = 0.716). However, an increased risk, although not statistically significant, was found for bladder cancer (HR: 1.41; 95% CI: 0.88–2.24). They matched groups by sex, age, diabetes and cumulative exposure instead of controlling for these factors in the Cox model. The lack of control for important confounding factors such as smoking was also a limitation of the study.
Kim et al. (2021) conducted a study, using the Korean database IBM Explorys. They compared incidence of GI cancer (oesophagus, stomach, liver, pancreas, colonrectum) among users of Ranitidine (N = N = 581,028) with users of famotidine (N = 909,970) or omeprazole (N = 2,179,048). They used logistic regression models to estimate risks and found a statistically inverse association between Ranitidine use and risk of all cancer types (ORs varying from 0.39 to 0.51) comparing with users of famotidine or omeprazole. The main limitation of the study is the study design. They said it was a cohort study, but they analysed data as a case–control study without matching cases to controls and thus introducing a bias in the study. Moreover, it was not clear whether or not the ORs reported were adjusted.
Pottegård et al. (2018) conducted a 5‐year cohort study (N = 5150) to investigate the association between the use of contaminated Valsartan products and risk of cancer. The National Prescription Registry of Denmark was used to identify subjects' exposure to NDMA contamination. The median follow‐up was 4.6 years (interquartile range 2.0–5.5 years). After controlling for confounders, no association was found between subjects exposed to possibly NDMA contaminated valsartan products and overall cancer in comparison to subjects exposed to valsartan products unlikely to be contaminated with NDMA (HR: 1.09, 95% CI: 0.85–1.41). Subgroup analysis by cancer type showed an increased risk, although not statistically significant, for colorectal (N = 51, HR: 1.46; 95% CI: 0.79–2.73), melanoma (N = 17, HR: 1.34; 95% CI: 0.46–3.85), uterine (N = 15, HR: 1.81; 95% CI: 0.55–5.90) and prostate cancer (N = 47, HR: 1.33; 95% CI: 0.68–2.62). Limitations of the study were the short follow‐up time, small sample size and lack of control for important confounding factors.
Gomm et al. (2021) conducted a cohort study (N = 780,871) to study the relation between NDMA‐contaminated Valsartan and the risk of cancer. Participants were individuals who had filled a prescription for Valsartan between 2012 and 2017 and data were obtained from a large German statutory health insurance provider. No association was found between exposure to NDMA‐contaminated valsartan and overall risk of cancer (HR: 1.01; 95% CI: 0.99; 1.03) after controlling for sex and age. However, a statistically significant association was found between exposure to NDMA‐contaminated Valsartan and hepatic cancer (HR 1.16; 95% CI: 1.03; 1.31) after controlling for sex, age, anti‐inflammatory drugs, polypharmacy and comorbidities. Limitations of the study include the lack of control for important confounding factors such as smoking, diet and occupation.
Pottegård et al. (2018) conducted a cohort study to investigate the association between the use of contaminated Valsartan products and risk of cancer. The cohort included 5150 Danish patients using valsartan from 2012 to 2017 aged 40 years or older. The National Prescription Registry of Denmark was used to identify subjects' exposure to NDMA contamination (single valsartan product and its manufacturer). The authors assumed a daily exposure to NDMA ranging between 0.14 and 0.31 μg/kg bw per day. Cancer outcomes were obtained from the Danish Cancer Registry (updated in 2016) and from the Danish National Patient Registry to ascertain outcomes from 1 January 2017 to 30 June 2018. The number of cancer cases in the period of observation was 302. The lag time from exposure was 1 year. The median follow‐up was 4.6 years (interquartile range 2.0–5.5 years). After controlling for confounding factors, no association was found between NDMA contaminated valsartan products and cancer (HR: 1.09, 95% CI: 0.85–1.41). When a lag time of 2 years was applied, risk estimates increased to 1.17; CI: 95% 0.88–1.55. Subgroup analysis by cancer type showed an increased risk, although not statistically significant, for colorectal (N = 51, HR: 1.46; 95% CI: 0.79–2.73), melanoma (N = 17, HR: 1.34; 95% CI: 0.46–3.85), uterine (N = 15, HR: 1.81; 95% CI: 0.55–5.90) and prostate cancer (N = 47, HR: 1.33; 95% CI: 0.68–2.62). The limitation of the study is the sample size, the follow‐up time of the study that was probably not long enough for the outcomes to occur and the lack of control for other confounding factors such as smoking.
Gomm et al. (2021) conducted a cohort study (N = 780,871) to study the relation between NDMA‐contaminated valsartan and the risk of cancer. Participants were individuals who had filled a prescription for valsartan between 2012 and 2017. The lag time from exposure was 3 years. Data were obtained from a large German statutory health insurance provider. No association was found between exposure to NDMA‐contaminated valsartan and the overall risk of cancer after controlling for sex, age, polypharmacy (defined as prescription of five or more different drugs), prescription of low‐dose acetylsalicylic acid (ASA), non‐ASA non‐steroidal anti‐inflammatory drugs, 5α‐reductase inhibitors, statins, spironolactone, glucocorticoids for systemic use, selective serotonin reuptake inhibitors and hormone replacement therapy, the comorbidities diabetes, chronic obstructive pulmonary disease, congestive heart failure, alcohol‐related diseases and the Charlson comorbidity index (score). A statistically significant association was found between exposure to NDMA‐contaminated valsartan and hepatic cancer (HR 1.16; 95% CI: 1.03; 1.31). The limitation of the study is the lack of control for other potential confounding factors such as smoking.
Appendix G – List of uncertainties 27
Table G.1. Hazard identification and characterisation
| Main group | Subgroup | Uncertainty assessment question | Sources of uncertainty in the opinion |
Priority ranking of the Uncertainty 28 0 – U with negligible priority 1 – U with low priority 2 – U with medium priority 3 – U with high priority |
|
Chemical composition and analytical methods |
Chemical composition |
Is there uncertainty associated with the dose in the critical studies used in the risk assessment? |
NDEA as well as several N‐NAs have been considered as volatile. However, the volatility is very low at the controlled conditions used in the critical study and the doses were controlled throughout the experiment. An indirect method was used to measure N‐NAs in lower doses; however, the method was considered sound. Spillage of drinking water estimated around 5% may lead to some overestimation of the dose. |
2 |
| Background N‐NAs in the feed and drinking water may lead to underestimation of the dose. However, background N‐NAs in the feed and drinking water in the critical study before addition of N‐NAs were monitored. | 1 | |||
| Analytical methods | Sufficiently tested methods are available. | 1 | ||
| Hazard identification and characterisation | ADME |
Is there uncertainty in any aspect of ADME? |
Sufficient information was available for only a few N‐NAs but could be extrapolated for others. | 1 |
| No accumulation is expected based on the available studies | 0 | |||
| Factors compromising liver function will decrease the bioactivation of N‐NAs in liver and increase extrahepatic distribution. | 1 | |||
| Extensive mechanistic studies were performed on the metabolism of N‐NAs. | 1 | |||
| Limited information was available regarding the relevance in humans, genetic background/susceptibility/sensitive populations, however it was mostly consistent with the animal studies. | 1 | |||
| Toxicity studies in experimental animals: critical endpoints and critical study design |
Are there sources of uncertainties in the design of the studies in experimental animals? |
Few and limited developmental and reproductive studies were available leading to uncertainty for more sensitive endpoints related to young animals. However, the doses used so far were higher than the ones tested in the critical study on carcinogenesis. | 2 | |
| Are there uncertainties in the use of the animal model? | The adverse effect considered was the carcinogenicity in liver. The data in humans for this target site are limited and therefore the uncertainty for the target site is high. However, overall the animal model is relevant for the adverse effect identified, i.e. cancer in humans | 1 | ||
| Dose–response information on DNA adducts which would be the most sensitive effect to consider is limited. The formation of benign or malignant tumours was considered the most reliable effect. | 1 | |||
| Genotoxicity | Is there uncertainty on the genotoxicity of the substance? | For NDMA, NMEA, NDEA, NDPA, NDBA, NMOR, NPIP and NPYR, conclusive and consistent information is provided from in vivo and in vitro studies. The genotoxic potential of the remaining two (NMA and NSAR) is limited to in vitro assays and QSAR/read‐across analysis | 1 | |
| Mixture group membership and interactions | Is there uncertainty on the extent and profile of effects due to co‐exposure (e.g. metabolites, interaction of chemicals, combined effects)? | Considering that the MoA for the carcinogenicity of N‐NAs is similar and CYP isozymes can interact with more than one N‐NA, additive interactions are to be expected. | 1 | |
| Mode of action |
Are there uncertainties on the MoA of the substance that could affect the conclusions of the risk assessment? Is there uncertainty on the human relevance of the MoA identified in experimental animals? |
Although there are still UCs regarding the potency of some N‐NAs as well as the target sites in humans, the MoA is consistent regarding the possible formation of tumours in humans. | 1 | |
| Substances used and read across | Are there uncertainties in in the selection of one or a group of chemicals to perform read across regarding the information supporting the proposed chemical and toxicological mechanisms and the potency of the hazard e.g. according to QSAR or BMD modelling and dose response analysis? | NDEA, NDMA, NMEA and NMOR were found to have similar potencies. Based on the available data, it was not possible to confirm the potency for other N‐NAs. Due to inconsistent/limited information, similar potencies were attributed to all N‐NAs. | 1 | |
|
Toxicological data were found for all N‐NAs in food; however, for some only limited data were available. – |
1 |
|||
| Selection of reference point | What are the uncertainties in the use of NOAEL/LOAEL due to lack of appropriate BMDL? | A reference point equal to the BMDL of NDEA was attributed to the N‐NAs. That is a conservative approach leading to underestimation of the BMDL. | 3 | |
| Are there uncertainties in the selection of the RP that are not covered by the BMD confidence interval e.g. is model uncertainty covered? | Spillage of water during the dosing | 2 | ||
| Dose–response analysis of critical endpoints | Is there uncertainty regarding the dose–response analysis e.g. trend occurrence, large data variation, possible covariants? | Raw data were not available; however, the endpoint of tumour detection is expected to be accurately reported | 1 | |
| The dose–response relationship was well defined | 1 |
Table G.2. Occurrence and exposure
| Main group | Subgroup | Uncertainty assessment question |
Sources of uncertainty in the opinion |
Priority ranking of the Uncertainty 28 0 – U with negligible priority 1 – U with low priority 2 – U with medium priority 3 – U with high priority |
| Occurrence data | Analytical measurements | Is there uncertainty due to the performance of the analytical method? This may include identification, sensitivity and recovery | This uncertainty is applicable to both occurrence and literature data used in the assessment and considered having a low impact on the assessment assuming standard quality methodologies are normally used in the laboratories (also when the information on analytical method is not available) | 1 |
| This uncertainty is applicable to both occurrence and literature data used in the assessment. The high percentage of LC data leads to uncertainty in the assessment that was dealt with the substitution method. This uncertainty was considered having high priority and the need for a quantitative assessment. | 3 | |||
| This uncertainty is applicable to both occurrence and literature data used in the assessment and considered having a low impact on the assessment due to the use of standard quality methodologies | 1 | |||
| This uncertainty is applicable to both occurrence and literature data used in the assessment and considered having a low impact on the assessment due to the use of standard methodologies | 1 | |||
| Data reporting | Is there uncertainty on whether there are errors in the reported occurrence data or linked to missing information? | This uncertainty is applicable to both occurrence and literature data used in the assessment. Errors cannot be excluded although outliers were carefully analysed and feedback from the data provider was sought when needed. This uncertainty is considered having a low impact on the assessment | 1 | |
| This uncertainty is applicable to both occurrence and literature data used in the assessment but considered having a low impact on the assessment | 1 | |||
| Is there uncertainty in the information on sampling strategy | This uncertainty could be applicable to both occurrence and literature data used in the assessment but considered having a negligible impact on the assessment as likely most data were collected randomly. | 0 | ||
| Is there uncertainty in the information on processing, e.g. processing prior to the analysis of the samples | The type of processing prior to the analysis of sample and relevant to this opinion was partially captured by the food category description (e.g. cured meat vs. fresh meat) thus it is expected that the occurrence data would capture its effects. | 1 | ||
| Is there uncertainty in the form of the food reported (cooked/uncooked, powder/liquid/reconstituted etc.) | Uncertainty due to the impact of cooking is applicable to both occurrence and literature data used in the assessment and considered having a medium impact on the assessment in this opinion | 2 | ||
| Representativeness and completeness of the data | Is there uncertainty in the occurrence data due to limited data availability | Detailed occurrence data were available for several food categories but for others extrapolation was needed thus some uncertainty was introduced considered to have a medium impact on the assessment | 2 | |
| This uncertainty is applicable, but it was dealt with by converting consumed composite dish containing ingredients related to food categories that are main contributors to the exposure into their relevant ingredient amount | 1 | |||
| This uncertainty is applicable to both occurrence and literature data across all compounds and food categories used in the assessment and considered having a medium impact on the assessment in this opinion. In particular, the concentration in fresh mammal and bird meat for NDBA, NDEA, NDMA, NPIP and NPYR were derived from only 8 samples available in Kocak et al. (2012) | 2 | |||
| This uncertainty is applicable to both occurrence (only 4 reporting countries) and literature data used in the assessment and considered having a medium impact on the assessment in this opinion | 2 | |||
| Not applicable. Only more recent data (> 2000) where included in the assessment although this limited the availability data (aspect addressed in other uncertainty sections) | 0 | |||
| Detailed occurrence data were available for several food categories but for others extrapolation was needed thus some uncertainty was introduced considered to have a medium impact on the assessment | 2 | |||
| Not applicable as these variables were not taken into account in the opinion | 0 | |||
| Is there uncertainty in the occurrence data due to lack of data for potentially relevant major food categories? | Data were available for only a limited number of food categories (for NDPA, NMA, NMEA and NSAR only for one food category) and it is not clear if lack of data is linked to the absence of the compounds in the food. This uncertainty was considered of high priority and bringing the need for a quantitative assessment | 3 | ||
| Multiple chemicals and metabolites | Is there uncertainty in the occurrence data due to that not all relevant substances are reported. |
This uncertainty is applicable, but it was dealt by assuming all N‐NAs co‐occur in the same sample by summing the average occurrence of compounds (with and without potency factors) in all foods. The impact on a potential underestimation is negligible. |
0 | |
| Left censorship | Is there uncertainty in the occurrence data due to extrapolation or use of models? | This uncertainty is applicable to both occurrence and literature data used in the assessment. The high percentage of LC data leads to uncertainty in the assessment that was dealt with the substitution method. This uncertainty was considered having high priority and bringing the need for a quantitative assessment. | 3 | |
| Is there uncertainty in the occurrence data due to left censorship and the substitution method | This uncertainty is applicable to both occurrence and literature data used in the assessment. The high percentage of LC data leads to uncertainty in the assessment that was dealt with the substitution method. This uncertainty was considered having high priority and the need for a quantitative assessment. | 3 | ||
| Consumption data | Data reporting |
Is there uncertainty in the consumption data due to errors e.g. in classification, body weight, age, memory errors, etc.? Is there uncertainty in consumption data, e.g. due to methodology of the dietary survey, weekdays, national recipes? Is there uncertainty in the form of the food reported (powder/liquid/reconstituted etc.) |
This uncertainty is applicable but standard across all opinions and already documented in EFSA 2011 and considered to have a low priority |
1 |
| Representativeness of the data | Is there uncertainty in the representativeness of the consumption data (e.g. of the countries, special population groups, sample size and response rates). | This and other uncertainties related to the consumption database are standard across all opinions and already documented in EFSA 2011 and considered to have a low priority. | 1 | |
| Dietary Exposure estimates methodology | Is there uncertainty linked to the methodology used for calculating the exposure? | This uncertainty is applicable but the method used is of acknowledged quality thus the uncertainty is considered to have a low priority. | 1 |
No additional uncertainties were identified specific to the risk characterisation.
Annexes
Annex A – Protocol for human risk assessment related to the presence of N‐nitrosamines in food
Annex B – BMD analyses
Annex C – Occurrence data provided to EFSA and retrieved from the literature that have been used in the exposure assessment
Annex D – Prediction of TD50s for NMAMPA and NMAMBA by Read Across with the OECD QSAR Toolbox v 4.4
Annex E – Protocol for an Expert Knowledge Elicitation on the Uncertainty of the Risk Assessment of N‐nitrosamines in food
Annex F – Outcome of the public consultation
Annexes Annex A – Protocol for human risk assessment related to the presence of N‐nitrosamines in food, Annex B – BMD analyses, Annex C – Occurrence data provided to EFSA and retrieved from the literature that have been used in the exposure assessment, Annex D – Prediction of TD50s for NMAMPA and NMAMBA by Read Across with the OECD QSAR Toolbox v 4.4, Annex E – Protocol for an Expert Knowledge Elicitation on the Uncertainty of the Risk Assessment of N‐nitrosamines in food–F are available under the Supporting Information section on the online version of the scientific output.
Supporting information
Protocol for human risk assessment related to the presence of N‐nitrosamines in food
BMD analyses
Occurrence data provided to EFSA and retrieved from the literature that have been used in the exposure assessment
Prediction of TD50s for NMAMPA and NMAMBA by Read Across with the OECD QSAR Toolbox v 4.4
Protocol for an Expert Knowledge Elicitation on the Uncertainty of the Risk Assessment of N‐nitrosamines in food
Outcome of the public consultation
Suggested citation: EFSA CONTAM Panel (EFSA Panel on Contaminants in the Food Chain) , Schrenk D, Bignami M, Bodin L, Chipman JK, del Mazo J, Hogstrand C, Hoogenboom L, Leblanc J‐C, Nebbia CS, Nielsen E, Ntzani E, Petersen A, Sand S, Schwerdtle T, Vleminckx C, Wallace H, Romualdo B, Cristina F, Stephen H, Marco I, Mosbach‐Schulz O, Riolo F, Christodoulidou A and Grasl‐Kraupp B, 2023. Scientific Opinion on the risk assessment of N‐nitrosamines in food. EFSA Journal 2023;21(3):7884, 278 pp. 10.2903/j.efsa.2023.7884
Requestor: European Commission
Question number: EFSA‐Q‐2020‐00665
Panel members: Margherita Bignami, Laurent Bodin, James Kevin Chipman, Jesús del Mazo, Bettina Grasl‐Kraupp, Christer Hogstrand, Laurentius (Ron) Hoogenboom, Jean‐Charles Leblanc, Carlo Stefano Nebbia, Elsa Nielsen, Evangelia Ntzani, Annette Petersen, Salomon Sand, Dieter Schrenk, Tanja Schwerdtle, Christiane Vleminckx and Heather Wallace.
Declarations of interest: If you wish to access the declaration of interests of any expert contributing to an EFSA scientific assessment, please contact interestmanagement@efsa.europa.eu.
Acknowledgements: The CONTAM Panel wishes to thank the hearing expert Andy Hart for providing expertise in the uncertainty assessment and Marco Binaglia, Ben Whitty and Federico Cruciani for the support provided to this scientific output. The Panel wishes to acknowledge all European competent institutions, Member State bodies and other organisations that provided data for this scientific output.
EFSA may include images or other content for which it does not hold copyright. In such cases, EFSA indicates the copyright holder and users should seek permission to reproduce the content from the original source.
Adopted: 25 January 2023
Annexes A–F are available under the Supporting Information section on the online version of the scientific output.
Notes
i.e. 98–100% probability (EFSA, 2019c).
Regulation (EC) No 178/2002 of the European Parliament and of the Council of 28 January 2002 laying down the general principles and requirements of food law, establishing the European Food Safety Authority and laying down procedures in matters of food safety. OJ L 31, 1.2.2002, pp. 1–24.
Council Directive 1999/13/EC of 11 March 1999 on the limitation of emissions of volatile organic compounds due to the use of organic solvents in certain activities and installations. OJ L 85, 29.3.1999, pp. 1–22 [no longer in force].
The directive defines a volatile organic chemical as ‘any organic compound having an initial boiling point less than or equal to 250°C (482°F) measured at a standard atmospheric pressure of 101.3 kPa.’ https://en.wikipedia.org/wiki/Volatile_organic_compound#European_Union
Regulation (EC) No 1333/2008 of the European Parliament and of the Council of 16 December 2008 on food additives. OJ L 354, 31.12.2008, pp. 16–33.
Regulation (EC) No 1333/2008 of the European Parliament and of the Council of 16 December 2008 on food additives (Text with EEA relevance) OJ L 354, 31.12.2008, pp. 16–33.
Commission Directive 93/11/EEC of 15 March 1993 concerning the release of the N‐nitrosamines and N‐ nitrosatable substances from elastomer or rubber teats and soothers. OJ L 93, 17.4.1993, pp. 37–38.
Regulation (EC) No 1223/2009 of the European Parliament and of the Council of 30 November 2009 on cosmetic products. OJ L 342, 22.12.2009, p. 59–209.
Directive 2009/48/EC of the European Parliament and of the Council of 18 June 2009 on the safety of toys. OJ L 170, 30.6.2009, pp. 1–37.
Current call: https://www.efsa.europa.eu/en/call/call-continuous-collection-chemical-contaminants-occurrence-data-0
Identifying articles that have been cited in articles found in a search.
Outside the scope of this opinion.
For a more detail explanation on TD50, see Section 3.1.8.
A probability bound is a probability or range of probabilities for a specified range of values for a parameter.
A 'lower 1% probability bound’ is a value such that there is at most 1% probability of lower values; an upper 1% probability bound is a value such that there is at most 1% probability of higher values. These are, respectively, as the lower and upper bounds of the Panel's plausible range, which is a > 98% probability interval.
i.e. 98–100% probability (EFSA, 2019c).
Relevant uncertainties are also discussed in the text of the draft opinion.
With respect to the impact on the outcome of the hazard identification and characterisation and the exposure estimations.
References
- Adami HO, Trolle Andersen I, Heide‐Jørgensen U, Chang ET, Nørgaard M and Toft Sørensen H, 2021. Ranitidine use and risk of upper gastrointestinal CancersRanitidine and upper gastrointestinal cancers. Cancer Epidemiology, Biomarkers and Prevention, 30, 2302–2308. [DOI] [PubMed] [Google Scholar]
- Adamson RH, 1989. Induction of hepatocellular carcinoma in nonhuman primates by chemical `carcinogens. Cancer Detection and Prevention, 14, 215–219. [PubMed] [Google Scholar]
- Adamson RH and Sieber SM, 1979. The use of nonhuman primates for chemical carcinogenesis studies. Book: regulatory aspects of carcinogenesis and food additives: the Delaney clause. Ecotoxicology and Environmental Safety, 2, 275–302. [Google Scholar]
- Adamson RH and Sieber SM, 1983. Chemical carcinogenesis studies in nonhuman primates. Basic Life Sciences, 24, 129–156. 10.1007/978-1-4684-4400-1_7 [DOI] [PubMed] [Google Scholar]
- Ahn HJ, Kim JH, Jo C, Lee CH and Byun MW, 2002a. Reduction of carcinogenic N‐Nitrosamines and residual nitrite in model system sausage by irradiation. Journal of Food Science, 67, 1370–1373. [Google Scholar]
- Ahn HJ, Yook H, Rhee M, Lee C, Cho Y and Byun M, 2002b. Application of gamma irradiation on breakdown of hazardous volatile N‐Nitrosamines. Journal of Food Science, 67, 596–599. [Google Scholar]
- Airoldi L, Bonfanti M, Magagnotti C and Fanelli R, 1987. Experimental model for investigating bladder carcinogen metabolism using the isolated rat urinary bladder. IARC Scientific Publications, 84, 159–161. [PubMed] [Google Scholar]
- Airoldi L, Bonfanti M, Chiappetta L, Lolli M, Medana C, De Gregorio G and Fanelli R, 1994. Detection of O6‐butyl‐ and O6‐(4‐hydroxybutyl)guanine in urothelial and hepatic DNA of rats given the bladder carcinogen N‐nitrosobutyl(4‐hydroxybutyl)amine. Carcinogenesis, 15, 2297–2301. [DOI] [PubMed] [Google Scholar]
- Alaneme FO and Maduagwu EN, 2004. Pharmacokinetics of biliary excretion of N‐nitrosodimethylamine in rats fed diets containing levels of protein. Malawi Medical Journal, I60, 6–8. [PMC free article] [PubMed] [Google Scholar]
- Alexandrov VA, 1968. Blastomogenic effect of dimethylnitrosamine on pregnant rats and their offspring. Nature, 218, 280–281. [DOI] [PubMed] [Google Scholar]
- Alexandrov VA, 1974. Embryotoxic and transplacental oncogenic action of symmetrical dialkylnitrosamines on the progeny of rats. Bulletin of Experimental Biology and Medicine, 78, 1308–1310. [Google Scholar]
- Al‐Kaseem M, Al‐Assaf Z and Karabeet F, 2014. Development and validation of GC‐FID method for the determination of volatile N‐nitrosamines in meat. International Journal of Pharmaceutical Sciences Review and Research, 25, 59–64. [Google Scholar]
- ATSDR (Agency for Toxic Substances and Disease Registry) , 2017. Toxicological Profile for N‐nitrosodiphenylamine. ATSDR, Atlanta, GA. [PubMed] [Google Scholar]
- ATSDR (Agency for Toxic Substances and Disease Registry) , 2019. Toxicological Profile for N‐Nitrosodi‐n‐Propylamine. ATSDR, Atlanta, GA. [PubMed] [Google Scholar]
- ATSDR (Agency for Toxic Substances and Disease Registry) , 2022. Toxicological Profile for N‐nitrosodimethylamine. ATSDR, Atlanta, GA. [PubMed] [Google Scholar]
- Althoff J, Krüger FW, Mohr U and Schmahl D, 1971. Dibutylnitrosamine carcinogenesis in Syrian golden and Chinese hamsters. Proceedings of the Society for Experimental Biology and Medicine, 136, 168–173. [DOI] [PubMed] [Google Scholar]
- Althoff J, Krueger FW and Mohr U, 1973. Carcinogenic effect of dipropylnitrosamine and compounds related by beta oxidation. Journal of the National Cancer Institute, 51, 287–288. [DOI] [PubMed] [Google Scholar]
- Althoff J, Wilson R, Cardesa A and Pour P, 1974. Comparative studies of neoplastic response to a single dose of nitroso compounds. 3. The effect of N‐nitrosopiperidine and N‐nitrosomorpholine in Syrian golden hamsters. Zeitschrift für Krebsforschung und Klinische. Onkologie, 81, 251–259. 10.1007/BF00305027 [DOI] [PubMed] [Google Scholar]
- Althoff J, Eagen M and Grandjean C, 1975. Carcinogenic ERect of 2, 2′‐Dimethyldipropylnitrosamine in Syrian Hamsters. Journal of the National Cancer Institute, 55, 1209–1211. [DOI] [PubMed] [Google Scholar]
- Althoff J, Grandjean C and Pour P, 1977. Transplacental Effect of Nitrosamines in Syrian Hamsters. IV. Metabolites of Dipropyl‐and Dibutylnitrosamine. Zeitschrift für Krebsforschung und Klinische Onkologie, 90, 119–126. [DOI] [PubMed] [Google Scholar]
- Althoff J and Grandjean C, 1979. In vivo studies in Syrian golden hamsters: a transplacental bioassay of ten nitrosamines. National Cancer Institute of Monograph, 51, 251–255. [PubMed] [Google Scholar]
- Amacher DE and Paillet SC, 1982. Hamster hepatocyte‐mediated activation of procarcinogens to mutagens in the L5178Y/TK mutation assay. Mutation Research, 106, 305–316. [DOI] [PubMed] [Google Scholar]
- Amelin VG and Lavrukhin DK, 2016. Combination of microwave heating extraction and dispersive liquid−liquid microextraction for the determination of nitrosoamines in foods using gas−liquid chromatography with a mass‐spectrometric detector. Journal of Analytical Chemistry, 71, 359–364. [Google Scholar]
- Anderson LM, Giner‐Sorolla A, Ebeling D and Budinger JM, 1978. Effects of imipramine, nitrite, and dimethylnitrosamine on reproduction in mice. Res Commun Chem Pathol Pharmacol, 19, 311–327. [PubMed] [Google Scholar]
- Anderson LM, Harrington GW, Pylypiw HM Jr, Hagiwara A and Magee PN, 1986. Tissue levels and biological effects of N‐nitrosodimethylamine in mice during chronic low or high dose exposure with or without ethanol. Drug Metabolism and Disposition, 14, 733–739. [PubMed] [Google Scholar]
- Anderson LM, Hagiwara A, Kovatch RM, Rehm S and Rice JM, 1989. Transplacental initiation of liver, lung, neurogenic, and connective tissue tumors by N‐nitroso compounds in mice. Fundamental and Applied Toxicology, 12, 604–620. [DOI] [PubMed] [Google Scholar]
- Anderson LM, Koseniauskas R, Burak ES, Moskal TJ, Gombar CT, Phillips JM, Sansone EB, Keimig S, Magee PN, Rice JM and Harrington GW, 1992. Reduced blood clearance and increased urinary excretion of N‐nitrosodimethylamine in patas monkeys exposed to ethanol or isopropyl alcohol. Cancer Research, 52, 1463–1468. [PubMed] [Google Scholar]
- Anderson LM, Carterb JP, Driverb CL, Logsdonb DL, Kovatch RM and Giner‐Sorollad A, 1993. Enhancement of tumorigenesis by IV‐nitrosodiethylamine, IV‐nitrosopyrrolidine and N6(methylnitroso) ‐adenosine by ethanol. Cancer Letters, 68, 61–66. [DOI] [PubMed] [Google Scholar]
- Anderson LM, Koseniauskas R, Burak ES, Logsdon DL, Carter JP, Driver CL, Gombar CT, Magee PN and Harrington GW, 1994. Suppression of in vivo clearance of N‐nitrosodimethylmine in mice by cotreatment with ethanol. Drug Metabolism and Disposition, 22, 43–49. [PubMed] [Google Scholar]
- Anderson LM, Chhabra SK, Nerurkar PV, Souliotis VL and Kyrtopoulos SA, 1995. Alcohol‐related cancer risk: a toxico kinetic hypothesis. Alcohol, 12, 97–104. [DOI] [PubMed] [Google Scholar]
- Appel KE, Schrenck D, Schwarz M, Mahr B and Kunz W, 1980. Denitrosation of N‐nitrosomorpholine by liver microsomes: possible role of cytochrome P‐450. Cancer Letter, 9, 13–20. [DOI] [PubMed] [Google Scholar]
- Appel KE, Rühl CS, Spiegelhalder B and Hildebrandt AG, 1984. Denitrosation of diphenylnitrosamine in vivo. Toxicology Letters, 23, 353–358. [DOI] [PubMed] [Google Scholar]
- Appel KE, Rühl CS and Hildebrandt AG, 1985. Oxidative dealkylation and reductive denitrosation of nitrosomethylaniline in vitro. Chemico‐Biological Interactions, 53, 69–76. 10.1016/s0009-2797(85)80085-5 [DOI] [PubMed] [Google Scholar]
- Appel KE, Schoepke M, Scheper T, Görsdorf S, Bauszus M, Rühl CS, Kramer R, Ruf HH, Spiegelhalder B and Wiessler M, 1987. Some aspects of cytochrome P450‐dependent denitrosation of N‐nitrosamines. IARC Scientific Publications, 84, 117–123. [PubMed] [Google Scholar]
- Arai M, Aoki Y, Nakanishi K, Miyata Y, Mori T and Ito N, 1979. Long‐term experiment of maximal non‐carcinogenic dose of dimethylnitrosamine for carcinogenesis in rats. Gann, 70, 549–558. [PubMed] [Google Scholar]
- Araki A, Muramatsu M and Matsushima T, 1984. Comparison of mutagenicities of N‐nitrosamines on Salmonella typhimurium TA100 and Escherichia coli UVRA/pkm101 using rat and hamster liver S9. Gann, 10954, 8–16. [PubMed] [Google Scholar]
- Archer MC, Tannenbaum SR, Fan T‐Y and Weisman M, 1975. Reaction of nitrite with ascorbate and its relation to Nitrosamine formation. Journal of the National Cancer Institute, 54, 1203–1205. [DOI] [PubMed] [Google Scholar]
- Archer MC, 1989. Mechanisms of action of N‐nitroso compounds. [Review]. Journal of Cancer Survivorship, 8, 241–250. [PubMed] [Google Scholar]
- Arcos JC, Argus MF and Mathison JB, 1969. Hepatic carcinogenesis threshold and biphasic mitochondrial swelling response in the guinea‐pig during diethylnitrosamine administration. Experientia, 25, 296–298. 10.1007/BF02034405 [DOI] [PubMed] [Google Scholar]
- Argus MF and Hoch‐Ligeti C, 1961. Comparative study of the carcinogenic activity of nitrosamines. Journal of the National Cancer Institute, 27, 695–709. [PubMed] [Google Scholar]
- Argus MF and Hoch‐Ligeti C, 1963. Induction of malignant tumors in the guinea pig by oral administration of diethylnitrosamine. Journal of the National Cancer Institute, 30, 533–551. [PubMed] [Google Scholar]
- Atawodi SE and Maduagwu EN, 1990. Pharmacokinetics of biliary excretion of N‐nitrosodiphenylamine (NDPA) in animals of different species. European Journal of Drug Metabolism and Pharmacokinetics, 15, 27–29. 10.1007/BF03190124 [DOI] [PubMed] [Google Scholar]
- ATSDR (Agency for Toxic Substances and Disease Registry) , 2000. Toxicological Profile for Aldrin/Dieldrin. (Update). Draft for Public Comment, US Department of Health and Human Services, Public Health Service, Atlanta. [Google Scholar]
- Autrup H, Harris CC and Trump BF, 1978. Metabolism of acyclic and cyclic N‐nitrosamines by cultured human colon. Proceedings of the Society for Experimental Biology and Medicine. Society for Experimental Biology and Medicine, 159, 111–115. [DOI] [PubMed] [Google Scholar]
- Autrup H and Stoner GD, 1982. Metabolism of N‐Nitrosamines by Cultured Human and Rat Esophagus. Cancer Research, 42, 1307–1311. [PubMed] [Google Scholar]
- Avasilcai L, Nichifor M, Bireescu G and Cuciureanu R, 2014. Evaluation of the intake of nitrate, nitrite, Nitrosodiethylamine and Nitrosodimethylamine by food consumption. Environmental quality, 15, 33–39. [Google Scholar]
- Avlasevich SL, Phonethepswath S, Labash C, Carlson K, Torous DK, Cottom J, Bemis JC, MacGregor JT and Dertinger SD, 2014. Diethylnitrosamine genotoxicity evaluated in Sprague Dawley rats using Pig‐a mutation and reticulocyte micronucleus assays. Environmental and Molecular Mutagenesis, 55, 400–406. [DOI] [PubMed] [Google Scholar]
- Baker JR, Mason MM, Yerganian G, Weisburger EK and Weisburger JH, 1974. Induction of tumors of the stomach and esophagus in inbred Chinese hamsters by oral diethylnitrosamine. Proceedings of the Society for Experimental Biology and Medicine, 146, 291–293. 10.3181/00379727-146-38090 [DOI] [PubMed] [Google Scholar]
- Barnes JM and Magee PN, 1954. Some toxic properties of dimethylnitrosamine. British Journal of Industrial Medicine, 11, 167–174. [DOI] [PMC free article] [PubMed] [Google Scholar]
- Bastide N, Naud N, Nassy G, Vendeuvre JL, Taché S, Guéraud F, Hobbs DA, Kuhnle GG, Corpet DE and Pierre FHF, 2017. Red wine and pomegranate extracts suppress cured meat promotion of Colonic Mucin‐Depleted Foci in carcinogen‐induced Rats. Nutrition and Cancer, 69, 289–298. [DOI] [PubMed] [Google Scholar]
- Bauman PA, Hotchkiss JH and Parker RS, 1985. Metabolism of N‐nitrosodi‐n‐propylamine and N‐nitrosodiallylamine by isolated rat hepatocytes. Cancer Letters, 28, 229–236. 10.1016/0304-3835(85)90079-5 [DOI] [PubMed] [Google Scholar]
- Baxter ED, Slaiding IR and Travers V, 2007. Current incidence of N‐nitrosodimethylamine in beers worldwide. Food Additives and Contaminants, 24, 807–811. [DOI] [PubMed] [Google Scholar]
- Beard JC and Swager TM, 2021. An organic chemist's guide to N‐nitrosamines: their structure, reactivity, and role as contaminants. The Journal of Organic Chemistry, 86, 2037–2057. [DOI] [PMC free article] [PubMed] [Google Scholar]
- Bellec G, Dreano Y, Lozach P, Menez JF and Berthou F, 1996. Cytochrome P450 metabolic dealkylation of nine N‐nitrosodialkylamines by human liver microsomes. Carcinogenesis, 17, 2029–2034. [DOI] [PubMed] [Google Scholar]
- Berger MR, Schmähl D and Zerban H, 1987. Combination experiments with very low doses of three genotoxic N‐nitrosamines with similar organotropic carcinogenicity in rats. Carcinogenesis, 8, 1635–1643. 10.1093/carcin/8.11.1635 [DOI] [PubMed] [Google Scholar]
- Bertram JS and Craig AW, 1970. Induction of bladder tumours in mice with dibutylnitrosamine. British Journal of Cancer, 24, 352–359. [DOI] [PMC free article] [PubMed] [Google Scholar]
- Bhangare RC, Sahu SK and Pandit GG, 2016. Nitrosamines in seafood and study on the effects of storage in refrigerator. Journal of Food Science and Technology, 52, 507–513. [Google Scholar]
- Bhattacharyya K, 1965. Foetal and neonatal responses to hepatotoxic agents. The Journal of Pathology and Bacteriology, 90, 151–161. [PubMed] [Google Scholar]
- Bhattacharya S, Reddy D, Ingle A, Khade B and Gupta S, 2016. Brief Communication: Featured Article: histone H2A mono‐ubiquitination and cellular transformation are inversely related in N‐nitrosodiethylamine‐induced hepatocellular carcinoma. Experimental Biology and Medicine, 241, 1739–1744. [DOI] [PMC free article] [PubMed] [Google Scholar]
- Bian Y, Wang C, Zhu G, Ren B, Zhang P and Hursthouse AS, 2019. Occurrence and control of N‐nitrosodimethylamine in water engineering systems. Environmental Engineering Research, 24, 1–16. [Google Scholar]
- Boeing H, Schlehofer B, Blettner M and Wahrendorf J, 1993. Dietary carcinogens and the risk for glioma and meningioma in Germany. International Journal of Cancer, 53, 561–565. [DOI] [PubMed] [Google Scholar]
- Bonfanti M, Magagnotti C, Galli A, Bagnati R, Moret M, Gariboldi P, Fanelli R and Airoldi L, 1990. Determination of O6‐butylguanine in DNA by immunoaffinity extraction/gas chromatography‐mass spectrometry. Cancer Research, 50, 6870–6875. [PubMed] [Google Scholar]
- Bonfanti M, Magagnotti C, Bonati M, Fanelli R and Airoldi L, 1988. Pharmacokinetic profile and metabolism of N‐nitrosobutyl‐(4‐hydroxybutyl)amine in rats. Cancer Research, 48, 3666–3669. [PubMed] [Google Scholar]
- Bonifacie A, Promeyrat A, Nassy G, Gatellier P, Santé‐Lhoutellier V and Théron L, 2021. Chemical reactivity of nitrite and ascorbate in a cured and cooked meat model implication in nitrosation, nitrosylation and oxidation. Food Chemistry, 348, 129073. [DOI] [PubMed] [Google Scholar]
- Bouchikhi B, Mavelle T and Debry G, 1999. Effect of the addition of nitrate to milk on the formation of volatile N‐nitrosamines and apparent total N‐nitroso compounds. European Food Research and Technology, 209, 88–92. [Google Scholar]
- Bowen DE, Whitwell JH, Lillford L, Henderson D, Kidd D, Mc Garry S, Pearce G, Beevers C and Kirkland DJ, 2011. Work conducted at Covance Laboratories Ltd., Harrogate. Evaluation of a multi‐endpoint assay in rats, combining the bone‐marrow micronucleus test, the Comet assay and the flow‐cytometric peripheral blood micronucleus test. Mutation Research, 722, 7–19. [DOI] [PubMed] [Google Scholar]
- Boxenhaum H, 1980. Interspecies variation in liver weight, hepatic blood flow, and antipyrine intrinsic clearance: extrapolation of data to benzodiazepines and phenytoin. Journal of Pharmacokinetics and Biopharmaceutics, 8, 165–176. [DOI] [PubMed] [Google Scholar]
- Boyes BG, Rogers CG, Matula TI, Stapley R and Sen NP, 1990. Evaluation of genotoxicity of N‐nitrosodibenzylamine in Chinese hamster V79 cells and in Salmonella. Mutation Research, 241, 379–385. [DOI] [PubMed] [Google Scholar]
- Boyland E, Roe FJ and Gorrod JW, 1964. Induction of pulmonary tumours in mice by nitrosonornicotine, a possible constituent of tobacco smoke. Nature, 202, 1126. [DOI] [PubMed] [Google Scholar]
- Boyland E, Carter RL, Gorrod JW and Roe FJ, 1968. Carcinogenic properties of certain rubber additives. European Journal of Cancer (1965), 4, 233–239. [DOI] [PubMed] [Google Scholar]
- Brambilla G, Carlo P, Finollo R and Sciabà L, 1987. Dose‐response curves for liver DNA fragmentation induced in rats by sixteen N‐nitroso compounds as measured by viscometric and alkaline elution analyses. Cancer Research, 47, 3485–3491. [PubMed] [Google Scholar]
- Brantom PG, 1983. Dose‐Response Relationships in Nitrosamine Carcinogenesis [University of Surrey]. Available online: https://openresearch.surrey.ac.uk/esploro/outputs/doctoral/Dose-Response-Relationships-in-Nitrosamine-Carcinogenesis/99512967702346#file-0 [Google Scholar]
- Brendler SY, Tompa A, Hutter KF, Preussmann R and Pool‐Zobel BL, 1992. In vivo and in vitro genotoxicity of several N‐nitrosamines in extrahepatic tissues of the rat. Carcinogenesis, 2435–2441. [DOI] [PubMed] [Google Scholar]
- Brittebo EB, Lofberg B and Tjalve H, 1981a. Sites of metabolism of N‐nitrosodiethylamine in mice. Chemico‐Biological Interactions, 34, 209–221. [DOI] [PubMed] [Google Scholar]
- Brittebo EV, Ljndgren A and Tjalve H, 1981b. Foetal distribution and metabolism of N‐nitrosodiethylamine in mice. Acta Pharmacologica et Toxicologica, 48, 355–363. [DOI] [PubMed] [Google Scholar]
- Bunin GR, Buckley JD, Boesel CP, Rorke LB and Meadows AT, 1994. Risk factors for astrocytic glioma and primitive neuroectodermal tumor of the brain in young children: a report from the Children's Cancer Group. Cancer Epidemiology, Biomarkers and Prevention: A publication of the American Association for Cancer Research, cosponsored by the American Society of Preventive Oncology, 3, 197–204. [PubMed] [Google Scholar]
- Burak ES, Harrington GW, Koseniauskas R and Gombar CT, 1991. Estimation of the fraction of the dose of N‐nitrosodimethylamine metabolized to methylamine in rats. Cancer Letters, 58, 1–6. 10.1016/0304-3835(91)90017-c [DOI] [PubMed] [Google Scholar]
- Byun MW, Ahn HJ, Kim JH, Lee JW, Yook HS and Han SB, 2004. Determination of volatile N‐nitrosamines in irradiated fermented sausage by gas chromatography coupled to a thermal energy analyzer. Journal of Chromatography A,1054, 1–2, 403–407. [PubMed] [Google Scholar]
- Campillo N, Viñas P, Martínez‐Castillo N and Hernández‐Córdoba M, 2011. Determination of volatile nitrosamines in meat products by microwave‐assisted extraction and dispersive liquid‐liquid microextraction coupled to gas chromatography‐mass spectrometry. Journal of Chromatography A, 1218(14), 1815–1821. [DOI] [PubMed] [Google Scholar]
- Camus AM, Geneste O, Hankakoski P, Béréziat JC, Henderson CJ, Wolf CR, Bartsch H and Lang MA, 1993. High variability of nitrosamine metabolism among individuals: Role of cytochromes P450 2A6 and 2E1 in the dealkylation of N‐nitrosodimethylamine and N‐nitrosodiethylamine in mice and humans. Molecular Carcinogenesis, 7, 268–275. [DOI] [PubMed] [Google Scholar]
- Cardesa A, Garcia‐Bragado F, Ramirez J and Ernst H, 1990. Histological types of laryngotracheal tumors induced in Syrian golden hamsters by nitrosomorpholine and nitrosopiperidine. Experimental Pathology, 40, 267–281. [DOI] [PubMed] [Google Scholar]
- Cardwell CR, McDowell RD, Hughes CM, Hicks B and Murchie P, 2021. Exposure to Ranitidine and Risk of Bladder Cancer: A Nested Case‐Control Study. The American Journal of gastroenterology, 116, 1612–1619. [DOI] [PubMed] [Google Scholar]
- Cardy RH, Lijinsky W and Hildebrandt PK, 1979. Neoplastic and nonneoplastic urinary bladder lesions induced in Fischer 344 rats and B6C3F1 hybrid mice by N‐nitrosodiphenylamine. Ecotoxicology and Environmental Safety, 3, 29–35. [DOI] [PubMed] [Google Scholar]
- Carter RL, Percival WH and Roe FJC, 1969. Exceptional sensitivity of mink to the hepatotoxic effects of dimethylnitrosamine. Journal of Pathology, 97, 79–88. [cited in ATSDR, 1989] [DOI] [PubMed] [Google Scholar]
- Catsburg CE, Gago‐Dominguez M, Yuan JM, Castelao JE, Cortessis VK, Pike MC and Stern MC, 2014. Dietary sources of N‐nitroso compounds and bladder cancer risk: findings from the Los Angeles bladder cancer study. International Journal of Cancer, 134, 125–135. [DOI] [PubMed] [Google Scholar]
- CEPA (Canadian Environmental Protection Act) , 1999. Priority substances list assessment report: N‐nitrosodimethylamine. Health Canada, Ottawa, ON. [Google Scholar]
- Chau IY, Dagani D and Archer MC, 1978. Kinetic studies on the hepatic microsomal metabolism of dimethylnitrosamine, diethylnitrosamine, and methylethylnitrosamine in the rat. Journal of the National Cancer Institute, 61, 517–521. [PubMed] [Google Scholar]
- Chen SC, Harte BR, Gray JI and Boore AM, 1991. Influence of Microwave Heating on the Formation of N‐Nitrosamines in Bacon. Food and Packaging Interactions II, Chapter 11, ACS Symposium Series. 473. American Chemical Society. pp. 118–132. [Google Scholar]
- Chen Z, Yang L, Huang Y, Spencer P, Zheng W, Zhou Y, Jiang S, Ye W, Zheng Y and Qu W, 2019. Carcinogenic risk of N‐Nitrosamines in Shanghai drinking water: Indications for the use of ozone pretreatment. Environmental Science and Technology, 53, 7007–7018. [DOI] [PubMed] [Google Scholar]
- Chen Z, Li S, Shen M, Lu X, Bao C, Chen D, Ding J, Wang Q, Huang S, Cong W, Han L and He X, 2020. The Mutational and Transcriptional Landscapes of Hepatocarcinogenesis in a Rat Model. iScience, 23, 101690. [DOI] [PMC free article] [PubMed] [Google Scholar]
- Chhabra SK, Souliotis VL, Harbaugh JW, Krasnow SW, Jones AB, Anderson LM and Kyrtopoulos SA, 1995. O6‐methylguanine DNA adduct formation and modulation by ethanol in placenta and fetal tissues after exposure of pregnant patas monkeys to N‐nitrosodimethylamine. Cancer Research, 55, 6017–6020. [PubMed] [Google Scholar]
- Chhabra SK, Anderson LM, Perella C, Desai D, Amin S, Kyrtopoulos SA and Souliotis VL, 2000. Coexposure to ethanol with N‐nitrosodimethylamine or 4‐(Methylnitrosamino)‐1‐(3‐pyridyl)‐1‐butanone during lactation of rats: marked increase in O(6)‐methylguanine‐DNA adducts in maternal mammary gland and in suckling lung and kidney. Toxicology and Applied Pharmacology, 169, 191–200. 10.1006/taap.2000.9068 [DOI] [PubMed] [Google Scholar]
- Chienthavorn O, Ramnut N, Subprasert P, Sasook A and Insuan W, 2014. Effective and Reusable Monolith Capillary Trap of Nitrosamine Extraction by Superheated Water from Frankfurter Sausage. Journal of Agricultural and Food Chemistry, 62, 1240–1246. [DOI] [PubMed] [Google Scholar]
- Choi SY, Chung MJ, Lee SJ, Shin JH and Sung NJ, 2007. N‐nitrosamine inhibition by strawberry, garlic, kale, and the effects of nitrite‐scavenging and N‐nitrosamine formation by functional compounds in strawberry and garlic. Food Control, 18, 485–491. [Google Scholar]
- Chooi KF, Rajendran DB, Phang SS and Toh HH, 2016. The dimethylnitrosamine induced liver fibrosis model in the rat. JoVE (Journal of Visualized Experiments), 112, e54208. [DOI] [PMC free article] [PubMed] [Google Scholar]
- Chowdhury G, Calcutt MW, Nagy LD and Guengerich FP, 2012. Oxidation of methyl and ethyl nitrosamines by cytochrome P450 2E1 and 2B1. Biochemistry, 51, 9995–10007. [DOI] [PMC free article] [PubMed] [Google Scholar]
- Chu C and Magee PN, 1981. Metabolic Fate of Nitrosoproline in the Rat. Cancer research, 41, 3653–3657. [PubMed] [Google Scholar]
- Chung FL and Hecht SS, 1985. Formation of the cyclic 1,N2‐glyoxal‐deoxyguanosine adduct upon reaction of N‐nitroso‐2‐hydroxymorpholine with deoxyguanosine. Carcinogenesis, 6, 1671–1673. [DOI] [PubMed] [Google Scholar]
- Chung FL, Tanaka T and Hecht SS, 1986. Induction of liver tumors in F344 rats by crotonaldehyde. Cancer Research, 46, 1285–1289. [PubMed] [Google Scholar]
- Cintya H, Silalahi J, De Lux PE and Siburian R, 2019. Analysis of Nitrosamines in processed meat products in Medan City by Liquid Chromatography‐Mass Spectrometry. Open Access Macedonian Journal of Medical Sciences, 7, 1382–1387. [DOI] [PMC free article] [PubMed] [Google Scholar]
- Clapp NK, Craig AW and Toya RE Sr, 1968. Pulmonary and hepatic oncogenesis during treatment of male RF mice with dimethyl‐nitrosamine. Journal of the National Cancer Institute, 41, 1213–1227. [PubMed] [Google Scholar]
- Clapp NK and Toyo RE, 1970. Effect of cumulative dose and dose rate on dimethylnitrosamine oncogenesis in RF mice. Journal of the National Cancer Institute, 45, 495–498. [PubMed] [Google Scholar]
- Clapp NK, Tyndall RL and Otten JA, 1971. Differences in tumor types and organ susceptibility in BALB‐c and RF mice following dimethylnitrosamine and diethylnitrosamine. Cancer Research, 31, 196–198. [PubMed] [Google Scholar]
- Cliet I, Melcion C and Cordier A, 1993. Lack of predictivity of bone marrow micronucleus test versus testis micronucleus test: comparison with four carcinogens. Mutation Research, 292, 105–111. [DOI] [PubMed] [Google Scholar]
- Connor F, Rayner TF, Aitken SJ, Feig C, Lukk M, Santoyo‐Lopez J and Odom DT, 2018. Mutational landscape of a chemically‐induced mouse model of liver cancer. Journal of Hepatology, 69, 840–850. [DOI] [PMC free article] [PubMed] [Google Scholar]
- Cortinovis C, Klimek F and Nogueira E, 1991. Rat hepatocarcinogenesis induced by N‐nitrosodiethylamine and N‐nitrosomorpholine continuously administered at low doses. From basophilic areas of hepatocytes to hepatocellular tumors. American Journal of Pathology, 139, 1157–1171. [PMC free article] [PubMed] [Google Scholar]
- Cottrell RC, Walters DG, Young PJ, Phillips JC, Lake BG and Gangolli SD, 1980. Studies of the urinary metabolites of N‐nitrosopyrrolidine in the rat. Toxicology and Applied Pharmacology, 54, 368–376. [DOI] [PubMed] [Google Scholar]
- Cottrell RC, Young PJ, Walters DG, Phillips JC, Lake BG and Gangolli SD, 1979. Studies of the metabolism of N‐nitrosopyrrolidine in the rat. Toxicology and Applied Pharmacology, 51, 101–106. [DOI] [PubMed] [Google Scholar]
- Cottrell RC, Blowers SD, Walters DG, Lake BG, Purchase R, Phillips JC and Gangolli SD, 1983. Studies of the metabolic bioactivation of N‐nitrosopyrrolidine in the rat. Carcinogenesis, 4, 311–314. [DOI] [PubMed] [Google Scholar]
- Craddock VM, 1975. Effect of a single treatment with the alkylating carcinogens dimethynitrosamine, diethylnitrosamine and methyl methanesulphonate, on liver regenerating after partial hepatectomy. I. Test for induction of liver carcinomas. Chemico‐Biological Interactions, 10, 313–321. 10.1016/0009-2797(75)90052-6 [DOI] [PubMed] [Google Scholar]
- Cragin DW and Shibamoto T, 1992. Formation of N‐nitrosothiazolidine metabolites in isolated rat liver hepatocytes. Toxicology in Vitro, 6, 89–90. [DOI] [PubMed] [Google Scholar]
- Cragin DW, Jones AD and Shibamoto T, 1989. Metabolism of N‐nitroso‐1,3‐thiazolidine in the rat. Food and Chemical Toxicology, 27, 105–110. [DOI] [PubMed] [Google Scholar]
- Cross KP and Ponting DJ, 2021. Developing structure‐activity relationships for N‐Nitrosamine activity. Computational Toxicology, 20, 100186. [DOI] [PMC free article] [PubMed] [Google Scholar]
- Dailey RE, Braunberg RC and Blaschka AM, 1975. The absorption, distribution, and excretion of [14c] nitrosoproline by rats. Toxicology, 3, 23–28. [DOI] [PubMed] [Google Scholar]
- Dallinga JW, Pachen DM, Lousberg AH, Van Geel JA, Houben GM, Stockbrügger RW, Van Maanen JM and Kleinjans JC, 1998. Volatile N‐nitrosamines in gastric juice of patients with various conditions of the gastrointestinal tract determined by gas chromatography–mass spectrometry and related to intragastric pH and nitrate and nitrite levels. Cancer Letters, 124, 119–125. [DOI] [PubMed] [Google Scholar]
- Davidek J, 2017. Natural Toxic Compounds of Foods. CRC Press, Boca Raton, USA. [Google Scholar]
- de Boer JG, Mirsalis JC and Glickman BW, 1999. Mutational spectrum of dimethylnitrosamine in the liver of 3‐ and 6‐week‐old lacI transgenic mice. Environmental and Molecular Mutagenesis, 34, 80–83. [PubMed] [Google Scholar]
- Delaney JC and Essigmann JM, 2008. Biological properties of single chemical‐DNA adducts: a twenty year perspective. Chemical Research in Toxicology, 21, 232–252. [DOI] [PMC free article] [PubMed] [Google Scholar]
- Delker DA, Geter DR, Kleinert KM and Gollapudi BB, 2008. Frequency and spectrum of lacI mutations in the liver of Big Blue mice following the administration of genotoxic carcinogens singly and in series. International Journal of Toxicology, 27, 35–42. [DOI] [PubMed] [Google Scholar]
- Dellisanti A, Cerutti G and Airoldi L, 1996. Volatile N‐Nitrosamines in Selected Italian Cheeses. Bulletin of Environmental Contamination and Toxicology, 57, 16–21. [DOI] [PubMed] [Google Scholar]
- De Mey E, De Klerck K, De Maere H, Dewulf L, Derdelinckx G, Peeters MC, Fraeye I, Vander Heyden Y and Paelinck H, 2014. The occurrence of N‐nitrosamines, residual nitrite and biogenic amines in commercial dry fermented sausages and evaluation of their occasional relation. Meat Science, 96(2 Pt A), 821–828. [DOI] [PubMed] [Google Scholar]
- Den Engelse L, 1974. The formation of methylated bases in DNA by dimethylnitrosamine and its relation to differences in the formation of tumours in the livers of GR and C3HF mice. Chemico‐Biological Interactions, 8, 329–338. 10.1016/0009-2797(74)90011-8 [DOI] [PubMed] [Google Scholar]
- Den Engelse L, Menkveld GJ, De Brij RJ and Tates AD, 1986. Formation and stability of alkylated pyrimidines and purines (including imidazole ring‐opened 7‐alkylguanine) and alkylphosphotriesters in liver DNA of adult rats treated with ethylnitrosourea or dimethylnitrosamine. Carcinogenesis, 7, 393–403. [DOI] [PubMed] [Google Scholar]
- Dertinger SD, Avlasevich SL, Torous DK, Singh P, Khanal S, Kirby C, Drake A, MacGregor JT and Bemis JC, 2019. 3Rs friendly study designs facilitate rat liver and blood micronucleus assays and Pig‐a gene mutation assessments: Proof‐of‐concept with 13 reference chemicals. Environmental and Molecular Mutagenesis, 60, 704–739. [DOI] [PMC free article] [PubMed] [Google Scholar]
- Desjardins R, Fournier M, Denizeau F and Krzystyniak K, 1992. Immunosuppression by chronic exposure to N‐nitrosodimethylamine (NDMA) in mice. Journal of Toxicology and Environmental Health, Part A Current Issues, 37, 351–361. [DOI] [PubMed] [Google Scholar]
- De Stefani E, Deneo‐Pellegrini H, Carzoglio JC, Ronco A and Mendilaharsu M, 1996. Dietary nitrosodimethylamine and the risk of lung cancer: a case‐control study from Uruguay. Cancer Epidemiology, Biomarkers and Prevention: A publication of the American Association for Cancer Research, cosponsored by the American Society of Preventive Oncology, 5, 679–682. [PubMed] [Google Scholar]
- De Stefani E, Boffetta P, Mendilaharsu M, Carzoglio J and Deneo‐Pellegrini H, 1998. Dietary nitrosamines, heterocyclic amines, and risk of gastric cancer: a case‐control study in Uruguay. Nutrition and Cancer, 30, 158–162. [DOI] [PubMed] [Google Scholar]
- De Stefani E, Boffetta P, Deneo‐Pellegrini H, Ronco AL, Aune D, Acosta G, Brennan P, Mendilaharsu M and Ferro G, 2009. Meat intake, meat mutagens and risk of lung cancer in Uruguayan men. Cancer Causes and Control, 20, 1635–1643. [DOI] [PubMed] [Google Scholar]
- Devik OG, 1967. Formation of N‐nitrosamines by the Maillard reaction. Acta Chemica Scandinavica, 21, 2302–2303. [DOI] [PubMed] [Google Scholar]
- Dickhaus S, Reznik G, Green U and Ketkar M, 1977. The carcinogenic effect of beta‐oxidized dipropylnitrosamine in mice. I. Dipropylnitrosamine and methyl‐propylnitrosamine. Zeitschrift für Krebsforschung und Klinische. Onkologie, 90, 253–258. 10.1007/BF00284299 [DOI] [PubMed] [Google Scholar]
- Dion ME, Agler M and Milner JA, 1997. S‐allyl cysteine inhibits nitrosomorpholine formation and bioactivation. Nutrition and Cancer, 28, 1–6. [DOI] [PubMed] [Google Scholar]
- Diwan BA and Meier H, 1976. Transplacental carcinogenic effects of diethylnitrosamine in mice. Naturwissenschaften, 63. [DOI] [PubMed] [Google Scholar]
- Dobo KL, Kenyon MO, Dirat O, Engel M, Fleetwood A, Martin M, Mattano S, Musso A and McWilliams JC, 2022. Practical and Science‐Based Strategy for Establishing Acceptable Intakes for Drug Product N‐Nitrosamine Impurities. Chemical Research and Toxicology., 35, 475–489. [DOI] [PMC free article] [PubMed] [Google Scholar]
- Dong H, Li H, Liang M, Luo D, Liu G, Zeng X, Bai W, Yang J and Xian Y, 2020. Rapid determination of nine N‐nitrosamines in dry‐cured mackerel (Scomberomorus niphonius) using salting out homogeneous phase extraction with acetonitrile followed by GC‐MS/MS. LWT, 130, 109716. [Google Scholar]
- Dodd DE, Pluta LJ, Sochaski MA, Funk KA and Thomas RS, 2013. Subchronic urinary bladder toxicity evaluation of N‐Nitrosodiphenylamine in Fischer 344 rats. Journal of Applied Toxicology, 33, 383–389. 10.1002/jat.2798 [DOI] [PubMed] [Google Scholar]
- Dow M, Pyke RM, Tsui BY, Alexandrov LB, Nakagawa H, Taniguchi K, Seki E, Harismendy O, Shalapour S, Karin M, Carter H and Font‐Burgada J, 2018. Integrative genomic analysis of mouse and human hepatocellular carcinoma. Proceedings of the National Academy of Sciences of the United States of America, 115, E9879–E9888. [DOI] [PMC free article] [PubMed] [Google Scholar]
- Drabik‐Markiewicz G, Dejaegher B, De Mey E, Kowalska T, Paelinck H and Vander Heyden Y, 2011. Influence of putrescine, cadaverine, spermidine or spermine on the formation of N‐nitrosamine in heated cured pork meat. Food Chemistry, 126, 1539–1545. [DOI] [PubMed] [Google Scholar]
- Drabik‐Markiewicz G, Dejaegher B, De Mey E, Impens S, Kowalska T, Paelinck H and Vander Heyden Y, 2010. Evaluation of the influence of proline, hydroxyproline or pyrrolidine in the presence of sodium nitrite on N‐nitrosamine formation when heating cured meat. Analytica Chimica Acta, 657, 123–130. [DOI] [PubMed] [Google Scholar]
- Druckrey H, Dannenberg P, Dischler W and Steinhoff D, 1962. Reinzucht von 10 Rattenstämmen (BD‐Stämme) und Analyse des genetischen Pigmentierungssystems. Arzneimittel‐Forsch, 12, 911. [Google Scholar]
- Druckrey H, Preussmann R, Ivankovic S and Schmähl D, 1967. Organotrope carcinogene Wirkungen bei 65 verschiedenen N‐Nitroso‐Verbindungen an BD‐Ratten [Organotropic carcinogenic effects of 65 various N‐nitroso‐ compounds on BD rats]. Zeitschrift für Krebsforschung, 69, 103–201. (German) [PubMed] [Google Scholar]
- Duke SS, Schook LB and Holsapple MP, 1985. Effects of N‐nitrosodimethylamine on tumor susceptibility. Journal of Leukocyte Biology, 37, 383–394. [DOI] [PubMed] [Google Scholar]
- ECHA (European Chemicals Agency) , 2012. Practical Guide 6. How to report read‐across and categories. Version2.0, December 2012. Available online: https://echa.europa.eu/documents/6362380/7127661/pg_report_readacross_en.pdf/69860e5b-c669-4a0d-b868-72f5dba5b560ECHA (European Chemicals Agency), 2016.
- ECHA , 2015. Read‐across Assessment Framework (RAAF). ECHA, Helsinki. [Google Scholar]
- ECHA , 2016. Practical Guide. How to Use and Report (Q)SARs. Version 3.1. ECHA, Helsinki. [Google Scholar]
- ECHA . 2008. Guidance on information requirements and chemical safety assessment. Chapter R.6: QSARs and grouping of chemicals. Available online: http://echa.europa.eu/documents/10162/13632/information_requirements_r6_en.pdf. ECHA, Helsinki.
- Edwards CK, Myers MJ, Kelley KW and Schook LB, 1991. Enhanced macrophage anti‐microbial activity following dimethylnitrosamine exposure in vivo is related to augmented production of reactive oxygen metabolites. Immunopharmacology and Immunotoxicology, 13, 395–411. [DOI] [PubMed] [Google Scholar]
- Eerola S, Otegui I, Saari L and Rizzo A, 1998. Application of liquid chromatography‐atmospheric pressure chemical ionization mass spectrometry and tandem mass spectrometry to the determination of volatile nitrosamines in dry sausages. Food Additives and Contaminants, 15, 270–279. 10.1080/02652039809374641 [DOI] [PubMed] [Google Scholar]
- EFSA (European Food Safety Authority) , 2005. Opinion of the Scientific Committee on a request from EFSA related to A Harmonised Approach for Risk Assessment of Substances Which are both Genotoxic and Carcinogenic. EFSA Journal 2005;3(10):282, 33 pp. 10.2903/j.efsa.2005.282 [DOI] [Google Scholar]
- EFSA (European Food Safety Authority) , 2007. Opinion of the Scientific Committee related to Uncertainties in Dietary Exposure Assessment. EFSA Journal 2007;5(1):438, 54 pp. 10.2903/j.efsa.2007.438 [DOI] [Google Scholar]
- EFSA (European Food Safety Authority) , 2009. Guidance of the Scientific Committee on Transparency in the Scientific Aspects of Risk Assessments carried out by EFSA. Part 2: general principles. EFSA Journal 2009;7(5):1051, 22 pp. 10.2903/j.efsa.2009.1051 [DOI] [Google Scholar]
- EFSA (European Food Safety Authority) , 2010a. Standard sample description for food and feed. EFSA Journal 2010;8(1):1457, 54 pp. 10.2903/j.efsa.2010.1457 [DOI] [Google Scholar]
- EFSA (European Food Safety Authority) , 2010b. Management of left‐censored data in dietary exposure assessment of chemical substances. EFSA Journal 2010; 8(3):1557, 96 pp. 10.2903/j.efsa.2010.1557 [DOI] [Google Scholar]
- EFSA (European Food Safety Authority) , 2011. Use of the EFSA Comprehensive European Food Consumption Database in Exposure Assessment. EFSA Journal 2011;9(3):2097, 34 pp. 10.2903/j.efsa.2011.2097 [DOI] [Google Scholar]
- EFSA (European Food Safety Authority) , 2013. Standard Sample Description ver. 2.0. EFSA Journal 2013;11(10):3424, 114 pp. 10.2903/j.efsa.2013.3424 [DOI] [Google Scholar]
- EFSA (European Food Safety Authority) , 2015. The food classification and description system FoodEx2 (revision 2). EFSA supporting publication 2015;EN‐804, 90 pp. 10.2903/j.efsa.2015.en-804 [DOI]
- EFSA (European Food Safety Authority) , Dujardin B and Kirwan L, 2019a. Technical report on the raw primary commodity (RPC) model: strengthening EFSA's capacity to assess dietary exposure at different levels of the food chain, from raw primary commodities to foods as consumed. EFSA supporting publication 2019:EN‐1532, 30 pp. 10.2903/sp.efsa.2019.EN-1532 [DOI] [Google Scholar]
- EFSA (European Food Safety Authority) , Ardizzone M, Binaglia M, Cottrill B, Cugier J‐P, Ferreira L, Gomez Ruiz JA, Innocenti M, Ioannidou S, Lopez Puente S, Merten C, Nikolic Mand Savoini G, 2019b. Scientific report on the animal dietary exposure: overview of current approachesused at EFSA. EFSA Journal 2019;17(11):5896, 18 pp. 10.2903/j.efsa.2019.5896 [DOI] [PMC free article] [PubMed] [Google Scholar]
- EFSA (European Food Safety Authority) , Hart A, Maxim L, Siegrist M, Von Goetz N, da Cruz C, Merten C, Mosbach‐Schulz O, Lahaniatis M, Smith A and Hardy A, 2019c. Guidance on Communication of Uncertainty in Scientific Assessments. EFSA Journal 2019;17(1):5520, 73 pp. 10.2903/j.efsa.2019.5520 [DOI] [PMC free article] [PubMed] [Google Scholar]
- EFSA ANS Panel (EFSA Panel on Food Additives and Nutrient Sources added to Food) , 2017a. Scientific Opinion on the re‐evaluation of sodium nitrate (E 251) and potassium nitrate (E 252) as food additives. EFSA Journal 2017;15(6):4787, 123 pp. 10.2903/j.efsa.2017.4787 [DOI] [PMC free article] [PubMed] [Google Scholar]
- EFSA ANS Panel (EFSA Panel on Food Additives and Nutrient Sources added to Food) , 2017b. Scientific Opinion on the re‐evaluation of potassium nitrite (E 249) and sodium nitrite (E 250) as food additives. EFSA Journal 2017;15(6):4786, 157 pp. 10.2903/j.efsa.2017.4786 [DOI] [Google Scholar]
- EFSA CONTAM Panel (Contaminants in the Food Chain) , 2020. Schrenk D, Bignami M, Bodin L, Chipman JK, del Mazo J, Grasl–Kraupp B, Hoogenboom L, Leblanc J‐C, Nebbia CS, Nielsen E, Ntzani E, Petersen A, Sand S, Schwerdtle T, Vleminckx C, Wallace H, Bampidis V, Cottrill B, Frutos MJ, Furst P, Parker A, Binaglia M, Christodoulidou A, Gergelova P, Guajardo IM, Wenger C and Hogstrand C. Scientific Opinion on the risk assessment of nitrate and nitrite in feed. EFSA Journal 2020;18(11):6290, 110 pp. 10.2903/j.efsa.2020.6290 [DOI] [PMC free article] [PubMed] [Google Scholar]
- EFSA Scientific Committee , 2011. Scientific Opinion on genotoxicity testing strategies applicable to food and feed safety assessment. EFSA Journal 2011;9(9):2379, 69 pp. 10.2903/j.efsa.2011.2379 [DOI] [Google Scholar]
- EFSA Scientific Committee , 2012a. Scientific Opinion on the applicability of the Margin of Exposure approach for the safety assessment of impurities which are both genotoxic and carcinogenic in substances added to food/feed. EFSA Journal 2012;10(3):2578, 5 pp. 10.2903/j.efsa.2012.2578 [DOI] [Google Scholar]
- EFSA Scientific Committee , 2012b. Guidance on selected default values to be used by the EFSA Scientific Committee, Scientific Panels and Units in the absence of actual measured data. EFSA Journal 2012;10(3):2579, 32 pp. 10.2903/j.efsa.2012.2579 [DOI] [Google Scholar]
- EFSA Scientific Committee , 2012c. Scientific Opinion on Risk Assessment Terminology. EFSA Journal 2012;1(5):2664, 43 pp. 10.2903/j.efsa.2012.2664 [DOI] [Google Scholar]
- EFSA Scientific Committee , 2017a. Guidance on the risk assessment of substances present in food intended for infants below 16 weeks of age. EFSA Journal 2017;15(5):4849, 58 pp. 10.2903/j.efsa.2017.4849 [DOI] [PMC free article] [PubMed] [Google Scholar]
- EFSA Scientific Committee , 2017b. Update: Guidance on the use of the benchmark dose approach in risk assessment. EFSA Journal 2017;15(1):4658, 41 pp. 10.2903/j.efsa.2017.4658 [DOI] [Google Scholar]
- EFSA Scientific Committee , 2018a. Guidance on Uncertainty Analysis in Scientific Assessments. EFSA Journal 2018;16(1):5123, 39 pp. 10.2903/j.efsa.2018.5123 [DOI] [PMC free article] [PubMed] [Google Scholar]
- EFSA Scientific Committee , 2018b. Scientific Opinion on the principles and methods behind EFSA's Guidance on Uncertainty Analysis in Scientific Assessment. EFSA Journal 2018;16(1):5122, 235 pp. 10.2903/j.efsa.2018.5122 [DOI] [PMC free article] [PubMed] [Google Scholar]
- Eisenbrand G, Habs M, Schmähl D and Preussmann R, 1980. Carcinogenicity of N‐nitroso‐3‐hydroxypyrrolidine and dose‐response study with N‐nitrosopiperidine in rats. IARC Scientific Publications, 31, 657–666. [PubMed] [Google Scholar]
- EMA (European Medicines Agency) , 2020. Assessment report. Nitrosamine impurities in human medicinal products. EMA/369136/2020 Committee for Medicinal Products for Human Use (CHMP).
- Emura M, Richter‐Reichhelm HB and Mohr U, 1980. Some aspects of prenatal risk of N‐nitrosodiethylamine carcinogenesis. IARC Scientific Publications, 31, 767–777. [PubMed] [Google Scholar]
- Encell L, Foiles PG and Gold B, 1996. The relationship between N‐nitrosodimethylamine metabolism and DNA methylation in isolated rat hepatocytes. Carcinogenesis, 17, 1127–1134. 10.1093/carcin/17.5.1127 [DOI] [PubMed] [Google Scholar]
- European Commission , 2017. Food fraud Network EU‐Coordinated case ‐ Illegal treatment of Tuna: from canning grade to Sushi grade.
- EUROGAST Study Group , 1994. O6‐methylguanine in blood leukocyte DNA: an association with the geographic prevalence of gastric cancer and with low levels of serum pepsinogen A, a marker of servere chronic atrophic gastritis. Carcinogenesis, 15, 1815–1820. [DOI] [PubMed] [Google Scholar]
- Fahrer J and Kaina B, 2013. O 6‐methylguanine‐DNA methyltransferase in the defense against N‐nitroso compounds and colorectal cancer. Carcinogenesis, 34, 2435–2442. [DOI] [PubMed] [Google Scholar]
- Fan C‐C and Lin TF, 2018. N‐nitrosamines in drinking water and beer: detection and risk assessment. Chemosphere, 200, 48–56. [DOI] [PubMed] [Google Scholar]
- Farré MJ, Insa S, Lamb A, Cojocariuc C and Gernjak W, 2020. Occurrence of N‐nitrosamines and their precursors in Spanish drinking water treatment plants and distribution systems. Environmental Science: Water Research and Technology, 6, 210–220. [Google Scholar]
- Fernández‐Alba AR and Agüera A, 2005. Nitrosamines. In: Worsfold P, Townshend A and Poole C (eds). Encyclopedia of Analytical Science ‐ Reference Work. 2nd edn. Elsevier Inc., Amsterdam. pp. 197–202. [Google Scholar]
- Fiddler W, Pensabene JW, Piotrowski EG, Doerr RC and Wasserman AE, 1973. Use of sodium ascorbate or erythorbate to inhibit formation of N‐Nitrosodimethylamine. Journal of Food Science, 38, 1084. [Google Scholar]
- Fiddler W, Pensabene JW, Gates RA and Adam R, 1998. Nitrosamine formation in processed hams as related to reformulated elastic rubber netting. Journal of Food Science, 63, 276–278. [Google Scholar]
- Fiddler W, Pensabene J, Gates R and Foster J, 1996. Investigations on nitrosamine reduction in boneless hams processed in elastic rubber nettings. Journal of Muscle Foods, 7, 389–401. [Google Scholar]
- Fiddler W, Pensabene J, Gates R, Hale M and Jahncke M, 1992. N‐Nitrosodimethylamine Formation in Cooked Frankfurters Containing Alaska Pollock (Theragra chalcogramma) Mince and Surimi. Journal of Food Science, 57, 569–571. [Google Scholar]
- Fiddler W, Pensabene J, Gates R, Hale M, Jahncke M and Babbltt J, 1993. Alaska Pollock (Theragra chalcogramma) Mince and Surimi as Partial Meat Substitutes in Frankfurters: N‐Nitrosodimethylamine Formation. Journal of Food Science, 58, 62–65. [Google Scholar]
- Fiddler W, Pensabene JW and Kimoto WI, 1981. Investigations of edible oils for volatile Nitrosamines. Journal of Food Science, 46, 603–605. [Google Scholar]
- Fine DH, Rufeh F, Lieb D and Rounbehler DP, 1975. Description of the thermal energy analyzer (TEA) for trace determination of volatile and nonvolatile N‐nitroso compounds. Analytical Chemistry, 47, 1188–1191. [DOI] [PubMed] [Google Scholar]
- Flaks B and Challis BC, 1980. Fine structure of rat liver during chronic intoxication with two heterocyclic N‐nitrosamines: N‐nitrosopiperidine and the non‐carcinogen, 2, 2′, 6, 6′‐tetramethyl‐N‐nitroso‐piperidine. Carcinogenesis, 1, 961–974. [DOI] [PubMed] [Google Scholar]
- Flaks B and Challis BC, 1981. A comparative electron microscope study of early changes in rat liver induced by N‐nitrosopiperidine and 2, 2', 6, 6'‐tetra‐methyl‐N‐nitrosopiperidine. Carcinogenesis, 2, 385–394. [DOI] [PubMed] [Google Scholar]
- Foiles PG, Miglietta LM, Akerkar SA, Everson RB and Hecht SS, 1988. Detection of o6‐Methyldeoxyguanosien in Human Placental DNA. Cancer Research, 48, 4184–4188. [PubMed] [Google Scholar]
- Frei JV, 1970. Toxicity, tissue changes, and tumor induction in inbred Swiss mice by methylnitrosamine and ‐amide compounds. Cancer Research, 30, 11–17. [PubMed] [Google Scholar]
- Friedman MA and Couch DB, 1976. Suppression of hepatic DMN demethylase activity by nitrososarcosine and other nitrosamines. Biochemical Pharmacology, 25, 2709–2712. 10.1016/0006-2952(76)90261-6 [DOI] [PubMed] [Google Scholar]
- Fujita K and Kamataki T, 2001a. Predicting the mutagenicity of tobacco‐related N‐nitrosamines in humans using 11 strains of Salmonella typhimurium YG7108, each coexpressing a form of human cytochrome P450 along with NADPH‐cytochrome P450 reductase. Environmental and Molecular Mutagenesis, 38, 339–346. [DOI] [PubMed] [Google Scholar]
- Fujita K and Kamataki T, 2001b. Role of human cytochrome P450 (CYP) in the metabolic activation of N‐alkylnitrosamines: application of genetically engineered Salmonella typhimurium YG7108 expressing each form of CYP together with human NADPH‐cytochrome P450 reductase. Mutation Research, 483, 35–41. [DOI] [PubMed] [Google Scholar]
- Fukushima S, Wanibuchi H, Morimura K, Nakae D, Tsuda H, Imaida K, Shirai T, Tatematsu M, Tsukamoto T, Hirose M and Furukawa F, 2005. Lack of potential of low dose N‐nitrosodimethylamine to induce preneoplastic lesions, glutathione S‐transferase placental form‐positive foci, in rat liver. Cancer Letters, 222, 11–15. 10.1016/j.canlet.2004.08.035 [DOI] [PubMed] [Google Scholar]
- Garcia H and Lijinsky W, 1972. Tumorigenicity of five cyclic nitrosamines in MRC rats. Zeitschrift für Krebsforschung und Klinische. Onkologie, 77, 257–261. [DOI] [PubMed] [Google Scholar]
- Garcia H and Lijinsky W, 1973. Studies of the tumorigenic effect in feeding of nitrosamino acids and of low doses of amines and nitrite to rats. Zeitschrift für Krebsforschung und Klinische Onkologie, 79, 141–144. [DOI] [PubMed] [Google Scholar]
- Geil JH, Stenger RJ, Behki RM and Morgan WS, 1968. Hepatotoxic and carcinogenic effects of dimethylnitrosamine in low dosage. Light and electron microscopic study. Journal of the National Cancer Institute, 40, 713–730. [PubMed] [Google Scholar]
- George J, Tsuchishima M and Tsutsumi M, 2019. Molecular mechanisms in the pathogenesis of Nnitrosodimethylamine induced hepatic fibrosis. Cell Death Disease, 10, 18. doi: 10.1038/s41419-018-1272-8 [DOI] [PMC free article] [PubMed] [Google Scholar]
- Giles GG, McNeil JJ, Donnan G, Webley C, Staples MP, Ireland PD, Hurley SF and Salzberg M, 1994. Dietary factors and the risk of glioma in adults: results of a case‐control study in Melbourne, Australia. International Journal of Cancer, 59, 357–362. [DOI] [PubMed] [Google Scholar]
- Glória MBA, Vale SR, Vargas OL, Barbour JF and Scanlan RA, 1997. Influence of nitrate levels added to cheesemilk on nitrate, nitrite, and volatile nitrosamine contents in Gruyere Cheese. Journal of Agricultural and Food Chemistry, 45, 3577–3579. [Google Scholar]
- Gold B, Farber J and Rogon E, 1987. An investigation of the metabolism of N‐nitroso‐N‐methylaniline by phenobarbital‐ and pyrazole‐induced Sprague‐Dawley rat liver and esophagus‐derived S9. Chemical Biological Interaction, 61, 215–228. [DOI] [PubMed] [Google Scholar]
- Gold LS, Slone TH, Manley NB, Garfinkel GB, Hudes ES, Rohrbach L and Ames BN, 1991. The Carcinogenic Potency Database: analyses of 4000 chronic animal cancer experiments published in the general literature and by the US National Cancer Institute/National Toxicology Program. Environmental Health Perspectives, 96, 11–15. [DOI] [PMC free article] [PubMed] [Google Scholar]
- Gollapudi BB, Jackson KM and Stott WT, 1998. Hepatic lacI and cII mutation in transgenic (lambdaLIZ) rats treated with dimethylnitrosamine. Mutation Research, 419, 131–135. [DOI] [PubMed] [Google Scholar]
- Gomm W, Roethlein C, Schuessel K, Brueckner G, Schroeder H, Hess S, Froetschl R, Broich K and Haenisch B, 2021. N‐Nitrosodimethylamine‐Contaminated Valsartan and the Risk of Cancer: a Longitudinal Cohort Study Based on German Health Insurance Data. Deutsches Ärzteblatt International, 118, 357. [DOI] [PMC free article] [PubMed] [Google Scholar]
- Gombar CT, Harrington GW, Pylypiw HM Jr, Anderson LM, Palmer AE, Rice JM, Magee PN and Burak ES, 1990. Interspecies scaling of the pharmacokinetics of N‐nitrosodimethylamine. Cancer Research, 50, 4366–4370. [PubMed] [Google Scholar]
- Gombar CT, Harrington GW, Pylypiw HM Jr, Bevill RF, Thurmon JC, Nelson DR and Magee PN, 1988. Pharmacokinetics of N‐nitrosodimethylamine in swine. Carcinogenesis, 9, 1351–1354. [DOI] [PubMed] [Google Scholar]
- Gombar CT, Pylypiw HM Jr and Harrington GW, 1987. Pharmacokinetics of N‐nitrosodimethylamine in beagles. Cancer Research, 47, 343–347. [PubMed] [Google Scholar]
- Gomez MID, Swann PF and Magee PN, 1977. The Absorption and metabolism in rats of small oral doses of dimethylnitrosamine. Biochemical Journal, 164, 497–500. [DOI] [PMC free article] [PubMed] [Google Scholar]
- Gonzalez CA, Riboli E, Badosa J, Batiste E, Cardona T, Pita S, Sanz JM, Torrent M and Agudo A, 1994. Nutritional factors and gastric cancer in Spain. American Journal of Epidemiology, 139, 466–473. [DOI] [PubMed] [Google Scholar]
- Goodall CM, Lijinsky W, Tomatis L and Wenyon CE, 1970. Toxicity and oncogenicity of nitrosomethylaniline and nitrosomethylcyclohexylamine. Toxicology and Applied Pharmacology, 17, 426–432. [DOI] [PubMed] [Google Scholar]
- Goodman MT, Kolonel LN, Wilkens LR, Yoshizawa CN, Le Marchand L and Hankin JH, 1992. Dietary factors in lung cancer prognosis. European Journal of Cancer, 28, 495–501. [DOI] [PubMed] [Google Scholar]
- Gorsky LD and Hollenberg PF, 1989. Metabolism of N‐nitrosodimethyl‐ and N‐nitrosodiethylamine by rat hepatocytes: effects of pretreatment with ethanol. Chemical Research in Toxicology, 2, 436–441. 10.1021/tx00012a013 [DOI] [PubMed] [Google Scholar]
- Gottfried‐Anacker J, Preussmann R, Eisenbrand G and Janzowski C, 1985. Fluoro‐substituted N‐nitrosamines. 8. N‐Nitrosodibutylamine and omega‐fluorinated analogues: in vivo metabolism in relation to the induction of urinary bladder cancer in the rat. Carcinogenesis, 6, 1559–1564. 10.1093/carcin/6.11.1559 [DOI] [PubMed] [Google Scholar]
- Graves RJ and Swann PF, 1993. Clearance of N‐nitrosodimethylamine and N‐nitrosodiethylamine by the perfused rat liver. Relationship to the Km and Vmax for nitrosamine metabolism. Biochemical Pharmacology, 45, 983–989. [DOI] [PubMed] [Google Scholar]
- Gray JI, Irvine DM and Kakuda Y, 1979. Nitrates and N‐Nitrosamines in Cheese. Journal of Food Protection, 42, 263–272. [DOI] [PubMed] [Google Scholar]
- Gray R, Peto R, Brantom P and Grasso P, 1991. Chronic nitrosamine ingestion in 1040 rodents: the effect of the choice of nitrosamine, the species studied, and the age of starting exposure. Cancer Research, 51(23 Pt 2), 6470–6491. [PubMed] [Google Scholar]
- Grasl‐Kraupp B, Luebeck G, Wagner A, Löw‐Baselli A, de Gunst M, Waldhör T, Moolgavkar S and Schulte‐Hermann R, 2000. Quantitative analysis of tumor initiation in rat liver: role of cell replication and cell death (apoptosis). Carcinogenesis, 21, 1411–1421. [PubMed] [Google Scholar]
- Graw JJ and Berg H, 1977. Hepatocarcinogenetic effect of DENA in pigs. Zeitschrift für Krebsforschung und Klinische Onkologie, 89, 137–143. 10.1007/BF00308514 [DOI] [PubMed] [Google Scholar]
- Greenblatt M, Mirvish S and So BT, 1971. Nitrosamine studies: induction of lung adenomas by concurrent administration of sodium nitrite and secondary amines in Swiss mice. Journal of the National Cancer Institute, 46, 1029–1034. [PubMed] [Google Scholar]
- Greenblatt M and Lijinsky W, 1972a. Nitrosamine studies: neoplasms of liver and genital mesothelium in nitrosopyrrolidine‐treated MRC rats. Journal of the National Cancer Institute, 48, 1687–1696. [PubMed] [Google Scholar]
- Greenblatt M and Lijinsky W, 1972b. Failure to induce tumors in Swiss mice after concurrent administration of amino acids and sodium nitrite. Journal of the National Cancer Institute, 48, 1389–1392. [PubMed] [Google Scholar]
- Griciute L, Castegnaro M and Bereziat JC, 1981. Influence of ethyl alcohol on carcinogenesis with N‐nitrosodimethylamine. Cancer Letters, 13, 345–352. 10.1016/0304-3835(81)90063-x [DOI] [PubMed] [Google Scholar]
- Guengerich FP, 2015. Human cytochrome P450 enzymes. In: Ortiz de Montellano PR (ed). Cytochrome P450, Structure, Mechanism, and Biochemistry. 4th edn. Springer. pp. 523–785. [Google Scholar]
- Gushgari and Halden , 2018. Critical review of major sources of human exposure to N‐nitrosamines. Chemosphere, 210, 1124–1136. [DOI] [PubMed] [Google Scholar]
- Gurjao C, Zhong R, Haruki K, Li YY, Spurr LF, Lee‐Six H, Reardon B, Ugai T, Zhang X, Cherniack AD, Song M, Van Allen EM, Meyerhardt JA, Nowak JA, Giovannucci EL, Fuchs CS, Wu K, Ogino S and Giannakis M, 2021. Discovery and features of an alkylating signature in colorectal cancer. Cancer Discovery, 11, 2446–2455. [DOI] [PMC free article] [PubMed] [Google Scholar]
- Haas H, Mohr U and Krüger FW, 1973. Comparative Studies with Different Doses of N‐Nitrosomorpholine, N‐Nitrosopiperidine, N‐Nitrosomethylurea, and Dimethylnitrosamine in Syrian Golden Hamsters. Journal of the National Cancer Institute, 51, 1295–1301. 10.1093/jnci/51.4.1295 [DOI] [PubMed] [Google Scholar]
- Hadjiolov D, 1972. Hemangioendothelial sarcomas of the liver in rats induced by diethylnitrosamine. Neoplasma, 19, 111–114. [PubMed] [Google Scholar]
- Hadjiolov D and Mundt D, 1974. Effect of aminoacetonitrile on the metabolism of dimethylnitrosamine and methylation of RNA during liver carcinogenesis. Journal of the National Cancer Institute, 52, 753–756. [DOI] [PubMed] [Google Scholar]
- Haggerty HG and Holsapple MP, 1990. Role of metabolism in dimethynitrosamine‐induced immunosuppression: a review. Toxicology, 63, 1–23. [DOI] [PubMed] [Google Scholar]
- Hagio S, Furukawa S, Abe M, Kuroda Y, Hayashi S and Ogawa I, 2014. Repeated dose liver micronucleus assay using adult mice with multiple genotoxicity assays concurrently performed as a combination test. Journal of Toxicological Sciences, 39, 437–445. [DOI] [PubMed] [Google Scholar]
- Hall CN, Badawi AF, O'Connor PJ and Saffhill R, 1991. The detection of alkylation damage in the DNA of human gastrointestinal tissues. British Journal of Cancer, 64, 59–63. [DOI] [PMC free article] [PubMed] [Google Scholar]
- Hamada S, Ohyama W, Takashima R, Shimada K, Matsumoto K, Kawakami S, Uno F, Sui H, Shimada Y, Imamura T, Matsumura S, Sanada H, Inoue K, Muto S, Ogawa I, Hayashi A, Takayanagi T, Ogiwara Y, Maeda A, Okada E, Terashima Y, Takasawa H, Narumi K, Wako Y, Kawasako K, Sano M, Ohashi N, Morita T, Kojima H, Honma M and Hayashi M, 2015. Evaluation of the repeated‐dose liver and gastrointestinal tract micronucleus assays with 22 chemicals using young adult rats: Summary of the collaborative study by the Collaborative Study Group for the Micronucleus Test (CSGMT)/The Japanese Environmental Mutagen Society (JEMS) Mammalian Mutagenicity Study Group (MMS). Mutation Research, 780–781, 2–17. [DOI] [PubMed] [Google Scholar]
- Hamlet CG and Liang L, 2017. An Investigation to establish the types and levels of N‐nitroso compounds (NOC) in UK consumed foods. Food Standards Agency, London, UK. [Google Scholar]
- Hard GC and Butler WH, 1970. Cellular analysis of renal neoplasia: light microscope study of the development of interstitial lesions induced in the rat kidney by a single carcinogenic dose of dimethylnitrosamine. Cancer research, 30, 2806–2815. [PubMed] [Google Scholar]
- Hard GC, 1981. Effect of a single carcinogenic dose of dimethylnitrosamine on antibody responses in the rat. Oncology, 38, 47–52. [DOI] [PubMed] [Google Scholar]
- Harrington GW, Magee PN, Pylypiw HM Jr, Kozeniauskas R, Bevill RF, Nelson DR and Thurmon JC, 1990. The formation, disposition and hepatic metabolism of dimethylnitrosamine in the pig. Drug Metabolism and Disposition, 18, 626–631. [PubMed] [Google Scholar]
- Harris CC, Autrup H, Stoner GD, McDowell EM, Trump BF and Schafer P, 1977. Metabolism of acyclic and cyclic N‐nitrosamines in cultured human bronchi. Journal of the National Cancer Institute, 59, 1401–1406. [DOI] [PubMed] [Google Scholar]
- Harris CC, Autrup H, Haugen A, Lechner J, Trump BF and Hsu IC, 1982. Studies of host factors in carcinogenesis using cultured human tissues and cells. IARC Scientific Publications, 39, 497–514. [PubMed] [Google Scholar]
- Harrison E and Gibaldi M, 1977. Physiologically based pharmacokinetic model for digoxin disposition in dogs and its preliminary application to humans. Journal of Pharmaceutical Sciences, 66, 1679–1683. 10.1002/jps.2600661206 [DOI] [PubMed] [Google Scholar]
- Hashimoto K, Takasaki W, Sato I and Tsuda S, 2007. DNA damage measured by comet assay and 8‐OH‐dG formation related to blood chemical analyses in aged rats. Journal of Toxicological Sciences, 32, 249–259. [DOI] [PubMed] [Google Scholar]
- Havery DC, Hotchkiss JH and Fazio T, 1982. Rapid determination of volatile N‐Nitrosamines in nonfat dry milk. Journal of Dairy Science, 65, 1982. [DOI] [PubMed] [Google Scholar]
- He X and Feng S, 2015. Role of Metabolic Enzymes P450 (CYP) on activating procarcinogen and their polymorphisms on the risk of cancers. Current Drug Metabolism, 16, 850–863. [DOI] [PubMed] [Google Scholar]
- Health Canada , 2011. Guidelines for Canadian Drinking Water Quality: Guideline Technical Document — N‐Nitrosodimethylamine. Water, Air and Climate Change Bureau. Healthy Environments and Consumer Safety Branch, Health Canada, Ottawa, Ontario: (Catalogue No H128‐1/11‐662E). [Google Scholar]
- Heath DF, 1962. The decomposition and toxicity of dialkylnitrosamines in rats. Biochemical Journal, 85, 72. [DOI] [PMC free article] [PubMed] [Google Scholar]
- Heath DF and Dutton A, 1958. The detection of metabolic products from dimethylnitrosamine in rats and mice. Biochemical Journal, 70, 619–626. 10.1042/bj0700619 [DOI] [PMC free article] [PubMed] [Google Scholar]
- Hecht SS, Chen CHB and Hoffmann D, 1978. Evidence for Metabolic α Hydroxylation of N‐Nitrosopyrrolidine. Cancer Research, 38, 215–218. [PubMed] [Google Scholar]
- Hecht SS, Chen CH, McCoy GD, Hoffmann D and Domellöf L, 1979. Alpha‐hydroxylation of N‐nitrosopyrrolidine and N'‐nitrosonornicotine by human liver microsomes. Cancer Letter, 8, 35–41. [DOI] [PubMed] [Google Scholar]
- Hecht SS, Mccoy GD, Chen CHB and Hoffmann D, 1981. The Metabolism of Cyclic Nitrosamines. N‐Nitroso Compounds, 49‐75. [Google Scholar]
- Hecht SS and Morrison JB, 1984. A sensitive method for detecting in vivo formation of N‐nitrosomorpholine and its application to rats given low doses of morpholine and sodium nitrite. Cancer Research, 44, 2873–2877. [PubMed] [Google Scholar]
- Hecht SS and Young R, 1981. Metabolic α‐hydroxylation of N‐nitrosomorpholine and [3,3,5,5‐tetradeutero]‐N‐nitrosomorpholine in the F344 rat. Cancer Research, 41, 5039–5043. [PubMed] [Google Scholar]
- Hecht SS, Trushin N, Castonguay A and Rivenson A, 1986. Comparative tumourigenicity and DNA methylation in F344 rats by 4‐(methylnitrosamino)‐1‐(3‐pyridyl)‐1‐butanone and N‐nitrosodimethylamine. Cancer Research, 46, 498–502. [PubMed] [Google Scholar]
- Hecht SS, Abbaspour A and Hoffman D, 1988. A study of tobacco carcinogenesis XLII. Bioassay in mice of some structural analogues of tobacco‐specific nitro samines. Cancer Letters, 42, 141–145. [DOI] [PubMed] [Google Scholar]
- Hecht SS, Lijinsky W, Kovatch RM, Chung FL and Saavedra JE, 1989. Comparative tumorigenicity of N‐nitroso‐2‐hydroxymorpholine, N‐nitrosodiethanolamine and N‐nitrosomorpholine in A/J mice and F344 rats. Carcinogenesis, 10, 1475–1477. [DOI] [PubMed] [Google Scholar]
- Hedler L, Schurr C and Marquardt P, 1979. Determination of volatile N‐nitroso compounds in various samples of edible vegetable oils and margarine (commercially available products). Journal of the American Oil Chemists' Society, 56, 681. [DOI] [PubMed] [Google Scholar]
- Hermmann SS, Duedahl‐Olesen L and Granby K, 2014. Simultaneous determination of volatile and non‐volatile nitrosamines in processed meat products by liquid chromatography tandem mass spectrometry using atmospheric pressure chemical ionisation and electrospray ionisation. Journal of Chromatography A, 1330, 20–29. [DOI] [PubMed] [Google Scholar]
- Hermmann SS, Duedahl‐Olesen L and Granby K, 2015a. Occurrence of volatile and non‐volatile N‐nitrosamines in processed meat products and the role of heat treatment. Food Control, 48, 163–169. [Google Scholar]
- Hermmann SS, Granby K and Duedahl‐Olesen L, 2015b. Formation and mitigation of N‐nitrosamines in nitrite preserved cooked sausages. Food Chemistry, 174, 516–526. [DOI] [PubMed] [Google Scholar]
- Herrol KM and Dunham LJ, 1963. Induction of tumors in the Syrian hamster with diethylnitrosamine (N‐nitrosodiethylamine). Cancer Research, 23, 773–777. [PubMed] [Google Scholar]
- Herron DC and Shank RC, 1980. Methylated purines in human liver DNA after probable dimethylnitrosamine poisoning. Cancer Research, 40, 3116–3117. [PubMed] [Google Scholar]
- Heyns K and Koch H, 1970. Formation of nitrosamines by the reaction of monosaccharides with amino acids (Maillard reaction). Tetrahedron Letters, 10, 741–744. [DOI] [PubMed] [Google Scholar]
- Hill MJ, 1988. Nitrosamines: Toxicology and Microbiology. Ellis Horwood, Chichester. [Google Scholar]
- Hirao K, Matsumura K, Imagawa A, Enomoto Y and Hosogi Y, 1974. Primary neoplasms in dog liver induced by diethylnitrosamine. Cancer Research, 34, 1870–1882. [PubMed] [Google Scholar]
- Hobbs CA, Recio L, Streicker M, Boyle MH, Tanaka J, Shiga A and Witt KL, 2015. Comet assay evaluation of six chemicals of known genotoxic potential in rats. Mutation Research – Genetic Toxicology and Environmental Mutagenesis, 786–788, 172–181. [DOI] [PMC free article] [PubMed] [Google Scholar]
- Hoch‐Ligeti C, Stutzman E and Arvin JM, 1968. Cellular composition during tumor induction in rats by cycad husk. Journal of the National Cancer Institute, 41, 605–614. [PubMed] [Google Scholar]
- Hoffmann D, Djordjevic MV, Rivenson A, Zang E, Desai D and Amin S, 1993. A study of tobacco carcinogenesis. LI. Relative potencies of tobacco‐specific N‐nitrosamines as inducers of lung tumours in AJ mice. Cancer Letters, 71, 25–30. [DOI] [PubMed] [Google Scholar]
- Holsapple MP, Tucker AN, McNerney PJ and White KL, 1984. Effects of N‐nitrosodimethylamine on humoral immunity. Journal of Pharmacology Experimental Therapy, 229, 493–500. [PubMed] [Google Scholar]
- Holsapple MP, Bick PH and Duke SS, 1985. Effects of N‐NitrosodimethyIamine on cell‐mediated immunity. Journal of leukocyte biology, 37, 367–381. [DOI] [PubMed] [Google Scholar]
- Homburger F, Handler AH, Soto E, Hsueh SS, Van Dongen CG and Russfield AB, 1976. Adenocarcinoma of the glandular stomach following 3‐methylcholanthrene, N‐nitrosodiethylamine, or N‐nitrosodimethylamine feeding in carcinogen‐susceptible inbred Syrian. Journal of the National Cancer Institute, 57, 141–144. 10.1093/jnci/57.1.141 [DOI] [PubMed] [Google Scholar]
- Horsfall MJ, Zeilmaker MJ, Mohn GR and Glickman BW, 1989. Mutational specificities of environmental carcinogens in the lacl gene of Escherichia coli. II: a host‐mediated approach to N‐nitroso‐N,N‐dimethylamine and endogenous mutagenesis in vivo. Molecular Carcinogenesis, 2, 107–115. [DOI] [PubMed] [Google Scholar]
- Hoos A, Habs M and Schmähl D, 1985. Comparison of liver tumor frequencies after intermittent oral administration of different doses of N‐nitrosopyrrolidine in Sprague‐Dawley rats. Cancer Letters, 26, 77–82. [DOI] [PubMed] [Google Scholar]
- Huang Q, Wang S, Chen SC, Babcock DM, Park SS, Gelboin HV and Mirvish SS, 1993. Hydroxylation and dealkylation of methyl‐n‐butylnitrosamine and role of certain cytochrome P‐450 isozomes in these reactions. Cancer Letters, 69, 107–116. [DOI] [PubMed] [Google Scholar]
- Huang MC, Chen HC, Fu SC and Ding WH, 2013. Determination of volatile N‐nitrosamines in meat products by microwave‐assisted extraction coupled with dispersive micro solid‐phase extraction and gas chromatography‐‐chemical ionisation mass spectrometry. Food Chemistry, 138, 227–233. [DOI] [PubMed] [Google Scholar]
- Huber JC, Brender JD, Zheng Q, Sharkey JR, Vuong AM, Shinde MU, Griesenbeck JS, Suarez L, Langlois PH, Canfield MA and Romitti PA, 2013. Maternal dietary intake of nitrates, nitrites and nitrosamines and selected birth defects in offspring: a case‐control study. Nutrition Journal, 12, 1. [DOI] [PMC free article] [PubMed] [Google Scholar]
- Huxel ET, Scanlan RA and Libbey LM, 1974. Formation of nitrosopyrrolidine from pyrrolidine ring containing compounds at elevated temperatures. Journal of Agricultural and Food Chemistry, 22, 698–700. [DOI] [PubMed] [Google Scholar]
- Iammarino M and Di Taranto A, 2012. Nitrite and nitrate in fresh meats: a contribution to the estimation of admissible maximum limits to introduce in directive 95/2/EC. International Journal of Food Science and Technology, 47, 1852–1858. [Google Scholar]
- Iammarino M, Di Taranto A and Cristino M, 2013. Endogenous levels of nitrites and nitrates in wide consumption foodstuffs: results of five years of official controls and monitoring. Food Chemistry, 140, 763–771. [DOI] [PubMed] [Google Scholar]
- Iammarino M, Di Taranto A and Cristino M, 2014. Monitoring of nitrites and nitrates levels in leafy vegetables (spinach and lettuce): a contribution to risk assessment. Journal of the Science of Food and Agriculture Food Chemistry, 94, 773–778. [DOI] [PubMed] [Google Scholar]
- Iammarino M, Mangiacotti M and Chiaravalle AE, 2020. Anion exchange polymeric sorbent coupled to high performance liquid chromatography with UV diode array detection for the determination of ten N‐nitrosamines in meat products: a validated approach. International Journal of Food Science and Technology, 55, 1097–1109. [Google Scholar]
- IARC (International Agency for Research in Cancer) , 1978. Monographs on the Evaluation of the Carcinogenic Risk of Chemicals to Humans, Vol. 17: Some N‐Nitroso Compounds. IARC, Lyon. [Google Scholar]
- IARC (International Agency for Research in Cancer) , 1982. Monographs on the Evaluation of the Carcinogenic Risk of Chemicals to Humans. 27: Some Aromatic Amines, Anthraquinones and Nitroso Compounds, and Inorganic Fluorides Used in Drinking‐water and Dental Preparations. IARC, Lyon. [PubMed] [Google Scholar]
- IARC (International Agency for Research in Cancer) , 1993. Working Group on the Evaluation of Carcinogenic Risks to Humans, Vol. 56. Some Naturally Occurring Substances: Food Items and Constituents, Heterocyclic Aromatic Amines and Mycotoxins. Lyon (FR). Available online: https://www.ncbi.nlm.nih.gov/books/NBK513574/ [Google Scholar]
- IARC (International Agency for Research in Cancer) , 2010a. Working Group on the Evaluation of Carcinogenic Risks to Humans, Vol. 99. Some Aromatic Amines, Organic Dyes, and Related Exposures. Lyon (FR). Available online: https://www.ncbi.nlm.nih.gov/books/NBK385419 [PMC free article] [PubMed] [Google Scholar]
- IARC (International Agency for Research in Cancer) , 2010b. Working Group on the Evaluation of Carcinogenic Risks to Humans, Vol. 94. Ingested Nitrate and Nitrite, and Cyanobacterial Peptide Toxins. Lyon (FR). Available online: https://www.ncbi.nlm.nih.gov/books/NBK326544/ [Google Scholar]
- ICH (International Council for Harmonisation of Technical Requirements for Pharmaceuticals for Human Use) , 2015. Guideline M7 (R1) on assessment and control of DNA reactive (mutagenic) impurities in pharmaceuticals to limit potential carcinogenic risk. 25 August 2015. EMA/CHMP/ICH/83812/2013.
- Igarashi M, Nagata M, Itoh S, Yamoto T and Tsuda S, 2010. Relationship between DNA damage and micronucleus in mouse liver. Journal of Toxicological Sciences, 35, 881–889. [DOI] [PubMed] [Google Scholar]
- Irving CC, Daniel DS and Murphy WM, 1983. The effect of disulfiram on the carcinogenicity of N‐butyl‐N‐(3‐carboxypropyl)nitrosamine in the rat. Carcinogenesis, 4, 617–620. 10.1093/carcin/4.5.617 [DOI] [PubMed] [Google Scholar]
- Ishidate M Jr and Odashima S, 1977. Chromosome tests with 134 compounds on Chinese hamster cells in vitro—a screening for chemical carcinogens. Mutation Research/Fundamental and molecular mechanisms of mutagenesis, 48, 337–353. [DOI] [PubMed] [Google Scholar]
- Ito N, 1973. Experimental studies on tumors of the urinary system of rats induced by chemical carcinogens. Acta Pathologica Japonica, 23, 87–109. 10.1111/j.1440-1827.1973.tb00777.x [DOI] [PubMed] [Google Scholar]
- Ito N, Tsuda H, Hasegawa R and Imaida K, 1982. Sequential observation of pathomorphologic alterations in preneoplastic lesions during the promoting stage of hepatocarcinogenesis and the development of short‐term test system for hepatopromoters and hepatocarcinogens. Toxicologic Pathology, 10, 37–47. 10.1177/019262338201000207 [DOI] [PubMed] [Google Scholar]
- Itoh S, Chiharu H, Mayumi N and Atsushi S, 2012. Structural and numerical chromosome aberration inducers in liver micronucleus test in rats with partial hepatectomy. Mutation Research, 747, 98–103. 10.1016/j.mrgentox.2012.04.007 [DOI] [PubMed] [Google Scholar]
- Itoh S, Miura M, Itoh T, Miyauchi Y, Suga M, Takahashi Y, Kasahara Y, Yamamura E, Hirono H and Shimada H, 1999. N‐Nitrosodi‐n‐propylamine induces organ specific mutagenesis with specific expression times in lacZ transgenic mice. Mutation Research, 444, 309–319. [DOI] [PubMed] [Google Scholar]
- Ivankovic S, 1968. Transplacental induction of malignant tumors of the nervous system. I. Ethylnitrosourea in BD‐IX rats. Z. Krebsforsch, 71, 320–360. [PubMed] [Google Scholar]
- Iyengar JR, Panalaks T, Miles WF and Sen NP, 1976. A survey of fish products for volatile nitrosamines. Journal of the Science of Food and Agriculture, 27, 527–530. [DOI] [PubMed] [Google Scholar]
- Izquierdo‐Pulido M, Barbour JF and Scanlan RA, 1996. N‐nitrosodimethylamine in Spanish beers. Food and Chemical Toxicology, 34, 297–299. [DOI] [PubMed] [Google Scholar]
- Jackson PE, Hall CN, Badawi AF, O'Connor PJ, Cooper DP and Povey AC, 1996. Frequency of Ki‐ras mutations and DNA alkylation in colorectal tissue from individuals living in Manchester. Molecular Carcinogenesis: Published in cooperation with the University of Texas MD Anderson Cancer Center, 16, 12–19. [DOI] [PubMed] [Google Scholar]
- Jakszyn P, Bingham S, Pera G, Agudo A, Luben R, Welch A, Boeing H, Del Giudice G, Palli D, Saieva C and Krogh V, 2006. Endogenous versus exogenous exposure to N‐nitroso compounds and gastric cancer risk in the European Prospective Investigation into Cancer and Nutrition (EPIC‐EURGAST) study. Carcinogenesis, 27, 1497–1501. [DOI] [PubMed] [Google Scholar]
- Jakszyn P, González CA, Luján‐Barroso L, Ros MM, Bueno‐de‐Mesquita HB, Roswall N, Tjønneland AM, Büchner FL, Egevad L, Overvad K and Raaschou‐Nielsen O, 2011. Red meat, dietary nitrosamines, and heme iron and risk of bladder cancer in the European Prospective Investigation into Cancer and Nutrition (EPIC). Cancer Epidemiology, Biomarkers and Prevention, 20, 555–559. [DOI] [PubMed] [Google Scholar]
- Jakszyn PG, Allen NE, Lujan‐Barroso L, Gonzalez CA, Key TJ, Fonseca‐Nunes A, Tjønneland A, Føns‐Johnsen N, Overvad K, Teucher B and Li K, 2012. Nitrosamines and heme iron and risk of prostate cancer in the european prospective investigation into cancer and nutrition heme iron, nitrosamines intake, and prostate cancer. Cancer Epidemiology, Biomarkers and Prevention, 21, 547–551. [DOI] [PubMed] [Google Scholar]
- Janzowski C, Gottfried J, Eisenbrand G and Preussman R, 1982. Fluoro‐substituted N‐nitrosamines. 3. Microsomal metabolism of N‐nitrosodibutylamine and of fluorinated analogs. Carcinogenesis, 3, 777–780. 10.1093/carcin/3.7.777 [DOI] [PubMed] [Google Scholar]
- Jarman M and Manson D, 1986. The metabolism of N ‐nitrosomorpholine by rat liver microsomes and its oxidation by the Fenton system. Carcinogenesis, 7, 559–565. 10.1093/carcin/7.4.559 [DOI] [PubMed] [Google Scholar]
- Jawad IM, 2012. Estimation of nitrite, nitrate and N‐nitrosamines in selected food samples. Pakistan Journal of Nutrition, 11, 481–483. [Google Scholar]
- Jenkins TD, Mueller A, Odze R, Shahsafaei A, Zukerberg LR, Kent R, Stoner GD and Rustgi AK, 1999. Cyclin D1 overexpression combined with N‐nitrosomethylbenzylamine increases dysplasia and cellular proliferation in murine esophageal squamous epithelium. Oncogene, 18, 59–66. [DOI] [PubMed] [Google Scholar]
- Jiao J, Douglas GR, Gingerich JD and Soper LM, 1997. Analysis of tissue‐specific lacZ mutations induced by N‐nitrosodibenzylamine in transgenic mice. Carcinogenesis, 18, 2239–2245. [DOI] [PubMed] [Google Scholar]
- Jiao J, Glickman BW, Anderson MW and Zielinska M, 1993. Mutational specificity of N‐nitrosodimethylamine: comparison between in vivo and in vitro assays. Mutation Research, 301, 27–31. [DOI] [PubMed] [Google Scholar]
- Jo C, Ahn HJ, Son JH, Lee JW and Byun MW, 2003. Packaging and irradiation effect on lipid oxidation, color, residual nitrite content, and nitrosamine formation in cooked pork sausage. Food Control, 14, 7–12. [Google Scholar]
- Johansson‐Brittebo E and Tjälve H, 1979. Fate of nitrosopyrrolidine and dimethylnitrosamine in mice. Studies on the distribution and metabolism of N‐[14C]nitrosopyrrolidine in mice. Chemico‐Biological Interactions, 25, 243–254. [DOI] [PubMed] [Google Scholar]
- JECFA (Joint FAO/WHO Food Standards Programme Codex Committee on Food Additives) , 2017. Forty‐ninth Session Macao SAR, China, 20‐24 March 2017. Discussion Paper on the use of nitrates (INS 251, 252) and nitrites (INS 249, 250). CX/FA 17/49/11, December 2016 Codex Alimentarius Commission, Rome, Italy. [Google Scholar]
- Johnson KW, Munson AE and Holsapple MP, 1987. Primary cellular target responsible for dimethylnitrosamine‐induced immunosuppression in the mouse. Immunopharmacology, 13, 47–60. [DOI] [PubMed] [Google Scholar]
- Juszkiewicz T and Kowalski B, 1974. Passage of nitrosamines from rumen into milk in goats. In: Bogovski P and Walker EA (eds). N‐nitroso compounds in the environment. 9. IARC Scientific Publications Lyon. pp. 173–176. [Google Scholar]
- Kakizoe T, Wang TT, Eng VWS, Furrer R, Dion P and Bruce WR, 1979. Volatile N‐Nitrosamines in the urine of normal donors and of bladder cancer patients. Cancer Research, 39, 829–832. [PubMed] [Google Scholar]
- Kalus WH and Filby WG, 1980. Inhibition of nitrosamine formation by ascorbic acid: participation of free radicals in its anaerobic reaction with nitrite. Experientia, 36, 147–149. [DOI] [PubMed] [Google Scholar]
- Kaminski NE, Jordan SD, Page D, Kim BS and Holsapple MP, 1989. Suppression of humoral immune responses by dialkylnitrosamines: structure‐activity relationships. Fundamental and Applied Toxicology, 12, 321–332. [DOI] [PubMed] [Google Scholar]
- Kang HI, Konishi C, Eberle G, Rajewsky MF, Kuroki T and Huh NH, 1992. Highly sensitive, specific detection of O 6‐methylguanine, O 4‐methylthymine, and O 4‐ethylthymine by the combination of high‐performance liquid chromatography prefractionation, 32P postlabeling, and immunoprecipitation. Cancer research, 52, 5307–5312. [PubMed] [Google Scholar]
- Kang HI, Konishi C, Kuroki T and Huh NH, 1995. Detection of O 6‐methylguanine, O 4‐methylthymine and O 4‐ethylthymine in human liver and peripheral blood leukocyte DNA. Carcinogenesis, 16, 1277–1280. [DOI] [PubMed] [Google Scholar]
- Kanki K, Nishikawa A, Masumura K, Umemura T, Imazawa T, Kitamura Y, Nohmi T and Hirose M, 2005. In vivo mutational analysis of liver DNA in gpt delta transgenic rats treated with the hepatocarcinogens N‐nitrosopyrrolidine, 2‐amino‐3‐methylimidazo[4,5‐f]quinoline, and di(2‐ethylhexyl)phthalate. Molecular Carcinogenesis, 42, 9–17. [DOI] [PubMed] [Google Scholar]
- Katic J, Cemeli E, Bau mgartner A, Laubenthal J, Bassano I, Stølevik SB, Granum B, Namork E, Nygaard UC, Løvik M, van Leeuwen D, Vande Loock K, Anderson D, Fucić A and Decordier I, 2010. Evaluation of the genotoxicity of 10 selected dietary/ environmental compounds with the in vitro micronucleus cytokinesis‐block assay in an interlaboratory comparison. Food and Chemical Toxicology, 48, 2612–2623. [DOI] [PubMed] [Google Scholar]
- Kawabata T, Uibu J, Ohshima H, Matsui M, Hamano M and Tokiwa H, 1980. Occurrence, formation and precursors of N‐nitroso compounds in the Japanese diet. IARC Scientific Publications, 31, 481–492. [PubMed] [Google Scholar]
- Kawabata T and Shyazuki H, 1972. Refuting the formation of N‐Nitrosamines by the Maillard reaction. Nippon Shokuhin Kogyo Gakkaishi, 19, 241–248. [Google Scholar]
- Keefer LK, Lijinsky W and Garcia H, 1973. Deuterium isotope effect on the carcinogenicity of dimethylnitrosamine in rat lover. Journal of the National Cancer Institute, 51, 299–302. [DOI] [PubMed] [Google Scholar]
- Keefer LK, Anjo T, Wade D, Wang T and Yang CS, 1987. Concurrent generation of methylamine and nitrite during denitrosation of N‐nitrosodimethylamine by rat liver microsomes. Cancer Research, 47, 447–452. [PubMed] [Google Scholar]
- Keenan TH and Weinkam RJ, 1985. The half‐lives of alkylating intermediates from diethylnitrosamine and N‐nitrosopyrrolidine: a method for the measurement of metabolically generated reactive species. Toxicology and Applied Pharmacology, 78, 316–320. [DOI] [PubMed] [Google Scholar]
- Keszei AP, Goldbohm RA, Schouten LJ, Jakszyn P and van den Brandt PA, 2013. Dietary N‐nitroso compounds, endogenous nitrosation, and the risk of esophageal and gastric cancer subtypes in the Netherlands Cohort Study. The American Journal of Clinical Nutrition, 97, 135–146. [DOI] [PubMed] [Google Scholar]
- Ketkar MB, Holste J, Preussmann R and Althoff J, 1983. Carcinogenic effect of nitrosomorpholine administered in the drinking water to Syrian golden hamsters. Cancer Letters, 17, 333–338. [DOI] [PubMed] [Google Scholar]
- Ketkar MB, Schneider P, Preussmann R, Plass C and Mohr U, 1982. Carcinogenic effect of low doses of nitrosopyrrolidine administered in drinking water to Syrian golden hamsters. Journal of Cancer Research and Clinical Oncology, 104, 75–79. 10.1007/BF00402055 [DOI] [PubMed] [Google Scholar]
- Khanal S, Singh P, Avlasevich SL, Torous DK, Bemis JC and Dertinger SD, 2018. Integration of liver and blood micronucleus and Pig‐a gene mutation endpoints into rat 28‐day repeat‐treatment studies: proof‐of‐principle with diethylnitrosamine. Mutation Research – Genetic Toxicology and Environmental Mutagenesis, 828, 30–35. [DOI] [PMC free article] [PubMed] [Google Scholar]
- Khanna SD and Puri D, 1966. The hepatotoxic effects of dimethyl‐ nitrosamine in the rat. Journal of Pathology and Bacteriology, 91, 605–608. [DOI] [PubMed] [Google Scholar]
- Kier LD, Brusick DJ, Auletta AE, Von Halle ES, Brown MM, Simmon VF, Dunkel V, McCann J and Mortelmans K, 1986. The Salmonella typhimurium/mammalian microsomal assay. A report of the U.S. Environmental Protection Agency Gene‐Tox Program. Mutation Research, 168, 69–240. [DOI] [PubMed] [Google Scholar]
- Kim MS, Koh MS and Kwon TY, 1985. Changes of nitrosamine‐related‐compounds by salt concentration and nitrate content during the korean native soysauce fermentation. Journal of The Korean Society of Food Science and Nutrition, 14, 329–338. [Google Scholar]
- Kim YD, Wang J, Shibli F, Poels KE, Ganocy SJ and Fass R, 2021. No association between chronic use of ranitidine, compared with omeprazole or famotidine, and gastrointestinal malignancies. Alimentary Pharmacology and Therapeutics, 54, 606–615. [DOI] [PubMed] [Google Scholar]
- Klein D, Keshavarz A, Lafont P, Hardy J and Debry G, 1980. Formation of nitrosamines in cheese products. Annales de la nutrition et de l'alimentation, 34, 1077–1088. [PubMed] [Google Scholar]
- Klein D, Lafont P and Keshawarz A, 1978. Influence of microorganisms on the formation of nitrosamines. Annales de la nutrition et de l'alimentation, 32, 425–435. [PubMed] [Google Scholar]
- Knekt P, Järvinen R, Dich J and Hakulinen T, 1999. Risk of colorectal and other gastro‐intestinal cancers after exposure to nitrate, nitrite and N‐nitroso compounds: a follow‐up study. International Journal of Cancer, 80, 852–856. [DOI] [PubMed] [Google Scholar]
- Knight T, Pirastu R, Palli D, Cocco P, Leach S, Packer P, Iannarilli R, Manca P, Møller H and Forman D, 1992. Nitrate and N‐nitrosoproline excretion in two Italian regions with contrasting rates of gastric cancer: the role of nitrate and other factors in endogenous nitrosation. International Journal of Cancer, 50, 736–739. [DOI] [PubMed] [Google Scholar]
- Kobayashi J, 2018. Effect of diet and gut environment on the gastrointestinal formation of N‐nitrosocompounds: a review. Nitric Oxide, 73, 66–73. [DOI] [PubMed] [Google Scholar]
- Kocak D, Ozel MZ, Gogus F, Hamilton JF and Lewis AC, 2012. Determination of volatile nitrosamines in grilled lamb and vegetables using comprehensive gas chromatography ‐ nitrogen chemiluminescence detection. Food Chemistry, 135, 2215–2220. [DOI] [PubMed] [Google Scholar]
- Koepke SR, Kroeger‐Koepke MB and Michejda CJ, 1990. Evidence for an unstable DNA adduct from N‐nitroso‐N‐methylaniline. Chemical Research in Toxicology, 3, 17–20. 10.1021/tx00013a003 [DOI] [PubMed] [Google Scholar]
- Kokkinakis DM, 1991. Differences between pancreatropic nitrosamine carcinogens and N‐nitrosodimethylamine in methylating DNA in various tissues of hamsters and rats. Chemico‐Biological Interactions, 78, 167–181. [DOI] [PubMed] [Google Scholar]
- Kokkinakis DM, 1990. Differences in DNA‐guanine alkylation between male Sprague‐Dawley rats and Syrian hamsters following exposure to a single dose of pancreatic nitrosamine carcinogens. Chemical Research in Toxicology, 3, 150–156. [DOI] [PubMed] [Google Scholar]
- Komarova NV and Velikanov AA, 2001. Determination of volatile N‐Nitrosamines in food by high‐performance liquid chromatography with fluorescence detection. Journal of Analytical Chemistry, 56, 359–363. [Google Scholar]
- Koreeda T, Yamanaka E, Yamamichi K, Tashiro S, Tsubura A and Hioki K, 1999. Inhibitory effect of retinoid on esophageal carcinogenesis in rats induced by N‐nitroso‐N‐methylbutylamine in relation to cellular retinoic acid‐binding protein. Anticancer Research, 19, 4139–4143. [PubMed] [Google Scholar]
- Koppang N and Rimeslåtten H, 1976. Toxic and carcinogenic effects of nitrosodimethylamine in mink. IARC Scientific Publications, 14, 443–452. [PubMed] [Google Scholar]
- Kostka T, Fohrer J, Guigas C, Briviba K, Seiwert N, Fahrer J, Steinberg P and Empl MT, 2020. Synthesis and in vitro characterization of the genotoxic, mutagenic and cell‐transforming potential of nitrosylated heme. Archives of Toxicology, 94, 3911–3927. [DOI] [PMC free article] [PubMed] [Google Scholar]
- Korsrud GO, Grice HG, Goodman TK, Knipfel JE and McLaughlan JM, 1973. Sensitivity of several serum enzymes for the detection of thioacetamide‐, dimethylnitrosamine‐ and diethanolamine‐induced liver damage in rats. Toxicology and Applied Pharmacology, 26, 299–313. [DOI] [PubMed] [Google Scholar]
- Krasner SW, Mitch WA, McCurry DL, Hanigan D and Westerhoff P, 2013. Formation, precursors, control, and occurrence of nitrosamines in drinking water: a review. Water Research, 47, 4433–4450. [DOI] [PubMed] [Google Scholar]
- Kroeger‐Koepke MB, Andrews AW, Kupper RJ, Koepke SR and Michejda CJ, 1981a. Mutagenicity and rat‐liver S9 demethylation kinetics of N‐nitrosomethylaniline and its ring‐substituted derivatives. Mutation Research, 89, 255–267. [DOI] [PubMed] [Google Scholar]
- Kroeger‐Koepke MB, Koepke SR, McClusky GA, Magee PN and Michejda CJ, 1981b. α‐Hydroxylation pathway in the in vitro metabolism of carcinogenic nitrosamines: N‐nitrosodimethylamine and N‐nitroso‐N‐methylaniline. Proceedings of the National Academy of Sciences of the United States of America, 78, 6489–6493. [DOI] [PMC free article] [PubMed] [Google Scholar]
- Kroeger‐Koepke MB, Reuber MD, Iype PT, Lijinsky W and Michejda CJ, 1983. The effect of substituents in the aromatic ring on carcinogenicity of N‐nitrosomethylaniline in F344 rats. Carcinogenesis, 4, 157–160. [DOI] [PubMed] [Google Scholar]
- Kroes R, van Logten MJ, Berkvens JM, de Vries T and van Esch GJ, 1974. Study on the carcinogenicity of lead arsenate and sodium arsenate and on the possible synergistic effect of diethylnitrosamine. Food and Cosmetics Toxicology, 12, 671–679. 10.1016/0015-6264(74)90238-7 [DOI] [PubMed] [Google Scholar]
- Krüger FW, 1971. Metabolism of nitrosamines in vivo. I. Evidence for ‐oxidation of aliphatic di‐n‐alkylnitrosamines: The simultaneous formation of 7‐methylguanine besides 7‐propyl‐ or 7‐butylguanine after application of di‐n‐propyl‐ or di‐n‐butylnitrosamine. Journal of Cancer Research and Clinical Oncology, 76, 145–154. [DOI] [PubMed] [Google Scholar]
- Krüger FW, 1973. Metabolism of nitrosamines in vivo. II. On the methylation of nucleic acids by aliphatic di‐n‐alkyl‐nitrosamines in vivo, caused by beta‐oxidation: The increased formation of 7‐methyl‐guanine after application of beta‐hydroxypropyl‐propyl‐nitrosamine compared to that after application of di‐n‐propyl‐nitrosamine. Journal of Cancer Research and Clinical Oncology, 79, 90–97. [DOI] [PubMed] [Google Scholar]
- Krüger FW and Bertram B, 1973. Metabolism of nitrosamines in vivo. 3. On the methylation of nucleic acids by aliphatic Di‐n‐alkyl‐nitrosamines in vivo resulting from ß‐oxidation: the formation of 7‐methylguanine after application of 2‐oxo‐propyl‐propyl‐nitrosamine and methyl‐propyl‐nitro‐samine. Journal of Cancer Research and Clinical Oncology, 80, 189–196. [DOI] [PubMed] [Google Scholar]
- Kubacki SJ, Havery DC and Fazio T, 1989. Volatile N‐nitrosamines in Polish malt and beer. Food Additives and Contaminants, 6, 29–33. [DOI] [PubMed] [Google Scholar]
- Kuroki T, Drevon C and Montesano R, 1977. Microsome‐mediated mutagenesis in V79 Chinese hamster cells by various nitrosamines. Cancer Research, 37, 1044–1050. [PubMed] [Google Scholar]
- Kunke KS and Strunk RC, 1981. Complement synthesis by Guinea Pig Peritoneal Macrophages: failure to detect chemical carcinogens. Journal of the National Cancer Institute, 66, 141–145. [PubMed] [Google Scholar]
- Kunze E, Schauer A and Calvoer R, 1969. Zur Histochemie von Harnblasen‐Papillomen der Ratte, induziert dutch Dibutylnitrosamin. Kurze Originalmitteilungen, 12, 639. [DOI] [PubMed] [Google Scholar]
- Kunze E and Schauer A, 1971. Enzymhistochemische und autoradiographische Untersuchungen an Dibutylnitrosamin‐induzierten Harnblasenpapillomen der Ratte. Z. Krebsforsch, 75, 146–160. [PubMed] [Google Scholar]
- Lachenmeier DW and Fügel D, 2007. Reduction of Nitrosamines in Beer ‐ Review of a Success Story. BrewingScience ‐ Monatsschrift für Brauwissenschaft, 60, 84–89. [Google Scholar]
- Lakritz L and Pensabene JW, 1981. Survey of fluid and nonfat dry milks for N‐Nitrosamines. Journal of Dairy Science, 64, 371–374. [Google Scholar]
- Lakritz L, Gates RA, Gugger AM and Wasserman AE, 1982. Nitrosamine levels in human blood, urine and gastric aspirate following ingestion of foods containing potential nitrosamine precursors or preformed nitrosamines. Food and Chemical Toxicology, 20, 455–459. [DOI] [PubMed] [Google Scholar]
- Lakritz L and Pensabene JW, 1984. Survey of human milk for volatile N‐Nitrosamines and the influence of diet on their formation. Food and Chemical Toxicology, 22, 721–724. [DOI] [PubMed] [Google Scholar]
- Lambert IB, Singer TM, Boucher SE and Douglas GR, 2005. Detailed review of transgenic rodent mutation assays. Mutation Research, 590, 1–280. [DOI] [PubMed] [Google Scholar]
- Larsson SC, Bergkvist L and Wolk A, 2006. Processed meat consumption, dietary nitrosamines and stomach cancer risk in a cohort of Swedish women. International Journal of Cancer, 119, 915–919. [DOI] [PubMed] [Google Scholar]
- La Vecchia C, D'Avanzo B, Airoldi L, Braga C and Decarli A, 1995. Nitrosamine intake and gastric cancer risk. European Journal of Cancer Prevention, 469–474. [DOI] [PubMed] [Google Scholar]
- Lee HS, 2019. Literature compilation of volatile N‐nitrosamines in processed meat and poultry products ‐ an update. Food Additives and Contaminants: Part A, 36, 1491–1500. [DOI] [PubMed] [Google Scholar]
- Lee KY and Lijinsky W, 1966. Alkylation of rat liver RNA by cyclic N‐nitrosamines in vivo. Journal of the National Cancer Institute, 37, 401–407. [PubMed] [Google Scholar]
- Lee SY and Guttenplan JB, 1981. A correlation between mutagenic and carcinogenic potencies in a diverse group of N‐nitrosamines: determination of mutagenic activities of weakly mutagenic N‐nitrosamines. Carcinogenesis, 2, 1339–1344. [DOI] [PubMed] [Google Scholar]
- Lee‐Six H, Olafsson S, Ellis P, Osborne RJ, Sanders MA, Moore L, Georgakopoulos N, Torrente F, Noorani A, Goddard M, Robinson P, Coorens THH, O'Neill L, Alder C, Wang J, Fitzgerald RC, Zilbauer M, Coleman N, Saeb‐Parsy K, Martincorena I, Campbell PJ and Stratton MR, 2019. The landscape of somatic mutation in normal colorectal epithelial cells. Nature, 574, 532–537. 10.1038/s41586-019-1672-7 [DOI] [PubMed] [Google Scholar]
- Le Page RN and Christie GS, 1969a. Induction of liver tumours in the guinea pig by feeding dimethylnitrosamine. Pathology, 1, 49–56. 10.3109/00313026909061034 [DOI] [PubMed] [Google Scholar]
- Le Page RN and Christie GS, 1969b. Induction of liver tumours in the rabbit by feeding dimethylnitrosamine. British Journal of Cancer, 23, 125–131. 10.1038/bjc.1969.18 [DOI] [PMC free article] [PubMed] [Google Scholar]
- Leung KH, Park KK and Archer MC, 1978. α‐Hydroxylation in the metabolism of N‐ nitrosopiperidine by rat liver microsomes: formation of 5‐hydroxypentanal. Research communications in chemical pathology and pharmacology, 19, 201–211. [PubMed] [Google Scholar]
- Leung KH and Archer MC, 1981. Urinary metabolites of N‐nitrosodipropylamine, N‐nitroso‐2‐hydroxypropylpropylamine and N‐nitroso‐2‐oxoproylpropylamine in the rat. Carcinogenesis, 2, 859–862. [DOI] [PubMed] [Google Scholar]
- Leung KH and Archer MC, 1985. Mechanism of DNA methylation by N‐nitroso(2‐oxopropyl)propylamine. Carcinogenesis (London), 6, 189–191. [DOI] [PubMed] [Google Scholar]
- Lehotay SJ, Sapozhnikova Y, Han L and Johnston JJ, 2015. Analysis of nitrosamines in cooked Bacon by QuEChERS sample preparation and gas chromatography‐tandem mass spectrometry with backflushing. Journal of Agricultural and Food Chemistry, 47, 10341–10351. 10.1021/acs.jafc.5b04527 [DOI] [PubMed] [Google Scholar]
- Levin W, Thomas PE, Oldfield N and Ryan DE, 1986. N‐demethylation of N‐nitrosodimethylamine catalyzed by purified rat hepatic microsomal cytochrome P‐450: isozyme specificity and role of cytochrome b5. Archives of Biochemistry and Biophysics, 248, 158–165. 10.1016/0003-9861(86)90412-1 [DOI] [PubMed] [Google Scholar]
- Li L, Wang P, Xu X and Zhou G, 2012. Influence of various cooking methods on the concentrations of volatile N‐Nitrosamines and biogenic amines in dry‐cured sausages. Journal of Food Science, 77, C560–C565. [DOI] [PubMed] [Google Scholar]
- Li J, Shao J, Zhu X, Zhou G and Xu X, 2013. Effect of plant polyphenols and ascorbic acid on lipid oxidation, residual nitrite and N‐nitrosamines formation in dry‐cured sausage. International Journal of Food Science and Technology, 48, 1157–1164. [Google Scholar]
- Li MH, Jiang YZ, Li GY, Guo SP, Fan WG, Zhao XJ and Han NJ, 1985. Induction of Forestomach and Liver Carcinomas in Mice and Rats by MAMBNA. Chinese Clinical Oncology, 7, 329–331. [Google Scholar]
- Li M‐H, Ji C and Cheng S‐J, 1986. Occurrence of nitroso compounds in fungi‐contaminated foods: a review. Nutrition and Cancer, 8, 63–69. [DOI] [PubMed] [Google Scholar]
- Li W, Chen N, Zhao Y, Guo W, Muhammd N, Zhu Y and Huang Z, 2018. Online coupling of tandem liquid‐phase extraction with HPLC‐UV for the determination of trace N‐nitrosamines in food products. Analytical Methods, 10, 1733–1739. [Google Scholar]
- Li Y and Hecht SS, 2022. Metabolic activation and DNA interactions of carcinogenic N‐Nitrosamines to which humans are commonly exposed. International Journal of Molecular Sciences, 23, 4559. [DOI] [PMC free article] [PubMed] [Google Scholar]
- Lijinsky W and Taylor HW, 1975. Increased carcinogenicity of 2, 6‐dimethylnitrosomorpholine compared with nitrosomorpholine in rats. Cancer Research, 35, 2123–2125. [PubMed] [Google Scholar]
- Lijinsky W, Taylor HW and Keefer LK, 1976. Reduction of Rat Liver Carcinogenicity of α‐Nitrosomorpholine by a‐Deuterium Substitution. Journal of the National Cancer Institute, 57, 1311–1313. [DOI] [PubMed] [Google Scholar]
- Lijiinsky W, 1976. Carcinogenicity of two unsaturated derivatives of N‐nitrosopiperidine in Sprague‐Dawley rats. Journal of Natlional Cancer Institute, 57, 1315–1317. [DOI] [PubMed] [Google Scholar]
- Lijinsky W and Taylor HW, 1979. Carcinogenicity of methylated derivatives of N‐nitrosodiethylamine and related compounds in Sprague‐Dawley rats. Journal of the National Cancer Institute, 62, 407–410. [PubMed] [Google Scholar]
- Lijinsky W and Reuber MD, 1980. Carcinogenicity in rats of nitrosomethylethylamines labeled with deuterium in several positions. Cancer Research, 40, 19–21. [PubMed] [Google Scholar]
- Lijinsky W, Reuber MD, Saavedra JE and Blackwell BN, 1980. The effect of deuterium on the carcinogenicity of nitroso‐methyl‐n‐butylamine. Carcinogenesis, 1, 157–160. 10.1093/carcin/1.2.157 [DOI] [PubMed] [Google Scholar]
- Lijinsky W, Reuber MD and Riggs CW, 1981. Dose response studies of carcinogenesis in rats by nitrosodiethylamine. Cancer Research, 41(12 Part 1), 4997–5003. [PubMed] [Google Scholar]
- Lijinsky W and Reuber MD, 1981. Comparative carcinogenesis by some aliphatic nitrosamines in Fischer rats. Cancer Letters, 14, 297–302. 10.1016/0304-3835(81)90158-0 [DOI] [PubMed] [Google Scholar]
- Lijinsky W, Saavedra JE, Reuber MD and Singer SS, 1982. Oesophageal carcinogenesis in F344 rats by nitrosomethylethylamines substituted in the ethyl group. Journal of the National Cancer Institute, 68, 681–684. [PubMed] [Google Scholar]
- Lijinsky W, Reuber MD, Saavedra JE and Singer GM, 1983. Carcinogenesis in F344 rats by N‐nitrosomethyl‐n‐propylamine derivatives. Journal of the National Cancer Institute, 70, 959–963. [PubMed] [Google Scholar]
- Lijinsky W, 1984. Species differences in nitrosamine carcinogenesis. Journal of Cancer Research and Clinical Oncology, 108, 46–55. [DOI] [PubMed] [Google Scholar]
- Lijinsky W, Kovatch RM and Knutsen GL, 1984. Carcinogenesis by nitrosomorpholines, nitrosooxazolidines and nitrosoazetidine given by gavage to Syrian golden hamsters. Carcinogenesis, 5, 875–878. [DOI] [PubMed] [Google Scholar]
- Lijinsky W and Reuber MD, 1984. Carcinogenesis in rats by nitrosodimethylamine and other nitrosomethylalkylamines at low doses. Cancer Letters, 22, 83–88. 10.1016/0304-3835(84)90047-8 [DOI] [PubMed] [Google Scholar]
- Lijinsky W, Kovatch M and Riggs CV, 1987. Carcinogenesis by nitrosodialkylamines and azoxyalkanes given by gavage to rats and hamsters. Cancer Research, 47, 3968–3972. [PubMed] [Google Scholar]
- Lijinsky W, Kovatch RM, Riggs CW and Walters PT, 1988. Dose response study with N‐nitrosomorpholine in drinking water of F‐344 rats. Cancer Research, 48, 2089–2095. [PubMed] [Google Scholar]
- Lijinsky W, 1999. N‐Nitroso compounds in the diet. Mutation Research, 443, 129–138. [DOI] [PubMed] [Google Scholar]
- Liu WB, Ao L, Zhou ZY, Cui ZH, Zhou YH, Yuan XY, Xiang YL, Cao J and Liu JY, 2010. CpG island hypermethylation of multiple tumor suppressor genes associated with loss of their protein expression during rat lung carcinogenesis induced by 3‐methylcholanthrene and diethylnitrosamine. Biochemical and Biophysical Research Communications, 402, 507–514. [DOI] [PubMed] [Google Scholar]
- Lo Magro S, Summa S, Iammarino M, D'Antini P, Marchesani G, Chiaravalle AE and Muscarella M, 2020. A 5‐Years (2015–2019) Control activity of an EU laboratory: contamination of histamine in fish products and exposure assessment. Applied Science, 10, 8693. [Google Scholar]
- Loh YH, Jakszyn P, Luben RN, Mulligan AA, Mitrou PN and Khaw KT, 2011. N‐nitroso compounds and cancer incidence: the European Prospective Investigation into Cancer and Nutrition (EPIC)–Norfolk Study. The American Journal of Clinical Nutrition, 93, 1053–1061. [DOI] [PubMed] [Google Scholar]
- Löfberg B and Tjälve H, 1985. Tissue specificity of N‐nitrosomorpholine metabolism in Sprague‐Dawley rats. Food and Chemical Toxicology, 23, 647–654. 10.1016/0278-6915(85)90152-8 [DOI] [PubMed] [Google Scholar]
- Lombard C, 1965. Hepatic cancerization of the guinea pig by diethylnitrosamine in subcutaneous injection. Bulletin de l'Association francaise pour l'etude du cance, 52, 389–410. [PubMed] [Google Scholar]
- Lona‐Ramirez FJ, Gonzalez‐Alatorre G, Rico‐Ramírez V, Perez‐Perez MC and Castrejón‐González EO, 2016. Gas chromatography/mass spectrometry for the determination of nitrosamines in red wine. Food Chemistry, 196, 1131–1136. [DOI] [PubMed] [Google Scholar]
- Longo V, Citti L and Gervasi PG, 1986. Metabolism of diethylnitrosamine by nasal mucosa and hepatic microsomes from hamster and rat: species specificity of nasal mucosa. Carcinogenesis, 7, 1323–1328. [DOI] [PubMed] [Google Scholar]
- Lorr NA, Tu YY and Yang CS, 1982. The nature of nitrosamine denitrosation by rat liver microsomes. Carcinogenesis, 3, 1039–1043. 10.1093/carcin/3.9.1039 [DOI] [PubMed] [Google Scholar]
- Loureiro AP, Zhang W, Kassie F, Zhang S, Villalta PW, Wang M and Hecht SS, 2009. Mass spectrometric analysis of a cyclic 7,8‐butanoguanine adduct of N‐nitrosopyrrolidine: comparison to other N‐nitrosopyrrolidine adducts in rat hepatic DNA. Chemical Research in Toxicology, 22, 1728–1735. [DOI] [PMC free article] [PubMed] [Google Scholar]
- Loury DJ, Byard L and Shibamoto T, 1984. Genotoxicity of N‐nitrosothiazolidine in microbial and hepatocellular test systems. Food and Chemical Toxicology, 22, 1013–1014. [DOI] [PubMed] [Google Scholar]
- Love LA, Pelfrene A and Garcia H, 1977. Effect of intestinal microflora suppression on liver carcinogenicity of dimethylnitrosamine in Syrian hamsters. Journal of the National Cancer Institute, 58, 1835–1836. 10.1093/jnci/58.6.1835 [DOI] [PubMed] [Google Scholar]
- Lu SH, Camus A‐M, Ji C, Wang YL, Wang MY and Bartsch H, 1980. Mutagenicity in Salmonella typhimurium of N‐3‐methylbutyl‐N‐1‐methyl‐acetonyl‐nitrosamine and N‐methyl‐N‐benzylnitrosamine, N‐nitrosation products isolated from corn‐bread contaminated with commonly occurring moulds in Linshien county, a high incidence area for oesophageal cancer in Northern China. Carcinogenesis, 1, 867–870. [DOI] [PubMed] [Google Scholar]
- Lu SH, Montesano R, Zhang MS, Feng L, Luo FJ, Chui SX, Umbenhauer D, Saffhill R and Rajewsky MF, 1986. Relevance of N‐nitrosamines to esophageal cancer in China. Journal of Cellular Physiology, 4, 51–58. [DOI] [PubMed] [Google Scholar]
- Lu S, Wu D, Li G, Lv Z, Gong P, Xia L, Sun Z, Chen G, Chen X, You J and Wu Y, 2017. Facile and sensitive determination of N‐nitrosamines in food samples by high‐performance liquid chromatography via combining fluorescent labeling with dispersive liquid‐liquid microextraction. Food Chemistry, 234, 408–415. [DOI] [PubMed] [Google Scholar]
- Luo Q, Wang D and Wang Z, 2012. Occurrences of nitrosamines in chlorinated and chloraminated drinking water in three representative cities, China. Science of the Total Environment, 437, 219–225. [DOI] [PubMed] [Google Scholar]
- Maduagwu EN and Bassir O, 1980. A comparative assessment of toxic effects of dimethylnitrosamine in six different species. Toxicology and Applied Pharmacology, 53, 211–219. 10.1016/0041-008X(80)90421-4 [DOI] [PubMed] [Google Scholar]
- Magee PN, 1956. Toxic liver injury. The metabolism of dimethylnitrosamine. Biochemical Journal, 64, 676. [DOI] [PMC free article] [PubMed] [Google Scholar]
- Magee PN and Barnes JM, 1956. The production of malignant primary hepatic tumours in the rat by feeding dimethylnitrosamine. British Journal of Cancer, 10, 114–122. 10.1038/bjc.1956.15 [DOI] [PMC free article] [PubMed] [Google Scholar]
- Magee PN and Barnes JM, 1962. Induction of kidney tumours in the rat with dimethylnitrosamine (N‐nitrosodimethylamine). Journal of Pathology and Bacteriology, 84, 19–31. 10.1002/path.1700840103 [DOI] [PubMed] [Google Scholar]
- Majer BJ, Mersch‐Sundermann V, Darroudi F, Laky B, de Wit K and Knasmuller S, 2004. Genotoxic effects of dietary and lifestyle related carcinogens in human derived hepatoma (HepG2, Hep3B) cells. Mutation Research, 551, 153–166. [DOI] [PubMed] [Google Scholar]
- Malling HV, 1971. Dimethylnitrosamine: formation of mutagenic compounds by interaction with mouse liver microsomes. Mutation Research, 13, 425–429. [DOI] [PubMed] [Google Scholar]
- Manso JA, Pérez‐Prior MT, García‐Santos MP, Calle E and Casado J, 2008. Steric effect in alkylation reactions by N‐alkyl‐N‐nitrosoureas: a kinetic approach. Journal of Physical Organic Chemistry, 21, 932–938. [Google Scholar]
- Manson D, Cox PJ and Jarman M, 1978. Metabolism of N‐nitrosomorpholine by the rat in vivo and by rat liver microsomes and its oxidation by the Fenton system. Chemico‐Biological Interactions, 20, 341–354. [DOI] [PubMed] [Google Scholar]
- Margison GP and Kleihues P, 1975. Chemical carcinogenesis in the nervous system preferential accumulation of O6‐methylguanine in rat brain deoxyribonucleic acid during repetitive administration of N‐methyl‐N‐nitrosourea. Biochemical Journal, 148, 521–525. [DOI] [PMC free article] [PubMed] [Google Scholar]
- Mavelle T, Bouchikhi B and Debry G, 1991. The occurrence of volatile N‐nitrosamines in French foodstuffs. Food Chemistry, 42, 321–338. [Google Scholar]
- McCutcheon JW, 1984. Nitrosamines in Bacon: a case study of balancing risks. Public Health Reports, 99, 360–364. [PMC free article] [PubMed] [Google Scholar]
- McGregor D, 1994. The genetic toxicology of N‐nitrosodiphenylamine. Mutation Research, 317, 195–211. [DOI] [PubMed] [Google Scholar]
- McNamee JP and Bellier PV, 2015. Use of a standardized JaCVAM in vivo rat comet assay protocol to assess the genotoxicity of three coded test compounds; ampicillin trihydrate, 1,2‐dimethylhydrazine dihydrochloride, and N‐nitroso dimethylamine. Mutation Research – Genetic Toxicology and Environmental. Mutagenesis, 786–788, 158–164. [DOI] [PubMed] [Google Scholar]
- Mergens WJ and Newmark HL, 1980. Antioxidants as blocking agents against nitrosamine formation. In Autoxidation in Food and Biological Systems. Springer, Boston, MA. pp. 387–403. [Google Scholar]
- Mestankova H, Schirmer K, Canonica S and Gunten U, 2014. Development of mutagenicity during degradation of N‐nitrosamines by advanced oxidation processes. Water Research, 66C, 399–410. 10.1016/j.watres.2014.08.012 [DOI] [PubMed] [Google Scholar]
- Michaud DS, Holick CN, Batchelor TT, Giovannucci E and Hunter DJ, 2009. Prospective study of meat intake and dietary nitrates, nitrites, and nitrosamines and risk of adult glioma. The American Journal of Clinical Nutrition, 90, 570–577. [DOI] [PMC free article] [PubMed] [Google Scholar]
- Michejda CJ, Kroeger‐Koepke MB and Kovatch RM, 1986. Carcinogenic effects of sequential administration of two nitrosamines in Fischer 344 rats. Cancer Research, 46, 2252–2256. [PubMed] [Google Scholar]
- Mico BA, Swagzdis JE, Hu HS‐W, Keefer LK, Oldfield NF and Garland WA, 1985. Low‐dose in vivo pharmacokinetic and deuterium isotope effect studies of N‐nitrosodimethylamine in rats. Cancer Research, 45, 6280–6285. [PubMed] [Google Scholar]
- Mientjes EJ, Luiten‐Schuite A, van der WE BY, Bergmans A, Berends F, Lohman PH, Baan RA and van Delft JH, 1998. DNA adducts, mutant frequencies, and mutation spectra in various organs of lambda lacZ mice exposed to ethylating agents. Environmental and Molecular Mutagenesis, 31, 18–31. [PubMed] [Google Scholar]
- Mirsalis JC, Provost GS, Matthews CD, Hamner RT, Schindler JE, O'Loughlin KG, MacGregor JT and Short JM, 1993. Induction of hepatic mutations in lacI transgenic mice. Mutagenesis, 8, 265–271. [DOI] [PubMed] [Google Scholar]
- Mirvish SS, Bulay O, Runge RG and Patil K, 1980. Study of the carcinogenicity of large doses of dimethylnitramine, N‐nitroso‐L‐proline, and sodium nitrite administered in drinking water to rats. Journal of the National Cancer Institute, 64(6), 1435–1442. 10.1093/jnci/64.6.1435 [DOI] [PubMed] [Google Scholar]
- Mirvish SS and Kaufman L, 1970. A study of nitrosamines and S‐carboxyl derivatives of cysteine as lung carcinogens in adult SWR mice. International Journal of Cancer, 6, 69–73. [DOI] [PubMed] [Google Scholar]
- Mirvish SS, Issenberg P and Sornson HC, 1976. Air—water and ether—water distribution of N—nitroso compounds: implications for laboratory safety, analytic methodology, and carcinogenicity for the rat esophagus, nose, and liver. Journal of the National Cancer Institute, 56, 1125–1129. [DOI] [PubMed] [Google Scholar]
- Mirvish SS, 1981. Ascorbic acid inhibition of N‐Nitroso compound formation in chemical, food, and biological systems. In: Zedeck MS and Lipkin M (eds.). Inhibition of Tumour Induction and Development. Springer, Boston, MA. pp. 101–126. [Google Scholar]
- Mirzazadeh M, Sadeghi E and Beigmohammadi F, 2021. Comparison of the effects of microwave cooking by two conventional cooking methods on the concentrations of polycyclic aromatic hydrocarbons and volatile N‐nitrosamines in beef cocktail smokies (smoked sausages). Journal of Food Processing and Preservation, 45, e15560. [Google Scholar]
- Miyamae Y, Yamamoto M, Sasaki YF, Kobayashi H, Igarashi‐Soga M, Shimoi K and Hayashi M, 1998. Evaluation of a tissue homogenization technique that isolates nuclei for the in vivo single cell gel electrophoresis (Comet) assay: a collaborative study by five laboratories. Mutation Research, 418, 131–140. [DOI] [PubMed] [Google Scholar]
- Mochizuki M, Suzuki E, Anjo T, Wakabayashi Y and Okada M, 1979. Mutagenic and DNA‐damaging effects of N‐alkyl‐N‐(α‐acetoxyalkyl)nitrosamines, models for metabolically activated N,N‐dialkylnitrosamines. Japanese Journal of Cancer Research, 70, 663–670. [PubMed] [Google Scholar]
- Mohr U and Althoff J, 1965. The Transplacental Action of the Cancerogen, Di‐Ethylnitrosamine (DENA), in the Mouse. Zeitschrifb ffir Krebsforschung, 67, 152–155. [PubMed] [Google Scholar]
- Mohr U, Althoff J and Authaler A, 1966. Diaplacental effect of the carcinogen diethylnitrosamine in the golden hamster. Cancer Research, 26(11_Part_1), 2349–2352. [PubMed] [Google Scholar]
- Mohr U, Althoff J, Emminger A, Bresch H and Spielhoff R, 1972. Effect of nitrosamines on nursing Syrian golden hamsters and their offspring. Zeitschrift für Krebsforschung und Klinische Onkologie, 78, 73–77. [DOI] [PubMed] [Google Scholar]
- Mohr U, Reznik G and Reznik‐Schüller H, 1974. Carcinogenic effects of N‐nitrosomorpholine and N‐nitrosopiperidine on European hamster (Cricetus cricetus). Journal of the National Cancer Institute, 53, 231–237. 10.1093/jnci/53.1.231 [DOI] [PubMed] [Google Scholar]
- Mohr U, Reznik‐Schüller H, Reznik G and Hilfrich J, 1975. Transplacental effects of diethylnitrosamine in Syrian hamsters as related to different days of administration during pregnancy. Journal of the National Cancer Institute, 55, 681–683. [DOI] [PubMed] [Google Scholar]
- Mohr U, 1979. Carcinogenesis of N‐nitroso‐morpholine and derivatives in Syrian golden hamsters. In The Syrian Hamster in Toxicology and Carcinogenesis Research. 24. Karger Publishers. pp. 235–244. [DOI] [PubMed] [Google Scholar]
- Mohr U, Richter‐Reichhelm HB, Emura M, Schmidt‐Riese L, Tsuda H, Michiels F and Althoff J, 1983. Assessment of nitrosamine transplacental carcinogenesis in the Syrian Golden hamster. Biological Research in Pregnancy and Perinatology, 4, 36–39. [PubMed] [Google Scholar]
- Mohr U, Emura M, Kamino K, Steinmann J, Kohler M, Morawietz G, Dasenbrock C and Tomatis L, 1995. Increased risk of cancer in the descendants of Syrian hamsters exposed prenatally to diethylnitrosamine (DEN). International Journal of Cancer, 63, 86–91. [DOI] [PubMed] [Google Scholar]
- Molognoni L, Daguer H, Motta GE, Merlo TC and Lindner JDD, 2019. Interactions of preservatives in meat processing: formation of carcinogenic compounds, analytical methods, and inhibitory agents. Food Research International, 125, 108608. [DOI] [PubMed] [Google Scholar]
- Montesano R and Bartsch H, 1976. Mutagenic and carcinogenic N‐nitroso compounds: possible environmental hazards. Mutation Research, 32, 179–228. [DOI] [PubMed] [Google Scholar]
- Montesano R and Magee PN, 1974. Comparative Metabolism In Vitro of Nitrosamines in Various Animal Species Including Man. IARC Scientific Publications, IO, 39–56. [Google Scholar]
- Montesano R and Hall J, 1984. Nitrosamine metabolism and carcinogenesis. In Mutation, Cancer, and Malformation. Springer, Boston, MA. pp. 447–464. [Google Scholar]
- Morita T, Asano N, Awogi T, Sasaki YF, Sato S, Shimada H, Sutou S, Suzuki T, Wakata A, Sofuni T and Hayashi M, 1997. Evaluation of the rodent micronucleus assay in the screening of IARC carcinogens (groups 1, 2A and 2B) the summary report of the 6th collaborative study by CSGMT/JEMS MMS. Collaborative Study of the Micronucleus Group Test. Mammalian Mutagenicity Study Group. Mutation Research, 389, 3–122. [DOI] [PubMed] [Google Scholar]
- Moschel RC, Hudgins WR and Dipple A, 1979. Selectivity in nucleoside alkylation and alkylation in relation to chemical carcinogenesis. Journal of Organic Chemistry, 44, 3324–3328. [Google Scholar]
- Mukherjee D and Ahmad R, 2015. Dose‐dependent effect of N'‐Nitrosodiethylamine on hepatic architecture, RBC rheology and polypeptide repertoire in Wistar rats. Interdisciplinary Toxicology, 8, 1–7. 10.1515/intox-2015-0001 [DOI] [PMC free article] [PubMed] [Google Scholar]
- Myers MJ and Schook LB, 1987. Modification of macrophage differentiation: dimethylnitrosamine induced alteration in the responses towards the regulatory signals controlling myelopoiesis. International Journal of Immunopharmacology, 9, 817–825. [DOI] [PubMed] [Google Scholar]
- Nagasawa HT, Fraser PS and Yuzon DL, 1973. New method for nitrosation of proline and related sec‐.alpha.‐amino acids to N‐nitrosamino acids with possible oncogenic activity. Journal of Medicinal Chemistry, 16, 583–585. [DOI] [PubMed] [Google Scholar]
- Napalkov NP and Alexandrov VA, 1968. On the effects of blastomogenic substances on the organism during embryogenesis. Zeitschrift für Krebsforschung, 71, 32–50. [DOI] [PubMed] [Google Scholar]
- Narumi K, Ashizawa K, Fujiishi Y, Tochinai R, Okada E, Tsuzuki Y, Tatemoto H, Hamada S, Kaneko K and Ohyama W, 2013. Persistence and accumulation of micronucleated hepatocytes in liver of rats after repeated administration of diethylnitrosamine. Mutation Research, 755, 100–107. [DOI] [PubMed] [Google Scholar]
- Narumi K, Ashizawa K, Takashima R, Takasawa H, Katayama S, Tsuzuki Y, Tatemoto H, Morita T, Hayashi M and Hamada S, 2012. Development of a repeated‐dose liver micronucleus assay using adult rats: an investigation of diethylnitrosamine and 2,4‐diaminotoluene. Mutation Research, 747, 234–239. [DOI] [PubMed] [Google Scholar]
- Nishie K, 1983. Comparison of the effects of N‐nitrosodimethylamine on pregnant and nonpregnant Holtzman rats. Food and Chemical Toxicology, 21, 453–462. 10.1016/0278-6915(83)90102-3 [DOI] [PubMed] [Google Scholar]
- Nishie K, Fiddler W and Pensabene JW, 1984. Comparison of the acute toxicities of N‐nitrosothiazolidine and N‐nitrosomorpholine. Journal of Toxicology and Environmental Health, 13, 595–608. 10.1080/15287398409530524 [DOI] [PubMed] [Google Scholar]
- Nixon JE, Sinnhuber RO, Lee DJ, Landers MK and Harr JR, 1974. Effect of cyclopropenoid compounds on the carcinogenic activity of diethylnitrosamine and aflatoxin B1 in rats. Journal of the National Cancer Institute, 53, 453–458. 10.1093/jnci/53.2.453 [DOI] [PubMed] [Google Scholar]
- Nixon JE, Wales JH, Scanlan RA, Bills DD and Sinnhuber RO, 1976. Null carcinogenic effect of large doses of nitrosoproline and nitrosohydroxyproline in Wistar rats. Food and Cosmetics Toxicology, 14, 133–135. [DOI] [PubMed] [Google Scholar]
- Nöthlings U, Wilkens LR, Murphy SP, Hankin JH, Henderson BE and Kolonel LN, 2005. Meat and fat intake as risk factors for pancreatic cancer: the multiethnic cohort study. Journal of the National Cancer Institute, 97, 1458–1465. [DOI] [PubMed] [Google Scholar]
- NTP (National Toxicology Program) , 1979. Bioassay of N‐nitrosodiphenylamine for possible carcinogenicity. National Cancer Institute Carcinogenesis Technical Report Series, 164, 1–23. [PubMed] [Google Scholar]
- Oberemm A, Ahr HJ, Bannasch P, Ellinger‐Ziegelbauer H, Glückmann M, Hellmann J, Ittrich C, Kopp‐Schneider A, Kramer PJ, Krause E and Kröger M, 2009. Toxicogenomic analysis of N‐nitrosomorpholine induced changes in rat liver: comparison of genomic and proteomic responses and anchoring to histopathological parameters. Toxicology and Applied Pharmacology, 241, 230–245. [DOI] [PubMed] [Google Scholar]
- Ohshima H, Béréziat JC and Bartsch H, 1982. Monitoring N‐nitrosamine acids excreted in the urine and feces of rats as an index for endogenous nitrosation. Carcinogenesis, 3, 115–120. [DOI] [PubMed] [Google Scholar]
- Ohshima H, O'Neill IK, Friesen M, Béréziat JC and Bartsch H, 1984. Occurrence in human urine of new sulphur‐containing N‐nitrosamino acids N‐nitrosothiazolidine 4‐carboxylic acid and its 2‐methyl derivative, and their formation. Journal of Cancer Research and Clinical Oncology, 198, 121–128. [DOI] [PubMed] [Google Scholar]
- Okada N, Honda A, Kawabata M and Yajima N, 1997. Sodium phenobarbital‐enhanced mutation frequency in the liver DNA of lacZ transgenic mice treated with diethylnitrosa‐ mine. Mutagenesis, 12, 179–184. [DOI] [PubMed] [Google Scholar]
- Okada M, 1984. Comparative metabolism of N‐nitrosamines in relation to their organ and species specificity. In: O'Neill JK, Von Borstel RC, Miller CT, Long J and Bartsch H (eds). N‐Nitroso compounds: occurrence, biological effects and relevance to human cancer. IARC Scientific Publications No. 57. International Agency for Research on Cancer, Lyon. pp. 401–409. [PubMed] [Google Scholar]
- Okajima E, Hiramatsu T, Motomiya Y, Iriya K and Ijuin M, 1971. Effect of DL‐tryptophan on tumorigenesis in the urinary bladder and liver of rats treated with N‐nitrosodibutylamine. GANN. Japanese Journal of Cancer Research, 62, 163‐9_2. [PubMed] [Google Scholar]
- Okazaki O, Persmark M and Guengerich FP, 1993. N‐nitroso‐N‐methylvinylamine: reaction of the epoxide with guanyl and adenyl moieties to yield adducts derived from both parts of the molecule. Chemical Research in Toxicology, 6, 168–173. [DOI] [PubMed] [Google Scholar]
- Oliveira CP, Gloria MBA, Barbour JF and Scanlan RA, 1995. Nitrate, nitrite, and volatile nitrosamines in whey containing food products. Journal of Agricultural and Food Chemistry, 43, 967–969. [Google Scholar]
- Özbay S and Şireli UT, 2022. The effect of ascorbic acid, storage period and packaging material on the formation of volatile N‐nitrosamine in sausages. Journal of Food Science and Technology, 59, 1823–1830. [DOI] [PMC free article] [PubMed] [Google Scholar]
- Ozel MZ, Gongus F, Yagci S, Hamilton JF and Lewis AC, 2010. Determination of volatile Nitrosamines in various meat products using comprehensive Gas Chromatography‐Nitrogen Chemiluminescence Detection. Food and Chemical Toxicology, 48, 3268–3273. [DOI] [PubMed] [Google Scholar]
- Palladino GF, Chung FL and Hecht SS, 1986. 3‐(2‐Deoxy‐ß‐D‐erythropentofuranosyl)‐6,7‐dihydro‐6,7‐dihydroxyimidazo[1,2‐a]purin‐9(3H)‐one, a major deoxyguanosine adduct formed from a novel diazohydroxide product of α‐hydroxylation of the carcinogen N‐nitrosomorpholine. Journal of the American Chemical Society, 108, 6066–6068. [DOI] [PubMed] [Google Scholar]
- Palli D, Saieva C, Coppi C, Del Giudice G, Magagnotti C, Nesi G, Orsi F and Airoldi L, 2001. O6‐alkylguanines, dietary N‐nitroso compounds, and their precursors in gastric cancer. Nutritional Cancer, 39, 42–49. [DOI] [PubMed] [Google Scholar]
- Park JE, Seo JE, Lee JY and Kwon H, 2015. Distribution of seven N‐nitrosamines in food. Toxicology Research, 31, 9–288. [DOI] [PMC free article] [PubMed] [Google Scholar]
- Park KK and Archer MC, 1978. Microsomal metabolism of N‐Nitrosodi‐n‐Propylamine: formation of products resulting from α‐ and ß‐Oxidation. Chemico‐Biological Interactions, 22, 83–90. [DOI] [PubMed] [Google Scholar]
- Pedersen E and Meyland I, 1981. Nitrate, nitrite, and volatile nitrosamines in pickled fish prepared with addition of nitrate. Zeitschrift für Lebensmitteluntersuchung und ‐Forschung A, 173, 359–361. [Google Scholar]
- Pegg AE, 1980. Metabolism of N‐nitrosodimethylamine. IARC Scientific Publications, 27, 3–22. [PubMed] [Google Scholar]
- Pegg AE, 2011. Multifaceted roles of alkyltransferase and related proteins in DNA repair, DNA damage, resistance to chemotherapy, and research tools. Chemical Research in Toxicology, 24, 618–639. [DOI] [PMC free article] [PubMed] [Google Scholar]
- Pegg AE and Perry W, 1981. Alkylation of nucleic acids and metabolism of small doses of dimethylnitrosamine in the rat. Cancer Research, 41, 3128–3132. [PubMed] [Google Scholar]
- Pegg AE, Roberfroid M, von Bahr C, Foote RS, Mitra S, Bresil H, Likhachev A and Montesano R, 1982. Removal of O6‐methylguanine from DNA by human liver fractions. Proceedings of the National Academy of Sciences of the United States of America, 79, 5162–5165. 10.1073/pnas.79.17.5162 [DOI] [PMC free article] [PubMed] [Google Scholar]
- Pensabene JW and Fiddler W, 1993. Effect of carbohydrate cryoprotecting agents on the formation of n‐nitrosodimethylamw in surimi‐meat frankfurters. Journal of Food Safety, 13, 125–132. [Google Scholar]
- Peterson LA, 2017. Context matters: contribution of specific DNA adducts to the genotoxic properties of the tobacco‐specific nitrosamine NNK. Chemical Research in Toxicology, 30, 420–433. [DOI] [PMC free article] [PubMed] [Google Scholar]
- Peto R, Pike MC, Bernstein L, Gold LS and Ames BN, 1984. The TD50: a proposed general convention for the numerical description of the carcinogenic potency of chemicals in chronic‐exposure animal experiments. Environmental Health Perspectives, 58, 1–8. 10.1289/ehp.84581 [DOI] [PMC free article] [PubMed] [Google Scholar]
- Peto R, Gray R, Brantom P and Grasso P, 1991a. Effects on 4080 rats of chronic ingestion of N‐nitrosodiethylamine or N‐nitrosodimethylamine: a detailed dose‐response study. Cancer Research, 51, 6415–6451. [PubMed] [Google Scholar]
- Peto R, Gray R, Brantom P and Grasso P, 1991b. Dose and time relationships for tumor induction in the liver and esophagus of 4080 inbred rats by chronic ingestion of N‐nitrosodiethylamine or N‐nitrosodimethylamine. Cancer Research, 51(23 Pt 2), 6452–6469. [PubMed] [Google Scholar]
- Pobel D, Riboli E, Cornée J, Hémon B and Guyader M, 1995. Nitrosamine, nitrate and nitrite in relation to gastric cancer: a case‐control study in Marseille, France. European Journal of Epidemiology, 11, 67–73. [DOI] [PubMed] [Google Scholar]
- Pottegård A, Kristensen KB, Ernst MT, Johansen NB, Quartarolo P and Hallas J, 2018. Use of N‐nitrosodimethylamine (NDMA) contaminated valsartan products and risk of cancer: Danish nationwide cohort study. BMJ, 362, k3851. [DOI] [PMC free article] [PubMed] [Google Scholar]
- Pound AW and Lawson TA, 1975. Partial hepatectomy and toxicity of dimethyl‐nitrosamine and carbon tetrachloride, in relation to the carcinogenic action of dimethylnitrosamine. British Journal of Cancer, 32, 596–603. 10.1038/bjc.1975.266 [DOI] [PMC free article] [PubMed] [Google Scholar]
- Pour P, Krüger FW, Cardesa A, Althoff J and Mohr U, 1973. Carcinogenic effect of di‐n‐propylnitrosamine in Syrian golden hamsters. Journal of the National Cancer Institute, 51, 1019–1027. 10.1093/jnci/51.3.1019 [DOI] [PubMed] [Google Scholar]
- Pour P, Cardesa A, Althoff J and Mohr U, 1974. Tumorigenesis in the nasal olfactory region of Syrian golden hamsters as a result of dipropylnitrosamine and related compounds. Cancer Research, 34, 16–26. [PubMed] [Google Scholar]
- Povey AC, Hall CN, Cooper DP, O'Connor PJ and Margison GP, 2000. Determinants of O6‐alkylguanine‐DNA alkyltransferase activity in normal and tumour tissue from human colon and rectum. International Journal of Cancer, 85, 68–72. [DOI] [PubMed] [Google Scholar]
- Preussmann R, Schmähl D and Eisenbrand G, 1977. Carcinogenicity of N‐nitrosopyrrolidine: Dose‐response study in rats. Zeitschrift für Krebsforschung und Klinische Onkologie, 90, 161–166. [DOI] [PubMed] [Google Scholar]
- Preussmann R and Stewart BW, 1984. N‐Nitroso carcinogens. In: Searle CE (ed). Chemical Carcinogens. 2nd edn, ACS Monograph 182. American Chemical Society, Washington, DC. pp. 643–828. [Google Scholar]
- Pylypiw HM, Zubroff JR, Magee PN and Harrington GW, 1984. The metabolism of N‐nitrosomethylaniline. Journal of Cancer Research and Clinical Oncology, 108, 66–70. [DOI] [PubMed] [Google Scholar]
- Qajarbeygi P, Ahmadi M, Hoseini AH, Poorasl AM, Mahmoudi R and Ataee M, 2015. Evaluation of N‐Nitrosamine formation in routine potato cooking. Biotechnology and Health Sciences, 2, e29887. [Google Scholar]
- Qiu Y, Chen JH, Yu W, Wang P, Rong M and Deng H, 2017. Contamination of Chinese salted fish with volatile N‐nitrosamines as determined by QuEChERS and gas chromatography‐tandem mass spectrometry. Food Chemistry, 232, 763–769. [DOI] [PubMed] [Google Scholar]
- Rajewsky MF, Dauber W and Frankenbert H, 1966. Liver carcinogenesis by diethylnitrosamine in the rat. Science, 152, 83–85. [DOI] [PubMed] [Google Scholar]
- Rajewsky MF and Dauber W, 1970. Distribution of bound tritium from 3 H‐diethylnitrosamine in rat tissues. International Journal of Cancer, 5, 389–393. [DOI] [PubMed] [Google Scholar]
- Rayman MP and Challis BC, 1975. Oxidation of n‐nitrosopiperidine in the Udenfriend model system and its metabolism by rat‐liver microsomes. Biochemxal Pharmacology, 24, 621–626. [DOI] [PubMed] [Google Scholar]
- Ramezani H, Hosseini H, Kamankesh M, Ghasemzadeh‐Mohammadi V and Mohammadi A, 2015. Rapid determination of nitrosamines in sausage and salami using microwave‐assisted extraction and dispersive liquid–liquid microextraction followed by gas chromatography–mass spectrometry. European Food Research and Technology, 240, 441–450. [Google Scholar]
- Ramirez‐Guizar S, González‐Alatorre G, Pérez‐Pérez MCI, Piñeiro‐García A and Lona‐Ramírez FJ, 2020. Identification and quantification of volatile toxic compounds in tequila. Journal of Food Measurement and Characterization, 14, 2059–2066. [Google Scholar]
- Raineri R, Poiley JA, Andrews AW, Pienta RJ and Lijinsky W, 1981. Greater effectiveness of hepatocyte and liver S9 preparations from hamsters than rat preparations in activating,V nitroso compounds to metabolites mutagenic to Salmonella. Journal of the National Cancer Institute, 67, 1117–1122. [PubMed] [Google Scholar]
- Rapp HJ, Carleton JH, Crisler C and Nadel EM, 1965. Induction of malignant tumors in the rabbit by oral administration of diethylnitrosamine. Journal of the National Cancer Institute, 34, 453–458. [PubMed] [Google Scholar]
- Renner E, 2012. Nutritional aspects of cheese. In: Fox PF (ed). Cheese: Chemistry, Physics and Microbiology: Volume 1 General Aspects. Springer, Berlin. pp. 572. [Google Scholar]
- Reuber MD and Lee CW, 1968. Effect of age and sex on hepatic lesions in Buffalo strain rats ingesting diethylnitrosamine. Journal of the National Cancer Institute, 41, 1133–1140. [PubMed] [Google Scholar]
- Reuber MD, 1975. Carcinomas of the esophagus in rats ingesting diethylnitrosamine. European Journal of Cancer, 11, 97–99. 10.1016/0014-2964(75)90185-1 [DOI] [PubMed] [Google Scholar]
- Reznik G, Mohr U and Krueger FW, 1975. Carcinogenic effects of dipropylnitrosamine, betahydroxypropylpropylnitrosamine, and methylpropylnitrosamine on Sprague‐Dawley rats. Journal of the National Cancer Institute, 54, 937–943. [PubMed] [Google Scholar]
- Reznik G, Mohr U and Kmoch N, 1976. Carcinogenic effects of different nitroso‐compounds in Chinese hamsters. I. Dimethylnitrosamine and N‐diethylnitrosamine. British Journal of Cancer, 33, 411–418. [DOI] [PMC free article] [PubMed] [Google Scholar]
- Ribeiro Pinto LF, 2000. Differences between isoamyl alcohol and ethanol on the metabolism and DNA ethylation of N‐nitrosodiethylamine in the rat. Toxicology, 26, 73–79. 10.1016/s0300-483x(00)00297-3 [DOI] [PubMed] [Google Scholar]
- Ribeiro Pinto LF, Moraes E, Albano RM, Silva MC, Godoy W, Glisovic T and Lang MA, 2001. Rat oesophageal cytochrome P450 (CYP) monooxygenase system: comparison to the liver and relevance in N‐nitrosodiethylamine carcinogenesis. Carcinogenesis, 22, 1877–1883. 10.1093/carcin/22.11.1877 [DOI] [PubMed] [Google Scholar]
- Richter E, Schulze J and Zwickenpflug W, 1987. Extrahepatic microsomal metabolism of N‐nitrosodi‐n‐butylamine in rats. IARC Scientific Publications, 84, 156–158. [PubMed] [Google Scholar]
- Richter E, Richter‐Cooberg U, Feng X, Schulze J and Wiessler M, 1986. Intestinal metabolism of nitrosamines. 1. Transport and metabolism of six nitrosamines in isolated perfused rat small intestinal segments. Carcinogenesis, 7, 1207–1213. 10.1093/carcin/7.7.1207 Erratum in: Carcinogenesis, 1986 Oct, 7, 10, 1791 [DOI] [PubMed] [Google Scholar]
- Richter E, Zwickenpflug W and Wiessler M, 1988. Intestinal first‐pass metabolism of nitrosamines. 2. Metabolism of N‐nitrosodibutylamine in isolated perfused rat small intestinal segments. Carcinogenesis, 9, 499–506. 10.1093/carcin/9.3.499 [DOI] [PubMed] [Google Scholar]
- Risch HA, Jain M, Choi NW, Fodor JG, Pfeiffer CJ, Howe GR, Harrison LW, Craib KJ and Miller AB, 1985. Dietary factors and the incidence of cancer of the stomach. American Journal of Epidemiology, 122, 947–959. [DOI] [PubMed] [Google Scholar]
- Roasa J, Liu H and Shao S, 2019. An optimized, HS‐SPME‐GC‐MS method for the detection of volatile nitrosamines in meat samples. Food Additives and Contaminants, Part A, 36, 396–404. [DOI] [PubMed] [Google Scholar]
- Rogers MA, Vaughan TL, Davis S and Thomas DB, 1995. Consumption of nitrate, nitrite, and nitrosodimethylamine and the risk of upper aerodigestive tract cancer. Cancer Epidemiology, Biomarkers and Prevention: A Publication of the American Association for Cancer Research, cosponsored by the American Society of Preventive Oncology, 4, 29–36. [PubMed] [Google Scholar]
- Rossman TG, Molina M, Meyer L, Boone P, Klein CB, Wang Z, Li F, Lin WC and Kinney PL, 1991. Performance of 133 compounds in the lambda prophage induction endpoint of the Microscreen assay and a comparison with S. typhimurium mutagenicity and rodent carcinogenicity assays Mutation Research/Genetic. Toxicology, 260, 349–367. [DOI] [PubMed] [Google Scholar]
- Roszczenko A, Jabłoński J and Moniuszko‐Jakoniuk J, 1996. Effect of n‐nitrosodimethylamine (NDMA) on activity of selected enzymes in blood serum of the rat. Medycyna Pracy, 47, 49–53. [PubMed] [Google Scholar]
- Rothfuss A, O'Donovan M, De Boeck M, Brault D, Czich A, Custer L, Hamada S, Plappert‐Helbig U, Howe J, Kraynak AR, van der Leede B‐J, Nakajima M, Priestley C, Thybaud V, Saigo K, Sawant S, Shi J, Storer R, Struwe M, Vasquez M, Vock E and Galloway S, 2010. Collaborative study on 15 compounds in the rat liver Comet Assay integrated into 2‐ and 4‐week repeat‐dose studies. Mutation Research, 702, 40–69. [DOI] [PubMed] [Google Scholar]
- Rywotycki R, 2002. The effect of selected functional additives and heat treatment on nitrosamine content in pasteurized pork ham. Meat Science, 60, 335–339. [DOI] [PubMed] [Google Scholar]
- Sannino A and Bolzoni L, 2013. GC/CI‐MS/MS method for the identification and quantification of volatile N‐nitrosamines in meat products. Food Chemistry, 141(4), 3925–3930. [DOI] [PubMed] [Google Scholar]
- Sawada S, Yamanaka T, Yamatsu K, Furihata C and Matsushima T, 1991. Chromosome aberrations, micronuclei and sister‐chromatid exchanges (SCEs) in rat liver induced in vivo by hepatocarcinogens including heterocyclic amines. Mutation Research, 251, 59–69. [DOI] [PubMed] [Google Scholar]
- Sawyer DR and Marvin AF, 1974. Effect on nitrosarcosine on body weight, mortality and carcinogenicity in mice. Pathology, 2172–2177. [Google Scholar]
- Scanlan RA, Barbour JF, Bodyfelt FW and Libbey LM, 1994. N‐Nitrosodimethylamine in Nonfat Dry Milk. In: Loeppky RN and Michejda CJ (eds). Nitrosamines and related N‐Nitroso compounds, Chemistry and Biochemistry. ACS Symposium Series Vol. 553. American Chemical Society, Washington, DC. pp. 34–41. [Google Scholar]
- SCCS (Scientific Committee on Consumer Safety) , Opinion on Nitrosamines and Secondary Amines in Cosmetic Products, 27 March 2012.
- Shank RC and Newberne PM, 1976. Dose‐response study of the carcinogenicity of dietary sodium nitrite and morpholine in rats and hamsters. Food and Cosmetics Toxicology, 14, 1–8. [DOI] [PubMed] [Google Scholar]
- Scheeren MB, Sabik H, Gariépy C, Terra NN and Arul J, 2015. Determination of N‐nitrosamines in processed meats by liquid extraction combined with gas chromatography‐methanol chemical ionisation/mass spectrometry. Food Additives and Contaminants Part A, 32, 1436–1447. [DOI] [PubMed] [Google Scholar]
- Scheper T, Appel KE, Schunack W, Somogyi A and Hildebrandt AG, 1991. Metabolic denitrosation of N‐nitroso‐N‐methylaniline: detection of amine‐metabolites. Chemico‐Biological Interactions, 77, 81–96. 10.1016/0009-2797(91)90007-t [DOI] [PubMed] [Google Scholar]
- Scherf HR and Schmahl D, 1975. Experimental investigations on immunodepressive properties of carcinogenic substances in male Sprague‐Dawley rats. The Ambivalence of Cytostatic Therapy, 52, 76–87. [DOI] [PubMed] [Google Scholar]
- Schmähl D, Thomas C and Konig K, 1963. Liver cancer‐inducing effect of diethylnitrosamine after rectal administration in rats. Zeitschrift für Krebsforschung, 65, 529–530. (German) [PubMed] [Google Scholar]
- Schmähl D and Thomas C, 1965. Dose‐response relationships in the production of hemangioendothelioma of the liver in mice by diethylnitrosamine. Journal of Cancer Research and Clinical Oncology, 66, 533–535. [Google Scholar]
- Schmähl D and Thomas C, 1965. Erzeugung von Leberkrebs beim Kaninchen durch Diäthylnitrosamin. Naturwissenschaften, 52, 165. [DOI] [PubMed] [Google Scholar]
- Schmähl D, Osswald H and Mohr U, 1967. Hepatotoxische und cancerogeneWirkung von Diäthylnitrosamin bei Schweinen [Hepatotoxic and carcinogenic effect of diethylnitrosamine in swine]. Naturwissenschaften, 54, 341. (German). 10.1007/BF00621459 [DOI] [PubMed] [Google Scholar]
- Schmähl D, Osswald H and Goerttler K, 1969. Cancerogene Wirkung von Diäthylnitrosamin bei Schweinen. Zeitschrift für Krebsforschung, 72, 102–104. [PubMed] [Google Scholar]
- Schmähl D, 1976. Investigations on esophageal carcinogenicity by methylphenyl‐nitrosamine and ethyl alcohol in rats. Cancer Letters, 1, 215–218. [DOI] [PubMed] [Google Scholar]
- Schmähl D, Habs M and Ivankovic S, 1978. Carcinogenesis of N‐nitrosodiethylamine (DENA) in chickens and domestic cats. International Journal of Cancer, 22, 552–557. 10.1002/ijc.2910220508 [DOI] [PubMed] [Google Scholar]
- Schmezer P, Poll BL, Lefevre PA, Callander RD, Ratpan F, Tinwell H and Ashby J, 1990. Assay‐specific genotoxicity of N‐nitrosodibenzylamine to the rat liver in vivo. Environmental and Molecular Mutagenesis, 15, 190–197. [DOI] [PubMed] [Google Scholar]
- Schoental R, Gough TA and Webb KS, 1974. Carcinogens in rat milk. Transfer of ingested diethylnitrosamine into milk by lactating rats. Br J Cancer., 30, 238–240. 10.1038/bjc.1974.187 [DOI] [PMC free article] [PubMed] [Google Scholar]
- Sekihashi K, Sasaki T, Yamamoto Y, Kawamura K, Ikka T, Tsuda S and Sasaki YF, 2001. A comparison of intraperitoneal and oral gavage administration in comet assay in mouse eight organs. Mutation Research, 493, 39–54. [DOI] [PubMed] [Google Scholar]
- Sekihashi K, Yamamoto A, Matsumura Y, Ueno S, Watanabe‐ Akanuma M, Kassie F, Knasmüller S, Tsuda S and Sasaki YF, 2002. Comparative investigation of multiple organs of mice and rats in the comet assay. Mutation Research, 517, 53–74. [DOI] [PubMed] [Google Scholar]
- Sen NP, Donaldson B, Seaman S, Iyengar JR and Miles WF, 1976. Inhibition of nitrosamine formation in fried bacon by propyl gallate and L‐ascorbyl palmitate. Journal of Agricultural and Food Chemistry, 24, 397–401. [DOI] [PubMed] [Google Scholar]
- Sen NP, Seaman S, Clarkson S, Garrod F and Lalonde P, 1984. Volatile N‐nitrosamines in baby bottle rubber nipples and pacifiers. Analysis, occurrence and migration. IARC Scientific Publications, 57, 51–57. [PubMed] [Google Scholar]
- Sen NP, Seaman S and Tessier L, 1982. A rapid and sensitive method for the determination of non‐volatile N‐nitroso compounds in foods and human urine: recent data concerning volatile N‐nitrosamines in dried foods and malt‐based beverages. IARC Scientific Publications, 41, 185–197. [PubMed] [Google Scholar]
- Seo JE, Park JE, Lee JY and Kwon H, 2016. Determination of seven N‐nitrosamines in agricultural food matrices using GC‐PCI‐MS/MS. Food Analytical Methods, 9, 1595–1605. [Google Scholar]
- Shah AS, Sarode AV and Bhide SV, 1985. Experimental studies on mutagenic and carcinogenic effects of tobacco chewing. Journal of Cancer Research and Clinical Oncology, 109, 203–207. [DOI] [PubMed] [Google Scholar]
- Shahidi F, Pegg RB and Sen NP, 1994. Absence of volatile N‐nitrosamines in cooked nitrite‐free cured muscle foods. Meat Science, 37, 327–336. [DOI] [PubMed] [Google Scholar]
- Shahidi F, Synowiecki J and Sen NP, 1995. N‐Nitrosamines in nitrite‐cured chicken‐seal salami. Journal of Food Protection, 58, 446–447. [DOI] [PubMed] [Google Scholar]
- Shane BS, Smith‐Dunn DL, de Boer JG, Glickman BW and Cunningham ML, 2000. Mutant frequencies and mutation spectra livers of Big Blue transgenic mice. Mutation Research, 452, 197–210. [DOI] [PubMed] [Google Scholar]
- Shao X, Zhu M, Zhang Z, Huang P, Xu B, Chen C and Li P, 2021. N‐nitrosodimethylamine reduction by Lactobacillus pentosus R3 in fermented cooked sausages. Food Control, 124, 107869. [Google Scholar]
- Sheweita SA, El Banna YY, Balbaa M, Abdullah IA and Hassan HE, 2017. N‐nitrosamines induced infertility and hepatotoxicity in male rabbits. Environmental Toxicology, 32, 2212–2220. [DOI] [PubMed] [Google Scholar]
- Shi J, Krsmanovic L, Bruce S, Kelly T, Paranjpe M, Szabo K, Arevalo M, Atta‐Safoh S, Debelie F, LaForce MK, Sly J and Springer S, 2011. Assessment of genotoxicity induced by 7,12‐dimethylbenz(a)anthracene or diethylnitrosamine in the Pig‐a, micronucleus and Comet assays integrated into 28‐day repeat dose studies. Environmental and Molecular Mutagenesis, 52, 711–720. [DOI] [PubMed] [Google Scholar]
- Shu L and Hollenberg PF, 1996. Identification of the cytochrome P450 isozymes involved in the metabolism of N‐nitrosodipropyl‐, N‐nitrosodibutyl‐ and N‐nitroso‐n‐butyl‐n‐propylamine. Carcinogenesis, 17, 839–848. [DOI] [PubMed] [Google Scholar]
- Shu L and Hollenberg PF, 1997. Alkylation of cellular macromolecules and target specificity of carcinogenic nitrosodialkylamines: metabolic activation by cytochromes P450 2B1 and 2E1. Carcinogenesis, 18, 801–810. [DOI] [PubMed] [Google Scholar]
- Śmiechowska M, Przybyłowski P and Kowalski B, 1994. Study of formation of volatile N‐nitrosoamines in zulaw, gouda and edam cheese. Polish Journal of Food and Nutrition Sciences, 3, 71–80. [Google Scholar]
- Song PJ and Hu JF, 1988. N‐Nitrosamines in Chinese foods. Food and Chemical Toxicology, 26, 205–208. [DOI] [PubMed] [Google Scholar]
- Song IH, Kim WJ, Jo C, Ahn HJ, Kim JH and Byun MW, 2003. Effect of modified atmosphere packaging and irradiation in combination on content of nitrosamines in cooked Pork Sausage. Journal of Food Protection, 66, 1090–1094. [DOI] [PubMed] [Google Scholar]
- Souliotis VL, van Delft JH, Steenwinkel MJ, Baan RA and Kyrtopoulos SA, 1998. DNA adducts, mutant frequencies and mutation spectra in lambda lacZ transgenic mice treated with N‐nitrosodimethylamine. Carcinogenesis, 19, 731–739. [DOI] [PubMed] [Google Scholar]
- Spiegelhalder B and Preussmann R, 1984. In‐vivo formation of N‐nitrosodimethylamine in humans after amidopyrine intake. IARC scientific publications, 57, 179–183. [PubMed] [Google Scholar]
- Spielhoff R, Bresch H, Hönig M and Mohr U, 1974. Milk as transport agent for diethylnitrosamine in Syrian golden hamsters. Journal of the National Cancer Institute, 53, 281–282. [DOI] [PubMed] [Google Scholar]
- Stasiuk E and Przybyłowski P, 2006. The impact of the modified method of using KNO3 on the formation of volatile N‐nitrosamines in Gouda cheese. Polish Journal of Food and Nutrition Sciences, 58, 457–461. [Google Scholar]
- Stewart BW, Hicks RM and Magee PN, 1975. Acute biochemical and morphological effects of N‐nitrosomorpholine in comparison to dimethyl‐ and diethylnitrosamine. Chemico‐Biological Interactions, 11, 413–429. 10.1016/0009-2797(75)90009-5 [DOI] [PubMed] [Google Scholar]
- Stiborova M, Hansikova H and Frei E, 1996. Cytochromes P450 2B1 and P450 2B2 demethylate N‐nitrosodimethylamine and N‐nitrosomethylaniline in vitro. General Physiology and Biophysics, 15, 211–223. [PubMed] [Google Scholar]
- Stiborova M, Hansikova H, Schmeiser HH and Frei E, 1997. An investigation of the metabolism of N‐nitrosodimethylamine and N‐nitrosomethylaniline by horseradish peroxidase in vitro . General Physiology and Biophysics, 16, 285–297. [PubMed] [Google Scholar]
- Stoltz DR and Sen NP, 1977. Mutagenicity of five cyclic N‐Nitrosamines: assay With Salmonella typhimurium. Journal of the National Cancer Institute, 58, 393–394. [DOI] [PubMed] [Google Scholar]
- Stoner GD, Chen T, Kresty LA, Aziz RM, Reinemann T and Nines R, 2006. Protection against esophageal cancer in rodents with lyophilized berries: potential mechanisms. Nutrition and Cancer, 54, 33–46. [DOI] [PMC free article] [PubMed] [Google Scholar]
- Streeter AJ, Nims RW, Anderson LM, Heur YH, von Hofe E, Kleihues P, Nelson VC, Mico BA and Keefer LK, 1990a. Single‐dose toxicokinetics of N‐nitrosomethylethylamine and N‐nitrosomethyl(2,2,2‐trideuterioethyl)amine in the rat. Archives of Toxicology, 64, 109–115. [DOI] [PubMed] [Google Scholar]
- Streeter AJ, Nims RW, Sheffels PR, Heur YH, Yang CS, Mico BA, Gombar CT and Keefer LK, 1990b. Metabolic denitrosation of N‐nitrosodimethylamine in vivo in the rat. Cancer Research, 50, 1144–1150. [PubMed] [Google Scholar]
- Streeter AJ, Nims RW, Wu PP and Logsdon DL, 1990c. Toxicokinetics of N‐nitrosodimethylamine in the Syrian Golden hamster. Archives of Toxicology, 64, 562–566. [DOI] [PubMed] [Google Scholar]
- Strombeck DR, Harrold D, Rogers Q, Wheeldon E, Stern J and Schaeffer M, 1983. Plasma amino acid, glucagon, and insulin concentrations in dogs with nitrosamine‐induced hepatic disease. American Journal of Veterinary Research, 44, 2028–2036. [PubMed] [Google Scholar]
- Stuff JE, Goh ET, Barrera SL, Bondy ML and Forman MR, 2009. Construction of an N‐nitroso database for assessing dietary intake. Journal of Food Composition and Analysis, 22(Suppl. 1), S42–S47. [DOI] [PMC free article] [PubMed] [Google Scholar]
- Sulc M, Hodek P and Stiborova M, 2010. The binding affinity of carcinogenic N‐nitrosodimethylamine and N‐nitrosomethylaniline to cytochromes P450 2B4, 2E1 and 3A6 does not dictate the rate of their enzymatic N‐demethylation. General Physiology and Biophysics, 29, 175–185. [DOI] [PubMed] [Google Scholar]
- Sulc M, Kubickova B, Maslova V and Hodek P, 2004. Rabbit liver microsomal system: study of interaction with two model N‐nitrosamines and their metabolism. General Physiology and Biophysics, 23, 423–433. [PubMed] [Google Scholar]
- Sumi Y and Miyakawa M, 1983. Susceptibility of germ‐free rats to the hepatotoxic effects of dimethylnitrosamine or dimethylamine plus sodium nitrite administered orally. Cancer Research, 43, 2942–2946. [PubMed] [Google Scholar]
- Sung N‐J, Klausner KA and Hotchkiss JH, 1991. Influence of nitrate, ascorbic acid, and nitrate reductase microorganisms on N‐nitrosamine formation during Korean‐style soy sauce fermentation. Food Additives and Contaminants, 8, 291–298. [DOI] [PubMed] [Google Scholar]
- Suzuki E and Okada M, 1980. Metabolic fate of N‐butyl‐N‐(4‐hydroxybutyl)nitrosamine in the rat. Gan, 71, 856–862. [PubMed] [Google Scholar]
- Suzuki E, Aoki J and Okada M, 1981. Metabolic fate of N‐butyl‐N‐(4‐hydroxybutyl) nitrosamine and N, N‐dibutylnitrosamine in the guinea pig, with reference to their carcinogenic effects on the urinary bladder. Gan, 72, 547–551. [PubMed] [Google Scholar]
- Suzuki E and Okada M, 1981. Metabolic fate of N,N‐dipropylnitrosamine and N,N‐diamylnitrosamine in the rat in relation to their lack of carcinogenic effect o he urinary bladder. Gan, 72, 552–561. [PubMed] [Google Scholar]
- Suzuki H, Ikeda N, Kobayashi K, Terashima Y, Shimada Y, Suzuki T, Hagiwara T, Hatakeyama S, Nagaoka K, Yoshida J, Saito Y, Tanaka J and Hayashi M, 2005. Evaluation of liver and blood micronucleus assays with 9 chemicals using young rats: a study by the Collaborative Study Group for the Micronucleus Test (CSGMT)/Japanese Environmental Mutagen Society (JEMS)/Mammalian Mutagenicity Study Group (MMS). Mutation Research, 583, 133–145. [DOI] [PubMed] [Google Scholar]
- Suzuki T, Itoh S, Nakajima M, Hachiya N and Hara H, 1999. Target organ and time‐course in the mutagenicity of five carcinogens in MutaeMouse: a summary report of the second collaborative study of the transgenic mouse mutation assay by JEMS/MMS. Mutation Research, 444, 259–268. [DOI] [PubMed] [Google Scholar]
- Suzuki T, Itoh T, Hayashi M, Nishikawa Y, Ikezaki S, Furukawa F, Takahashi M and Sofuni T, 1996. Organ variation in the mutagenicity of dimethylnitrosamine in Big Blue mice. Environmental and Molecular Mutagenesis, 28, 348–353. [DOI] [PubMed] [Google Scholar]
- Sydow G, 1970. Transplacental teratogenic, carcinogenic and mutagenic effect of diethylnitrosamine (DENA) following oral administration in rats. Archiv fur Geschwulstforschung, 36, 331–334. [PubMed] [Google Scholar]
- Sykora I, Tretinik P and Vortel V, 1985. Postnatal carcinogenic study of dimethylnitrosamine in rats. Neoplasma, 32, 63–72. [PubMed] [Google Scholar]
- Swann PF, Coe AM and Mace R, 1984. Ethanol and dimethylnitrosamine and diethylnitrosamine metabolism and disposition in the rat. Possible relevance to the influence of ethanol on human cancer incidence. Carcinogenesis, 5, 1337–1343. [DOI] [PubMed] [Google Scholar]
- Swann PF, Graves RJ and Mace R, 1987. Effect of ethanol on nitrosamine metabolism and distribution: implications for the role of nitrosamines in human cancer and for the influence of alcohol consumption on cancer incidence. Mutation Research/Reviews in Genetic Toxicology, 186, 261–267. [DOI] [PubMed] [Google Scholar]
- Schwarz M, Appel KE, Schrenk D and Kunz W, 1980. Journal of Cancer Research and Clinical Oncology, 97, 233–240. 10.1007/BF00405774 [DOI] [PubMed] [Google Scholar]
- Takasawa H, Suzuki H, Ogawa I, Shimada Y, Kobayashi K, Terashima Y, Matsumoto H, Oshida K, Ohta R, Imamura T, Miyazaki A, Kawabata M, Minowa S, Maeda A and Hayashi M, 2010. Evaluation of a liver micronucleus assay in young rats (IV): a study using a double‐dosing/single‐sampling method by the Collaborative Study Group for the Micronucleus Test (CSGMT)/Japanese Environmental Mutagen Society (JEMS)–Mammalian Mutagenicity Study Group (MMS). Mutation Research, 698, 24–29. [DOI] [PubMed] [Google Scholar]
- Takayama S and Oota K, 1963. Malignant tumors induced in mice fed with n‐nitrosodimethylamine. Gan, 54, 465–472. [PubMed] [Google Scholar]
- Takayama S and Oota K, 1965. Induction of malignant tumors in various strains of mice by oral administration of n‐nitrosodimethylamine and n‐nitrosodiethylamine. Gan, 56, 189–199. [PubMed] [Google Scholar]
- Takayama S, 1969. Induction of tumors in ICR mice with N‐nitrosopiperidine, especially in forestomach. Naturwissenschaften, 56, 142. [DOI] [PubMed] [Google Scholar]
- Takayama S and Hitachi‐Masahito Yamada K, 1975. Histological and cytological studies on hepatocarcinogenesis in rats by administration of diethylnitrosamine. Gann Monograph on Cancer Research, 17, 343–354. [Google Scholar]
- Tannenbaum SR, 1980. A model for estimation of human exposure to endogenous N‐nitrosodimethylamine. Oncology, 37, 232–235. [DOI] [PubMed] [Google Scholar]
- Tannenbaum SR, Wishnok JS and Leaf CD, 1991. Inhibition of nitrosamine formation by ascorbic acid. The American Journal of Clinical Nutrition, 53, 247S–250S. [DOI] [PubMed] [Google Scholar]
- Teiber JF, Macé K and Hollenberg PF, 2001. Metabolism of the beta‐oxidized intermediates of N‐nitrosodi‐n‐propylamine: N‐nitroso‐beta‐hydroxypropylpropylamine and N‐nitroso‐beta‐oxopropylpropylamine. Carcinogenesis, 22, 499–506. 10.1093/carcin/22.3.499 [DOI] [PubMed] [Google Scholar]
- Terao K, Aikawa T and Kera K, 1978. A synergistic effect of nitrosodimethylamine on sterigmatocystin carcinogenesis in rats. Food and Cosmetics Toxicology, 16(6), 591–596. 10.1016/s0015-6264(78)80228-4 [DOI] [PubMed] [Google Scholar]
- Terashima Y, Yokoi R, Takakura I, Saitou E, Wako Y, Kawasako K, Souma S and Tamura T, 2015. Detection of micronuclei in hepatocytes isolated from young adult rats repeatedly treated with N‐nitrosodi‐n‐propylamine. Mutation Research, 780–781, 36–40. [DOI] [PubMed] [Google Scholar]
- Terracini B, Magee PN and Barnes JM, 1967. Hepatic pathology in rats on low dietary levels of dimethylnitrosamine. British Journal of Cancer, 21, 559. [DOI] [PMC free article] [PubMed] [Google Scholar]
- Terracini B, Palestro G, Gigliardi MR, Montesano G and Montesano R, 1966. Carcinogenicity of dimethylnitrosamine in Swiss mice. British Journal of Cancer, 20(4), 871–876. 10.1038/bjc.1966.100 [DOI] [PMC free article] [PubMed] [Google Scholar]
- Theiler RF, Sato K, Aspelund TG and Miller AF, 1981. Model system studies on N‐Nitrosamine formation in cured meats: the effect of curing solution ingredients. Journal of Food Science, 46, 996–998. [Google Scholar]
- Thomas P, Fugmann R, Aranyi C, Barbera P, Gibbons R and Fenters J, 1985. The effect of dimethylnitrosamine on host resistance and immunity. Toxicology and Applied Pharmacology, 77, 219–229. [DOI] [PubMed] [Google Scholar]
- Thomas R, Tennant RE, Oliveira AAF and Ponting DJ, 2022. What makes a potent nitrosamine? Statistical Validation of Expert‐Derived Structure‐Activity Relationships., 35, 1997–2013. [DOI] [PMC free article] [PubMed] [Google Scholar]
- Thorgeirsson UP, Dalgard DW, Reeves J and Adamson RH, 1994. Tumor incidence in a chemical carcinogenesis study of nonhuman primates. Regulatory Toxicology and Pharmacology, 19, 130–151. 10.1006/rtph.1013 [DOI] [PubMed] [Google Scholar]
- Thresher A, Gosling JP and Williams R, 2019. Generation of TD50 values for carcinogenicity study data. Toxicology Research, 25, 696–703. 10.1039/c9tx00118b [DOI] [PMC free article] [PubMed] [Google Scholar]
- Thresher A, Foster R, Ponting DJ, Stalford SA, Tennant RE and Thomas R, 2020. Are all nitrosamines concerning? A review of mutagenicity and carcinogenicity data. Regulatory Toxicology and Pharmacology, 116, 104749. [DOI] [PubMed] [Google Scholar]
- Trejo‐Martin A, Bercu JP, Thresher A, Tennant RE, Thomas RF, Cross K, Czich A, Waese K, Nicolette JJ, Murray J, Sonders P, Kondratiuk A, Cheung JR, Thomas D, Lynch A, Harvey J, Glowienke S, Custer L and Escobar PA, 2022. Use of the bacterial reverse mutation assay to predict carcinogenicity of N‐nitrosamines. Regulory Toxicology and Pharmacology, 135, 105247. [DOI] [PubMed] [Google Scholar]
- Tian Y, Du H, Wang L, Li S, Zhang L and Zhang L, 2020. Nitrite scavenging and inhibition of N‐Nitrosamines formation by phenolic extracts from Diospyros lotus L. Leaves. Natural Product Communications, 15, 1–8. [Google Scholar]
- Tiedink HG, Daviews JAR and van Broekhoven LV, 1988. Formation of mutagenic N‐nitroso compounds in vegetable extracts upon nitrite treatment: a comparison with the glucosinolate content. Food and Chemical Toxicology, 26, 947–954. [DOI] [PubMed] [Google Scholar]
- Tiedink HGM, 1991. Occurrence of indole compounds in some vegetables: toxicological implications of nitrosation with emphasis on mutagenicity. Wageningen University and Research. [Google Scholar]
- Tinwell H, Lefevre PA and Ashby J, 1994. Response of the Muta mouse lacZ/galE‐transgenic mutation assay to DMN: comparisons with the corresponding Big Blue (lacI) responses. Mutation Research, 307, 169–173. [DOI] [PubMed] [Google Scholar]
- Tomatis L, Magee PN and Shubik P, 1964. Induction of liver tumors in the Syrian golden hamster by feeding dimethylnitrosamine. Journal of the National Cancer Institute, 33, 341–345. [PubMed] [Google Scholar]
- Torfs CP, Lam PK, Schaffer DM and Brand RJ, 1998. Association between mothers' nutrient intake and their offspring's risk of gastroschisis. Teratology, 58, 241–250. [DOI] [PubMed] [Google Scholar]
- Toth B, Magee PN and Shubik P, 1964. Carcinogenesis study with dimethylnitrosamine administered orally to adult and subcutaneously to newborn balb‐c mice. Cancer Research, 24, 1712–1721. [PubMed] [Google Scholar]
- Totsuka Y, Lin Y, He Y, Ishino K, Sato H, Kato M, Nagai M, Elzawahry A, Totoki Y, Nakamura H, Hosoda F, Shibata T, Matsuda T, Matsushima Y, Song G, Meng F, Li D, Liu J, Qiao Y, Wei W, Inoue M, Kikuchi S, Nakagama H and Shan B, 2019. DNA adductome analysis identifies N‐Nitrosopiperidine involved in the Etiology of Esophageal Cancer in Cixian. China. Chemical Research in Toxicology, 32, 1515–1527. [DOI] [PubMed] [Google Scholar]
- Toyota M and Suzuki H, 2010. Epigenetic drivers of genetic alterations. Advances in Genetics, 70, 309–323. [DOI] [PubMed] [Google Scholar]
- Tricker AR and Preussmann R, 1991. Volatile and nonvolatile nitrosamines in beer. Journal of Cancer Research and Clinical Oncology, 117, 130–132. [DOI] [PubMed] [Google Scholar]
- Tsuda S, Matsusaka N, Madarame H, Miyamae Y, Ishida K, Satoh M, Sekihashi K and Sasaki YF, 2000. The alkaline single cell electrophoresis assay with eight mouse organs: results with 22 mono‐functional alkylating agents (including 9 dialkyl N‐nitrosoamines) and 10 DNA crosslinkers. Mutation Research, 467, 83–98. [DOI] [PubMed] [Google Scholar]
- Tsujiuchi T, Nakae D and Konishi Y, 2014. Multi‐step lung carcinogenesis model induced by oral administration of N‐nitrosobis (2‐hydroxypropyl) amine in rats. Experimental and Toxicologic Pathology, 66, 81–88. [DOI] [PubMed] [Google Scholar]
- Tu YY, Peng R, Chang Z‐F and Yang CS, 1983. Induction of a high affinity nitrosamine demethylase in rat liver microsomes by acetone and isopropanol. Chemico‐Biological Interactions, 44, 247–260. [DOI] [PubMed] [Google Scholar]
- Tu YY and Yang CS, 1983. A high affinity nitrosarnine dealkylase system in rat liver microsomes and its induction by fasting. Cancer Research, 43, 623–629. [PubMed] [Google Scholar]
- Tu YY and Yang CS, 1985. Demethylation and denitrosation of nitrosamines by cytochrome P‐450 isozymes. Archives of Biochemistry and Biophysics, 242, 32–40. [DOI] [PubMed] [Google Scholar]
- Tsutsumi N, Inami K and Mochizuki M, 2010. Activation mechanism for N‐nitroso‐N‐methylbutylamine mutagenicity by radical species. Bioorganic and Medicinal Chemistry, 18, 8284–8288. [DOI] [PubMed] [Google Scholar]
- Uibu J, Tauts O, Levin A, Shimanovskaya N and Matto R, 1996. N‐nitrosodimethylamine, nitrate and nitrate‐reducing microorganisms in human milk. Acta Pædiatrica, 85, 1140–1142. [DOI] [PubMed] [Google Scholar]
- Umano K, Shibamoto T, Fernando SY and Wei CI, 1984. Mutagenicity of 2‐hydroxyalkyl‐N‐ nitrosothiazolidines. Food and Chemical Toxicology, 22, 253–259. [DOI] [PubMed] [Google Scholar]
- Umbenhauer D, Wild CP, Montesano R, Saffhill R, Boyle JM, Huh N, Kirstein U, Thomale J, Rajewsky MF and Lu SH, 1985. O(6)‐methyldeoxyguanosine in oesophageal DNA among individuals at high risk of oesophageal cancer. International Journal of Cancer, 36, 661–665. [DOI] [PubMed] [Google Scholar]
- Ungar H, 1984. Primary portal venopathy in the golden hamster treated with low doses of dimethylnitrosamine. Liver, 4, 244–254. [DOI] [PubMed] [Google Scholar]
- Ungar H, 1986. Venoocclusive disease of the liver and phlebectatic peliosis in the golden hamster exposed to dimethylnitrosamine. Pathology – Research and Practice, 181, 180–187. [DOI] [PubMed] [Google Scholar]
- US EPA (United States Environmental Protection Agency) , 1996. US EPA Method 8070A: Nitrosamines by Gas Chromatography. US EPA, Washington, DC. [Google Scholar]
- USDA (United States Department of Agriculture) , 2018. CU Decision 299‐Meat and Meat Products, Poultry, Eggs and Products of Their Processing group 02, from group 04 (birds eggs), group 16 (ready‐to‐eat products).
- Ungar H, 1984. Primary portal venopathy in the golden hamster treated with low doses of dimethylnitrosamine. Liver, 4, 244–254. [DOI] [PubMed] [Google Scholar]
- Verna L, Whysner J and Williams GM, 1996. N‐nitrosodiethylamine mechanistic data and risk assessment: bioactivation, DNA adduct formation, mutagenicity and tumour initiation. Pharmacological Therapeutics, 71, 57–81. [DOI] [PubMed] [Google Scholar]
- Vesselinovitch SD, Koka M, Mihailovich N and Rao KV, 1984. Carcinogenicity of diethylnitrosamine in newborn, infant, and adult mice. Journal of Cancer Research and Clinical Oncology, 108, 60–65. 10.1007/BF00390974 [DOI] [PubMed] [Google Scholar]
- Vogel C, 2000. Prostaglandin H synthases and their importance in chemical toxicity. Current Drug Metabolism, 1, 391–404. 10.2174/1389200003338884 [DOI] [PubMed] [Google Scholar]
- von Hofe E, Grahmann F, Keefer LK, Lijinsky W, Nelson V and Kleihues P, 1986a. Methylation versus ethylation of DNA in target and nontarget tissues of Fischer 344 rats treated with N‐nitrosomethylethylamine. Cancer Research, 46, 1038–1042. [PubMed] [Google Scholar]
- von Hofe E, Kleihues P and Keefer LK, 1986b. Extent of DNA 2‐hydroxyethylation by N‐nitrosomethylethylamine and N‐nitrosodiethylamine in vivo. Carcinogenesis, 7, 1335–1337. [DOI] [PubMed] [Google Scholar]
- von Hofe E, Schmerold I, Lijinsky W, Jeltsch W and Kleihues P, 1987. DNA methyla‐tion in rat tissues by a series of homologous aliphatic nitrosamines ranging from N‐nitrosodimethylamineto N‐nitrosomethyldodecylamine. Carcinogenesis, 8, 1337–1341. 10.1093/carcin/8.9.1337 [DOI] [PubMed] [Google Scholar]
- von Hofe E, Schmerold I, Nims RW, Keefer LK, Reist EJ and Kleihues P, 1991. ß‐deuteration of N‐nitrosoethylmethylamine causes a shift in DNA methylation from rat liver to esophagus. Carcinogenesis, 12, 545–549. [DOI] [PubMed] [Google Scholar]
- Wada K, Nishino R, Fukuyama T and Matsumoto K, 2016. Evaluation of the PIGRET assay as a short‐term test using a single dose of diethylnitrosamine. Mutation Research, 811, 70–74. [DOI] [PubMed] [Google Scholar]
- Wade D, Yang CS, Metral CJ, Roman JM, Hrabie JA, Riggs CW, Anjo T, Keefer LK and Mico BA, 1987. Deuterium isotope effect on denitrosation and demethylation of N‐nitrosodimethylamine by rat liver microsomes. Cancer Research, 47, 3373–3377. [PubMed] [Google Scholar]
- Wainwright T, 1986a. The chemistry of Nitrosamine formation: relevance to malting and brewing. Journal of the Institute of Brewing, 92, 49–64. [Google Scholar]
- Wainwright T, 1986b. Nitrosamines in malt and beer. Journal of the Institute of Brewing, 92, 73–80. [Google Scholar]
- Wang LH, Hsia HC and Wang CC, 2006. Simultaneous determination of five volatile and non‐volatile N‐Nitrosamines in biological fluids and cosmetic products by liquid chromatography with photodiode array detection. Journal of Liquid Chromatography and Related Technologies, 29(12), 1737–1751. [Google Scholar]
- Wang Y, Li F, Zhuang H, Chen X, Li L, Qiao W and Zhang J, 2015. Effects of plant polyphenols and α‐tocopherol on lipid oxidation, residual nitrites, biogenic amines, and N‐nitrosamines formation during ripening and storage of dry‐cured bacon. LWT ‐ Food Science and Technology, 60(1), 199–206. [Google Scholar]
- Wang M, Young‐Sciame R, Chung FL and Hecht SS, 1995. Formation of N2‐tetrahydrofuranyl and N2‐tetrahydropyranyl adducts in the reactions of a‐acetoxy‐N‐nitrosopyrrolidine and a‐acetoxy‐N‐nitrosopiperidine with DNA. Chemical Research in Toxicology, 8, 617–624. [DOI] [PubMed] [Google Scholar]
- Wang X, Sun M, Gao Z, Yin L, Pu Y, Zhu Y, Wang X and Liu R, 2023. N‐nitrosamines‐mediated downregulation of LncRNA‐UCA1 induces carcinogenesis of esophageal squamous by regulating the alternative splicing of FGFR2. Science of The Total Environment, 855, 158918. [DOI] [PubMed] [Google Scholar]
- Wang Z, Zhai M, Xia X, Yang M, Han T and Huang M, 2018. A simple method for monitoring eight N‐Nitrosamines in Beef Jerkys by Gas Chromatography–Tandem Mass Spectrometry with one‐step treatment coupled to active carbon solid‐phase extraction. Food Analytical Methods, 11, 933–938. [Google Scholar]
- Wanson JC, Bernaert D, Penasse W, Mosselmans R and Bannasch P, 1980. Separation in distinct subpopulations by elutriation of liver cells following exposure of rats to N‐nitrosomorpholine. Cancer Research, 40, 459–471. [PubMed] [Google Scholar]
- Ward MH, Pan WH, Cheng YJ, Li FH, Brinton LA, Chen CJ, Hsu MM, Chen IH, Levine PH, Yang CS and Hildesheim A, 2000. Dietary exposure to nitrite and nitrosamines and risk of nasopharyngeal carcinoma in Taiwan. International Journal of Cancer, 86, 603–609. [DOI] [PubMed] [Google Scholar]
- Waynforth HB and Magee PN, 1974. The effect of N‐nitroso‐N‐methylurea and N‐dimethylnitrosamine on cell mediated and humoral immune responses in rats and mice. British Journal of Cancer, 30, 512–523. [DOI] [PMC free article] [PubMed] [Google Scholar]
- Wei F, Xu X, Zhou G, Zhao G, Li C, Zhang Y, Chen L and Qi J, 2009. Irradiated Chinese Rugao ham: changes in volatile N‐nitrosamine, biogenic amine and residual nitrite during ripening and post‐ripening. Meat Science, 81(3), 451–455. [DOI] [PubMed] [Google Scholar]
- Wells GA, Shea B, O'Connell D, Peterson J, Welch V, Losos M and Tugwell P, 2021. The Newcastle‐Ottawa Scale (NOS) for Assessing The Quality of Nonrandomised Studies in Meta‐analyses. Available online: http://www.ohri.ca/programs/clinical_epidemiology.oxford.htm.2004
- Weston RJ, 1983. Trace amounts of Nitrosamines in powdered milk and milk proteins. Journal of the Science of Food and Agriculture, 34, 893–895. [DOI] [PubMed] [Google Scholar]
- WHO (World Health Organization) , 2008. N‐Nitrosodimethylamine in drinking‐water, background document for development of WHO Guidelines for drinking‐water quality.
- WHO/IPCS (World Health Organization/International Programme on Chemical Safety & Inter‐Organization Programme for the Sound Management of Chemicals) , 2009. Assessment of combined exposures to multiple chemicals: report of a WHO/IPCS international workshop on aggregate/cumulative risk assessment. Available online: https://apps.who.int/iris/handle/10665/44113
- Wishnok JS, Archer MC, Edelman AS and Rand WM, 1978. Nitrosamine carcinogenicity: a quantitative Hansch‐Taft structure‐activity relationship. Chemico‐Biological Interactions, 20, 43–54. [DOI] [PubMed] [Google Scholar]
- Wilkens LR, Kadir MM, Kolonel LN, Nomura AM and Hankin JH, 1996. Risk factors for lower urinary tract cancer: the role of total fluid consumption, nitrites and nitrosamines, and selected foods. Cancer Epidemiology, Biomarkers and Prevention: A Publication of the American Association for Cancer Research, Cosponsored by the American Society of Preventive Oncology, 5, 161–166. [PubMed] [Google Scholar]
- Wills JW, Johnson GE, Slob W and White PA, 2017. Comparing BMD‐derived genotoxic potency estimations across variants of the transgenic rodent gene mutation assay. Environmental and Molecular Mutagenesis, 58, 632–643. [DOI] [PMC free article] [PubMed] [Google Scholar]
- Witschi H, 1973. The effects of diethylnitrosamine on ribonucleic acid and protein synthesis in the liver and lung of the Syrian golden hamster. The Biochemical Journal, 136, 789–794. [DOI] [PMC free article] [PubMed] [Google Scholar]
- Wogan GN, Paglialunga S, Archer MC and Tannenbaum SR, 1975. Carcinogenicity of nitrosation products of ephedrine, sarcosine, folic acid, and creatinine. Cancer Research, 35, 1981–1984. [PubMed] [Google Scholar]
- Wong HL, Murphy SE and Hecht SS, 2003a. Preferential metabolic activation of N‐nitrosopiperidine compared to its structural homolog N‐nitrosopyrrolidine by rat nasal microsomes. Chemical Research in Toxicology, 16, 1298–1305. [DOI] [PubMed] [Google Scholar]
- Wong HL, Murphy SE, Wang M and Hecht SS, 2003b. Comparative metabolism of N‐nitrosopiperidine and N‐nitrosopyrrolidine by rat liver and oesophageal microsomes and cytochrome P450 2A3. Carcinogenesis, 24, 291–300. [DOI] [PubMed] [Google Scholar]
- Wong HL, Murphy SE and Hecht SS, 2005. Cytochrome P450 2A‐catalyzed metabolic activation of structurally similar carcinogenic nitrosamines: N'‐nitrosonornicotine enantiomers, N‐nitrosopiperidine, and N‐nitrosopyrrolidine. Chemical Research in Toxicology, 18, 61–69. [DOI] [PubMed] [Google Scholar]
- Wood M, Flaks A and Clayson DB, 1970. The carcinogenic activity of dibutylnitrosamine in IF× C57 mice. European Journal of Cancer (1965), 6, 433–440. [DOI] [PubMed] [Google Scholar]
- Wrba H, Pielsticker K and Mohr U, 1967. Die diaplazentar‐carcinogene Wirkung von Difithylnitrosamin bei Ratten. Jg, He/t 2, 47. [DOI] [PubMed] [Google Scholar]
- Wyrobek AJ and Bruce WR, 1975. Chemical induction of sperm abnormalities in mice. Proceedings of the National Academy of Sciences, 72, 4425–4429. [DOI] [PMC free article] [PubMed] [Google Scholar]
- Xian Y, Wu Y, Dong H, Liang M, Wang B, Wang L, Bai W, Zeng X, Qian M and Zhao X, 2019. Ice‐bath assisted sodium hydroxide purification coupled with GC‐MS/MS analysis for simultaneous quantification of ethyl carbamate and 12 N‐nitrosoamines in yellow rice wine and beer. Food Chemistry, 300, 125200. [DOI] [PubMed] [Google Scholar]
- Xie XY, Shen J, Xu LY, Li EM and Shen ZY, 2010. Bronchogenic and alveologenic tumors in mice induced by N‐nitrosopiperidine. Biochemistry and Cell Biology, 88, 775–782. [DOI] [PubMed] [Google Scholar]
- Yahagi T, Nagao M, Seino Y, Matsushima T, Sugimura T and Okada M, 1977. Mutagenicities of N‐nitrosamines on Salmonella. Mutation Research, 48, 121–130. [DOI] [PubMed] [Google Scholar]
- Yang CS, Tu YY, Koop DR and Coon MJ, 1985. Metabolism of nitrosamines by purified rabbit liver cytochrome P‐450 isozymes. Cancer Research, 45, 1140–1145. [PubMed] [Google Scholar]
- Yang CS, Patten C, Lee MJ, Li M, Yoo JS, Pan J and Hong J, 1987. Enzymatic mechanisms in the metabolic activation of N‐nitrosodialkylamines. IARC Scientific Publications, 84, 104–108. [PubMed] [Google Scholar]
- Yoo JS, Ning SM, Patten CJ and Yang CS, 1987. Metabolism and activation of N‐nitrosodimethylamine by hamster and rat microsomes: comparative study with weanling and adult animals. Cancer Research, 47, 992–998. [PubMed] [Google Scholar]
- Yoo JS, Guengerich FP and Yang CS, 1988. Metabolism of N‐nitrosodialkylamines by human liver microsomes. Cancer Research, 48, 1499–1504. [PubMed] [Google Scholar]
- Yoo JS, Ishizaki H and Yang CS, 1990. Roles of cytochrome P450IIE1 in the dealkylation and denitrosation of N‐nitrosodimethylamine and N‐nitrosodiethylamine in rat liver microsomes. Carcinogenesis, 11(12), 2239–2243. 10.1093/carcin/11.12.2239 [DOI] [PubMed] [Google Scholar]
- Yoon HJ, Kim JH, Seo GH and Park H, 2021. Risk of cancer following the use of N‐nitrosodimethylamine (NDMA) contaminated ranitidine products: a nationwide cohort study in South Korea. Journal of Clinical Medicine, 10, 153. [DOI] [PMC free article] [PubMed] [Google Scholar]
- Yuan Y, Meng W, Yutian M, Fang C and Xiaosong H, 2015. Determination of eight volatile Nitrosamines in meat products by ultrasonic solvent extraction and gas chromatography‐mass spectrometry method. International Journal of Food Properties, 18, 1181–1190. [Google Scholar]
- Yurchenko S and Mölder U, 2006. Volatile N‐Nitrosamines in various fish products. Food Chemistry, 96, 325–333. [Google Scholar]
- Yurchenko S and Mölder U, 2007. The occurrence of volatile N‐nitrosamines in Estonian meat products. Food Chemistry, 100, 1713–1721. 10.1016/j.foodchem.2005.10.017 [DOI] [Google Scholar]
- Zak FG, Holzner JH, Singer EJ and Popper H, 1960. Renal and pulmonary tumors in rats fed dimethylnitrosamine. Cancer Research, 20, 96–99. [PubMed] [Google Scholar]
- Zeng X, Bai W, Xian Y, Dong H and Luo D, 2016. Application of QuEChERS‐based purification coupled with isotope dilution gas chromatography‐mass spectrometry method for the determination of N‐nitrosamines in soy sauce. Analytical Methods, 8, 5248–5254. [Google Scholar]
- Zhang Q, Jin L, Zhang F, Yao K, Ren Y, Zhang J, Zhang Q, He Q, Wan Y and Chi Y, 2019. Analysis of 7 volatile N‐nitrosamines in Chinese Sichuan salted vegetables by gas chromatography‐tandem mass spectrometry coupled to modified QuEchERS extraction. Food Control, 98(19), 342–347. [Google Scholar]
- Zhao Y‐L, Garrison SL, Gonzalez C, Thweatt WD and Marquez M, 2007. N‐Nitrosation of Amines by NO2 and NO: a theoretical study. Journal of Physical Chemistry A, 111(11), 2200–2205. [DOI] [PubMed] [Google Scholar]
- Zhao M, Li G, Kong W, Lu S, Xia L, Chen G, Zhao Z, Wu Y and You J, 2016. Convenient and sensitive HPLC method for determination of Nitrosamines in foodstuffs based on pre‐column fluorescence labeling. Chromatographia, 79, 431–439. [Google Scholar]
- Zheng J, Stuff J, Tang H, Hassan MM, Daniel CR and Li D, 2019. Dietary N‐nitroso compounds and risk of pancreatic cancer: results from a large case–control study. Carcinogenesis, 40, 254–262. [DOI] [PMC free article] [PubMed] [Google Scholar]
- Zheng J, Daniel CR, Hatia RI, Stuff J, Abdelhakeem AA, Rashid A, Chun YS, Jalal PK, Kaseb AO, Li D and Hassan MM, 2021. Dietary N‐Nitroso compounds and risk of hepatocellular carcinoma: a USA‐based study. Hepatology, 74, 3161–3173. [DOI] [PMC free article] [PubMed] [Google Scholar]
- Zielenska M, Ahmed A and Glickman BW, 1990. Mutational specificities of environmental carcinogens in the lacI gene of Escherichia coli. III: the cyclic nitrosamine N‐nitrosopyrrolidine is a complex mutagen. Molecular Carcinogenesis, 3, 122–125. [DOI] [PubMed] [Google Scholar]
- Zielenska M and Guttenplan JB, 1988. Mutagenic activity and specificity of N‐nitrosomethylaniline and N‐nitrosodiphenylamine in Salmonella. Mutation Research/Fundamental and Molecular Mechanisms of Mutagenesis, 202, 269–276. [DOI] [PubMed] [Google Scholar]
- Zielenska M and Guttenplan JB, 1987. Effects of UV repair, error‐prone repair and critical site of mutation on mutagenesis induced by N‐nitrosamines. Mutation Research, 180, 11–20. [DOI] [PubMed] [Google Scholar]
- Zhu Y, Wang PP, Zhao J, Green R, Sun Z, Roebothan B, Squires J, Buehler S, Dicks E, Zhao J and Cotterchio M, 2014. Dietary N‐nitroso compounds and risk of colorectal cancer: a case–control study in Newfoundland and Labrador and Ontario, Canada. British Journal of Nutrition, 111, 1109–1117. [DOI] [PMC free article] [PubMed] [Google Scholar]
Associated Data
This section collects any data citations, data availability statements, or supplementary materials included in this article.
Supplementary Materials
Protocol for human risk assessment related to the presence of N‐nitrosamines in food
BMD analyses
Occurrence data provided to EFSA and retrieved from the literature that have been used in the exposure assessment
Prediction of TD50s for NMAMPA and NMAMBA by Read Across with the OECD QSAR Toolbox v 4.4
Protocol for an Expert Knowledge Elicitation on the Uncertainty of the Risk Assessment of N‐nitrosamines in food
Outcome of the public consultation