Abstract
Clearances are important parameters in pharmacokinetic (PK) models. All clearances in PK models are either process clearances that include diffusion, transport, and metabolism clearances or system clearances that include organ and systemic clearance. Clearance and volume of distribution are two independent parameters that characterize drug disposition in both individual compartments and systems of compartments. In this minireview, we show that systemic and organ clearances are net clearances that can be easily derived by partition analysis. When drugs are eliminated from the central compartment by first-order processes, systemic clearance is constant. When drugs are eliminated from a peripheral compartment, instantaneous systemic clearance will vary with time. However, average clearance and clearance at steady state will be constant and will equal dose divided by area under the curve. We show that peripheral elimination will not have a large impact on most pharmacokinetic analyses and that standard models of organ and systemic clearance are useful and appropriate.
SIGNIFICANCE STATEMENT
There are two basic kinds of clearances used in pharmacokinetic models, process and system clearances. We show that organ and systemic clearances are net clearances with blood or plasma as the driving concentration. For linear pharmacokinetics, clearance is constant for elimination from the central compartment but varies with time for peripheral elimination. Despite the different kinds of clearance parameters and models, standard clearance models and concepts remain valid.
Introduction
Pharmacokinetic (PK) models are critical to characterize drug disposition in drug discovery and development and are essential to clinical therapeutics. Clearance (CL) as a key primary PK parameter has been very clearly defined since the inception of the field (Wagner, 1981; Wilkinson, 1987). Unfortunately, the term “clearance” is convoluted in two ways: 1) clearance is used to describe both elimination and transfer. Elimination is the irreversible loss of drug from a system, whereas a transfer describes the movement of drug from one part of the system to another. Systemic, organ, and metabolic clearances are examples of elimination clearances, whereas diffusion and transporter clearances are transfer clearances. 2) Clearances are used to describe both systems of processes (e.g., systemic and organ clearances) and the individual processes themselves (e.g., diffusion, metabolism, transporter, etc.). There has been some recent discussion on the validity of clearance parameters in PK models (Jusko et al., 2020; Benet et al., 2021; Benet and Sodhi, 2022; Kochak, 2022; Rowland and Pang, 2022; Rowland et al., 2022). For example, it was recently stated (Benet et al., 2021): “There is only one valid mechanistic definition of clearance. Clearance is driven by exposure proximate to the elimination machinery and is always model dependent”. This statement does not recognize that the term clearance is used in different ways in PK. It has also been stated (Benet and Sodhi, 2022): “If organ clearance is model independent, then organ exposure is model independent, and therefore it would not be possible to evaluate the relationship between organ exposure and pharmacodynamics”. Below, we show that different liver models can show differences in organ exposure, but organ clearance is model independent.
Clearances are normally combined using rate equations to generate pharmacokinetic models. It has been suggested recently that clearance relationships can be modeled as resistances (or conductances) instead of the normal methods of deriving rate equations (Pachter et al., 2022). We have recently published the use of Cleland’s partition analysis (Cleland, 1975) to easily derive net clearance terms in the context of a new physiologically based PK (PBPK) framework (Korzekwa et al., 2022a; Korzekwa et al., 2022b). In the published report, we state that resistances cannot be used to model physiologic clearances, and we have expanded this discussion in the present manuscript.
Although clearance concepts have been used and validated for many years, it is apparent that certain aspects of clearance concepts are worth emphasizing. In this commentary, we review the definitions of clearance, and describe the use of partition analysis to derive clearance equations. Next, we discuss these clearance concepts and methods in compartmental PK models with central and/or peripheral elimination. We also examine organ clearances in PBPK models. Finally, we consider the current use of clearance concepts in drug discovery and development.
Definitions of Clearance
PK models are usually constructed with compartments and parameters to transfer drug in and out of these compartments. There are two general types of PK models. Compartmental PK models use combinations (usually 1, 2, or 3) of mathematical compartments. These compartments have no physiologic meaning but are used to reproduce the concentration-time (C-t) profiles of drugs. PBPK models use compartments to represent organs that are connected by blood flow. One of the primary parameters used in PK models is clearance. In 1987, Wilkinson (1987) stated: “The most general definition of clearance (CL) is that it is a proportionality constant describing the relationship between a substance’s rate of transfer, in amount per unit time, and its concentration (C), in an appropriate reference fluid.” Clearance parameters are used in two ways in PK models. First, a process clearance (a biologic parameter) is used to represent the transfer of drugs into, between, and out of compartments. Second, a system clearance (a PK parameter) is used to describe the removal of drug from a system such as an organ or the body.
A Process Clearance Is a Primary Physiologic Parameter
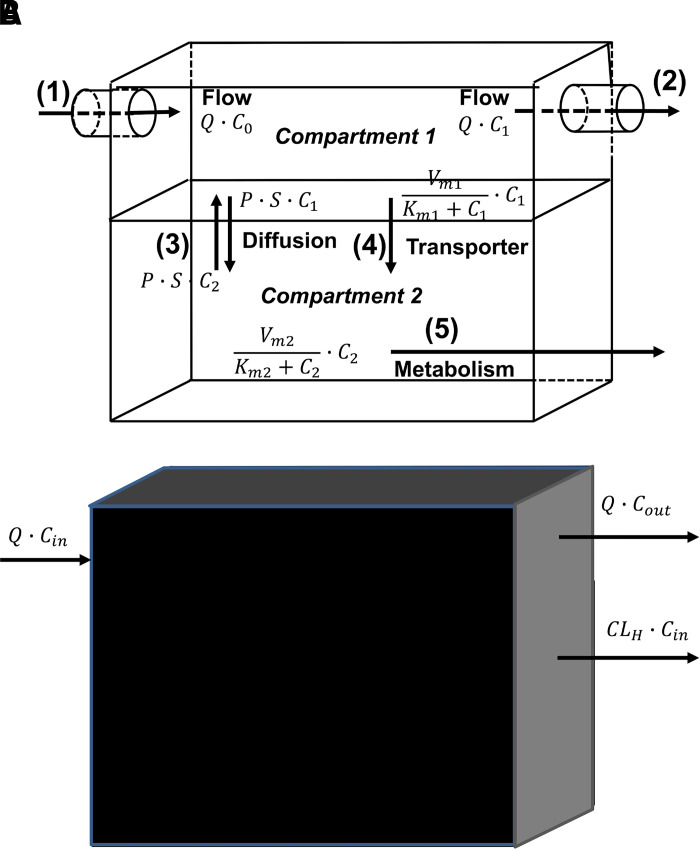
As shown in Fig. 1A, most of the physiologic processes that determine drug pharmacokinetics are driven by drug concentration. Fig. 1 represents a compartmental model for an organ with two compartments, and processes include: (1) and (2) flow in and out of the compartment, (3) passive diffusion between the compartments, (4) active transport, and (5) metabolism. For all these processes, the amount of drug entering or leaving the compartment depends on drug concentration. The amount of drug entering by (1) is the flow rate (Q) times C0 (the concentration of the fluid entering the compartment) and leaving by (2) is (Q) times C1 (the concentration in compartment 1). For passive diffusion, the rate of transfer between compartments (e.g., crossing a membrane) is the driving concentration of drug times the permeability surface area product (Papp·S). In Fig. 1a, both active transport (4) and metabolism (5) depicted as saturable processes with Michaelis-Menten kinetics. At low substrate concentrations, these functions reduce to a constant (Vm/Km) times the driving drug concentration (C1 or C2). All process clearances in Fig. 1A have units of volume time−1 (flow rate), which when multiplied by concentration gives units of amount time−1. Although Q in (1) and (2) is still called a flow rate, the other processes are usually defined as clearances. Therefore, for the nth process that removes drug from compartment i:
 |
 |
where CLn is a particular clearance out of compartment i, and Xi is the amount of drug in compartment i.
Fig. 1.
(A) A two-compartment organ model with the following process clearances: (1) flow in, (2) flow out, (3) passive permeability, (4) active efflux, and (5) metabolism. (B) An organ clearance model (system clearance) with blood as the reference fluid. P, permeability; S, surface area.
For a process by which a drug enters a compartment, the amount of drug entering is the clearance (or flow rate) multiplied by the concentration in the driving compartment, e.g., Q·C0 in Fig. 1A. Thus, for Fig. 1A, the change in the amount of drug in compartment 1 (i.e., rate in – rate out) is:
 |
or
 |
And the change in the amount of drug in compartment 2 is:
 |
or
 |
where CLdif is the passive diffusional clearance, CLeff is the efflux transporter clearance, and CLmet is the metabolic clearance.
The term “clearance” has an obvious meaning for removal of drug from a compartment since it can be thought of as the volume (V) of the compartment that is cleared of drug per unit time (e.g., mL/min). For all process clearances, it is the volume of the driving compartment that is cleared per unit time. Thus, a process clearance is the term that when multiplied by the concentration in the driving compartment results in the amount transferred per unit time (e.g., eqs. 1 and 2).
A Systemic Clearance Is a Primary PK Parameter
Process clearances are clearly defined as the rate of change of drug amount in a compartment divided by the concentration of drug driving that specific process (e.g., eq. 2). System clearances are combinations of process clearances and include whole-body clearance (systemic clearance) and organ clearance. Systemic clearance [CLS, blood clearance (CLb), plasma clearance (CLp), or just CL] is defined as the rate of elimination of drug from the system divided by the concentration of drug in the blood or plasma (Gibaldi and Perrier, 1982; Jusko and Li, 2021). For plasma clearance:
 |
where is the total amount of drug irreversibly leaving the body, and Cp is the plasma concentration. System clearances differ from process clearances since the concentration in the blood or plasma may not be the concentration driving physiologic elimination processes. For example, a metabolic (process) clearance is driven by unbound drug concentration at the enzyme site, whereas a hepatic (system) clearance is driven by drug concentration in the blood. This concept can be visualized by comparing Fig. 1A with Fig. 1B. In the absence of any mechanistic information (process clearances) within the organ, the rates in and out of the organ will define the organ clearance. Therefore, an organ clearance, e.g., hepatic clearance (CLH) = Q (Cin − Cout)/Cin in Fig. 1B (where Cin is the concentration into the liver and Cout is the concentration out of the liver), is independent of the mechanistic processes within the organ.
Using Clearances or Rate Constants in PK Models
If all clearances into and out of compartments are defined, volumes (Vi) of the compartments will completely define the C-t profiles of the compartments since Xi/Vi = Ci. The volumes needed may not be physical volumes but instead distribution volumes since drugs can partition into membranes, bind to plasma proteins, etc. One can work in amounts instead of concentrations using rate constant k (units = time−1). Thus, kn (rate constant for the nth process) can be calculated from CLn/Vi. Changes in amount per unit time in compartments () can be calculated by kn·Xi, but concentrations will not be known without volume terms. It is important to note that CLn and Vi are independent, primary parameters, and kn is a secondary parameter.
The liver microsomal stability assay is an in vitro experimental system that provides a useful example of a process clearance. This assay measures the metabolism of a compound in the presence of microsomal enzymes, and the resulting in vitro metabolic clearance can be scaled up to predict in vivo hepatic clearance [in vivo in vivo extrapolation (IVIVE)] (Obach, 2011). With this assay, the rate of substrate disappearance is used to calculate the rate constant kinc, and the incubation half-life (t1/2, inc) is 0.693/kinc. The rate constant is then multiplied by the incubation volume (Vinc) to calculate an in vitro intrinsic clearance (CLint). When used to predict in vivo hepatic clearance, the in vitro intrinsic clearance is divided by the fraction unbound in the microsomal incubation (fum). In reality, it is the experimental incubation volume that must be divided by fum to calculate the volume of distribution of the drug in the incubation (Vd,inc). Dividing Vinc by fum is the same as multiplying by (1+Kp), where Kp is the partition coefficient for microsomal partitioning. Therefore, Vinc·(1+Kp)·kinc is the correct in vitro CLint for the in vitro system. Again, Vd,inc and CLint are the two independent parameters that equally determine kinc and t1/2, inc.
Deriving Net Clearances
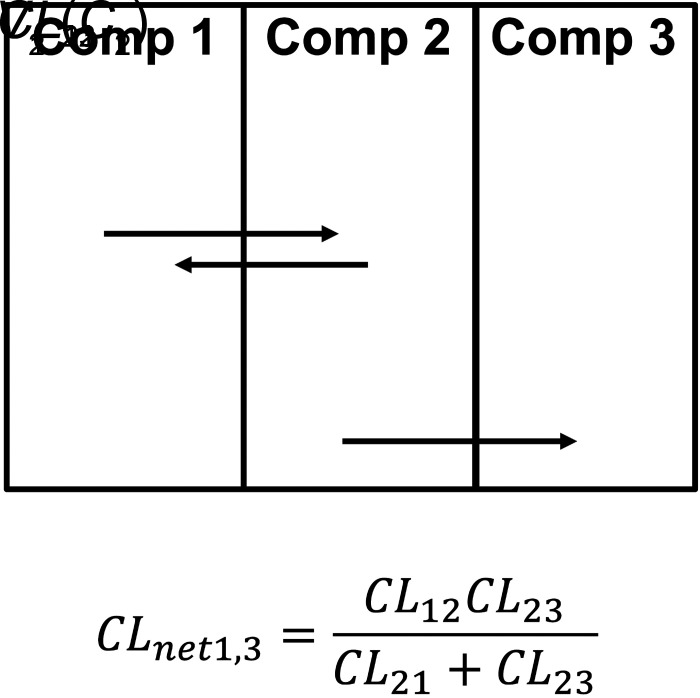
Systemic and organ clearances are net clearances. Any number of compartments and any number of process clearances can be combined to build systemic and organ clearances. We have shown recently that partition analysis (Cleland, 1975) can be used to simplify derivation of PK models (Korzekwa et al., 2022b). In Fig. 2, the net clearance from 1 to 3 (CLnet1,3) is calculated as the clearance from 1 to 2 times the fraction that moves from 2 to 3:
 |
Fig. 2.
Partition analysis to calculate a net clearance.
Use of a net clearance removes V2 and maintains the combined effect of the clearances. If compartment 3 is eliminated drug, CLnet1,3·C1 will give the rate of drug elimination. For the process clearance CL23, the driving concentration is C2, but for the net clearance CLnet1,3, C1 is now the driving concentration for drug elimination from compartment 1 to 3. The resulting equation will be valid at steady state (when there is no net transfer of drug) or if V2 is small and can be ignored in the model. Using partition analysis, complex schemes can be simplified, and the resulting net clearances can be used to model steady-state elimination and distribution. Net clearances can also be derived from rate equations with steady-state assumptions, but partition analysis greatly simplifies model derivation.
Kirchhoff’s Law Should Not Be Used to Derive Rate Equations in Pharmacology
It has been reported that Kirchhoff’s law, i.e., sums of resistances for processes in series, with clearance being conductance (1/resistance), can be used in pharmacology (Pachter et al., 2022). For the model in Fig. 2, we can consider the resistances between 1 and 3 and use Kirchhoff's Law to derive a net clearance as shown eq. 9.
 |
A “net clearance” derived from eq. 9 is only valid when clearances across a barrier are reversible and symmetrical, i.e., CL12 = CL21. If the model in Fig. 2 is a hepatic clearance model, and CL12 = CL21= Q, then CLnet1,3 = CLH = Q CLint/(Q = CLint), where CLint = CL23. If CL12 ≠ CL21, then eqs. 8 and 9 are not equal, i.e., . The Pachter review uses Kirchhoff’s law to derive a CLH equation with clearances between the blood and liver modeled as parallel processes in the opposite direction (“CLinflux-CLefflux”). The resulting eqs. 6, 10, and 11 in that report give CLH = 0 when (“CLinflux” = “CLefflux”) and a negative CLH when (“CLinflux” < “CLefflux.”) Both results are physiologically impossible for a clearance organ. Although eq. 9 may be useful for the special case of passive diffusion across a series of barriers, any directional transport cannot be modeled as sums of resistances. Use of partition analysis to derive net clearances is exemplified in compartmental as well as PBPK models below.
Compartmental PK Models
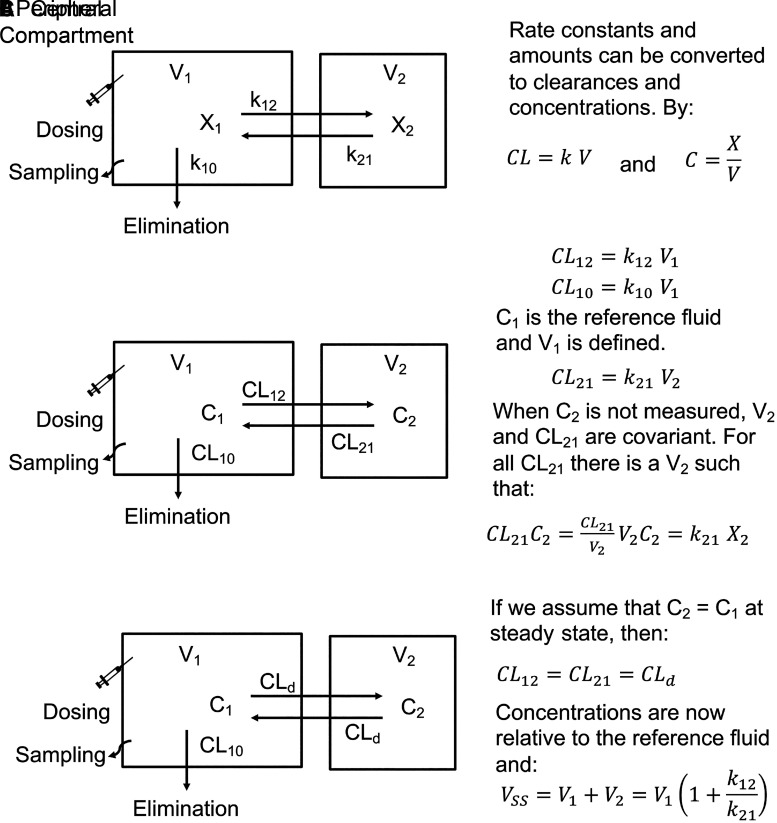
Compartmental PK models use mathematical compartments to reproduce plasma C-t profiles. For these models, a central compartment contains the blood or plasma and all spaces in rapid equilibrium with the blood or plasma. If distribution is slow relative to elimination, one or more peripheral compartments are reversibly linked to the central compartment (mamillary models). For these models, 0, 1, and 2 peripheral compartments result in mono-, bi- and triexponential decay C-t profiles, respectively, after an intravenous bolus injection with first-order elimination. A two-compartment model is shown in Fig. 3A, and X1 and X2 are the amounts of drug in the central and peripheral compartments, respectively, k12 and k21 are the transfer rate constants in and out of the peripheral compartment, and k10 is the first-order elimination rate constant from the central compartment. With this model, the amounts of drug in each compartment (X1[t] and X2[t]) are determined by the dose and the parameters k12, k21, and k10. However, since sampling (reference fluid) occurs from the central compartment, the volume of the central compartment is also necessary to generate C-t profiles.
Fig. 3.
Two-compartment models with elimination from the central compartment using (A) rate constants, (B) clearances, and (C) clearances assuming C1 = C2 at steady state (CL12 = CL21).
The rate constants and amounts in Fig. 3A can be converted to clearances and concentrations in Fig. 3B using the relationships CL = k·V and C = X/V. Since V1 is known, C1 and CL12 are known. However, C2 is generally not known, and both V2 and k21 cannot be determined. For any CL21 parameter estimate, there is a V2 parameter estimate, such that:
 |
The model in Fig. 3C assumes that C1 = C2 at steady state, and therefore, CL12 = CL21. This clearance is referred to as a distribution clearance (CLd) (Gillespie and Veng-Pedersen, 1985). This assumption will be true if C1 and C2 are the unbound drug concentrations and if the free drug hypothesis is valid for this drug. If correct, then the concentration in the tissue at steady state is the same as the concentration in the reference fluid (C1), V2 is the distribution volume of the peripheral compartment, and V1+V2 is the volume of distribution of the system at steady state (VSS):
 |
The compartments in compartmental models have no precise physiologic meaning other than the blood and plasma (reference fluids) are in the central compartment. The model can be equally described by rate constants and the volume of the sampling compartment (Fig. 3A) or by clearances and volumes if concentrations are known or if assumptions are made (Fig. 3, B and C).
Systemic Clearance in Compartmental Models
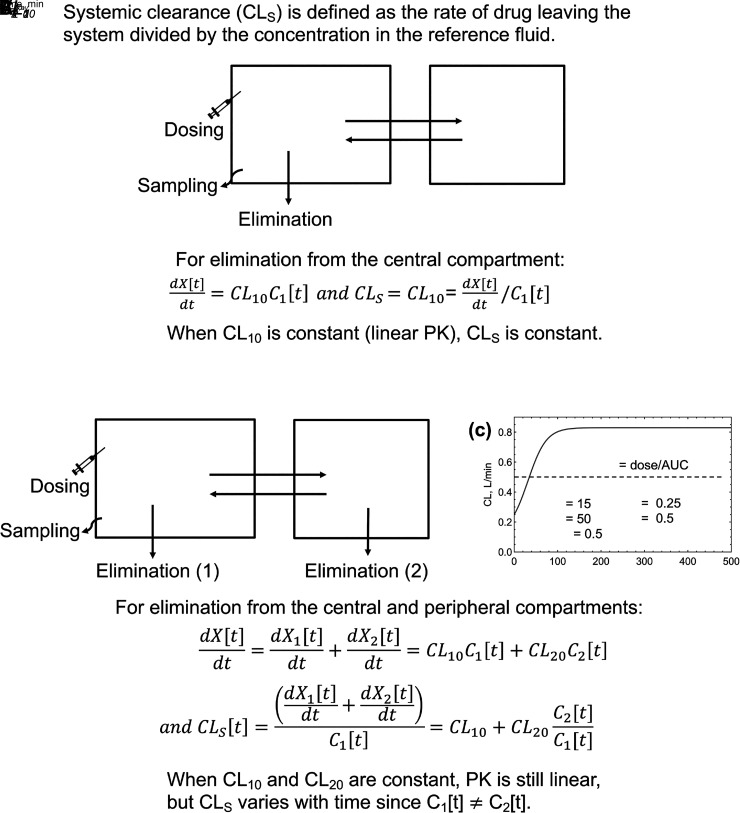
For the two-compartment models in Fig. 3 and Fig. 4A, elimination occurs from the central compartment. When process clearances are constant at relevant drug concentrations, elimination is first order and systemic clearance is constant. For saturable elimination processes, this occurs when drug concentrations are well below the relevant binding constants (e.g., C1 ≪ Km in Fig. 1A). Integration of eq. 7 shows that CLs = dose/AUC, where AUC is the area under the blood or plasma concentration-time curve. Constant intrinsic clearance results in “linear kinetics”, where the AUC is proportional to the dose, i.e., doubling the dose doubles the AUC.
Fig. 4.
Two-compartment models with elimination from the (A) central compartment and (B) central and peripheral compartments.
In Fig. 4B, elimination occurs from both the central and peripheral compartments. Given the definition of systemic clearance, , it can be seen that CLs is not constant over time:
 |
 |
Since the reference fluid is in the central compartment, the contribution from CL10 is constant. However, the contribution from CL20 changes with time (Källén, 2008). For example, immediately after an intravenous bolus, C1 is at the maximum concentration, and C2 = 0. The contribution of CL20 to systemic clearance will be zero at time t = 0 and will increase over time. Fig. 4C shows CLs as a function of time. Clearance at t = 0 is CL10 (0.25 L/min), and CL20 is 0 L/min. CL20 increases over time and reaches a plateau. However, the exposure-averaged clearance (CLav) is still dose/AUC since the integral of all elimination pathways must always equal dose, and AUC is the integral of the C-t profile of the reference compartment, AUC = . Therefore, AUCs are dose proportional, and linear kinetics are maintained if all elimination processes are first order. The consideration of the instantaneous clearance as a function of time is analogous to volume of distribution as a function of time in multicompartment models (Niazi, 1976; Gibaldi and Perrier, 1982).
The average systemic clearance will be the sum of the intrinsic clearance from the central compartment and the net clearance from the central compartment to elimination from the peripheral compartment (Korzekwa et al., 2022b) (0.5 L/min in Fig. 4C). This will also be the clearance at steady state (CLSS):
 |
The impact of peripheral elimination on systemic clearance has been discussed previously (Källén, 2008; Korzekwa et al., 2022b).
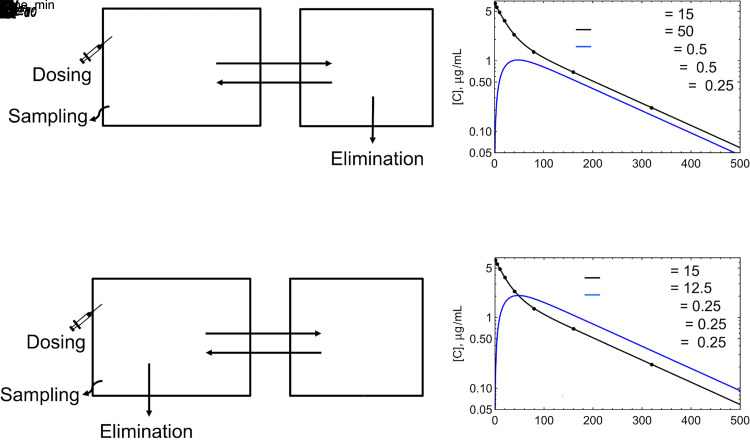
For compartmental models, characterization of the eliminating compartments is likely unnecessary. Concentrations are only known in the central compartment, and the eliminating compartment cannot be known without additional data. This can be seen from the simulations in Fig. 5. In Fig. 5A, elimination occurs from the peripheral compartment, and simulated plasma central and peripheral concentrations are shown in Fig. 5B. Peripheral volume and concentrations are only available by assuming values for the distributional clearances in and out of the peripheral compartment (CLd in Fig. 5). With these assumptions, simulations show that peripheral concentrations are always below central compartment concentrations since drug is being cleared from the peripheral compartment. At steady state, the rate into the peripheral compartment C1 CLd is equal to the rate out C2(CLd+CL20), and C2 = C1 CLd/(CLd+CL20). If a model with central elimination (Fig. 5C) is fit to the simulated data from peripheral elimination (Fig. 5B), a model with identical goodness of fit will be obtained (Fig. 5D). For pharmacokinetic models, there is no model identifiability with respect to the elimination compartment or compartments when only plasma or blood data are available. As seen in Fig. 5, there are differences in all parameters except V1. As described above, systemic clearance is constant with central elimination and varies with time for peripheral elimination, but dose/AUC and CLSS will be the same for both models.
Fig. 5.
Two-compartment models with (A) Peripheral compartment elimination, (B) Simulated C-t profiles for central and peripheral compartments, (C) Central elimination, and (D) C-t profiles for the fit to the simulated peripheral elimination dataset. C1 C-t profiles are identical in (B) and (D).
Although CLSS will be the same for Fig. 5, A and C, the VSS will differ between models (Berezhkovskiy, 2004; Källén, 2008; Berezhkovskiy, 2016). For peripheral elimination, the drug in the peripheral compartment that will be eliminated cannot be observed from the central compartment, and the residence time for the drug molecules in the peripheral compartment will be underestimated. For Fig. 5A, VSS = V1+V2·CLd/(CLd+CL20) = 40 L(Källén, 2008), and for Fig. 5C, VSS = V1+V2 = 27.5 L. The implications for this (or lack thereof) will be discussed below.
As can be seen in Fig. 5, B and D, concentrations in the central compartment are identical, but concentrations in the peripheral compartment are different. In reality, concentrations in the peripheral compartment are unknown (typically not measured). PKPD models are concerned with concentrations at the target, but most approaches do not assume clearances to obtain these concentrations. Instead, they use link models, delay compartments, lag times, etc., to relate target concentrations to plasma (central compartment) concentrations. If actual tissue concentrations are desired, PBPK approaches should be used. There are many examples of the PBPK/PD approach (Chetty et al., 2014; Kuepfer et al., 2016; Kovar et al., 2020; Rox et al., 2021; Murphy et al., 2022; Zhou et al., 2022), and its use is increasing due to its utility in regulatory decision making (Zhang et al., 2020; Loisios-Konstantinidis and Dressman, 2021).
It can be seen in Fig. 5 that systemic clearance for a compartmental model is a net clearance. In Fig. 5A, the net clearance from compartment 1 to elimination from compartment 2 is:
 |
The rate of elimination at steady state is CLSS C1. The concentration in the central compartment is the driving concentration (reference fluid) for this model. In general, blood or plasma concentration is the driving concentration for systemic and organ clearances, even though individual processes within these models may have different driving concentrations.
PBPK Models
In contrast to compartmental models, which use mathematical compartments to reproduce C-t profiles, PBPK models use a system of compartments and processes to represent physiologic drug disposition (Jones et al., 2015). Specifically, organs composed of one or more compartments are connected by blood flow to create a whole-body model. Distribution volumes are calculated using physiologic volumes and partition coefficients to include binding and partitioning processes. PBPK models include full-body models in which all organs are explicitly modeled, lumped models where organs with similar kinetic properties (e.g., blood flow) are combined (Nestorov et al., 1998; Pilari and Huisinga, 2010), minimal PBPK models where compartments are linked by blood flow (Cao and Jusko, 2012), and hybrid PBPK-compartmental models (Liu et al., 2005) where physiologic organ models are combined with a compartmental model.
Organ Clearance Models
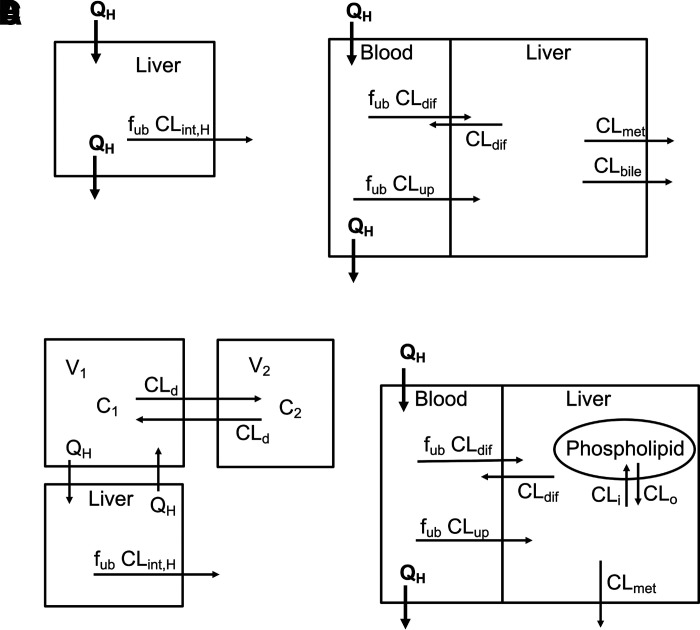
The most common organ clearance model is the well stirred liver model (WSM) (Fig. 6A) (Wilkinson and Shand, 1975; Pang and Rowland, 1977c; Pang and Rowland, 1977b). This model incorporates liver blood flow and an intrinsic clearance, allowing for hepatic clearance to be restricted by liver blood flow:
 |
where fub is the fraction unbound in blood, and CLint,H is the unbound intrinsic clearance for the liver (not restricted by blood flow). Intrinsic clearance, as originally defined, is the sum of the hepatic processes responsible for drug elimination. Fig. 6B shows an extended clearance model (Gillette and Pang, 1977; de Lannoy and Pang, 1986; Sato et al., 1986; Yamazaki et al., 1996; Sirianni and Pang, 1997) where drug in liver blood must cross a membrane by passive diffusion (CLdif) or by active uptake (CLup) and is eliminated by metabolism (CLmet) or by biliary excretion (CLbile). Hepatic clearance for this model is calculated as:
Fig. 6.
Hepatic clearance models. (A) The simple well stirred model, (B) the extended clearance model, (C) a two-compartment model with a well stirred model attached to the central compartment, and (D) the extended clearance model with a distribution compartment (phospholipids).
If other process clearances are important, such as basolateral efflux, they can be easily added to the model.
For Fig. 6, A and B, there are no explicit distribution compartments. For Fig. 6A, the driving concentration for the process clearance is the blood concentration and, therefore, CLH is constant. For Fig. 6B, the driving concentration for the elimination process clearances is the liver concentration. This concentration can be calculated from the unbound blood concentration times the ratio of clearances into and out of the liver. Since there is no distribution compartment, this concentration is reached instantaneously, and CLH is constant. These CLH values are actually net clearances from blood to elimination, and these models will be valid at steady state when there is no net distribution. Adding one of these models to a compartmental model (with blood flow coming from the central compartment, Fig. 6C) will provide a hepatic clearance that is limited by hepatic blood flow. In this hybrid model, distribution is modeled by the compartmental model, and clearance is modeled by a blood flow–limited liver.
Fig. 6D includes a distribution compartment (phospholipids), and hepatic clearance is no longer constant since the liver compartment must equilibrate with the phospholipid compartment. However, CLSS and CLav will be identical to the clearance in Fig. 6B, and if the liver is the only eliminating organ, this clearance will also equal dose/AUC. Organ models can be made more complex with additional compartments such as capillaries, interstitial spaces, lysosomes, etc., and additional processes such as active transport, recycling, etc. The driving concentration for organ models is arterial blood (except for venous blood for the lung), but the driving concentrations for the process clearances in the tissue may or may not be blood concentrations.
Systemic Clearance in PBPK Models
PBPK models include eliminating and noneliminating organs. Since tissues are represented by volumes and partition coefficients, noneliminating organs are involved in distribution only, whereas eliminating organs contribute to both distribution and clearance. Therefore, elimination occurs from a “peripheral” compartment for most PBPK models, i.e., a compartment distinct from the blood. In a compartmental model, organs that are in rapid equilibration with the blood are in the central compartment, but in a PBPK model, equilibration of all organs requires a finite amount of time. Therefore, by the strict definition of systemic clearance (eq. 7), CLS will be a function of time since concentrations in all organ compartments after intravenous bolus dosing is 0 at t = 0.
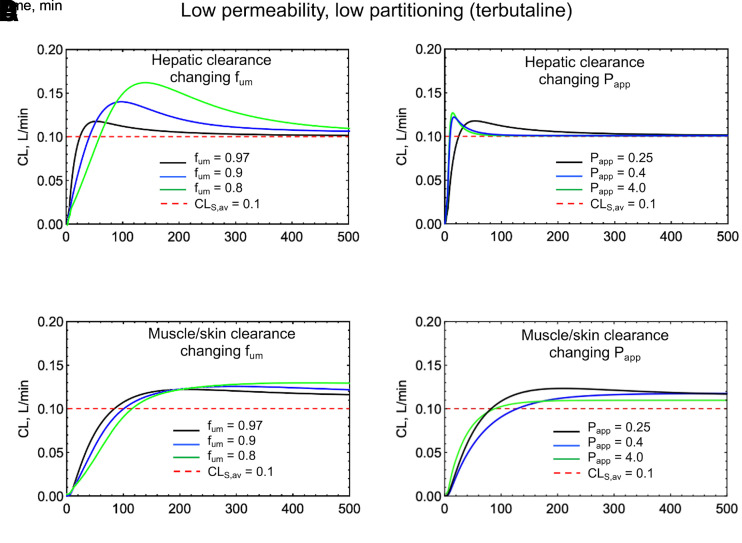
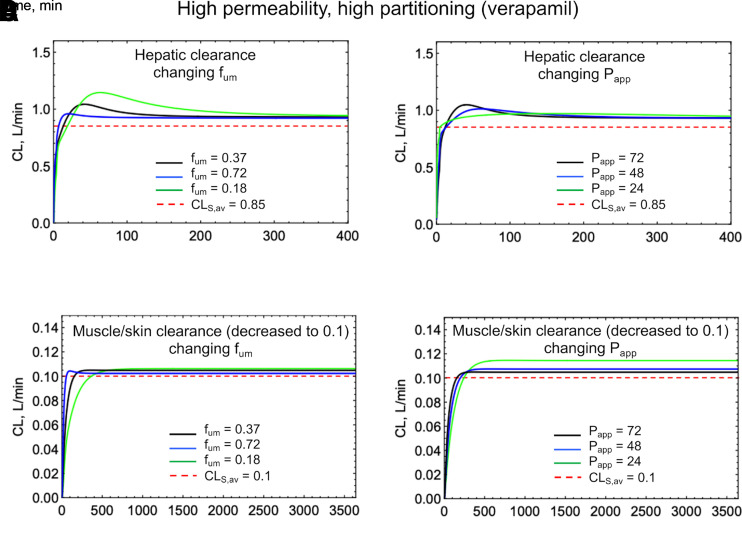
The magnitude and duration of the deviation of CLS[t] from CLSS (or dose/AUC) is dependent on the concentration difference between the driving concentration in the organ and the blood concentration. Figs. 7 and 8 show simulations of CLS[t] for a low permeability, low partitioning drug (terbutaline) and a high permeability, high partitioning drug (verapamil), using a permeability and perfusion limited PBPK model (Korzekwa et al., 2022a). This model uses apparent permeability (Papp) and microsomal partitioning (fum) to calculate clearances in, out, and across membranes. Tissue partition coefficients (Kp) are determined by fum, whereas diffusion rates across membranes (CLmem) are modeled with Papp. In Fig. 7, A and B and Fig. 8, A and B, Papp and fum are varied, and hepatic elimination is assumed. Fig. 7, C and D and Fig. 8, C and D show CLS[t] simulations if elimination occurs from a low-perfusion compartment consisting of skin and muscle.
Fig. 7.
Simulations of a low permeability, low partitioning drug (terbutaline) using the PermQ model (Korzekwa et al., 2022a). All drug elimination was modeled from either the liver or from a muscle/skin lumped compartment. (A) Varying fum with hepatic elimination, (B) Varying Papp with hepatic elimination, (C) Varying fum with elimination from a muscle/skin lumped compartment, and (D) Varying Papp with elimination from a muscle/skin lumped compartment.
Fig. 8.
Simulations of a high permeability, high partitioning drug (verapamil) using the PermQ model (Korzekwa et al., 2022a). All drug elimination was modeled from either the liver or from a muscle/skin lumped compartment. (A) Varying fum with hepatic elimination, (B) Varying Papp with hepatic elimination, (C) Varying fum with elimination from a muscle/skin lumped compartment, and (D) Varying Papp with elimination from a muscle/skin lumped compartment Decreasing clearance was necessary for (C) and (D) due to low blood flow.
As can be seen in Figs. 7 and 8, a poorly permeable drug with an artificially high simulated partition coefficient gives CL[t] profiles with the greatest deviation from CLS,av (Fig. 7A, fum = 0.8). In reality, most small-molecule drugs with poor permeability do not partition extensively into tissues. Highly permeable drugs with high Kp values also show deviations from CLS,av at early timepoints, but for hepatic elimination, clearance values approach CLS,av for the terminal elimination phase after an intravenous bolus(Fig. 8A). For elimination from the muscle/skin compartment, the deviation from CLS,av remains throughout the C-t profile. Since this compartment is kinetically distinct from the blood, the CL[t] profile looks like peripheral elimination in a compartmental model (Fig. 4C). Overall, Figs. 7 and 8 show relatively minor differences between CL[t] and CLS,av. Again, for all cases, CLav = dose/AUC. A similar discussion and plot were published by Källén (2008) previously.
Beyond WSM: Parallel Tube Model and Dispersion Model for Hepatic Clearance
Although well stirred liver models are the most common models for hepatic elimination, more physiologic models are available. The liver blood from the portal vein and hepatic artery enters a lobule, transverses a network of sinusoids, and exits through the hepatic vein. Since blood is exposed to hepatocytes along the sinusoid, models that consider flow in the liver may be more physiologic. Two general approaches that consider liver physiology are the parallel tube model (PTM) (Winkler et al., 1973; Bass et al., 1976; Pang and Rowland, 1977a) and dispersion model (DM) (Roberts and Rowland, 1986). As shown by Kwon and Morris (1997) and Pang et al. (2007), these models can be easily extended to include any complexities between the blood and elimination processes (e.g., diffusion, transport, etc.).
Net clearances (Korzekwa et al., 2022b) from the blood to elimination can be easily substituted into the basic PTM and DM equations to model these complexities. The use of these models has been recently discussed at length (Pang et al., 2019; Jusko and Li, 2021; Rowland et al., 2022), and there remains considerable disagreement on the appropriate model to use for IVIVE (Rowland and Pang, 2022). However, systemic clearance (CLS, CLS,av, CLSS) is model independent and is equal to dose/AUC. Irrespective of the elimination model used, the number of eliminating pathways, and the number of eliminating organs, the integral of eq. 7 from t = 0 to infinity will always equal dose/AUC.
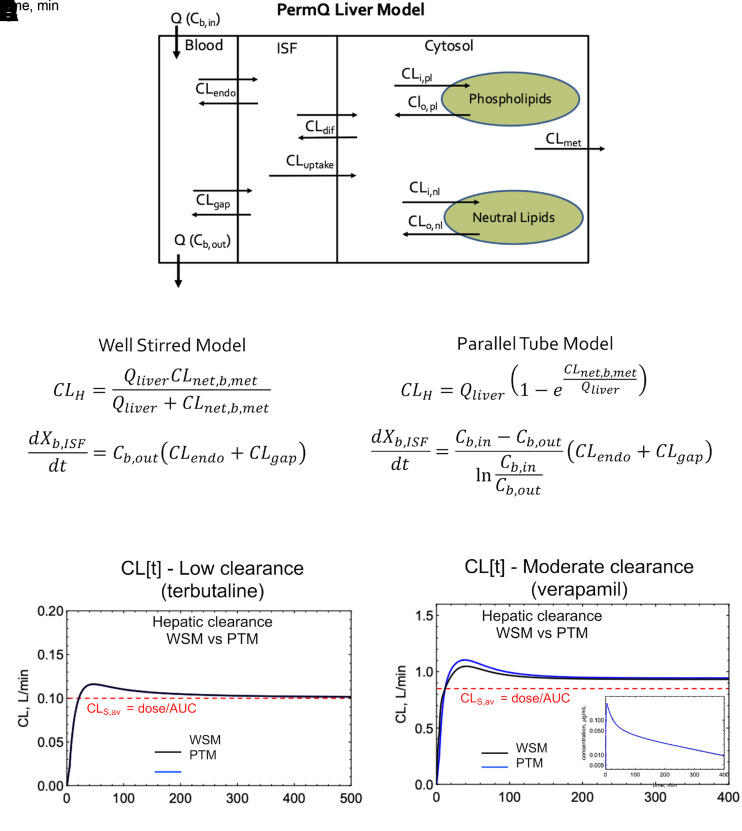
Organ clearance models, like systemic clearance models, are based on inlet blood concentrations. Fig. 9A shows a liver model used in a permeability- and perfusion-limited PBPK model (Korzekwa et al., 2022a). If CLH is known, the net clearance from liver blood to metabolism (CLnet,b,met) and liver blood flow can be used to calculate the CLmet needed to reproduce the observed average systemic clearance (dose/AUC). For the WSM, CLH is simply the net clearance from blood entering the liver to metabolism (Korzekwa et al., 2022b):
 |
where CLnet,b,met is the net clearance from liver blood to metabolism. Within the liver WSM, the concentration of liver blood (Cb,out) is the driving concentration for drug leaving the capillaries.
Fig. 9.
WSM and PTM simulations using the PermQ model (Korzekwa et al., 2022a). (A) The PermQ liver model. Unbound fractions and pH partitioning have been excluded from the figure for simplicity. (B and C) Equations to calculate CLmet and the rate of transfer from blood to interstitial space for the WSM and PTM, respectively. (D and E) CL[t] profiles for the WSM and PTM for terbutaline (low clearance) and verapamil (moderate clearance), respectively. Inset (E) overlayed C-t profiles for WSM and PTM. ISF, interstitial fluid.
For the PTM, CLH is calculated with the standard PTM clearance equation and the net clearance from liver blood to metabolism:
 |
Within the liver PTM, the log mean concentration of liver blood, (Cb,in − Cb,out)/Ln(Cb,in/Cb,out), can be used as the driving concentration for drug leaving the capillaries. For both the WSM and PTM, the calculated CLmet and appropriate driving liver blood concentration will produce the correct CLS,av for the complete PBPK model (Fig. 9, B and C). As seen in Fig. 9D, CL[t] varies minimally for the two models for a low-clearance drug. In Fig. 9E, there is a difference in CL[t] for the two models, but there is no difference in the resulting C-t profiles (Fig. 9E, inset). There is a difference in the CLmet needed to reproduce CLS,av: WSM 0.143 L/min versus PTM 0.132 L/min for terbutaline; WSM 80.7 L/min versus PTM 20.4 L/min for verapamil. This difference would impact IVIVEs since the in vitro clearance is extrapolated to in vivo (Naritomi et al., 2001; Hallifax et al., 2010), but there is no model identifiability based on C-t profiles alone. As expected, for all models, CLS,av = CLSS = dose/AUC is identical. Again, since blood is the reference fluid for CLS, the organ clearance is independent of the mechanistic model used within the organ. The basic DM model is intermediate between the PTM and the WSM, and similar results are obtained (data not shown). There are several other models and modifications of the models above (Pang et al., 2007), but to date, no model has been shown to outperform the others on a consistent basis (Pang et al., 2019).
Clearance in Drug Discovery and Development
The experimental datasets obtained in most clinical PK studies are plasma C-t profiles and urinary excretion data. Plasma C-t profiles from intravenous and oral studies are used to determine three independent PK parameters: systemic volume of distribution, clearance, and bioavailability. Volume of distribution is the volume of plasma (or blood) necessary to convert the (unmeasurable) amount of drug in the body to the measured plasma concentration. Systemic clearance defines how much of this volume of the plasma (or blood) is cleared per unit time. Volume(s) and clearance are orthogonal, independent parameters that characterize the C-t profile. Systemic clearance CLS is a particularly important parameter since linear kinetics (constant CLSS) is identified in dose-escalation studies by a constant dose-normalized AUC. Most decisions during clinical drug development studies are based on the primary PK parameters, t1/2, and C-t profile metrics such as Cmax and AUC, and this is unlikely to change as we gain further insight into important processes.
In the absence of a model for organ elimination, central elimination is assumed, and CLS is therefore constant with time for linear pharmacokinetics. One implication of CLS varying with time due to peripheral elimination is that the predicted concentration in the eliminating organ will not be equal to plasma concentration. The data in Figs. 6 and 7 suggest that this difference will be small (CL[t] is proportional to hepatic drug concentration) and would only be observable with a physiologic organ model. Although this difference may be important for drugs targeting the liver, it is unlikely that this variation in clearance will impact the development of most drugs. Similarly, Berezhkovskiy (2016) showed that the impact of peripheral elimination on volumes of distribution is minimal. Models with central versus peripheral elimination are nonidentifiable (Fig. 4) when based on plasma concentrations of parent drug alone. If one is concerned with the effect of peripheral elimination on target concentrations, a physiologic model will provide these concentrations. Again, the standard clearance concepts that have been foundational in PK remain appropriate and useful.
One of the major problems in drug discovery and development is the underprediction of hepatic clearance from in vitro data (Pang et al., 2019; Jusko and Li, 2021; Benet and Sodhi, 2022; Rowland and Pang, 2022). Hepatic clearances are usually estimated from systemic clearance and urinary excretion data. Renal clearance is readily calculated as the fraction of drug excreted unchanged times the systemic clearance. Hepatic clearance is usually assumed to be the remaining nonrenal clearance. More invasive studies such as tissue concentrations are restricted to preclinical species. Due to the high cost and poor correlation between metabolism in human and preclinical species, perfused liver studies have largely been limited to basic research on model development (Pang and Gillette, 1978; Yu et al., 1982; Pang et al., 1984; Xu et al., 1990; Pang et al., 1994; Geng et al., 1995; Geng et al., 1998). With the limited amount of organ perfusion data available, there is no indication that current organ clearance models [WSM, PTM, DM, and others (Pang et al., 2007)] are responsible for the poor IVIVE predictions (Naritomi et al., 2001; Hallifax et al., 2010; Jusko and Li, 2021; Rowland and Pang, 2022; Rowland et al., 2022). As stated by Jusko and Li (2021), “In spite of these complexities and uncertainties, the basic hepatic models offer highly useful starting points in PK and PBPK in considering tissue distribution and clearance processes for drugs”.
Conclusions
The definition of clearance by Wilkinson (1987): “The most general definition of clearance (CL) is that it is a proportionality constant describing the relationship between a substance’s rate of transfer, in amount per unit time, and its concentration (C), in an appropriate reference fluid” is correct. Here, we describe two general kinds of clearances used in PK: 1) process clearances, which characterize the rate of change of drug amount in a compartment with respect to the driving concentration for the process eliciting that change, and 2) a system clearance, which is the rate of drug elimination from the system divided by the concentration of drug in the blood or plasma. Biologic processes such as diffusion, transport, and metabolism are process clearances, and systemic and organ clearances are system clearances. For process clearances, the concentration in the reference fluid is the concentration where the process occurs, e.g., hepatocyte cytosol concentration for hepatic clearance, and is usually a calculated concentration unless it is the blood or plasma. For system clearances, the reference fluid concentration is the blood or plasma concentration, which may (renal clearance) or may not (hepatic clearance) be the driving concentration for the processes involved. Partition analysis is a facile method to generate net clearances such as systemic and organ clearances. Kirchhoff’s law cannot be used to derive accurate rate equations when any of the reversible processes are not symmetrical.
When all process clearances are first order and elimination occur only from the central compartment, systemic clearance is constant. When all process clearance pathways are first order and elimination occur from a tissue with distribution, instantaneous systemic clearance will be a function of time since tissue concentration will not always equal blood concentration. However, CLS,av = CLSS = dose/AUC, and Wilkinson and Shand (1975) state: “In particular, clearance is independent of either the descriptive compartmental model, or the manner of the intravenous administration, and the clearance estimation is valid even if elimination occurs outside the sampling compartment”. CLS,av and CLSS will always be equal to dose/AUC.
A C-t profile can be equally fit to central and peripheral elimination models. Peripheral elimination can only be inferred or determined by additional measurements. For both compartment-based models and systemic models, volume(s) and clearances are independent and orthogonal parameters. Together, they describe the C-t characteristics of the system. For drug discovery and development, any nuances that arise from peripheral elimination are unlikely to affect any program decisions. Finally, standard PK models, including compartmental models, organ models including WSM, PTM, DM liver models, and PBPK models, have been derived with reasonable assumptions and correct equations. Standard clearance concepts were defended recently by Rowland et al. (2022), and we agree with their opinion that “There is no need for additional clearance terms, which are confusing and offer no material benefit”.
Abbreviations
- AUC
area under the blood or plasma concentration-time curve
- C
concentration
- Cb,out
drug concentration in blood leaving the liver
- CL
clearance
- CLav
exposure-averaged clearance
- CLbile
biliary excretion clearance
- CLd
distribution clearance
- CLdif
passive diffusional clearance
- CLeff
efflux transporter clearance
- CLH
hepatic clearance
- CLint
in vitro intrinsic clearance
- CLint, H
unbound intrinsic clearance in the liver
- CLmet
metabolic clearance
- CLn
clearance for the nth process
- CLnet, b, met
net clearance from liver blood to metabolism
- CLnet1,3
net clearance from compartment 1 to compartment 3
- CLS
systemic clearance
- CLS, av
average systemic clearance
- CLSS
clearance at steady state
- CLup
active uptake clearance
- C-t
concentration-time
- DM
dispersion model
- fub
fraction unbound in blood
- fum
fraction unbound in the microsomal incubation
- IVIVE
in vivo in vivo extrapolation
- Kij
transfer rate constant from compartment i to j
- kinc
rate constant for the incubation
- Kp
partition coefficient
- Kn
rate constant for the nth process
- Papp
apparent permeability
- PBPK
physiologically based PK
- PK
pharmacokinetic
- PTM
parallel tube model
- Q
flow rate
- t1/2
half-life
- V
volume
- Vi
volume of compartment i
- Vinc
incubation volume
- VSS
volume of distribution of the drug at steady state
- WSM
well stirred liver model
- Xi
amount of drug in compartment i
Authorship Contributions
Participated in research design: Korzekwa, Nagar.
Performed data analysis: Korzekwa, Nagar.
Wrote or contributed to the writing of the manuscript: Korzekwa, Nagar.
Footnotes
This work was partially funded by National Institutes of Health National Institute of General Medical Sciences [Grant 2R01GM104178] and [Grant 2R01GM114369] for KK and SN.
No author has an actual or perceived conflict of interest with the contents of this article.
References
- Bass L, Keiding S, Winkler K, Tygstrup N (1976) Enzymatic elimination of substrates flowing through the intact liver. J Theor Biol 61:393–409. [DOI] [PubMed] [Google Scholar]
- Benet LZ, Sodhi JK (2022) Can In Vitro-In Vivo Extrapolation Be Successful? Recognizing the Incorrect Clearance Assumptions. Clin Pharmacol Ther 111:1022–1035. [DOI] [PMC free article] [PubMed] [Google Scholar]
- Benet LZ, Sodhi JK, Makrygiorgos G, Mesbah A (2021) There is Only One Valid Definition of Clearance: Critical Examination of Clearance Concepts Reveals the Potential for Errors in Clinical Drug Dosing Decisions. AAPS J 23:67. [DOI] [PMC free article] [PubMed] [Google Scholar]
- Berezhkovskiy LM (2004) Volume of distribution at steady state for a linear pharmacokinetic system with peripheral elimination. J Pharm Sci 93:1628–1640. [DOI] [PubMed] [Google Scholar]
- Berezhkovskiy LM (2016) On the accuracy of calculation of the mean residence time of drug in the body and its volumes of distribution based on the assumption of central elimination. Xenobiotica 46:477–482. [DOI] [PubMed] [Google Scholar]
- Cao Y, Jusko WJ (2012) Applications of minimal physiologically-based pharmacokinetic models. J Pharmacokinet Pharmacodyn 39:711–723. [DOI] [PMC free article] [PubMed] [Google Scholar]
- Chetty M, Rose RH, Abduljalil K, Patel N, Lu G, Cain T, Jamei M, Rostami-Hodjegan A (2014) Applications of linking PBPK and PD models to predict the impact of genotypic variability, formulation differences, differences in target binding capacity and target site drug concentrations on drug responses and variability. Front Pharmacol 5:258. [DOI] [PMC free article] [PubMed] [Google Scholar]
- Cleland WW (1975) Partition analysis and the concept of net rate constants as tools in enzyme kinetics. Biochemistry 14:3220–3224. [DOI] [PubMed] [Google Scholar]
- de Lannoy IA, Pang KS (1986) Presence of a diffusional barrier on metabolite kinetics: enalaprilat as a generated versus preformed metabolite. Drug Metab Dispos 14:513–520. [PubMed] [Google Scholar]
- Geng W, Schwab AJ, Horie T, Goresky CA, Pang KS (1998) Hepatic uptake of bromosulfophthalein-glutathione in perfused Eisai hyperbilirubinemic mutant rat liver: a multiple-indicator dilution study. J Pharmacol Exp Ther 284:480–492. [PubMed] [Google Scholar]
- Geng WP, Schwab AJ, Goresky CA, Pang KS (1995) Carrier-mediated uptake and excretion of bromosulfophthalein-glutathione in perfused rat liver: a multiple indicator dilution study. Hepatology 22:1188–1207. [DOI] [PubMed] [Google Scholar]
- Gibaldi M, Perrier D (1982) Pharmacokinetics, 2nd ed, Marcel Dekker, New York. [Google Scholar]
- Gillespie WR, Veng-Pedersen P (1985) Theorems and implications of a model-independent elimination/distribution function decomposition of linear and some nonlinear drug dispositions. II. Clearance concepts applied to the evaluation of distribution kinetics. J Pharmacokinet Biopharm 13:441–451. [DOI] [PubMed] [Google Scholar]
- Gillette JR, Pang KS (1977) Theoretic aspects of pharmacokinetic drug interactions. Clin Pharmacol Ther 22:623–639. [DOI] [PubMed] [Google Scholar]
- Hallifax D, Foster JA, Houston JB (2010) Prediction of human metabolic clearance from in vitro systems: retrospective analysis and prospective view. Pharm Res 27:2150–2161. [DOI] [PubMed] [Google Scholar]
- Jones HM, Chen Y, Gibson C, Heimbach T, Parrott N, Peters SA, Snoeys J, Upreti VV, Zheng M, Hall SD (2015) Physiologically based pharmacokinetic modeling in drug discovery and development: a pharmaceutical industry perspective. Clin Pharmacol Ther 97:247–262. [DOI] [PubMed] [Google Scholar]
- Jusko WJ, Li X (2021) Assessment of the Kochak-Benet Equation for Hepatic Clearance for the Parallel-Tube Model: Relevance of Classic Clearance Concepts in PK and PBPK. AAPS J 24:5. [DOI] [PMC free article] [PubMed] [Google Scholar]
- Jusko WJ, Molins EAG, Ayyar VS (2020) Seeking Nonspecific Binding: Assessing the Reliability of Tissue Dilutions for Calculating Fraction Unbound. Drug Metab Dispos 48:894–902. [DOI] [PMC free article] [PubMed] [Google Scholar]
- Källén A (2008) Modelling the distribution process, in Computational Pharmacokinetics, pp 97–136, Chapman & Hall/CRC Press, Boca Raton, FL. [Google Scholar]
- Kochak GM (2022) Assessment of the Kochak-Benet Equation for Hepatic Clearance for the Parallel-Tube Model: A Response to Jusko and Li. J Pharm Sci 111:2939–2942. [DOI] [PubMed] [Google Scholar]
- Korzekwa K, Radice C, Nagar S (2022a) A permeability- and perfusion-based PBPK model for improved prediction of concentration-time profiles. Clin Transl Sci 15:2035–2052. [DOI] [PMC free article] [PubMed] [Google Scholar]
- Korzekwa K, Yadav J, Nagar S (2022b) Using partition analysis as a facile method to derive net clearances. Clin Transl Sci 15:1867–1879. [DOI] [PMC free article] [PubMed] [Google Scholar]
- Kovar L, Selzer D, Britz H, Benowitz N, St Helen G, Kohl Y, Bals R, Lehr T (2020) Comprehensive Parent-Metabolite PBPK/PD Modeling Insights into Nicotine Replacement Therapy Strategies. Clin Pharmacokinet 59:1119–1134. [DOI] [PMC free article] [PubMed] [Google Scholar]
- Kuepfer L, Niederalt C, Wendl T, Schlender JF, Willmann S, Lippert J, Block M, Eissing T, Teutonico D (2016) Applied Concepts in PBPK Modeling: How to Build a PBPK/PD Model. CPT Pharmacometrics Syst Pharmacol 5:516–531. [DOI] [PMC free article] [PubMed] [Google Scholar]
- Kwon Y, Morris ME (1997) Membrane transport in hepatic clearance of drugs. I: Extended hepatic clearance models incorporating concentration-dependent transport and elimination processes. Pharm Res 14:774–779. [DOI] [PubMed] [Google Scholar]
- Liu XSmith BJChen CCallegari EBecker SLChen XCianfrogna JDoran ACDoran SDGibbs JP, et al. (2005) Use of a physiologically based pharmacokinetic model to study the time to reach brain equilibrium: an experimental analysis of the role of blood-brain barrier permeability, plasma protein binding, and brain tissue binding. J Pharmacol Exp Ther 313:1254–1262. [DOI] [PubMed] [Google Scholar]
- Loisios-Konstantinidis I, Dressman J (2021) Physiologically Based Pharmacokinetic/Pharmacodynamic Modeling to Support Waivers of In Vivo Clinical Studies: Current Status, Challenges, and Opportunities. Mol Pharm 18:1–17. [DOI] [PubMed] [Google Scholar]
- Murphy WA, Adiwidjaja J, Sjöstedt N, Yang K, Beaudoin JJ, Spires J, Siler SQ, Neuhoff S, Brouwer KLR (2022) Considerations for Physiologically Based Modeling in Liver Disease: From Nonalcoholic Fatty Liver (NAFL) to Nonalcoholic Steatohepatitis (NASH). Clin Pharmacol Ther DOI: 10.1002/cpt.2614 [published ahead of print]. [DOI] [PMC free article] [PubMed] [Google Scholar]
- Naritomi Y, Terashita S, Kimura S, Suzuki A, Kagayama A, Sugiyama Y (2001) Prediction of human hepatic clearance from in vivo animal experiments and in vitro metabolic studies with liver microsomes from animals and humans. Drug Metab Dispos 29:1316–1324. [PubMed] [Google Scholar]
- Nestorov IA, Aarons LJ, Arundel PA, Rowland M (1998) Lumping of whole-body physiologically based pharmacokinetic models. J Pharmacokinet Biopharm 26:21–46. [DOI] [PubMed] [Google Scholar]
- Niazi S (1976) Volume of distribution as a function of time. J Pharm Sci 65:452–454. [DOI] [PubMed] [Google Scholar]
- Obach RS (2011) Predicting clearance in humans from in vitro data. Curr Top Med Chem 11:334–339. [DOI] [PubMed] [Google Scholar]
- Pachter JA, Dill KA, Sodhi JK, Benet LZ (2022) Review of the application of Kirchhoff’s Laws of series and parallel flows to pharmacology: Defining organ clearance. Pharmacol Ther 239:108278. [DOI] [PMC free article] [PubMed] [Google Scholar]
- Pang KS, Barker F 3rd, Schwab AJ, Goresky CA (1994) Demonstration of rapid entry and a cellular binding space for salicylamide in perfused rat liver: a multiple indicator dilution study. J Pharmacol Exp Ther 270:285–295. [PubMed] [Google Scholar]
- Pang KS, Gillette JR (1978) Kinetics of metabolite formation and elimination in the perfused rat liver preparation: differences between the elimination of preformed acetaminophen and acetaminophen formed from phenacetin. J Pharmacol Exp Ther 207:178–194. [PubMed] [Google Scholar]
- Pang KS, Han YR, Noh K, Lee PI, Rowland M (2019) Hepatic clearance concepts and misconceptions: Why the well-stirred model is still used even though it is not physiologic reality? Biochem Pharmacol 169:113596. [DOI] [PubMed] [Google Scholar]
- Pang KS, Huang JC, Finkle C, Kong P, Cherry WF, Fayz S (1984) Kinetics of procainamide N-acetylation in the rat in vivo and in the perfused rat liver preparation. Drug Metab Dispos 12:314–322. [PubMed] [Google Scholar]
- Pang KS, Rowland M (1977a) Hepatic clearance of drugs. I. Theoretical considerations of a “well-stirred” model and a “parallel tube” model. Influence of hepatic blood flow, plasma and blood cell binding, and the hepatocellular enzymatic activity on hepatic drug clearance. J Pharmacokinet Biopharm 5:625–653. [DOI] [PubMed] [Google Scholar]
- Pang KS, Rowland M (1977b) Hepatic clearance of drugs. II. Experimental evidence for acceptance of the “well-stirred” model over the “parallel tube” model using lidocaine in the perfused rat liver in situ preparation. J Pharmacokinet Biopharm 5:655–680. [DOI] [PubMed] [Google Scholar]
- Pang KS, Rowland M (1977c) Hepatic clearance of drugs. III. Additional experimental evidence supporting the “well-stirred” model, using metabolite (MEGX) generated from lidocaine under varying hepatic blood flow rates and linear conditions in the perfused rat liver in situ preparation. J Pharmacokinet Biopharm 5:681–699. [DOI] [PubMed] [Google Scholar]
- Pang KS, Weiss M, Macheras P (2007) Advanced pharmacokinetic models based on organ clearance, circulatory, and fractal concepts. AAPS J 9:E268–E283. [DOI] [PMC free article] [PubMed] [Google Scholar]
- Pilari S, Huisinga W (2010) Lumping of physiologically-based pharmacokinetic models and a mechanistic derivation of classical compartmental models. J Pharmacokinet Pharmacodyn 37:365–405. [DOI] [PubMed] [Google Scholar]
- Roberts MS, Rowland M (1986) A dispersion model of hepatic elimination: 1. Formulation of the model and bolus considerations. J Pharmacokinet Biopharm 14:227–260. [DOI] [PubMed] [Google Scholar]
- Rowland M, Pang KS (2022) Hepatic clearance models and IVIVE predictions. Clin Pharmacol Ther 111:1205–1207. [DOI] [PubMed] [Google Scholar]
- Rowland M, Roberts MS, Pang KS (2022) In Defense of Current Concepts and Applications of Clearance in Drug Development and Therapeutics. Drug Metab Dispos 50:187–190. [DOI] [PubMed] [Google Scholar]
- Rox KHeyner MKrull JHarmrolfs KRinne VHokkanen JPerez Vilaro GDíez JMüller RKröger A, et al. (2021) Physiologically Based Pharmacokinetic/Pharmacodynamic Model for the Treatment of Dengue Infections Applied to the Broad Spectrum Antiviral Soraphen A. ACS Pharmacol Transl Sci 4:1499–1513. [DOI] [PMC free article] [PubMed] [Google Scholar]
- Sato H, Sugiyama Y, Miyauchi S, Sawada Y, Iga T, Hanano M (1986) A simulation study on the effect of a uniform diffusional barrier across hepatocytes on drug metabolism by evenly or unevenly distributed uni-enzyme in the liver. J Pharm Sci 75:3–8. [DOI] [PubMed] [Google Scholar]
- Sirianni GL, Pang KS (1997) Organ clearance concepts: new perspectives on old principles. J Pharmacokinet Biopharm 25:449–470. [DOI] [PubMed] [Google Scholar]
- Wagner JG (1981) History of pharmacokinetics. Pharmacol Ther 12:537–562. [DOI] [PubMed] [Google Scholar]
- Wilkinson GR (1987) Clearance approaches in pharmacology. Pharmacol Rev 39:1–47. [PubMed] [Google Scholar]
- Wilkinson GR, Shand DG (1975) Commentary: a physiological approach to hepatic drug clearance. Clin Pharmacol Ther 18:377–390. [DOI] [PubMed] [Google Scholar]
- Winkler K, Keiding S, Tygstrup N (1973) Clearance as a Quantitative Measure of Liver Function, in The Liver. Quantitative Aspects of Structure and Function (Paumgartner G and Preisig R eds) pp 144–155, S. Karger, Basel, Switzerland.
- Xu N, Chow A, Goresky CA, Pang KS (1990) Effects of retrograde flow on measured blood volume, Disse space, intracellular water space and drug extraction in the perfused rat liver: characterization by the multiple indicator dilution technique. J Pharmacol Exp Ther 254:914–925. [PubMed] [Google Scholar]
- Yamazaki M, Suzuki H, Sugiyama Y (1996) Recent advances in carrier-mediated hepatic uptake and biliary excretion of xenobiotics. Pharm Res 13:497–513. [DOI] [PubMed] [Google Scholar]
- Yu VC, de Lamirande E, Horning MG, Pang KS (1982) Dose-dependent kinetics of quinidine in the perfused rat liver preparation. Kinetics of formation of active metabolites. Drug Metab Dispos 10:568–572. [PubMed] [Google Scholar]
- Zhang X, Yang Y, Grimstein M, Fan J, Grillo JA, Huang SM, Zhu H, Wang Y (2020) Application of PBPK Modeling and Simulation for Regulatory Decision Making and Its Impact on US Prescribing Information: An Update on the 2018-2019 Submissions to the US FDA’s Office of Clinical Pharmacology. J Clin Pharmacol 60 (Suppl 1):S160–S178. [DOI] [PubMed] [Google Scholar]
- Zhou H, Zhang Z, Zhu L, Li P, Hong S, Liu L, Liu X (2022) Prediction of drug pro-arrhythmic cardiotoxicity using a semi-physiologically based pharmacokinetic model linked to cardiac ionic currents inhibition. Toxicol Appl Pharmacol 457:116312. [DOI] [PubMed] [Google Scholar]


