

Abstract
Background:
Despite high infant mortality rates in the United States relative to other developed countries, little is known about survey participation among mothers of deceased infants.
Objective:
To assess differences in survey response, contact and cooperation rates for mothers of deceased versus. living infants at the time of survey mailing (approximately 2–6 months postpartum), overall and by select maternal and infant characteristics.
Methods:
We analysed 2016–2019 data for 50 sites from the Pregnancy Risk Assessment Monitoring System (PRAMS), a site-specific, population-based surveillance system of mothers with a recent live birth. We assessed differences in survey participation between mothers of deceased and living infants. Using American Association for Public Opinion Research (AAPOR) standard definitions and terminology, we calculated proportions of mothers who participated and were successfully contacted among sampled mothers (weighted response and contact rates, respectively), and who participated among contacted mothers (weighted cooperation rate). We then constructed multivariable survey-weighted logistic regression models to examine the adjusted association between infant vital status and weighted response, contact and cooperation rates, within strata of maternal and infant characteristics.
Results:
Among sampled mothers, 0.3% (weighted percentage, n = 2795) of infants had records indicating they were deceased at the time of survey mailing and 99.7% (weighted percentage, n = 344,379) did not. Mothers of deceased infants had lower unadjusted weighted response (48.3% vs. 56.2%), contact (67.9% vs. 74.3%) and co-operation rates (71.1% vs. 75.6%). However, after adjusting for covariates, differences in survey participation by infant vital status were reduced.
Conclusions:
After covariate adjustment, differences in PRAMS participation rates were attenuated. However, participation rates among mothers of deceased infants remain two to four percentage points lower compared with mothers of living infants. Strategies to increase PRAMS participation could inform knowledge about experiences and behaviours before, during and shortly after pregnancy to help reduce infant mortality.
Keywords: infant mortality, PRAMS, pregnancy, response rates, survey participation
1 |. BACKGROUND
In 2019, 20,921 deaths among infants <1 year occurred in the United States (US).1 While infant deaths have continued to decline over the last two decades,2,3 they remain high in the United States (5.6 deaths per 1000 live births in 2019)1 relative to other developed countries.4 Many maternal preconception, prenatal and postpartum health behaviours and experiences are associated with reduced infant mortality risk (e.g. adequate prenatal care,5–8 folic acid supplementation,9–13 not smoking or smoking cessation,14–16 breastfeeding17–19 and safe infant sleep practices20,21). Population-based surveillance of maternal behaviours around the time of pregnancy is important for monitoring the prevalence of risk factors associated with leading causes of infant mortality such as birth defects, low birthweight, preterm birth and sleep-related infant deaths.22 Importantly, data collected from mothers of deceased infants can be used to prioritise and inform programmatic strategies to reduce infant mortality risk.23,24 However, population-based data, including participation in survey research, from these mothers is limited.25
In 1987 the Centers for Disease Control and Prevention (CDC) established the Pregnancy Risk Assessment Monitoring System (PRAMS) to reduce infant mortality and low birthweight in the United States by providing actionable data to influence maternal behaviours, during and immediately after pregnancy.25 PRAMS, a site-specific, population-based surveillance system, collects self-reported data from mothers with a recent live birth on maternal behaviours and experiences before, during and shortly after pregnancy.26 PRAMS data have been used to measure progress on public health priorities for improving the health of mothers and their infants (e.g. safe infant sleep practices, maternal mental health and preconception, prenatal and postpartum health behaviours).27,28 Although mothers whose infants died after delivery have always been eligible for the PRAMS sample, little is known about their participation rates. We assessed differences in survey response, contact and cooperation rates for mothers of deceased versus. living infants at the time of survey mailing (approximately 2–6 months postpartum) overall, and by select characteristics.
2 |. METHODS
2.1 |. Data source
We analysed operational data (e.g. rates of survey participation) from 2016–2019 PRAMS for all 50 participating sites (46 states, the District of Columbia, New York City [NYC], New York state [excluding NYC], and Puerto Rico) (Figure 1) and selected items from the birth certificate available in the PRAMS dataset.29
FIGURE 1.
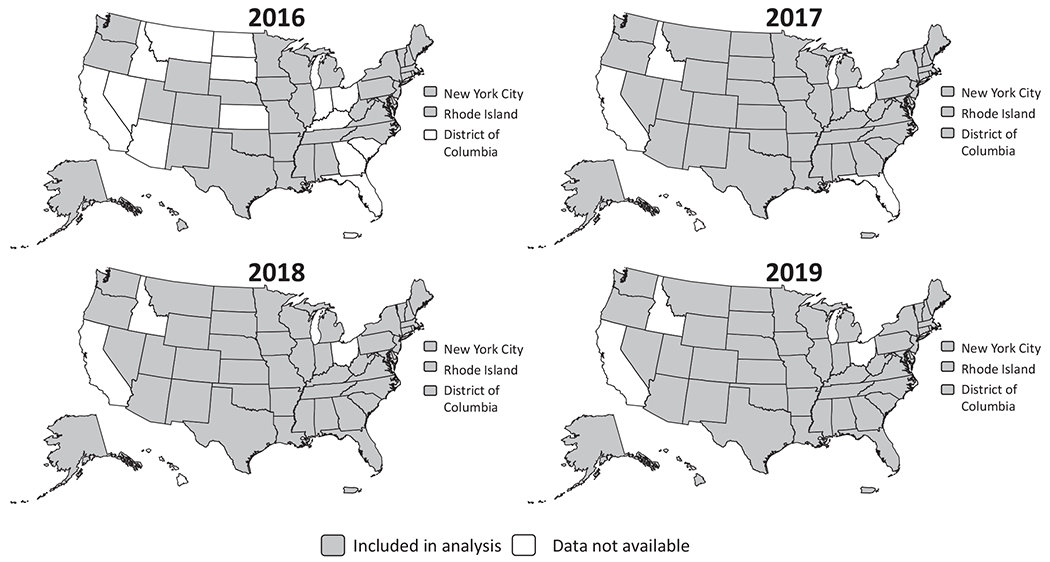
Data included in the analysis by study year from the Pregnancy Risk Assessment Monitoring System during 2016–2019
Mothers with a recent live birth are randomly sampled from birth certificate files 2–6 months postpartum. While not all people who are sampled identify as mothers, PRAMS does not collect data on gender identity. Therefore, the term ‘mothers’ is used to align with the birth certificate. Adoptive mothers and gestational carriers are excluded from the sampling frame. Mothers whose infants died after delivery and are identified as deceased on the birth certificate are eligible for inclusion in the sampling frame. Most sites (80%) review and match death certificate files to birth certificate files to ensure appropriate materials are mailed to mothers of deceased infants.
Each site follows a standardised protocol utilising mixed-mode data collection methodologies where prospective participants are first contacted via an introductory letter, followed by a survey packet mailing approximately one week later. Each mailing includes a cover letter describing PRAMS, an informed consent document, the survey, and a pre-addressed and stamped return envelope. Mothers whose infants were identified as deceased at the time of mailing are sent the same survey as mothers of living infants. All surveys, regardless of infant vital status, include language sensitive to loss and instructions to skip questions related to infant care (e.g. breastfeeding and safe infant sleep) if a loss occurred. A different introductory letter is included with the survey when it is known that the infant has died; however, all letters, regardless of infant vital status, offer condolences for a possible loss as some infant deaths might not be identified before survey mailing. Some sites have also opted to modify other materials to be sensitive to infant loss (e.g. survey cover of the survey booklet, rewards, incentives [e.g. baby items are not sent to mothers of deceased infants]). All non-respondents who have not returned a survey after three mailings are contacted via telephone to participate. Surveys completed via telephone include the same questions and language sensitive to loss as the mailed surveys. Before starting the interview, interviewers offer condolences to mothers known to have a deceased infant. Additional details about the PRAMS methodology have been described elsewhere.26
2.2 |. Exposure
Birth certificate data on vital status and, when available, updated information on infant deaths at the time of survey mailings were used to identify mothers of deceased infants for this analysis. Infants were identified as deceased on the birth certificate using information from the item, ‘Infant living at the time of the report’. Information on whether infants were identified as deceased using another method (e.g. death certificate) was determined by using an operational variable in the dataset that was updated by PRAMS site staff. We examined the following characteristics from the birth certificate included in the dataset: maternal age (in years; <20, 20–34, ≥35); race/ethnicity (non-Hispanic Black, non-Hispanic other [categorised as non-Hispanic Asian/Pacific Islander, non-Hispanic American Indian/Alaska Native, mixed race or other because small numbers of infant deaths among mothers sampled from these populations precluded analysis], non-Hispanic White, Hispanic); education (≤high school diploma or GED, some college, ≥Bachelor’s degree); payment for delivery (private [private, Champus/Tricare], Medicaid or other government insurance, uninsured [self-pay, Indian Health Service, other, not specified]); parity (primipara [no previous live births], multipara [≥1 previous live births]) infant gestational age (in completed weeks; extremely to very preterm [<32], moderate-to-late preterm [32–36], term [≥37])30; and any infant birth defect (yes, no).
2.3 |. Outcomes
Each site’s dataset is weighted to represent the population of mothers who delivered a live-born infant during the study year. Respondents were defined as mothers randomly selected to participate in PRAMS, with a live birth during January 2016–December 2019, and who had completed at least 25% of questions on the core PRAMS survey. Sites are strongly advised to re-contact respondents if <75% is complete, and encouraged to re-contact respondents if 75–95% is complete. Using American Association for Public Opinion Research (AAPOR) standard definitions and terminology (AAPOR RR6, COOP4), we examined PRAMS response, contact and cooperation rates.31 The weighted response rate was calculated as the ratio of the sum of the base weights (inverse of the probability of selection) for eligible mothers who completed or partially completed the survey to the sum of the base weights for all sampled mothers that were eligible to participate. The weighted contact rate was calculated as the ratio of the sum of the base weights for mothers who surveyors had any direct communication with to the sum of base weights for all sampled mothers that were eligible to participate. Direct communication for this analysis was defined as a completed or partially completed mail survey that was returned or an incomplete survey that was intentionally returned (i.e. not marked as undeliverable), a mother who called the site’s PRAMS number after receiving the mailed survey packet, or mothers directly reached by phone. The weighted cooperation rate was calculated as the ratio of the sum of the base weights for all mothers who completed or partially completed the survey to the sum of the base weights for all mothers who were successfully contacted to participate.
2.4 |. Statistical analysis
We performed descriptive statistics using percentages and 95% confidence intervals (CIs) to describe the sample overall, and by infant vital status for select characteristics. The weighted percentages and unweighted sample sizes are presented. We calculated unadjusted and adjusted response, contact and cooperation rates by using the average marginal predictions approach to logistic regression models and then generating rate ratios (RR) with their associated 95% CI32 to examinate associations between survey participation and selected characteristics. We first constructed separate bivariate survey-weighted logistic regression models to estimate the three unadjusted rates of survey participation for each selected characteristic, including infant vital status. We then constructed three separate survey-weighted multivariable models to compute the three adjusted rates of survey participation (response, contact and cooperation) for infant vital status, controlling for all previously mentioned characteristics, and US Census region.33 Characteristics were selected a priori based on measures associated with PRAMS response rates25 or those associated with high rates of infant mortality.3 The total number of infant deaths at the time of survey mailing across years from each site ranged from 9 to 254; small numbers precluded comparisons within and between sites. The wide variation in infant deaths by site is likely attributable, in part, to differences in stratification sampling plans. For example, sites that ever stratified by birthweight (low birthweight is a leading cause of infant mortality)3 during the study period accounted for approximately two-thirds of infants who were deceased in the sample.
We then constructed multivariable survey-weighted logistic regression models to examine the adjusted association between infant vital status and weighted response, contact and cooperation rates, within strata of selected characteristics. Separate models were constructed for each characteristic to estimate (1) adjusted response, contact and cooperation rates by characteristic and infant vital status at the time of survey mailing and (2) adjusted RR (aRR) to compare mothers of deceased with mothers of living infants within subgroups. Each model was adjusted for US Census region33 and all other selected characteristics examined and included an interaction term between the respective characteristic being examined and infant vital status.
All analyses were conducted with SAS v 9.4 (SAS Institute, Cary, NC) and SUDAAN 11.0.3 (RTI International, Research Triangle Park, NC) to account for the complex survey design and weighted to account for differential probabilities of selection. Results are presented as unadjusted RR and aRR with corresponding 95% CIs.
2.5 |. Missing data
Overall, missing data accounted for <5% of observations; therefore, we did not impute missing data. Among mothers sampled, 347,363 had data about infant vital status at the time of survey mailing (n = 604 [0.3%] missing) and select characteristics from the birth certificate (n = 9363 [2.0%] missing).
2.6 |. Ethics approval
This secondary data analysis was exempt from institutional review board (IRB) review. CDC’s and PRAMS sites’ IRBs reviewed and approved the PRAMS study protocol.
3 |. RESULTS
During 2016–2019, at the time of survey mailing, 0.3% (n = 2795) of infants had records indicating they were deceased and 99.7% (n = 344,568) of infants did not have any records indicating they were deceased (Table 1). Of infants who were deceased, 66.7% of deaths were identified on the birth certificate and 33.3% were identified from other sources (e.g. death certificate). A higher proportion of mothers of deceased infants, compared with mothers of living infants, were ≥35 years (21.4% vs. 17.2%), non-Hispanic Black (31.8% vs. 15.3%) and primiparous (42.7% vs. 38.1%). A higher proportion of mothers of deceased infants also had ≤high school level education (49.2% vs. 38.7%), delivery paid with Medicaid or other government insurance (52.5% vs. 43.4%), infants who were born extremely to very preterm (66.2% vs. 1.2%), or moderate-to-late preterm (12.2% vs. 7.8%), and infants born with a birth defect (7.2% vs. 0.3%).
TABLE 1.
Characteristics of mothers sampled by infant vital status — Pregnancy Risk Assessment Monitoring System (PRAMS), 50 sitesa, 2016–2019
| Infant deceased n = 2795b |
Infant alive n = 344,568b |
|||
|---|---|---|---|---|
| Characteristics | n b | % (95% CI)c | n b | % (95% CI)c |
| Maternal age (years) | ||||
| <20 | 234 | 6.2 (5.1, 7.6) | 21,011 | 5.1 (5.0, 5.2) |
| 20–34 | 2092 | 72.4 (68.9, 75.6) | 267,307 | 77.7 (77.4, 77.9) |
| ≥35 | 469 | 21.4 (18.3, 24.8) | 56,250 | 17.2 (17.0, 17.4) |
|
| ||||
| Maternal race/ethnicity | ||||
| Non-Hispanic Black | 949 | 31.8 (28.5, 35.4) | 74,798 | 15.3 (15.2, 15.5) |
| Hispanic | 414 | 18.1 (15.1, 21.4) | 65,661 | 21.4 (21.2, 21.6) |
| Non-Hispanic Otherd | 332 | 8.2 (6.6, 10.2) | 58,798 | 9.4 (9.3, 9.6) |
| Non-Hispanic White | 1100 | 41.9 (38.2, 45.6) | 145,311 | 53.9 (53.6, 54.1) |
|
| ||||
| Maternal education | ||||
| ≤High school diploma or GED | 1434 | 49.2 (45.5, 52.9) | 148,415 | 38.7 (38.5, 39.0) |
| Some college or Associate’s Degree | 836 | 29.4 (26.1, 33.0) | 101,320 | 28.5 (28.3, 28.8) |
| Bachelor’s degree or higher | 525 | 21.4 (18.3, 24.8) | 94,833 | 32.7 (32.5, 33.0) |
|
| ||||
| Payment for delivery | ||||
| Medicaid or other, government insurance | 1545 | 52.5 (48.7, 56.2) | 172,141 | 43.4 (43.1, 43.6) |
| Uninsured or other, not specified | 171 | 7.8 (5.8, 10.5) | 17,416 | 5.9 (5.7, 6.0) |
| Private | 1079 | 39.7 (36.1, 43.4) | 155,011 | 50.8 (50.5, 51.0) |
|
| ||||
| Parity | ||||
| Multipara | 1563 | 57.3 (53.6, 61.0) | 214,129 | 61.9 (61.7, 62.2) |
| Primipara | 1232 | 42.7 (39.0, 46.4) | 130,439 | 38.1 (37.8, 38.3) |
|
| ||||
| Gestational age at delivery, week | ||||
| Extremely to very preterm, <32 | 2101 | 66.2 (62.4, 69.7) | 11,624 | 1.2 (1.2, 1.2) |
| Moderate-to-late preterm 32–36 | 328 | 12.2 (10.1, 14.7) | 48,813 | 7.8 (7.6, 7.9) |
| Term, ≥37 | 366 | 21.6 (18.4, 25.1) | 284,131 | 91.1 (90.9, 91.2) |
|
| ||||
| Any birth defecte | ||||
| Yes | 202 | 7.2 (5.4, 9.4) | 1,380 | 0.3 (0.2, 0.3) |
| No | 2593 | 92.8 (90.6, 94.6) | 343,188 | 99.7 (99.7, 99.8) |
Abbreviation: GED, General Educational Diploma.
Excluding California, Idaho and Ohio during 2016–2019; Florida during 2016–2017; Arizona, Georgia, Indiana, Kansas, Kentucky, Montana, North Dakota, Nevada, South Carolina, South Dakota, the District of Columbia and Puerto Rico during 2016; and Hawaii during 2017–2018.
Unweighted sample size.
Weighted column percentage, might not sum to 100% due to rounding.
Categorised mothers who self-reported non-Hispanic Asian, Pacific Islander, American Indian, Alaska Native, mixed race or other non-white on the birth certificate because small numbers of infant deaths among mothers sampled from these populations precluded analysis.
Any infant birth defect was determined using the birth certificate variable assessing congenital anomalies of the newborn (i.e. Anencephaly, Meningomyelocele/Spina bifida, Cyanotic congenital heart disease, Congenital diaphragmatic hernia, Omphalocele, Gastroschisis, Limb reduction defect [excluding congenital amputation and dwarfing syndromes], Cleft Lip with or without Cleft Palate, Cleft Palate alone, Down Syndrome, Suspected chromosomal disorder, Hypospadias).
In unadjusted analyses (Table 2, Figure 2), mothers of deceased infants had lower weighted response (48.3% vs. 56.2%; RR 0.86, 95% CI 0.79, 0.93), contact (67.9% vs. 74.3%; RR 0.91, 95% CI 0.87, 0.96) and cooperation rates (71.1% vs. 75.6%; RR 0.94, 95% CI 0.89, 0.99) compared with mothers of living infants. Overall response, contact and cooperation rates were lower among mothers whose infants were deceased compared with living (Table 2), who were ≤34 years compared with ≥35 years, were non-Hispanic Black, or Hispanic compared with non-Hispanic White, had an associate’s degree or less education compared with a bachelor’s degree or higher, whose delivery was paid with Medicaid or other government insurance, self-payment or other method, not specified compared with private insurance, and whose infant was born preterm (≤36 weeks gestation) compared with term (≥37 weeks gestation). Overall response and cooperation rates were also lower among mothers who were multiparous compared with primiparous.
TABLE 2.
Unadjusted response, contact and cooperation ratesa by infant vital status and maternal and infant characteristics — Pregnancy Risk Assessment Monitoring System (PRAMS), 50 sitesb, 2016–2019
| Response rate n = 347,363c |
Contact rate n = 347,363c |
Cooperation rate n = 254,310c |
||||
|---|---|---|---|---|---|---|
| Maternal or infant characteristics | %d | RR (95% CI) | %d | RR (95% CI) | %d | RR (95% CI) |
| Infant vital status | ||||||
| Deceased | 48.3 | 0.86 (0.79–0.93) | 67.9 | 0.91 (0.87–0.96) | 71.1 | 0.94 (0.89–0.99) |
| Alive | 56.2 | 1.00 (Reference) | 74.3 | 1.00 (Reference) | 75.6 | 1.00 (Reference) |
|
| ||||||
| Maternal age (years) | ||||||
| <20 | 43.4 | 0.70 (0.68, 0.72) | 64.9 | 0.83 (0.81, 0.84) | 66.8 | 0.84 (0.82, 0.86) |
| 20–34 | 55.6 | 0.89 (0.88, 0.90) | 74.0 | 0.94 (0.93, 0.95) | 75.2 | 0.95 (0.94, 0.96) |
| ≥35 | 62.4 | 1.00 (Reference) | 78.6 | 1.00 (Reference) | 79.3 | 1.00 (Reference) |
|
| ||||||
| Maternal race/ethnicity | ||||||
| Non-Hispanic Black | 47.4 | 0.78 (0.77, 0.80) | 70.5 | 0.91 (0.91, 0.92) | 67.2 | 0.86 (0.85, 0.87) |
| Hispanic | 53.5 | 0.89 (0.88, 0.90) | 70.8 | 0.92 (0.91, 0.92) | 75.7 | 0.97 (0.96, 0.98) |
| Non-Hispanic Otherd | 52.2 | 0.86 (0.85, 0.88) | 71.9 | 0.93 (0.92, 0.94) | 72.6 | 0.93 (0.92, 0.94) |
| Non-Hispanic White | 60.4 | 1.00 (Reference) | 77.2 | 1.00 (Reference) | 78.2 | 1.00 (Reference) |
|
| ||||||
| Maternal education (years) | ||||||
| ≤High school diploma or GED | 48.3 | 0.72 (0.72, 0.73) | 69.1 | 0.85 (0.85, 0.86) | 69.8 | 0.85 (0.84, 0.85) |
| Some college or Associate’s degree | 54.7 | 0.82 (0.81, 0.83) | 73.7 | 0.91 (0.90, 0.92) | 74.2 | 0.90 (0.89, 0.91) |
| Bachelor’s degree or higher | 66.8 | 1.00 (Reference) | 80.9 | 1.00 (Reference) | 82.5 | 1.00 (Reference) |
|
| ||||||
| Payment for delivery | ||||||
| Medicaid or other government Insurance | 50.7 | 0.83 (0.82, 0.83) | 71.3 | 0.92 (0.91, 0.92) | 71.2 | 0.90 (0.89, 0.91) |
| Uninsured or other, not specified | 50.7 | 0.82 (0.80, 0.85) | 66.9 | 0.86 (0.84, 0.88) | 75.8 | 0.96 (0.94, 0.98) |
| Private | 61.4 | 1.00 (Reference) | 77.7 | 1.00 (Reference) | 79.0 | 1.00 (Reference) |
|
| ||||||
| Parity | ||||||
| Multipara | 55.6 | 0.97 (0.97, 0.98) | 74.2 | 1.00 (0.99, 1.00) | 75.0 | 0.98 (0.97, 0.99) |
| Primipara | 57.0 | 1.00 (Reference) | 74.5 | 1.00 (Reference) | 76.6 | 1.00 (Reference) |
|
| ||||||
| Gestational age, completed weeks | ||||||
| Extremely to very preterm, <32 | 51.7 | 0.91 (0.89, 0.94) | 70.8 | 0.95 (0.93, 0.97) | 72.9 | 0.96 (0.94, 0.98) |
| Moderate-to-late preterm, 32–36 | 53.0 | 0.94 (0.92, 0.95) | 72.4 | 0.97 (0.96, 0.98) | 73.3 | 0.97 (0.96, 0.98) |
| Term, ≥37 | 56.5 | 1.00 (Reference) | 74.5 | 1.00 (Reference) | 75.8 | 1.00 (Reference) |
|
| ||||||
| Any infant birth defectf | ||||||
| Yes | 56.2 | 1.00 (0.93, 1.08) | 74.3 | 0.99 (0.94, 1.05) | 76.4 | 1.01 (0.96, 1.07) |
| No | 56.1 | 1.00 (Reference) | 73.6 | 1.00 (Reference) | 75.6 | 1.00 (Reference) |
Abbreviations: GED, General Educational Diploma; RR, rate ratio.
We calculated proportions who participated and were successfully contacted among sampled mothers (weighted response and contact rates respectively), and who participated among contacted mothers (weighted cooperation rate) using American Association for Public Opinion Research definitions (AAPOR RR6, AAPOR COOP4).
Excluding California, Idaho and Ohio during 2016–2019; Florida during 2016–2017; Arizona, Georgia, Indiana, Kansas, Kentucky, Montana, North Dakota, Nevada, South Carolina, South Dakota, the District of Columbia and Puerto Rico during 2016; and Hawaii during 2017–2018.
Unweighted sample size.
Unadjusted weighted percentage.
Categorised mothers who self-reported non-Hispanic Asian, Pacific Islander, American Indian, Alaska Native, mixed race or other non-white on the birth certificate because small numbers of infant deaths among mothers sampled from these populations precluded analysis.
Any infant birth defect was determined using the birth certificate variable assessing congenital anomalies of the newborn (i.e. Anencephaly, Meningomyelocele/Spina bifida, Cyanotic congenital heart disease, Congenital diaphragmatic hernia, Omphalocele, Gastroschisis, Limb reduction defect [excluding congenital amputation and dwarfing syndromes], Cleft Lip with or without Cleft Palate, Cleft Palate alone, Down Syndrome, Suspected chromosomal disorder, Hypospadias).
FIGURE 2.
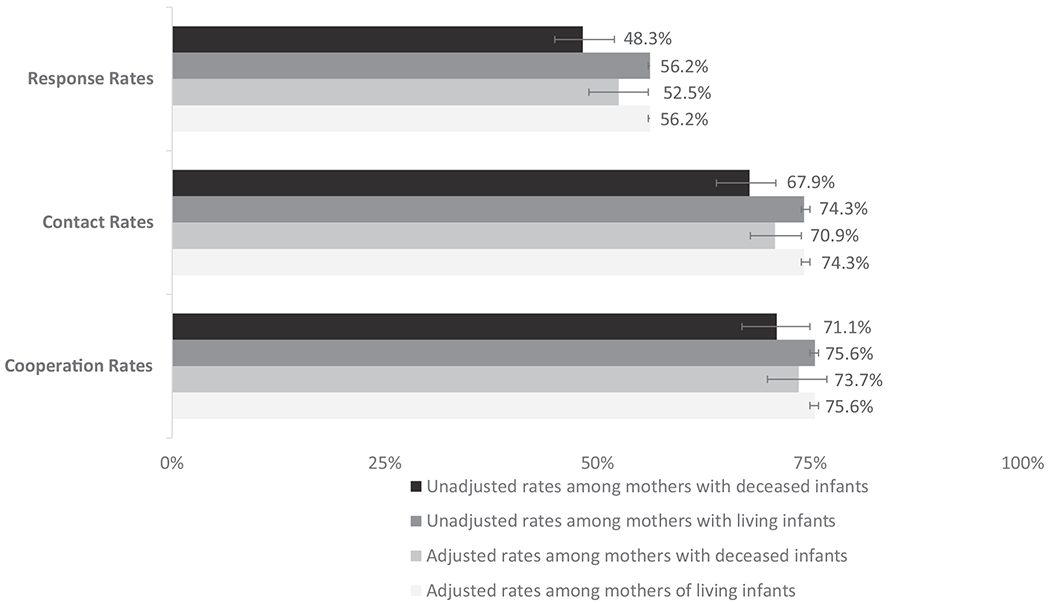
Comparison of unadjusted and adjusteda survey participation rates between mothers of deceased and living infants;
aAdjusted for US Census Region, maternal age, race/ethnicity, education, payment for delivery, parity, infant gestational age at delivery, and any infant birth defect
After adjusting for selected characteristics and US Census Region, differences in survey participation were attenuated between mothers of deceased infants compared with mothers of living infants; however, participation rates remained lower among mothers of deceased infants: response (52.5% vs. 56.2%; aRR 0.93, 95% CI 0.87, 1.01), contact (70.9% vs. 74.3%; aRR 0.95, 95% CI 0.91, 1.00) and cooperation rates (73.7% vs. 75.6%; aRR 0.98, 95% CI 0.93,1.03) (Table 3, Figure 2).
TABLE 3.
Adjusted response, contact and cooperation ratesa by maternal and infant characteristics between mothers of living and deceased infants – Pregnancy Risk Assessment Monitoring System (PRAMS), 50 sitesb, 2016–2019
| Infant deceased vs. living (reference group) |
|||||||||
|---|---|---|---|---|---|---|---|---|---|
| Maternal or infant characteristics | Response rate n = 347,363c |
Contact rate n = 347,363c |
Cooperation rate n = 254,310c |
||||||
| %d |
Adjusetd RR (95% CI)e | %d |
Adjusted RR (95% CI)e | %d |
Addjusted RR (95% CI)e | ||||
| Deceased | Living | Deceased | Living | Deceased | Living | ||||
| Overall | 52.5 | 56.2 | 0.93 (0.87–1.01) | 70.9 | 74.3 | 0.95 (0.91–1.00) | 73.7 | 75.6 | 0.98 (0.93–1.03) |
|
| |||||||||
| Age (years) | |||||||||
| <20 | 42.9 | 50.3 | 0.85 (0.68, 1.07) | 63.4 | 70.0 | 0.91 (0.78, 1.05) | 67.9 | 72.0 | 0.94 (0.78, 1.14) |
| 20–34 | 52.2 | 55.9 | 0.93 (0.86, 1.02) | 71.9 | 74.1 | 0.97 (0.92, 1.02) | 72.3 | 75.4 | 0.96 (0.90, 1.02) |
| ≥35 | 56.7 | 59.4 | 0.95 (0.82, 1.11) | 70.3 | 76.8 | 0.91 (0.82, 1.02) | 80.7 | 77.4 | 1.04 (0.96, 1.13) |
|
| |||||||||
| Race/Ethnicity | |||||||||
| Non-Hispanic Black | 45.4 | 49.8 | 0.91 (0.78, 1.06) | 65.7 | 71.2 | 0.92 (0.84, 1.01) | 69.2 | 70.2 | 0.99 (0.90, 1.09) |
| Hispanic | 48.1 | 57.7 | 0.83 (0.68, 1.02) | 63.8 | 73.9 | 0.86 (0.75, 0.99) | 75.4 | 78.2 | 0.96 (0.83, 1.12) |
| Non-Hispanic Otherg | 33.5 | 50.0 | 0.67 (0.51, 0.88) | 57.5 | 70.4 | 0.82 (0.69, 0.97) | 58.0 | 71.0 | 0.82 (0.66, 1.01) |
| Non-Hispanic White | 60.2 | 58.4 | 1.03 (0.94, 1.13) | 78.9 | 76.1 | 1.04 (0.98, 1.09) | 76.2 | 76.8 | 0.99 (0.93, 1.06) |
|
| |||||||||
| Education (years) | |||||||||
| ≤High school diploma or GED | 44.5 | 49.9 | 0.89 (0.79, 1.01) | 64.2 | 70.5 | 0.91 (0.84, 0.98) | 69.6 | 70.8 | 0.98 (0.91, 1.07) |
| Some college or Associate’s degree | 51.0 | 54.8 | 0.93 (0.81, 1.07) | 72.8 | 73.6 | 0.99 (0.92, 1.07) | 69.6 | 74.6 | 0.93 (0.84, 1.04) |
| Bachelor’s degree or higher | 65.0 | 64.9 | 1.00 (0.88, 1.13) | 79.1 | 79.7 | 0.99 (0.91, 1.08) | 82.3 | 81.5 | 1.01 (0.93, 1.09) |
|
| |||||||||
| Payment for delivery | |||||||||
| Medicaid or other government insurance | 50.2 | 55.7 | 0.90 (0.81, 1.00) | 69.0 | 74.3 | 0.93 (0.87, 0.99) | 73.0 | 75.0 | 0.97 (0.91, 1.05) |
| Uninsured or other, not specified | 54.6 | 53.2 | 1.03 (0.80, 1.31) | 64.4 | 68.9 | 0.93 (0.75, 1.17) | 83.2 | 77.3 | 1.08 (0.98, 1.18) |
| Private | 54.7 | 57.0 | 0.96 (0.86, 1.07) | 74.6 | 75.0 | 0.99 (0.93, 1.06) | 72.9 | 75.9 | 0.96 (0.89, 1.04) |
|
| |||||||||
| Parity | |||||||||
| Multipara | 52.5 | 55.8 | 0.94 (0.85, 1.04) | 68.8 | 74.3 | 0.93 (0.87, 0.99) | 76.2 | 75.1 | 1.01 (0.95, 1.08) |
| Primipara | 52.5 | 56.7 | 0.93 (0.83, 1.03) | 73.9 | 74.3 | 0.99 (0.94, 1.06) | 70.8 | 76.3 | 0.93 (0.86, 1.00) |
|
| |||||||||
| Gestational age, completed weeks | |||||||||
| Extremely to very preterm, <32 | 49.9 | 55.5 | 0.90 (0.82, 0.99) | 66.7 | 73.7 | 0.90 (0.85, 0.96) | 74.4 | 75.3 | 0.99 (0.93, 1.05) |
| Moderate-to-late preterm 32–36 | 55.0 | 54.2 | 1.01 (0.86, 1.20) | 75.6 | 73.0 | 1.04 (0.93, 1.15) | 72.9 | 74.4 | 0.98 (0.86, 1.12) |
| Term, ≥37 | 55.0 | 56.3 | 0.98 (0.83, 1.15) | 77.0 | 74.4 | 1.03 (0.95, 1.13) | 71.4 | 75.7 | 0.94 (0.83, 1.08) |
|
| |||||||||
| Any infant birth defecth | |||||||||
| Yes | 53.9 | 57.3 | 0.94 (0.72, 1.23) | 73.1 | 74.4 | 0.98 (0.81, 1.18) | 74.4 | 76.7 | 0.97 (0.81, 1.17) |
| No | 52.4 | 56.2 | 0.93 (0.87, 1.01) | 70.8 | 74.3 | 0.95 (0.91, 1.00) | 73.8 | 75.6 | 0.98 (0.92, 1.03) |
Abbreviations: aRR, adjusted rate ratio; GED, General Educational Diploma.
We calculated proportions who participated and were successfully contacted among sampled mothers (weighted response and contact rates respectively) and who participated among contacted mothers (weighted cooperation rate) using American Association for Public Opinion Research definitions (AAPOR RR6, AAPOR COOP4).
Excluding California, Idaho and Ohio during 2016–2019; Florida during 2016–2017; Arizona, Georgia, Indiana, Kansas, Kentucky, Montana, North Dakota, Nevada, South Carolina, South Dakota, the District of Columbia and Puerto Rico during 2016; and Hawaii during 2017–2018.
Unweighted sample size.
Adjusted weighted percentage.
We constructed separate multivariable survey, weighted logistic regression models to examine the association between survey response by each characteristic between mothers of deceased vs. mothers of living infants (reference group). Each model was adjusted for US Census region and all characteristics listed in the table and included an interaction term between the respective characteristic being examined and infant vital status to estimate the participation rates and rate ratios of survey response by each characteristic subgroup.
Each model was adjusted for US Census region and all characteristics listed in the table.
Categorised mothers who self-reported non-Hispanic Asian, Pacific Islander, American Indian, Alaska Native, mixed race or other non-white on the birth certificate because small numbers of infant deaths among mothers sampled from these populations precluded analysis.
Any infant birth defect was determined using the birth certificate variable assessing congenital anomalies of the newborn (i.e. Anencephaly, Meningomyelocele/Spina bifida, Cyanotic congenital heart disease, Congenital diaphragmatic hernia, Omphalocele, Gastroschisis, Limb reduction defect [excluding congenital amputation and dwarfing syndromes], Cleft Lip with or without Cleft Palate, Cleft Palate alone, Down Syndrome, Suspected chromosomal disorder, Hypospadias).
For each selected characteristic examined, adjusted response, contact and cooperation rates were generally lower among mothers of deceased infants (Table 3). In particular, lower response rates were observed between mothers whose infants were deceased compared with mothers whose infants were living among mothers whose infant was born extremely to very preterm, (49.9% vs. 55.5%; aRR 0.90, 95% CI 0.82, 0.99).
Similarly, contact rates differed by infant vital status, with mothers of infants who were deceased being less likely to be successfully contacted compared with mothers of living infants. Specifically, mothers of deceased infants were less likely to be successfully contacted if they were Hispanic (63.8% vs. 73.9%; aRR 0.86, 95% CI 0.75, 0.99), had a ≤high school level education (64.2% vs. 70.5%; aRR 0.91, 95% CI 0.84, 0.98), had their delivery paid with Medicaid or other government insurance (69.0% vs. 74.3%; aRR 0.93, 95% CI 0.87, 0.99), were multiparous (68.8% vs. 74.3%; aRR 0.93, 95% CI 0.87, 0.99), or whose infant was born extremely to very preterm (66.7% vs. 73.7%; aRR 0.90, 95% CI 0.85, 0.96) compared with mothers of living infants.
Cooperation rates were generally higher compared with response and contact rates, regardless of infant vital status. For most characteristics, there was a slight decrease observed in cooperation rates between mothers of deceased infants compared with mothers of living infants when examined by each characteristic.
4 |. COMMENT
4.1 |. Principal findings
In this study, unadjusted participation rates for PRAMS were generally five to eight percentage points lower for mothers of deceased infants compared with mothers of living infants at the time of survey mailing. Furthermore, after covariate adjustment, differences in response, contact and cooperation rates were reduced to two to four percentage points, suggesting that when co-occurring characteristics are considered, differences in response rates between mothers of deceased infants and mothers of living infants were attenuated. Higher cooperation rates overall compared with response and contact rates, regardless of infant vital status, indicate that once mothers were successfully reached, many completed the PRAMS survey. However, among subpopulations where response and contact rates were lower, strategies are needed to reach mothers and improve participation.
4.2 |. Strengths of the study
During 2016–2019, PRAMS represented approximately 83% of live births in the United States. Since mothers are sampled using birth certificate files, the PRAMS dataset includes select birth certificate variables, which allowed us to examine survey participation rates by several characteristics, including infant vital status.
4.3 |. Limitations of the data
First, while PRAMS data are collected at the site level, we were unable to compare response rates between sites by infant vital status because of the small number of deaths among infants who were sampled in some sites. As PRAMS response rates and US infant mortality rates vary widely between sites,3,34 it is likely that response rates also vary widely by infant vital status between sites.
Second, while we were able to determine whether infants were deceased at the time of survey mailing, data were not available on the timing or cause of death, which might influence survey response.
Third, we were unable to determine if an infant died after survey mailing, unless a mother had completed the survey; however, data were only available for respondents and therefore was not used in this analysis. Among respondents, 0.2% of mothers whose infants were alive at the time of survey mailing reported their infants were deceased when they completed the survey. While some infant deaths that occurred after birth certificate issuance might have been captured for sites who reviewed death certificate files before survey mailing, others might not have been accounted for if deaths occurred after mailing. In addition, for sites who did not match infant vital status with death certificates, only early neonatal deaths would have been captured on the birth certificate. Response rates might also differ between mothers of infants who died during the neonatal (≤27 days) compared with the postneonatal (28–364 days) period; however, this information was not available in PRAMS. This is an important limitation as infant deaths are officially defined as those that occur up to an infant’s first birthday; however, most PRAMS surveys are mailed between 2–6 months postpartum, with the majority being mailed and completed around 3 months postpartum. Therefore, infant deaths later in infancy are not captured in PRAMS.
Lastly, for mothers with multiple gestation births, it is possible infant vital status might have varied between infants which could influence response. However, we were unable to assess vital status for those infants of multiple gestation that were not sampled.
4.4 |. Interpretation
We found the overall unadjusted weighted response rates for mothers of deceased and living infants during 2016–2019 were 48.3% and 56.2% respectively. Comparatively, an earlier study of 2001 PRAMS data found a similar eight percentage point gap in unadjusted response rates between mothers of deceased (66%) and living (74%) infants25; however, after adjusting for selected characteristics, we found the gap in response rates narrowed considerably. Of note, in our analysis, response rates were noticeably lower compared with earlier studies examining response rates by infant vital status; however, general declines in response rates have been a common occurrence across survey research in recent years.35
While there was less variation in survey participation between mothers of living and deceased infants when examined by selected characteristics, overall, there was variation in response, contact and cooperation rates by these same characteristics in unadjusted analyses. In unadjusted analyses, mothers whose infants were born preterm had lower overall response, contact and cooperation rates compared with mothers whose infants were born term. In adjusted analyses, while rates were similar among mothers whose infants were born moderate-to-late preterm or term, for those whose infants were born extremely to very preterm, response and contact rates were lower among mothers whose infants were deceased at the time of survey mailing. Mothers whose infants were born extremely to very preterm also had the highest proportion of infants who were deceased at the time of survey mailing (66.2%) compared with mothers whose infants were born at a later gestational age (moderate-to-late preterm 12.2%; term 21.6%). Improving the participation of mothers whose infants have died might also improve participation among mothers whose infants are at higher risk for infant mortality. These findings, that differences in survey participation exist by infant gestational age and continue by infant vital status among mothers whose infants are born extremely to very preterm, highlight an opportunity to identify what drives these differences and to improve the sensitivity of and further tailor PRAMS data collection protocols.36 Identifying strategies to improve response rates overall, and in particular, among mothers who have had a traumatic birth experience in a respectful way, are needed.
More recently, surveillance projects have focused on the feasibility of reaching mothers who experienced a stillbirth using methodology adapted from PRAMS in both Georgia37 and Utah,38 as PRAMS has historically not sampled mothers who experienced stillbirth. In Georgia, 40% of mothers and in Utah, 57% of mothers who experienced stillbirth completed the survey. Higher response rates in Utah might be attributable to the unique incentives tailored for mothers of stillborn infants and bereavement training of interviewers.38 Adapting similar strategies might be one approach to improve PRAMS response rates among mothers of infants who were deceased at the time of survey mailing.
Surveys, such as PRAMS, should continue attempts to minimise non-response bias and capture the preconception, prenatal and postpartum health behaviours and experiences of all mothers sampled, especially those at higher risk of adverse maternal and infant health outcomes, including infant mortality. Population-based data can be used to inform programs and initiatives to improve health outcomes and eliminate health disparities. Better understanding the reasons mothers might not participate, as well as reasons mothers do participate in PRAMS, would help inform efforts to improve participation.
5 |. CONCLUSIONS
Our findings indicate overall survey participation is lower for mothers of deceased infants than mothers of living infants in unadjusted analyses. However, overall differences in response, contact and cooperation rates by infant vital status were attenuated in adjusted analyses. Strategies to increase PRAMS participation are needed and could further help inform knowledge about experiences and behaviours before, during and shortly after pregnancy to help reduce infant deaths.
Synopsis.
Study question
Among mothers sampled for the Pregnancy Risk Assessment Monitoring System (PRAMS), do participation rates differ between mothers of deceased and mothers of living infants?
What is already known
Population-based data from mothers of deceased infants, including their willingness to participate in research, is limited.
What this study adds
Unadjusted participation rates for PRAMS were generally five to eight percentage points lower for mothers of deceased infants compared with mothers of living infants at the time of survey mailing. After adjustments for conofounders, differences in response, contact and cooperation rates were attenuated. However, results suggest that participation rates remain two to four percentage points lower among mothers of deceased infants.
ACKNOWLEDGMENTS
We thank the PRAMS (Pregnancy Risk Assessment Monitoring System) Working Group for its role in conducting PRAMS surveillance. The PRAMS Working Group members include: Kathy Perham-Hester, Alaska; Ashley Juhl, Colorado; Jennifer Morin, Connecticut; George Yocher, Delaware; Fay Stephens, Georgia; Julie Doetsch, Illinois; Lisa Williams, Kansas; Tracey D. Jewell, Kentucky; Rosaria Trichilo, Louisiana; Virginia Daniels, Maine; Hafsatou Diop, Massachusetts; Peterson Haak, Michigan; Mira Grice Sheff, Minnesota; Brenda Hughes, Mississippi; Venkata Garikapaty, Missouri; Jessica Seberger, Nebraska; Sharon Smith Cooley, New Jersey; Sarah Schrock, New Mexico; Lauren Birnie, New York City; Grace Njau, North Dakota; Sara E. Thuma, Pennsylvania; Wanda Hernández, Puerto Rico; Karine Tolentino Monteiro, Rhode Island; Maggie Minett, South Dakota; Nicole Stone, Utah; Peggy Brozicevic, Vermont; Kenesha Smith, Virginia; Linda Lohdefinck, Washington; Melissa Baker, West Virginia; Fiona Weeks, Wisconsin; Lorie W. Chesnut, Wyoming; PRAMS Team, Women’s Health and Fertility Branch, Division of Reproductive Health, National Center for Chronic Disease Prevention and Health Promotion, CDC.
DISCLAIMER
The findings and conclusions in this report are those of the author(s) and do not necessarily represent the official position of the Centers for Disease Control and Prevention (CDC).
Footnotes
CONFLICTS OF INTEREST
The authors report no conflicts of interest.
DATA AVAILABILITY STATEMENT
PRAMS data are available for request by researchers at: https://www.cdc.gov/prams/prams-data/researchers.htm.
REFERENCES
- 1.Centers for Disease Control and Prevention, National Center for Health Statistics Underlying Cause of Death 1999-2019 on CDC WONDER Online Database, released in 2020. Data are from the Multiple Cause of Death Files, 1999-2019, as compiled from data provided by the 57 vital statistics jurisdictions through the Vital Statistics Cooperative Program. Accessed April 12 2021, http://wonder.cdc.gov/ucd-icd10.html
- 2.Driscoll AK, Ely DM. Declines in Infant Mortality in Appalachia and the Delta: 1995–1996 Through 2017–2018. Natl Vital Stat Rep. 2021;70(6):1–13. [Google Scholar]
- 3.Ely DM, Driscoll AK. Infant mortality in the United States, 2019: data from the period linked birth/infant death file. Natl Vital Stat Rep. 2021;6970(14):1–18. [PubMed] [Google Scholar]
- 4.Organisation for Economic Co-operation and Development. Infant mortality rates. 2020. https://data.oecd.org/healthstat/infant-mortality-rates.htm
- 5.Partridge S, Balayla J, Holcroft CAAH. Inadequate prenatal care utilization and risks of infant mortality and poor birth outcome: a retrospective analysis of 28,729,765 U.S. deliveries over 8 years. Am J Perinatol. 2012;29(10):787–793. doi: 10.1055/s-0032-1316439 [DOI] [PubMed] [Google Scholar]
- 6.Ebrahimvandi A, Hosseinichimeh N, Iams J. Understanding state-level variations in the US infant mortality: 2000 to 2015. Am J Perinatol. 2019;36(12):1271–1277. doi: 10.1055/s-0038-1675835 [DOI] [PubMed] [Google Scholar]
- 7.Office on Women’s Health. Prenatal care. 2020. https://www.womenshealth.gov/a-z-topics/prenatal-care
- 8.American Academy of Pediatrics, American College of Obstetricians and Gynecologists. Organization of Perinatal Health Care. In Kilpatrick SJ, Papile LA, Macones GA, Watterberg KL editors, Guidelines for Perinatal Care. 8th ed. American Academy of Pediatrics. 2017; pp.1–39. [Google Scholar]
- 9.Bhutta ZA, Das JK, Bahl R, et al. Can available interventions end preventable deaths in mothers, newborn babies, and stillbirths, and at what cost? Lancet. 2014;384:347–370. [DOI] [PubMed] [Google Scholar]
- 10.Blencowe H, Cousens S, Modell B, Lawn J. Folic acid to reduce neonatal mortality from neural tube disorders. Int J Epidemiol. 2010;39(Suppl 1):i110–i121. doi: 10.1093/ije/dyq028 [DOI] [PMC free article] [PubMed] [Google Scholar]
- 11.Bol KA, Collins JS, Kirby RS. Survival of infants with neural tube defects in the presence of folic acid fortification. Pediatrics. 2006;117(3):803–813. doi: 10.1542/peds.2005-1364 [DOI] [PubMed] [Google Scholar]
- 12.Centers for Disease Control and Prevention. Recommendations for the use of folic acid to reduce the number of cases of spina bifida and other neural tube defects. MMWR Recomm Rep. 1992;41(RR-14):1–7. [PubMed] [Google Scholar]
- 13.Crider KS, Bailey LB, Berry RJ. Folic acid food fortification - its history, effect, concerns, and future directions. Nutrients. 2011;3(3):370–384. doi: 10.3390/nu3030370 [DOI] [PMC free article] [PubMed] [Google Scholar]
- 14.Pineles BL, Hsu S, Park E, Samet JM. Systematic review and meta-analyses of perinatal death and maternal exposure to tobacco smoke during pregnancy. Am J Epidemiol. 2016;184(2):87–97. doi: 10.1093/aje/kwv301 [DOI] [PMC free article] [PubMed] [Google Scholar]
- 15.Crume T. Tobacco use during pregnancy. Clin Obstet Gynecol. 2019;62(1):128–141. doi: 10.1097/GRF.0000000000000413 [DOI] [PubMed] [Google Scholar]
- 16.United States Public Health Service Office of the Surgeon General. Smoking cessation: a report of the surgeon general. 2020. [Google Scholar]
- 17.American Academy of Pediatrics, Section on Breastfeeding. Breastfeeding and the use of human milk. Pediatrics. 2012;129(3):e827–e841. [DOI] [PubMed] [Google Scholar]
- 18.Victora C, Bahl R, Barros AJD, et al. Breastfeeding in the 21st century: epidemiology, mechanisms, and lifelong effect. Lancet. 2016;387(10017):475–490. doi: 10.1016/S0140-6736(15)01024-7 [DOI] [PubMed] [Google Scholar]
- 19.Sankar MJ, Sinha B, Chowdhur R, et al. Optimal breastfeeding practices and infant and child mortality: a systematic review and meta-analysis. Acta Paediatr. 2015;104(467):3–13. doi: 10.1111/apa.13147 [DOI] [PubMed] [Google Scholar]
- 20.Moon RY, Task Force on Sudden Infant Death Syndrome. SIDS and other sleep-related infant deaths: evidence base for 2016 updated recommendations for a safe infant sleeping environment. Pediatrics. 2016;138(5):e20162940. [DOI] [PubMed] [Google Scholar]
- 21.Task force on sudden infant death syndrome. SIDS and other sleep-related infant deaths: updated 2016 recommendations for a safe infant sleeping environment. Pediatrics. 2016;138(5):e20162938. doi: 10.1542/peds.2016-2938 [DOI] [PubMed] [Google Scholar]
- 22.Kochanek KD, Xu J, Arias E. Mortality in the United States, 2019. NCHS Data Brief. 2020;395:1–8. [PubMed] [Google Scholar]
- 23.March of Dimes. Prematurity campaign. 2020. https://www.marchofdimes.org/professionals/prematurity-collaborative.aspx [PMC free article] [PubMed]
- 24.Centers for Disease Control and Prevention. Perinatal quality collaboratives. 2020. https://www.cdc.gov/reproductivehealth/maternalinfanthealth/pqc.htm
- 25.Shulman HB, Gilbert BC, Lansky A. The Pregnancy Risk Assessment Monitoring System (PRAMS): current methods and evaluation of 2001 response rates. Public Health Rep. 2006;121(1):74–83. [DOI] [PMC free article] [PubMed] [Google Scholar]
- 26.Shulman HB, D’Angelo DV, Harrison L, Smith RA, Warner L. The Pregnancy Risk Assessment Monitoring System (PRAMS): overview of design and methodology. Am J Public Health. 2018;108(10):1305–1313. [DOI] [PMC free article] [PubMed] [Google Scholar]
- 27.Office of Disease Prevention and Health Promotion. Healthy People 2020: Maternal, Infant, and Child health. 2020. https://www.healthypeople.gov/2020/data-search/Search-the-Data#source=3564
- 28.US Department of Health and Human Services. National Performance Measures. 2020. [Google Scholar]
- 29.Centers for Disease Control and Prevention. Are PRAMS data available to outside researchers: Years of data available. Accessed May 26 2021, https://www.cdc.gov/prams/prams-data/researchers.htm
- 30.World Health Organization. Preterm Birth. Accessed March 25, 2021. https://www.who.int/news-room/fact-sheets/detail/preterm-birth
- 31.American Association for Public Opinion Research Standard definitions - final dispositions of case codes and outcome rates for surveys, 9th ed. https://www.aapor.org/AAPOR_Main/media/publications/Standard-Definitions20169theditionfinal.pdf
- 32.Bieler GS, Brown GG, Williams RL, Brogan DJ. Estimating model-adjusted risks, risk differences, and risk ratios from complex survey data. Am J Epidemiol. 2010;171:618–623. [DOI] [PubMed] [Google Scholar]
- 33.United States Census Bureau. Regional Offices. Accessed March 24, 2021 https://www.census.gov/about/regions.html
- 34.Ely DM, Driscoll AK. Infant mortality in the United States, 2017: data from the period linked birth/infant death file. Natl Vital Stat Rep. 2019;68(10):1–20. [PubMed] [Google Scholar]
- 35.Czajka JL, Beyler A. Declining Response Rates in Federal Surveys: Trends and Implications. Vol. 1. 2016. https://aspe.hhs.gov/system/files/pdf/255531/Decliningresponserates.pdf [Google Scholar]
- 36.Centers for Disease Control and Prevention. Methodology - PRAMS Model Protocol 2018 Version, https://www.cdc.gov/prams/methodology.htm
- 37.Christiansen-Lindquist L, Sahay K, Hogue CJR. Improving surveillance for the hidden half of fetal-infant mortality: a pilot study of the expansion of the Pregnancy Risk Assessment Monitoring System to include stillbirth. Ann Epidemiol. 2016;26(6):401–404. [DOI] [PMC free article] [PubMed] [Google Scholar]
- 38.DeSisto CL, Stone N, Algarin B, et al. Design and methodology of the Study of Associated Risks of Stillbirth (SOARS) in Utah. Public Health Rep. 2021;137(1):87–93. doi: 10.1177/0033354921994895 [DOI] [PMC free article] [PubMed] [Google Scholar]
Associated Data
This section collects any data citations, data availability statements, or supplementary materials included in this article.
Data Availability Statement
PRAMS data are available for request by researchers at: https://www.cdc.gov/prams/prams-data/researchers.htm.