Background
The COVID-19 (coronavirus disease 2019) pandemic is a global health emergency that is straining health care resources. Identifying patients likely to experience severe illness would allow more targeted use of resources. This study aimed to investigate the association between the thymus index (TI) on thorax computed tomography (CT) and prognosis in patients with COVID-19.
Methods
A multicenter, cross-sectional, retrospective study was conducted between March 17 and June 30, 2020, in patients with confirmed COVID-19. The patients' clinical history and laboratory data were collected after receiving a signed consent form. Four experienced radiologists who were blinded to each other and patient data performed image evaluation. The appearance of the thymus was assessed in each patient using 2 published systems, including the TI and thymic morphology. Exclusion criteria were lack of initial diagnostic thoracic CT, previous sternotomy, pregnancy, and inappropriate images for thymic evaluation. A total of 2588 patients with confirmed COVID-19 and 1231 of these with appropriate thoracic CT imaging were included. Multivariable analysis was performed to predict the risk of severe disease and mortality.
Results
The median age was 45 (interquartile range, 33–58) years; 52.2% were male. Two hundred forty-nine (20.2%) patients had severe disease, and 60 (4.9%) patients died. Thymus index was significantly associated with mortality and severe disease (odds ratios, 0.289 [95% confidence interval, 0.141–0.588; P = 0.001]; and 0.266 [95% confidence interval, 0.075–0.932; P = 0.038]), respectively. Perithymic lymphadenopathy on CT imaging had a significantly strong association with grades of TI in patients with severe disease and death (V = 0.413 P = 0.017; and V = 0.261 P = 0.002, respectively). A morphologically assessable thymus increased the probability of survival by 17-fold and the absence of severe disease by 12-fold.
Conclusion
Assessment of the thymus in patients with COVID-19 may provide useful prognostic data for both disease severity and mortality.
Key Words: computed tomography, COVID-19, thymus, thymus index
KEY POINT
Question
Is there an association between a surrogate of thymus function (thymus appearance on diagnostic imaging) and outcome in patients with COVID-19 (coronavirus disease 2019)?
Finding
In this study of 1231 patients with definite COVID-19 and thymus assessments through diagnostic imaging, 60 patients died, and 249 had severe disease. A very clear inverse relationship was identified between thymus appearance at diagnosis and both death and severe disease course.
Meaning
If this finding is confirmed in further studies, assessment of thymus appearance at diagnosis could allow better targeting of health care resources in the treatment of COVID-19.
What's Already Known About This Topic?
The role of the thymus on the immune system and measurement of the thymus in thorax computed tomography are well-known topics.
What Does This Article Add?
This study will make it possible to determine the prognosis of patients with COVID-19 and even to develop treatment methods by evaluating thymus index measurement. Few studies have investigated the thymus index and its relation to patients with COVID-19.
Severe acute respiratory syndrome coronavirus 2 (SARS-CoV-2), which cause novel coronavirus disease 2019 (COVID-19), has rapidly become a global pandemic. Clinical findings range from asymptomatic carriage and mild upper respiratory tract infection to fatal pneumonia.1,2
The thymus is critical to the development and maturation of naive T lymphocytes into the self-tolerant, mature, T-cell–mediated arm of the immune system and thus plays a central role in the adaptive arm of the immune response.3,4 The thymus is relatively large in infancy and naturally becomes smaller as the individual ages.3–5 As a result of thymic involution with age, the number of naive T cells decreases, which reduces the diversity of the T-cell antigen repertoire and culminates in disrupted T-cell homeostasis.6 The evidence of abnormal thymic structure or function may suggest impairment of the T-cell arm of the immune system.3,4 The thymus is visible on thorax computed tomography (CT), although it is frequently ignored clinically.
We hypothesized that thorax CT imaging would allow the assessment of thymus size and the thymus index (TI) so that a relationship between TI and COVID-19 severity could be investigated.
MATERIALS AND METHODS
Study Design and Participants
This cross-sectional, multicenter, retrospective study was conducted on patients with confirmed COVID-19 between March 17 and June 30, 2020, in 4 hospitals in Izmir, Turkey. The inclusion criteria were confirmed SARS-CoV-2 infection through reverse transcriptase–polymerase chain reaction (RT-PCR) from nasopharyngeal swabs and the presence of thoracic CT imaging. The exclusion criteria were the absence of thorax CT at diagnosis, history of prior sternotomy, pregnancy, and thoracic CT images not permitting accurate assessment of the thymus gland. Of the 2588 patients with confirmed COVID-19, 1259 had thorax CT obtained on presentation. Twenty-eight patients were excluded: history of prior sternotomy (n = 14), artifactual interference with thymus assessment (n = 5), and pregnancy (n = 9). The study was completed with a total of 1231 patients.
Ethical approval was granted by Izmir Bozyaka Education and Research Hospital Research Ethics Committee (reference no. 15345988). The study was nationally registered (2020-05-4/T204916XML) and approved by the Research Assessment Commission on COVID-19 of the Republic of Turkey, Ministry of Health, Directorate General of Health Services on May 4, 2020.
Definition of COVID-19 Severity
Severe disease was present when any of the following criteria were present: mechanical ventilation requirement, respiratory distress (≥30 breaths per minute for adults), oxygen saturation of 93% or less at rest, and/or ratio of arterial partial pressure of oxygen to fractional concentration of oxygen in inspired air of 40 kPa or less or more than 50% lesion progression over 24 to 48 hours on pulmonary imaging.1,7
Data Collection
Patient data, recorded from the day of admission until discharge or death, were obtained from hospital records. These included age, sex, demographics, clinical data, laboratory findings, and thoracic CT images. Implausible values were identified and clarified. Final data were double-checked by experienced researchers. All data and radiological findings were anonymized. This study followed the Strengthening the Reporting of Observational Studies in Epidemiology reporting guideline.
Laboratory Methods
Combined nasopharyngeal and oropharyngeal swab samples were taken from patients with suspected COVID-19 and sent to the Medical Microbiology Laboratory. Severe acute respiratory syndrome coronavirus 2 was detected using RT-PCR (Bio-Speedy SARS CoV-2 double gene RT-qPCR kit). Specifically, 2 target genes, including open reading frame 1ab (ORF1ab) and nucleocapsid protein (N), were tested during the RT-PCR assay. At least 1 swab was collected from each enrolled patient.
Blood tests involved routine measurement of complete blood counts (Beckman Coulter LH 780) and a variety of biochemical parameters (Roche Cobas 8000/6000, Sysmex CS 2500) as per hospital standard of care and national guidelines. Blood tests and chest CT were obtained on the first admission.
Thorax CT Imaging
Thoracic CT scans were independently evaluated by 4 radiologists with more than 7 years of experience each, with images being assessed by 2 of them, each blinded to the other's findings. The only patient data available to the assessors were age and sex. A third radiologist (C.S.), who was blinded to patient outcomes, adjudicated the final diagnosis if there was disagreement.
Thorax CT scans were performed on 3 different machines using the same standard protocol (Siemens Somatom Emotion Eco, Hannover, Germany [16 slices, gantry rotation time 0.5 seconds]; Toshiba Alexion, Tokyo, Japan [16 slices, gantry rotation time, 0.5 seconds]; General Electric Optima CT 660, Boston, MA [128 slices, gantry rotation time 0.35 seconds]). No intravenous contrast was used. A low-dose screening CT protocol was used (100 kVp, semiautomated mAs depending on the patient size). The slice thickness was reconstructed at 2 mm for parenchyma and 4 mm for the mediastinum.
All quantitative and qualitative parameters of the thymus were evaluated in a fixed mediastinal window setting (window level = 50 Hounsfield units [HU], window width = 350 HU) on a Picture Archiving and Communication System workstation. Lung involvement on thorax CT was simply classified into 2 groups: involvement of at least 1 lung region or no involvement.
There are several published scoring systems for thymus assessment.7,8 In this study, the thymus was evaluated using 2 different sets of qualitative parameters. The TI was described previously by Drabkin et al.7 TI assigns a grade based on the relative ratio of fat and soft tissue in the thymic plate: complete fatty replacement (grade 0) (Fig. 1) predominantly fat (grade 1) (Fig. 2), an equal mix of soft tissue and fat (grade 2) (Fig. 3), predominantly soft tissue (grade 3) (Fig. 4), and discrete confluent thymic tissue (grade 4) (Fig. 5). The second qualitative assessment was previously described by Araki et al5 and grades the thymus as follows: (a) pyramidal with convex margin, (b) pyramidal with straight margin, (c) pyramidal with concave margin, (d) round or oval, and (e) irregular. If thymus lobe morphology varied, the larger lobe was chosen for assessment. Computed tomography attenuation, as a measure of thymus tissue density, was assessed by placing an oval region of interest (ROI).5 All ROI values were recorded in HU.
FIGURE 1.
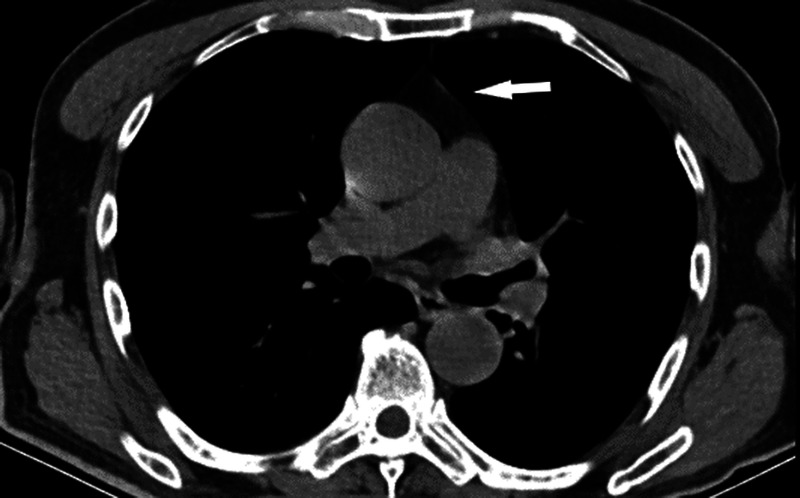
Axial unenhanced thorax CT at the level of the right pulmonary artery shows thymic gland attenuation grade 0. Complete fatty thymus gland degeneration (indicated by arrow) with patchy nodules shows blood vessels in the anterior mediastinum.
FIGURE 2.
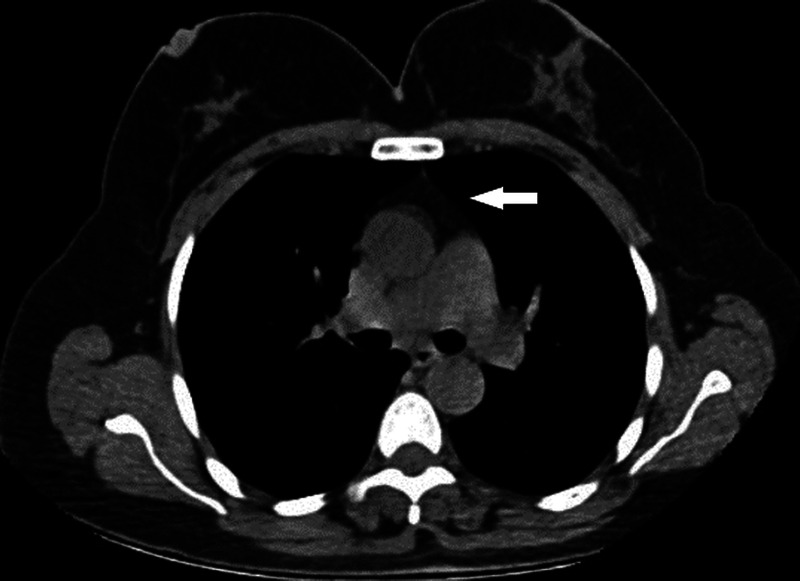
Axial unenhanced thoracic CT images show thymic gland tissue grade 1 (indicated by arrow). It is predominantly adipose tissue with reticulonodular remnants of the thymus.
FIGURE 3.
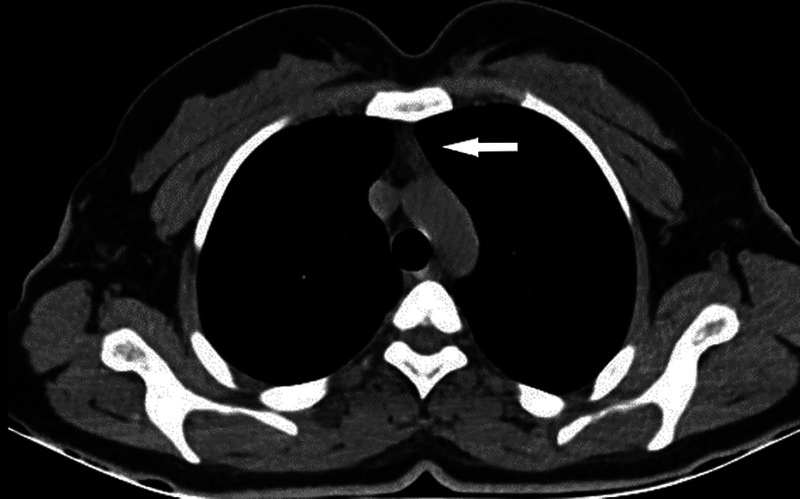
Axial unenhanced thoracic CT images with mediastinum window settings show a grade 2 thymus (indicated by arrow), with half soft tissue and half adipose tissue attenuation.
FIGURE 4.
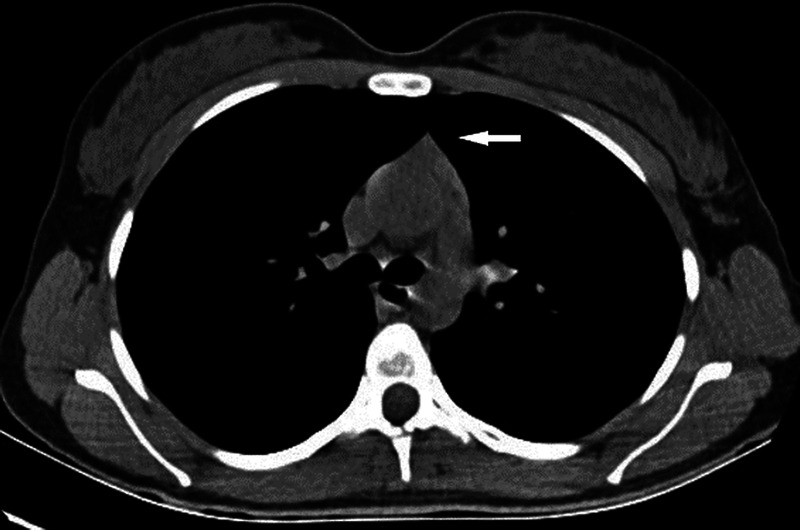
Image of the thorax CT with mediastinum window settings shows a grade 3 thymus. A solid triangular thymus (indicated by arrow). Predominant soft tissue attenuation with minimal fat spots.
FIGURE 5.
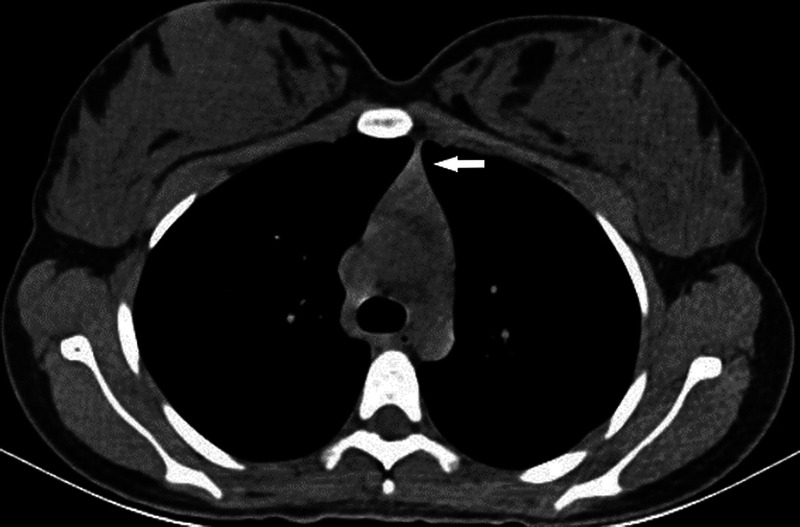
Axial unenhanced thoracic CT image shows discrete grade 4 confluent thymic gland tissue (indicated by arrow).
Lymph node involvement was evaluated and classified as those with anterior (perithymic) lymph node involvement (Figs. 6A–D), which is perithymic lymphadenopathy (PTL), and those without PTL, as previously described.8
FIGURE 6.
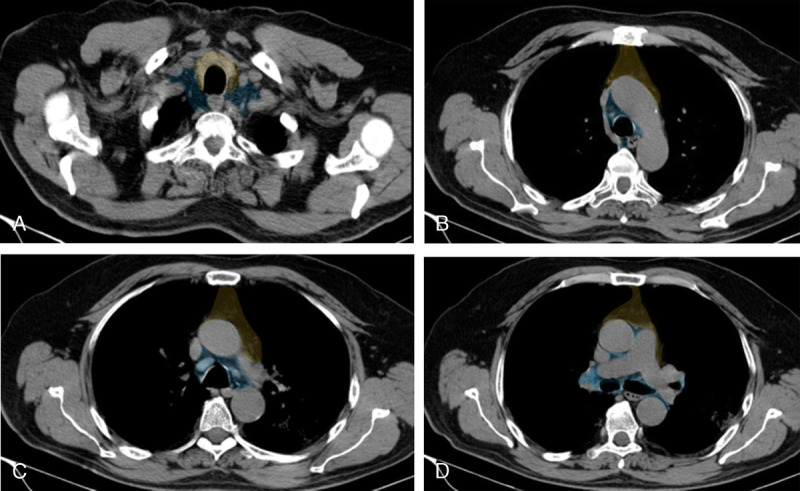
A, (Color overlay) Lymph node map. Axial noncontrast coned-down thorax CT with mediastinal window settings images at the level of thoracic inlet shows the anterior (perithymic) region (yellow) and deep (thoracic and cervical) region (blue). Images can be viewed in color online at www.jcat.org. B, (Color overlay) Lymph node map. Axial noncontrast coned-down thorax CT with mediastinal window settings images at the level of aortic arch shows the anterior (perithymic) region (yellow) and deep (thoracic and cervical) region (blue). Images can be viewed in color online at www.jcat.org. C, (Color overlay) Lymph node map. Axial noncontrast coned-down thorax CT with mediastinal window settings images at the level of aorta pulmonary window shows the anterior (perithymic) region (yellow) and deep (thoracic and cervical) region (blue). Images can be viewed in color online at www.jcat.org. D, (Color overlay) Lymph node map. Axial noncontrast coned-down thorax CT with mediastinal window settings images at the level of pulmonary arteries shows the anterior (perithymic) region (yellow) and deep (thoracic and cervical) region (blue). Figure 6 can be viewed online in color at www.jcat.org.
Statistical Analysis
All statistics were analyzed using either SPSS, version 25.0 (IBM Corp, Chicago, Ill) or MedCalc Statistical Software, version 19.5.3 (MedCalc Software Ltd, Ostend, Belgium; https://www.medcalc.org 2020). Categorical variables are presented as percentages, and continuous variables are presented as median (interquartile range [IQR]). Baseline characteristics were stratified according to predefined subgroups: died versus survived and severe disease versus without severe disease. Subgroups were evaluated using appropriate statistical tests, depending on data distribution. The risk of mortality and severe disease were investigated using univariate analyses for independent variables. Multivariate logistic regression analysis using backward stepwise regression was performed to investigate independent predictors of mortality and severe disease. For TI, interrater agreement was measured using Cohen κ. Area under the curve analysis was used to investigate the relationship between age and mortality/severe disease. P < 0.05 was considered significant.
RESULTS
Of the total of 1231 patients with a median age was 45 (IQR, 33–58; range 1–100) years, 643 (52.2%) were male. The characteristics of the patients according to who died and survived and those with and without severe disease are shown in Table 1. Nine hundred twenty-five (75.1%) patients were hospitalized at first presentation, and 306 (24.9%) were well enough to be sent home, with 1 of the 306 later developing severe disease and requiring hospitalization. One hundred sixteen (12.5%) of the hospitalized patients required intensive care unit/critical care unit care, and 63 (6.8%) of these were intubated. Two hundred forty-nine (20.2%) had severe disease, and 60 (4.9%) died in hospital settings. The median length of hospital stay was 7 (IQR, 4–12; maximum, 87) days.
TABLE 1.
Demographic and Clinical Characteristics of Patients With COVID-19 Who Died Compared With Those Who Survived and Who Had Severe Disease Compared With Those Who Did Not
| Patients Who Died (n = 60) | Patients Who Survived (n = 1171) | P | Patients With Severe Disease (n = 249) | Patients Without Severe Disease (n = 982) | P | |
|---|---|---|---|---|---|---|
| Age, median (IQR), y | 72 (63–82) | 44 (33–56) | <0.001 | 68 (53–75.5) | 41 (31–51) | <0.001 |
| Sex | 0.650 | 0.007 | ||||
| Male, n (%) | 33 (55) | 610 (52.1) | 150 (62.2) | 493 (50.2) | ||
| Female, n (%) | 27 (45) | 561 (47.9) | 99 (39.8) | 489 (49.8) | ||
| Underlying medical condition, patient no./total no. | ||||||
| Respiratory disease, n (%) | 14/60 (23.3) | 97/1167 (8.3) | 0.001 | 55/249 (22.1) | 56/978 (5.7) | 0.001 |
| Hypertension, n (%) | 29/60 (48.3) | 225/1166 (19.3) | <0.001 | 99/249 (39.8) | 155/977 (15.9) | <0.001 |
| Diabetes mellitus, n (%) | 25/60 (41.7) | 206/1166 (17.7) | <0.001 | 76/249 (30.5) | 155/977 (15.9) | <0.001 |
| Cardiovascular disease, n (%) | 13/60 (21.7) | 70/1166 (6.0) | <0.001 | 35/249 (14.5) | 48/977 (4.9) | <0.001 |
| History of cancer, n (%) | 9/60 (15) | 9/1166 (0.8) | <0.001 | 13/249 (5.2) | 5/977 (0.5) | <0.001 |
| Autoimmune disease, n (%) | 2/60 (3.3) | 25/1163 (2.1) | 0.558 | 7/248 (2.8) | 20/975 (2.1) | 0.472 |
| History of smoking, patient no./total no. (%) | 9/60 (15) | 248/1120 (22.1) | 0.174 | 35/241 (14.4) | 222/939 (23.6) | 0.002 |
| In long-term therapy with ACEI or ARBs, patient no./total no. (%) | 5/60 (8.3) | 56/1171 (4.8) | 0.230 | 25/249 (10) | 36/982 (3.7) | <0.001 |
| TI on chest CT, n (%) | <0.001 | <0.001 | ||||
| Grade 0 | 48 (80) | 324 (27.7) | 166 (66.7) | 206 (21) | ||
| Grade 1 | 9 (15) | 290 (24.8) | 61 (24.5) | 238 (24.2) | ||
| Grade 2 | 2 (3.3) | 265 (22.6) | 15 (6) | 252 (25.7) | ||
| Grade 3 | 1 (1.7) | 193 (16.5) | 6 (2.4) | 188 (19.1) | ||
| Grade 4 | 0 (0) | 99 (8.5) | 1 (0.4) | 98 (10) | ||
| Thymus morphology | <0.001 | <0.001 | ||||
| Not evaluable | 57 (95) | 615 (52.5) | 227 (91.2) | 445 (45.3) | ||
| Pyramidal with convex margin | 1 (1.7) | 163 (13.9) | 5 (2) | 159 (16.2) | ||
| Pyramidal with a straight margin | 1 (1.7) | 183 (15.6) | 10 (4) | 174 (17.7) | ||
| Pyramidal with concave margin | 1 (1.7) | 147 (12.6) | 6 (2.4) | 142 (14.5) | ||
| Round or oval | — | 44 (3.8) | — | 44 (4.5) | ||
| Irregular | — | 19 (1.6) | 1 (0.4) | 18 (1.8) | ||
| PTL on chest CT, patient no./total no. (%) | 20/60 (33.3) | 185/1165 (15.9) | 0.001 | 72/247 (29.1) | 133/978 (13.6) | <0.001 |
| Thymus density (ROI) on index chest CT (mean HU) | −53 (−74 to −14) | −15 (−58 to +2) | 0.037 | −63 (−85 to −16) | −11 (−55 to −3) | <0.001 |
| No. hospitalizations, n (%) | 60 (100) | 865 (73.9) | <0.001 | 248 (99.6) | 677 (68.9) | <0.001 |
| Length of hospital stay, median (IQR), d | 12 (4–25) | 4 (0–11) | <0.001 | 13 (8–18) | 6 (4–9) | <0.001 |
| ICU/CCU requirement, n (%) | 58 (96.7) | 58 (5.0) | <0.001 | 114 (45.8) | 2 (0.2) | <0.001 |
| Heart rate at admission, bpm | 84.0 (75.0–90.5) | 85.0 (78.0–94.0) | 0.384 | 86 (78–94) | 85 (78–94) | 0.465 |
| Need for high-flow oxygen, n (%) | 42 (70) | 80 (6.8) | <0.001 | 115 (46.2) | 7 (0.7) | <0.001 |
| Intubated during hospitalization, n (%) | 49 (81.7) | 3 (0.3) | <0.001 | 52 (20.9) | 0 (0) | <0.001 |
| Intubated in the prone position, n (%) | 10 (16.7) | 1 (0.1) | <0.001 | 11 (4.4) | 0 (0) | <0.001 |
| Need for supportive therapy, n (%) | 54 (90) | 5 (0.4) | <0.001 | 59 (23.7) | 0 (0) | <0.001 |
| Steroid therapy during hospitalization, n (%) | 11 (18.5) | 18 (1.5) | <0.001 | 23 (9.3) | 6 (0.6) | <0.001 |
| Azithromycin therapy, n (%) | 27 (45) | 476 (40.6) | 0.581 | 126 (50.6) | 377 (38.4) | <0.001 |
| Specific antiviral medication during hospitalization, n (%) | 59 (98.3) | 441 (37.7) | <0.001 | 157 (63.1) | 343 (34.9) | <0.001 |
| Immune modulator therapy, patient no./total no. (%) | 5/59 (8.5) | 19/1169 (1.6) | <0.001 | 18/248 (7.3) | 6/980 (0.6) | <0.001 |
| Anticoagulant therapy during hospitalization, n (%) | 47 (78.3) | 648 (55.3) | <0.001 | 211 (84.7) | 484 (49.3) | <0.001 |
ACEI, angiotensin-converting enzyme inhibitor; ARBs, angiotensin II receptor blockers; bpm, beats per minute; ICU/CCU, intensive care unit/cardiac care unit.
Age 60 years or older was significantly associated with mortality with 80% sensitivity and 79.6% specificity, and age 50 years or older was associated with severe disease with 80.7% sensitivity and 73% specificity (area under the curve = 0.831, P < 0.001) (Figs. 7A, B).
FIGURE 7.
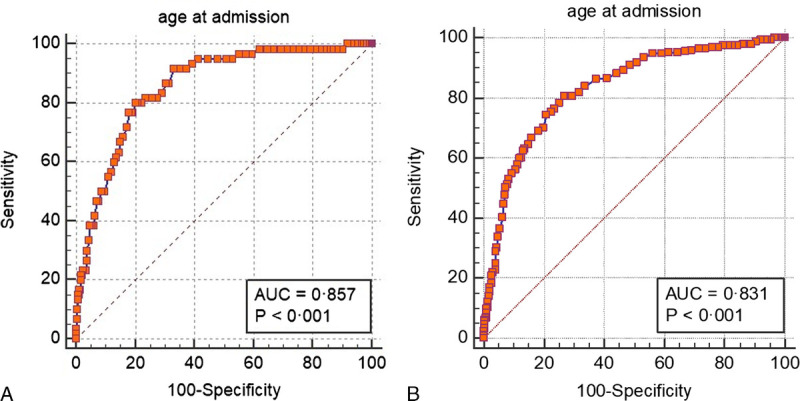
A, (Color chart) Receiver operating characteristic curve for age to predict mortality. Images can be viewed in color online at www.jcat.org. B, (Color chart) Receiver operating characteristic curve for age to predict severe disease. Figure 7 can be viewed online in color at www.jcat.org.
Interrater agreement for TI was 0.965 (κ, P < 0.001). In all patients in whom TI was assessable, the overall frequency (n) of grades was as follows: grade 0, 30.2% (n = 372); grade 1, 24.2% (n = 299); grade 2, 21.7% (n = 267); grade 3, 15.7% (n = 194); and grade 4, 8% (n = 99). Males tended to have lower TI grades; thus, the proportions of men and women at each grade were as follows: 31.4% versus 28.9% for grade 0, 28.1% versus 20.1% for grade 1, 21.8% versus 21.6% for grade 2, 12.6% versus 19.2% for grade 3, and 6.1% versus 10.2% for grade 4 (P < 0.001).
Mortality and severe disease tended to decrease as TI grade increased (both P < 0.001) (Table 1). Lung involvement was also statistically significantly related to TI. The proportions of lung involvement by TI grade were as follows: grade 0, 84.9%; grade 1, 67.6%; grade 2, 49.1%; grade 3, 35.6%; grade 4, 34.3% (P < 0.001). Overall, 752 (61.1%) patients had lung involvement that was related to outcome.
Interestingly, having fatal or severe diseases did not differ between TI grades for patients 60 years or older (P = 0.584 and P = 0.462, respectively). However, for patients younger than 60 years, having fatal (P < 0.028) and severe disease (P < 0.001) significantly differed by TI grade: grade 0 (3.6% and 26.1%), grade 1 (2% and 14.6%), grade 2 (0.4% and 5%), grade 3 (0.5% and 3.1%), grade 4 (0% and 1%), respectively.
Perithymic lymphadenopathy had a strongly significant association with grades of TI in patients with severe disease and death (V = 0.413 [P = 0.017] and V = 0.261 [P = 0.002], respectively) (Table 2).
TABLE 2.
Grade of Thymus Index and Perithymic Lymphadenopathy Counts of Those Who Died and Had Severe Disease
| Thymus Index Grade | Patients Who Died (n = 60) |
P | Patients With Severe Disease (n = 247) |
P | ||
|---|---|---|---|---|---|---|
| PTL Present (n = 20) | PTL Absent (n = 40) | PTL Present (n = 72) | PTL Absent (n = 175) | |||
| Grade 0, n (%) | 12 (60) | 36 (90) | 0.033 | 35 (48.6) | 130 (74.3) | 0.002 |
| Grade 1, n (%) | 7 (35) | 2 (5) | 0.001 | 26 (36.1) | 34 (19.4) | <0.001 |
| Grade 2, n (%) | 1 (5) | 1 (2.5) | 0.362 | 8 (11.1) | 7 (4) | 0.003 |
| Grade 3, n (%) | — | 1 (2.5) | 1.0 | 3 (4.2) | 3 (1.7) | 0.011 |
| Grade 4, n (%) | — | — | — | — | 1 (0.6) | — |
When patients were classified into those with and without assessable thymus morphology, CT-assessable thymus morphology was detected in 559 (45.4%) patients. Mortality and severe disease were reported in significantly fewer patients with assessable thymus morphology (patients who died n = 3 [5%] and patients with severe disease n = 22 [8.8%], both P < 0.001). Of note, the presence of a morphologically assessable thymus increased the likelihood of survival and freedom from severe disease by 17.18 times (95% confidence interval [CI], 5.35–55.16) and 12.45 times (95% CI = 7.9–19.63), respectively.
Variables at admission regarding mortality that were found to be significantly different in univariate analyses were subsequently investigated using multivariate logistic regression analysis. As the TI increased, the risk of death decreased by 73.5% and the risk of severe disease by 71.1% (Tables 3 and 4).
TABLE 3.
Multivariate Logistic Regression Analysis to Predict Mortality From COVID-19
| Independent Factors | P | Exp(B) | 95% CI | |
|---|---|---|---|---|
| Lower | Upper | |||
| History of cardiovascular disease | 0.040 | 7.219 | 1.091 | 47.786 |
| Absolute neutrophil count at admission | 0.006 | 7.314 | 1.770 | 30.232 |
| Platelet count at admission | 0.028 | 0.986 | 0.975 | 0.998 |
| BUN at admission, mg/dL | 0.001 | 1.066 | 1.025 | 1.109 |
| Creatinine at admission, mg/dL | 0.003 | 0.021 | 0.002 | 0.274 |
| AST at admission, mg/dL | 0.037 | 1.023 | 1.001 | 1.046 |
| TI at the index chest CT | 0.038 | 0.265 | 0.075 | 0.932 |
Variables entered on step 1: age at admission, systolic blood pressure at admission, diastolic blood pressure at admission, history of hypertension, history of diabetes mellitus, previous history of cardiovascular disease, cancer (any time), history of significant respiratory disease at admission, hemoglobin level at admission (g/dL), absolute platelet count (×103) at admission, absolute lymphocyte count (×103) at admission, absolute neutrophil count (×103) at admission, BUN at admission (mg/dL), creatinine at admission (mg/dL), CRP at admission, AST at admission, LDH at admission, sodium level at admission, troponin level at admission, PT at admission, TI at index chest CT, and perithymic mediastinal lymphadenopathy at the first thorax CT imaging.
AST indicates aspartate aminotransferase; BUN, blood urea nitrogen; CRP, C-reactive protein; LDH, lactate dehydrogenase; PT, prothrombin time.
TABLE 4.
Independent Factors for Prediction of Severe Disease From COVID-19 in Multivariate Logistic Regression Analysis
| Independent Factors | P | Exp(B) | 95% CI | |
|---|---|---|---|---|
| Lower | Upper | |||
| History of significant respiratory disease | 0.006 | 12.180 | 2.073 | 71.572 |
| Creatinine at admission, mg/dL | 0.017 | 7.333 | 1.434 | 37.501 |
| LDH at admission, U/L | 0.012 | 1.006 | 1.001 | 1.011 |
| Absolute neutrophil count at admission | 0.005 | 1.318 | 1.086 | 1.599 |
| TI at index chest CT | 0.001 | 0.289 | 0.141 | 0.588 |
Variables entered on step 17: age at admission, gender, hemoglobin at admission (g/dL), absolute lymphocyte count at admission (cells/μL), absolute platelet count (×103 cells/μL) at admission, absolute neutrophil count (×103 cells/μL) at admission, BUN at admission (mg/dL), creatinine at admission (mg/dL), CRP at admission, AST at admission, LDH at admission (U/L), troponin at admission, PT at admission, ACE inhibitors or ARBs, history of significant respiratory disease at admission, history of hypertension, history of diabetes mellitus, previous history of cardiovascular disease, current smoking, cancer (any time), perithymic mediastinal lymphadenopathy, and TI at index chest CT.
ACE indicates angiotensin-converting enzyme; ARBs, angiotensin II receptor blockers; AST, aspartate aminotransferase; BUN, blood urea nitrogen; CRP, C-reactive protein; LDH, lactate dehydrogenase; PT, prothrombin time.
DISCUSSION
The thymus is critical for normal immune system function, providing surveillance and protection against various pathogens.3,4,9 The immune function should also protect against SARS-CoV-2 but is ineffective in some patients and may even exacerbate the course of infection.2 The response of human T cells to SARS-CoV-2 is poorly understood because of the rapid progression of the pandemic.2,5 To understand whether the thymus gland has a protective effect against COVID-19, we examined thymic gland size in 1231 patients with RT-PCR–confirmed SARS-CoV-2 infections who also underwent thorax CT at admission to the hospitals.
In HIV-related studies, thymic function in particular has been characterized using various measures, including TI.8,9 Both the size and density of thymus-associated lymphoid tissue can be estimated on thorax CT.7,10 Individual differences in the thymus may explain some of the variability in morbidity and mortality associated with SARS-CoV-2 infections.3,11
There have been some reports about thymus size in patients with COVID-19.12 In a study by Çakmak et al,12 the degrees of thymus fat involution were evaluated in thoracic CT results of 87 patients with confirmed COVID-19, and a statistically significant correlation was found between increased thymus fat component and the presence of COVID-19 lung involvement in CT (r = 0.461). This is the first study to demonstrate an association between COVID-19 morbidity and mortality and thymus gland structure as assessed using CT scans. There was a significant difference in outcomes between patients with and without CT-assessable thymus morphology. Almost all deceased patients and severely ill patients had no CT-assessable thymus gland, and TI was an independent predictor of outcome and decreased the risk of death and severe disease by nearly 70%. None of the patients with grade 4 TI died, and the only 1 patient who died who had grade 3 thymic gland already had cancer and was receiving chemotherapy. Two deceased patients with grade 2 TI also had severe comorbidities. Furthermore, patients with severe COVID-19 with grades 3 and 4 TI in thorax CT images also had preexisting respiratory disease or perithymic lymph node involvement.
There was no mortality among patients with a morphologically assessable thymus aged 1 to 19 years (n = 57); there was 1 death in the 20- to 29-year age group (n = 162) and 1 death each in the 50- to 59-year (n = 27) and 60- to 69-year (n = 6) age groups. By contrast, there were no deaths among patients younger than 30 years without morphologically assessable thymus on thorax CT, but mortality increased steadily in subsequent age groups, from 1.7% in patients aged 30 to 39 years to 28.2% in patients aged 80 to 100 years.
Thymic involution tends to be more pronounced in male than in female patients, and this is consistent with data showing that male patients have a more difficult clinical course of severe COVID-19.1,13–15 In the present study, severe disease was more common in males (23.3% vs 16.8%, P = 0.005), although mortality rates were similar (5.1% vs 4.6%, P = 0.660).
The SARS-CoV-2 infection primarily involves the respiratory system but can also damage other systems.16 The thymus can be attacked by pathogens including viruses, resulting in altered thymic function, acute thymic involution, and thus likely altered peripheral T-lymphocyte function.4,17–19 In this study, some patients with evaluable thymic tissue, despite having no significant comorbidity, had severe disease. The majority of this subset of patients had evidence of PTL on imaging. This association was most striking in patients with grade 1 TI, such that mortality varied from 0.9% in patients without signs of PTL to 9.5% in those with PTL. Of note, in the presence of PTL, there was an increased likelihood of severe disease in all TI grades, except grade 4. Severe disease occurred in patients with PTL despite the presence of thymus tissue. We hypothesize that, although thymic function is critical for a successful immune response to SARS-CoV-2, the involvement of thymus-associated lymphatic tissue may be associated with an unfavorable prognosis, particularly in patients with some degree of involution.
Our study has some limitations; patients who did not undergo thorax CT at index enrollment for any reason were not included in this analysis. Thus, some patients with mild disease were excluded and remained so because one of the inclusion criteria was having laboratory-confirmed COVID-19 and thorax CT, which also excluded patients who were referred from another hospital for any reason. Therefore, the results of this study cannot be generalized to all patients with COVID-19. In addition, another limitation of the study is that obesity, a significant risk factor for severe COVID-19, was not considered. During the study period, because of the high number of patients with COVID-19 in our country and the workload of hospital staff, the weight and height information of some patients could not be reached.
CONCLUSION
In this cohort of patients with laboratory-confirmed COVID-19 referred for thoracic evaluation at initial admission, a highly significant inverse association was found between the presence and appearance of the thymus and disease severity and mortality. To our knowledge, this is the first study to show such an association between TI and COVID-19 severity. The presence of a greater proportion of normal thymic tissue was an important protective factor. Thymus index, a surrogate of thymic function, was found to be a strong independent predictor of mortality and severe disease. We hypothesize that, if this association is confirmed in large COVID-19 cohorts, diagnostic imaging at presentation may allow more effective targeting of treatment and health care resources to patients at higher risk for severe disease progression or death. If effective treatment models become available, thymic examination could indicate priority recipients for potentially limited supplies of vaccine.
Footnotes
Author Contributions: Substantial contributions to the conception or design of the work or the acquisition, analysis, or interpretation of data for the work: all authors. Drafting the work or revising it critically for important intellectual content: all authors. Final approval of the version to be published: all authors. All authors take responsibility for the article. It acknowledges the contributions of other authors and the publication of the article in this form. All authors approved the final manuscript as submitted and agree to be accountable for all aspects of the work.
The authors declare no conflict of interest.
No funding was secured for this study.
Ethics committee approval was obtained. All authors have given consent for the study to be published in the Journal of Computer Assisted Tomography.
Contributor Information
Ocal Berkan, Email: ocalberkan@hotmail.com.
Ilker Kiziloğlu, Email: ilkerkiziloglu@gmail.com.
Lale Duman, Email: laleemin@gmail.com.
Mehmet Bozkurt, Email: drmbozkurt@hotmail.com.
Zehra Adibelli, Email: adibellizehra@gmail.com.
Guray Oncel, Email: gurayoncel@hotmail.com.
Nevsin Berkan, Email: nberkan14@ku.edu.tr.
Yildiz Ekemen Keles, Email: kutupylz@hotmail.com.
Jeremy H. Jones, Email: jezhjones@gmail.com.
Abdurrahman Hamdi Inan, Email: ahamdiinan@gmail.com.
Cihan Solak, Email: cihansolak@yahoo.com.
Mustafa Emiroğlu, Email: musemiroglu@gmail.com.
Mehmet Yildirim, Email: mehmetyildi@gmail.com.
Ayberk Dursun, Email: dursunayberk845@gmail.com.
Enver Ilhan, Email: enverhan60@gmail.com.
Asuman Camyar, Email: asuerden@yahoo.com.
Ozge Inceer, Email: drozgeinceer@gmail.com.
Ahmet Nart, Email: ahmetnart@yahoo.com.
Mehmet Birhan Yilmaz, Email: cardioceptor@gmail.com.
REFERENCES
- 1.Zhang J Wang M Zhao M, et al. The clinical characteristics and prognosis factors of mild-moderate patients with COVID-19 in a mobile cabin hospital: a retrospective, single-center study. Front Public Health. 2020;8:264. [DOI] [PMC free article] [PubMed] [Google Scholar]
- 2.Azkur AK Akdis M Azkur D, et al. Immune response to SARS-CoV-2 and mechanisms of immunopathological changes in COVID-19. Allergy. 2020;75:1564–1581. [DOI] [PMC free article] [PubMed] [Google Scholar]
- 3.Thomas R, Wang W, Su D-M. Contributions of age-related thymic involution to immunosenescence and inflammaging. Immun Ageing. 2020;17:2. [DOI] [PMC free article] [PubMed] [Google Scholar]
- 4.Albano F Vecchio E Renna M, et al. Insights into Thymus development and viral thymic infections. Viruses. 2019;11:836. [DOI] [PMC free article] [PubMed] [Google Scholar]
- 5.Araki T Nishino M Gao W, et al. Normal thymus in adults: appearance on CT and associations with age, sex, BMI and smoking. Eur Radiol. 2016;26:15–24. [DOI] [PMC free article] [PubMed] [Google Scholar]
- 6.Rezzani R Nardo L Favero G, et al. Thymus and aging: morphological, radiological, and functional overview. Age (Dordr). 2014;36:313–351. [DOI] [PMC free article] [PubMed] [Google Scholar]
- 7.Drabkin MJ Meyer JI Kanth N, et al. Age stratified patterns of thymic involution on multidetector CT. J Thorac Imaging. 2018;33:409–416. [DOI] [PubMed] [Google Scholar]
- 8.Rb-Silva R Nobrega C Azevedo C, et al. Thymic function as a predictor of immune recovery in chronically HIV-infected patients initiating antiretroviral therapy. Front Immunol. 2019;10:25. [DOI] [PMC free article] [PubMed] [Google Scholar]
- 9.Kolte L Dreves A-M Ersbøll AK, et al. Association between larger thymic size and higher thymic output in human immunodeficiency virus–infected patients receiving highly active antiretroviral therapy. J Infect Dis. 2002;185:1578–1585. [DOI] [PubMed] [Google Scholar]
- 10.Thapa P, Farber DL. The role of the thymus in the immune response. Thorac Surg Clin. 2019;29:123–131. [DOI] [PMC free article] [PubMed] [Google Scholar]
- 11.Swadling L, Maini MK. T cells in COVID-19—united in diversity. Nat Immunol. 2020;21:1307–1308. [DOI] [PubMed] [Google Scholar]
- 12.Çakmak V Yilmaz A Sari T, et al. Evaluation of the chest computed tomography and hemogram data in patients with COVID-19: the importance of thymus. Turk J Med Sci. 2021;51:991–1000. [DOI] [PMC free article] [PubMed] [Google Scholar]
- 13.Chaudhry MS Velardi E Dudakov JA, et al. Thymus: the next (re)generation. Immunol Rev. 2016;271:56–71. [DOI] [PMC free article] [PubMed] [Google Scholar]
- 14.Pangrazzi L, Weinberger B. T cells, aging and senescence. Exp Gerontol. 2018;134:110887. [DOI] [PubMed] [Google Scholar]
- 15.Pido-Lopez J, Imami N, Aspinall R. Both age and gender affect thymic output: more recent thymic migrants in females than males as they age. Clin Exp Immunol. 2001;125:409–413. [DOI] [PMC free article] [PubMed] [Google Scholar]
- 16.Zhang Y Geng X Tan Y, et al. New understanding of the damage of SARS-CoV-2 infection outside the respiratory system. Biomed Pharmacother. 2020;127:110195. [DOI] [PMC free article] [PubMed] [Google Scholar]
- 17.Nunes-Alves C Nobrega C Behar SM, et al. Tolerance has its limits: how the thymus copes with infection. Trends Immunol. 2013;34:502–510. [DOI] [PMC free article] [PubMed] [Google Scholar]
- 18.Savino W. The thymus is a common target organ in infectious diseases. PLoS Pathog. 2006;2:e62. [DOI] [PMC free article] [PubMed] [Google Scholar]
- 19.Tian W Jiang W Yao J, et al. Predictors of mortality in hospitalized COVID-19 patients: a systematic review and meta-analysis. J Med Virol. 2020;92:1875–1883. [DOI] [PMC free article] [PubMed] [Google Scholar]


