Abstract
The commonalities and differences in cell-type-specific pathways that lead to Alzheimer disease (AD) and Parkinson disease (PD) remain unknown. Here, we performed a single-nucleus transcriptome comparison of control, AD and PD striata. We describe three astrocyte subpopulations shared across different brain regions and evolutionarily conserved between humans and mice. We reveal common features between AD and PD astrocytes and regional differences that contribute toward amyloid pathology and neurodegeneration. In contrast, we found that transcriptomic changes in microglia are largely unique to each disorder. Our analysis identified a population of activated microglia that shared molecular signatures with murine disease-associated microglia (DAM) as well as disease-associated and regional differences in microglia transcriptomic changes linking microglia to disease-specific amyloid pathology, tauopathy and neuronal death. Finally, we delineate undescribed subpopulations of medium spiny neurons (MSNs) in the striatum and provide neuronal transcriptomic profiles suggesting disease-specific changes and selective neuronal vulnerability.
Neurodegenerative disorders such as AD, PD, Huntington disease and amyotrophic lateral sclerosis are all characterized by the aggregation and deposition of abnormal proteins1,2. However, the composition of protein aggregates is unique and distinct to each disorder. For example, intracellular neurofibrillary tangles (NFTs) formed by hyperphosphorylated tau proteins and extracellular Aβ plaques generated from amyloid precursor protein (APP) are hallmarks of AD, whereas Lewy bodies resulting from misfolded α-synuclein proteins occur in PD. These observations suggest there are both common and divergent mechanisms of neurodegenerative pathogenesis, but the identity of these pathways remains mysterious.
Damage to the basal ganglia occurs in many neurodegenerative diseases, including AD, PD and Huntington disease3, yet little is known about the underlying molecular mechanisms. The striatum, which comprises of the caudate and putamen, is the main input structure of the basal ganglia, which is crucial for motor learning and a variety of cognitive functions. Striatal Aβ plaques and NFT deposits, and a reduction in striatal volume, are common features of AD and PD. However, cortical amyloid plaques appear early in the disease and are present in many nondemented older adults, whereas striatal plaques usually occur at later stages of AD and largely after dementia onset4–6. Furthermore, the neuronal heterogeneity of the human striatum has not been characterized in detail, and the vulnerability of neuronal populations remains unclear. To answer these questions, we used single-nucleus RNA sequencing (snRNA-seq) to compare transcriptomes from postmortem striata of well-characterized cognitively normal controls, AD and PD cases and with previously published transcriptomes from postmortem entorhinal cortex (ec)7, anterior cingulate cortex (acc)8 and prefrontal cortex (pfc)9,10. We identified evolutionarily conserved astrocyte and microglia subpopulations shared across different disease conditions and multiple brain regions. We further describe unique human astrocyte and microglia activation states, their regional differences in transcriptomic changes in disease conditions and their contributions to Aβ pathology, tauopathy and neuronal death. Finally, we observed greater striatal MSN heterogeneity than previously shown11,12 and neuronal transcriptomic profiles that indicate disease-specific changes and selective neuronal vulnerability.
Results
The single-nucleus transcriptomes of human AD and PD brains
We selected the precommissural putamen postmortem brains of four patients with AD, four patients with PD and four control cases matched for sex, age (range 69–85.4 years) and postmortem interval (Methods, Extended Data Fig. 1a,b and Supplementary Table 1). We obtained 30,908 high-quality single-nucleus gene expression profiles after quality filtering and doublets removal with a comparable number of cells, genes and transcripts across diagnostic groups (Extended Data Fig. 1b). We performed unsupervised clustering using Seurat13 and mapped clusters to six major cell types by comparing conserved marker genes (markers that are conserved among the groups of AD, PD and controls) with the expression patterns of known cell-type-specific markers, including astrocytes (AQP4, SLC1A2), endothelial cells and pericytes (FLT1, RGS5), immune cells (CSF1R, PTPRC, RUNX1), neurons (RBFOX1, RBFOX3, SYT1), oligodendrocytes (MBP, PLP1) and oligodendrocyte precursor cells (PCDH15, MEGF11 and VCAN) (Fig. 1a,b and Extended Data Fig. 1c,d). Clustering was not driven by experimental batch or individual samples, and the percentage of cells from each case that make up each cluster was not statistically different across the groups (Extended Data Fig. 1e–g).
Fig. 1 |. Characterization of six major cell types and three distinct astrocyte subpopulations.
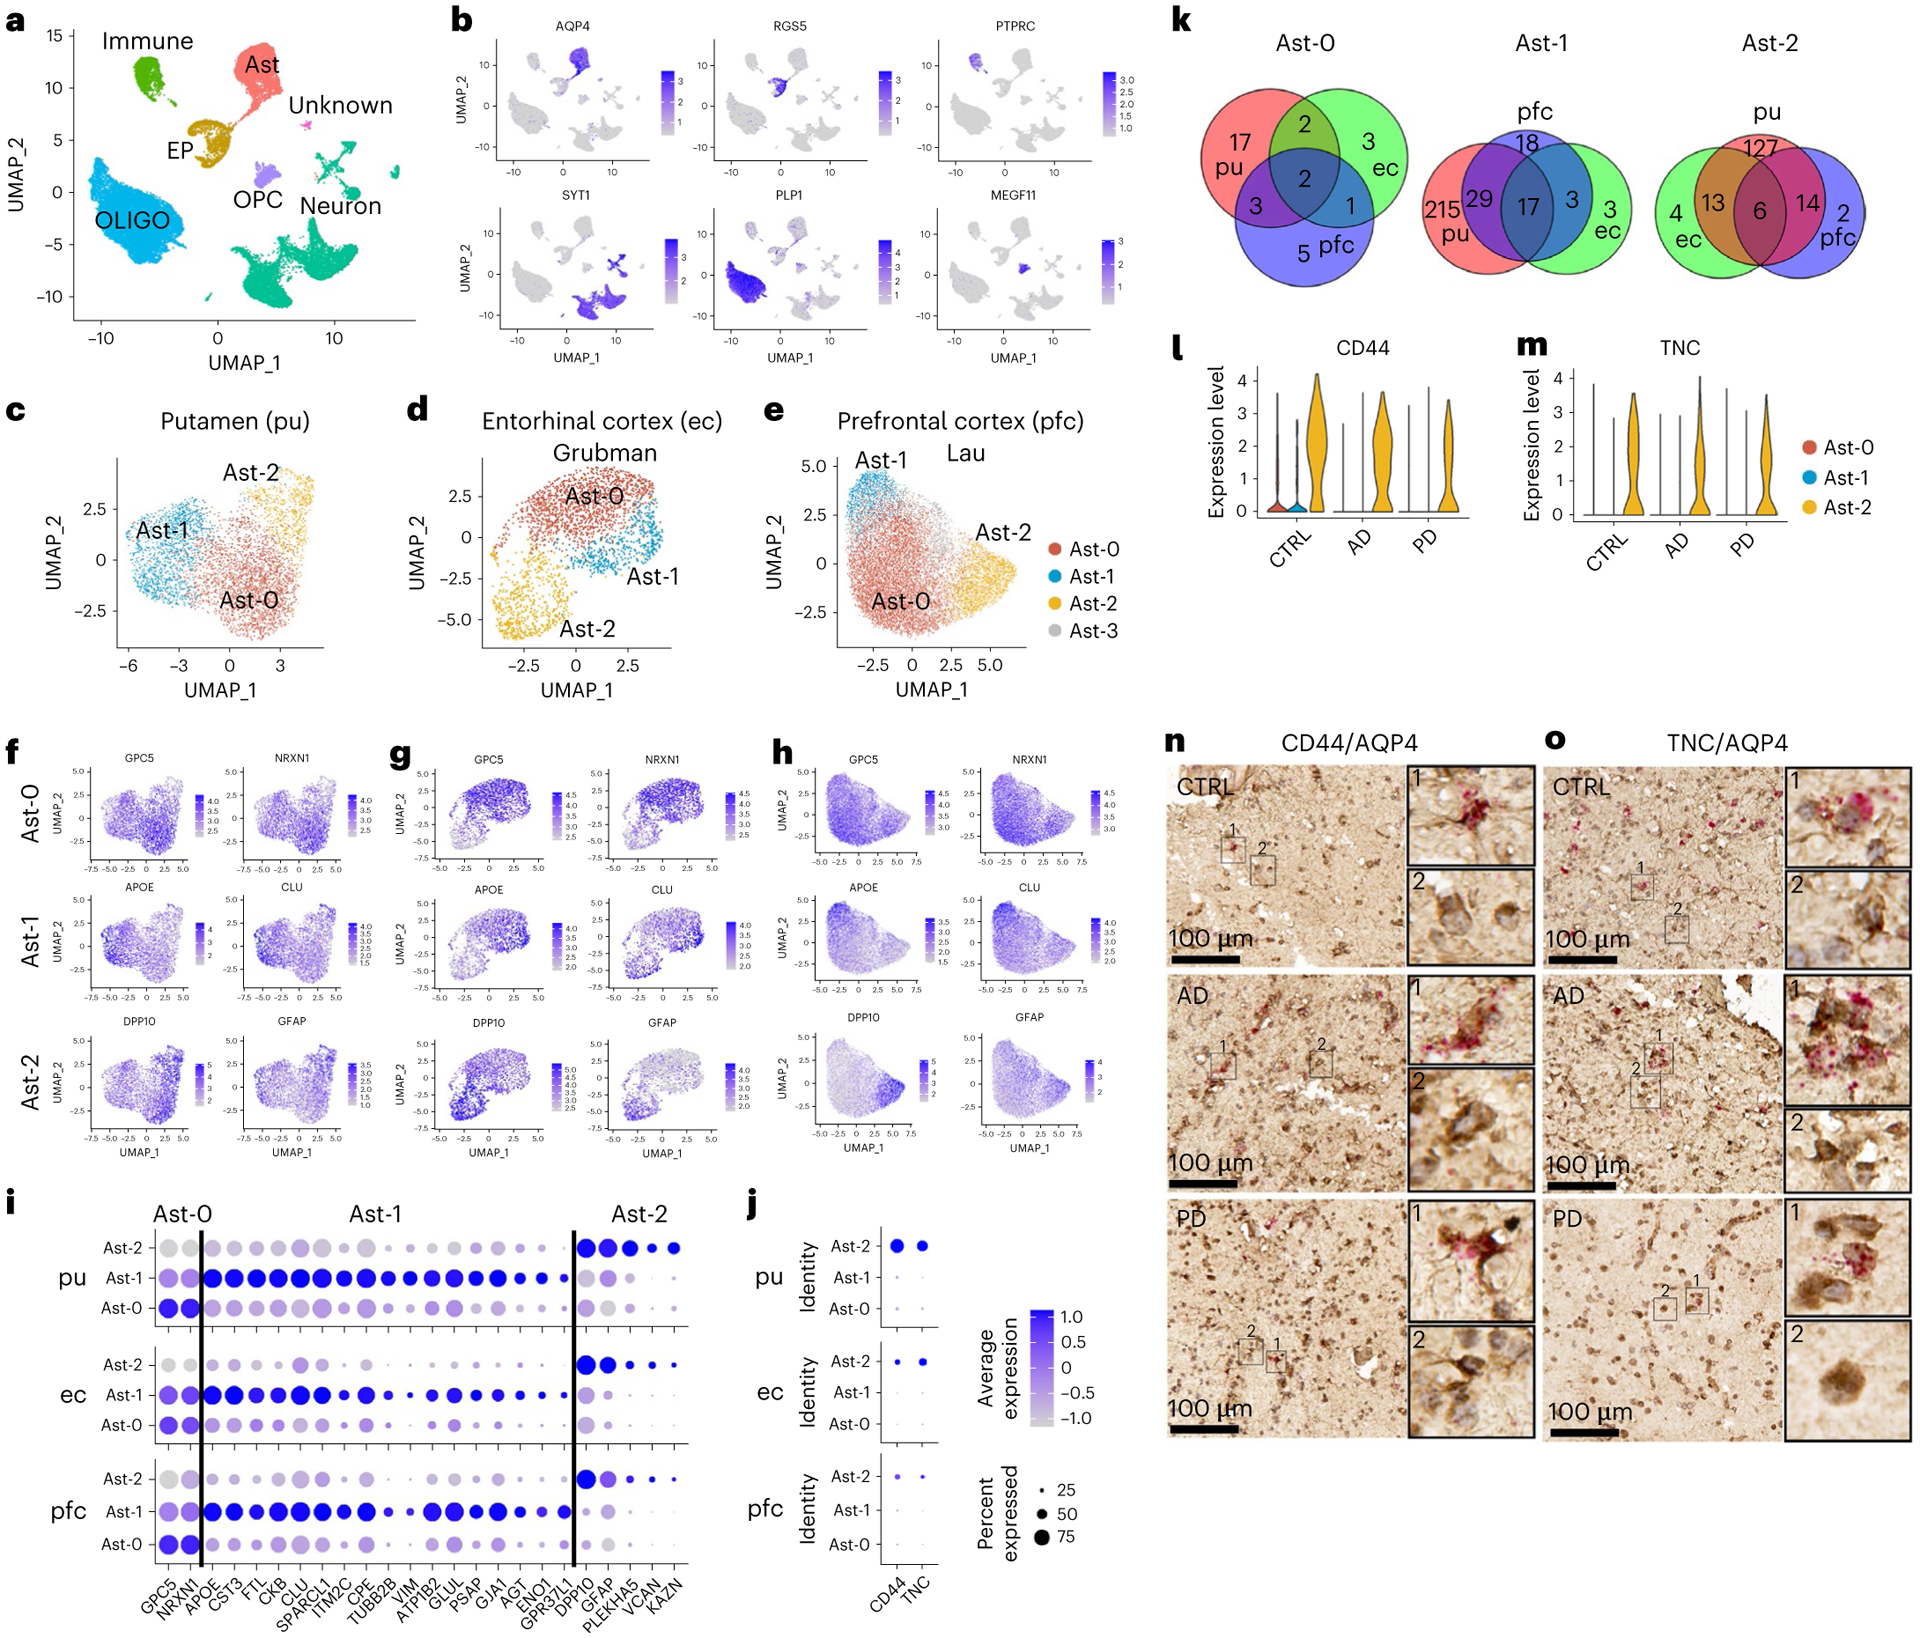
a, Unsupervised clustering of snRNA-seq data and UMAP (Uniform Manifold Approximation and Projection) plot of all cells from putamen (pu) colored by cluster identity. UMAP plots were generated using default parameters except reduction = ’pca’, dims = 1:20. b, UMAP plot of all cells colored by marker gene expression levels. c–e, UMAP visualization of astrocyte subpopulations colored by cluster identity for putamen (c; total nuclei: control 1,203, AD 1,642, PD 1,433), ec (d; control 1,660, AD 702) and pfc (e; control 6,109, AD 7,144) astrocytes. f–h, UMAP visualization of astrocyte subpopulations colored by conserved marker gene expression levels for putamen (f), ec (g) and pfc astrocytes (h). i,j, Dot plot of conserved marker genes (i) and CD44 and TNC expression levels (j) in Ast-0, Ast-1 and Ast-2 astrocytes from the three brain regions. k, Venn diagram demonstrating overlap of conserved marker genes among the three brain regions for each astrocyte subpopulation. l,m, Violin plot showing the expression of Ast-2 conserved marker genes CD44 (l) and TNC (m) measured by snRNA-seq. n,o, CD44 (n) and TNC (o) expression validated by RNAScope in situ hybridization together with AQP4 immunohistochemistry staining in the putamen of control, AD and PD samples. CD44 and TNC, red; AQP4, tan. For all data, the experiment was performed once. FindConservedMarkers using Wilcoxon rank sum test and metap R package with meta-analysis combined P value < 0.05. Scale bars, 100 μm. CTRL, control; immune, immune cell; Ast, astrocyte; EP, endothelial cell and pericyte; OLIGO, oligodendrocytes; OPC, oligodendrocyte precursor cell.
Conserved existence of three distinct astrocyte subtypes
We first examined if there were distinct populations of astrocytes in our samples. We selected the parameters resulting in the most stable clustering (dimensionality = 15, resolution = 0.25, adjusted rand index = 0.96; Extended Data Fig. 2a), for all downstream analyses. Subclustering analysis of all astrocyte nuclei revealed three subpopulations: Ast-0 (n = 2,301), Ast-1 (n = 1,338) and Ast-2 (n = 638) (Fig. 1c). Twenty-four genes for Ast-0 (for example GPC5, NRXN1); 261 genes for Ast-1, including AD risk genes APOE, CLU and APOC1 and 160 genes for Ast-2 (for example, DPP10, GFAP) were identified to be conserved marker genes for the given cell types (Fig. 1f,i,k and Supplementary Tables 2–4). CD44 and TNC were uniquely enriched in Ast-2 cells (Fig. 1j,l,m). AQP4 immunohistochemistry staining combined with CD44 or TNC mRNA RNAscope in situ hybridization in the adjacent tissue sections of control, AD and PD samples analyzed by snRNA-seq confirmed the existence of the Ast-2 astrocytes in both the putamen (Fig. 1n,o) and the white matter tissue of the internal capsule in all three groups (Extended Data Fig. 2f,g). The conservation of these marker genes among all groups suggested there are three distinct astrocyte subpopulations regardless of disease status.
To determine whether astrocyte subpopulations identified in the striatum existed in other human brain regions, we analyzed data from previously published snRNA-seq studies using the same parameters. Grubman et al.7 sampled the ec of six patients with AD and six matched controls. Three astrocyte subpopulations were detected (Fig. 1d) with 4/8 (50%), 20/23 (87%, P value = 6.1 × 10⁻³¹), 19/23 (82.6%, P value = 2.2 × 10−40, hypergeometric test) conserved marker genes overlapped with those identified in the putamen (Fig. 1g,i,k and Supplementary Tables 5–7). Lau et al.9 sampled pfc tissues from 12 patients with AD and nine matched controls and identified four astrocyte subpopulations (Fig. 1e). The first three most abundant populations had 5/11 (45%), 46/67 (68.7%, P value =1.1 × 10−77), 20/22 (90.9%, P value = 2.7 × 10−44, hypergeometric test) conserved marker genes (Supplementary Tables 8–10) that overlapped with those identified in the putamen (Fig. 1h,i,k). We further validated the existence of the three astrocyte subpopulations in the pfc of a much larger AD cohort with 24 patients with AD and 24 matched controls (referred to as ‘AD pfc Mathys’ data)10 as well as in the acc samples from a Lewy body disease (LBD) cohort of 28 cases, including healthy controls, PD, PD dementia and dementia with Lewy bodies (n = 7 per group, referred to as ‘LBD acc Feleke’ data)8. Most of the conserved marker genes were shared by the astrocyte subpopulations in these two datasets (Extended Data Fig. 3a–f), although some genes were not detected or did not reach statistical significance in the pfc Mathys data, likely due to the low cell numbers and sequencing depth (Supplementary Table 11). Therefore, the three astrocyte populations identified in the putamen also present in the other three brain regions. Cell clustering was not driven by experimental batch or by individual samples, and the percentage of cells from each sample was not statistically different between AD and controls for any of the datasets (Extended Data Figs. 2b–e and 3g,i,k).
The three human astrocyte subpopulations resembled the Gfap-low, disease-associated astrocyte (DAA) and Gfap-high astrocytes identified in the mouse hippocampi14. Gfap-low astrocytes and human Ast-0 share the marker gene features GPC5 and NRXN114 (Fig. 1f,i). Analysis of DAA and Gfap-high astrocyte marker gene expression in the putamen astrocytes and the principal-component analysis (PCA) using all distinguishing marker genes (Extended Data Fig. 4a–c) indicated that although human and mouse astrocytes differ substantially, Ast-1 was more similar to DAA, whereas Ast-2 was more similar to the Gfap-high astrocytes. These results demonstrate homology among human Ast-0, Ast-1 and Ast-2 astrocytes with murine Gfap-low, DAA and Gfap-high astrocytes, respectively.
Three astrocyte subsets represent distinct activation states
The expression levels of reactive astrocyte markers15 S100B, VIM, MT2A, MT1E, CRYAB and MT1G were significantly higher in putamen Ast-1 than in the other two cell populations in all three diagnostic groups (Extended Data Figs. 4b,d and Supplementary Table 3). Meanwhile, GFAP, CD44, C3, SYNM and MAOB were more highly expressed in Ast-2 compared to the other two populations in all groups (Fig. 1i,l and Extended Data Fig. 4d). These observations suggested that Ast-1 and Ast-2 both represented activated astrocytes with distinct activation states whereas Ast-0 represented homeostatic astrocytes. VIM, MT2A and MT1E were also highly expressed in the pfc Ast-1 in both AD and controls, suggesting shared astrocyte activation features in different brain regions (Extended Data Fig. 4e and Supplementary Table 9). There were no consistent expression differences between cell clusters across diagnostic groups for murine A1-and A2-specific reactive astrocyte marker or signaling pathway genes (Extended Data Fig. 4f)16,17, suggesting that Ast-1 and Ast-2 represent astrocyte activation states distinct from A1 or A2 states.
Regional divergence of the astrocyte transcriptomes
The identification of homologous astrocyte subpopulations provides an opportunity to compare gene expression patterns across different brain regions. Some genes had conserved expression patterns between putamen and one brain region but not the other (Fig. 2a,b). Gene Ontology (GO) and KEGG (Kyoto Encyclopedia of Genes and Genomes) pathway enrichment analysis on the conserved cluster marker genes revealed unique enrichment of GO terms for each putamen astrocyte subpopulation (Extended Data Fig. 4g), suggesting distinct functions of each. Pathways including the regulation of apoptotic signaling and gliogenesis were shared among Ast-1 from all three brain regions (Fig. 2d and Extended Data Fig. 4g), supporting their common functionality. However, the majority of top 10 KEGG terms and disease-related GO terms were highly enriched for the putamen Ast-1 marker genes only (Fig. 2c,d), such as multiple neurodegenerative disease pathways, amyloid fibril formation, tau protein binding, ferroptosis, regulation of inflammatory response and neuron death pathways. These pathways include AD and PD risk genes such as APOE and PARK7 and genes encoding proteins such as metallothionein protein MT3, superoxide dismutase 1 (SOD1) and stress-inducible heat shock protein HSP90AB1. These proteins can be secreted extracellularly by astrocytes to protect neurons from the toxic effect of Aβ, dopamine quinone neurotoxicity or oxidative stress18–21 suggesting a potential neuroprotective role of Ast-1. In summary, our results suggest that homologous astrocyte subpopulations from different brain regions may share certain functionalities but also have differences that may contribute to regional differences in neuronal vulnerability, amyloid pathology and tauopathy.
Fig. 2 |. Transcriptomic comparison of astrocyte subpopulations.
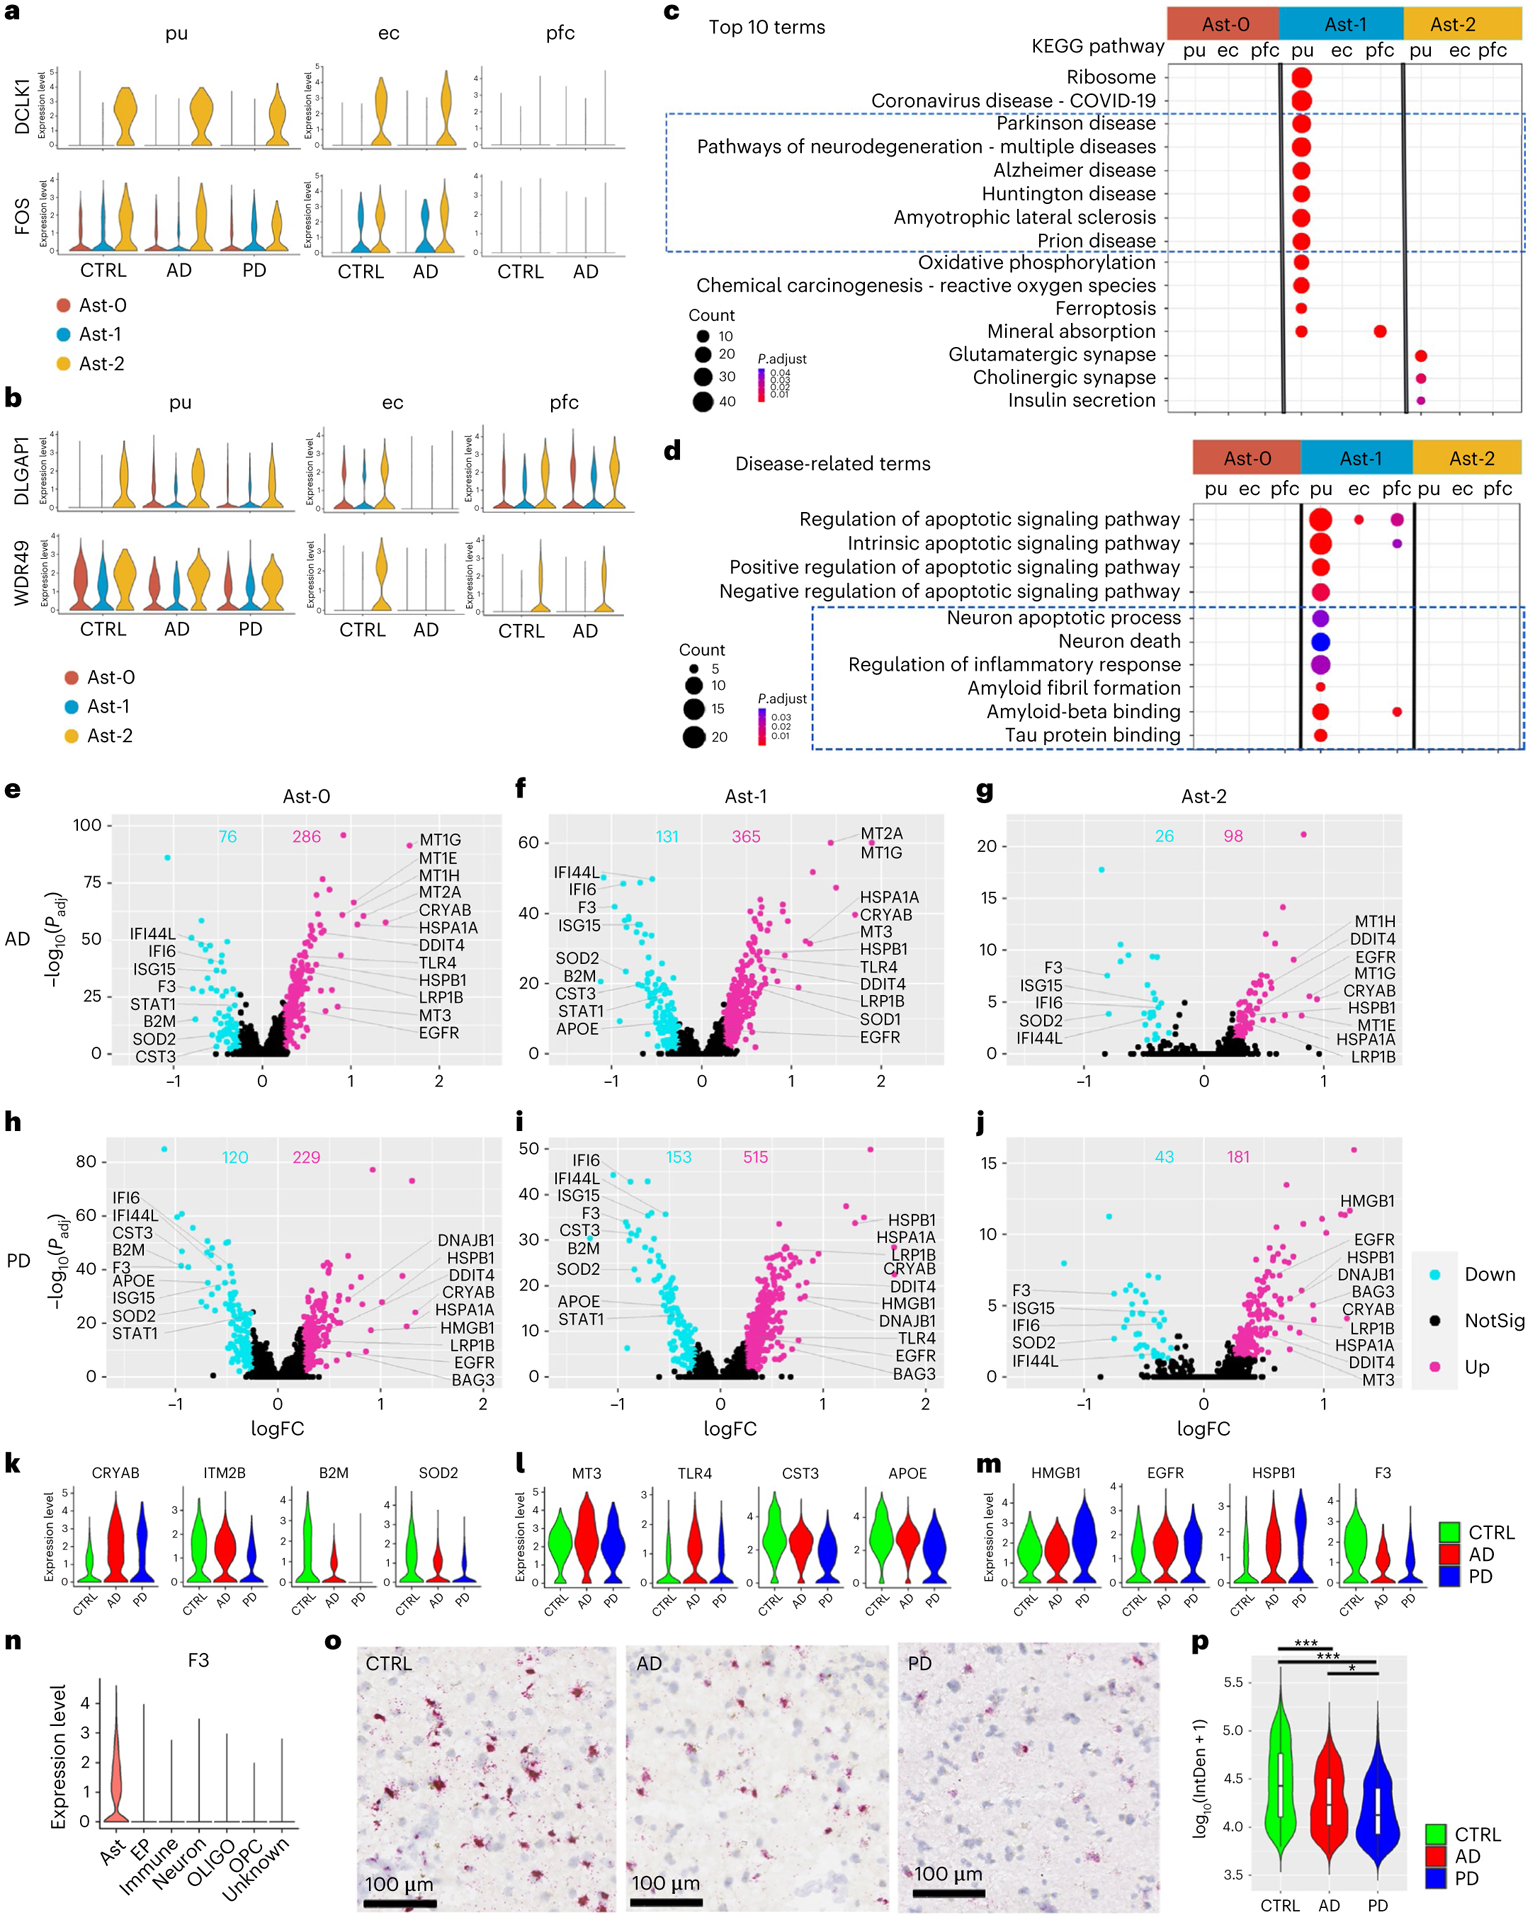
a,b, Violin plots showing genes with conserved expression patterns in the putamen and ec (a) or the putamen and pfc (b) in FindConservedMarkers using Wilcoxon rank sum test and metap R package with meta-analysis combined P value < 0.05). c,d, KEGG pathway terms (c) and disease-related GO terms (d) enriched in the subcluster conserved marker genes (false discovery rate (FDR)-adjusted P value < 0.05, hypergeometric test, ≥ 5 query genes). e–j, Volcano plots showing significant DEGs comparing cells from AD (e–g, Ast-0 = 834, Ast-1 = 553, Ast-2 = 255 cells) or PD (h–j, Ast-0 = 784, Ast-1 = 427, Ast-2 = 222 cells) with cells from the controls (CTRL, Ast-0 = 683, Ast-1 = 358, Ast-2 = 161 cells). The x-axis specifies the log fold changes (logFCs), and the y-axis specifies the negative logarithm to the base 10 of the adjusted P values (−log10(Padj)). Magenta and cyan dots represent genes upregulated and downregulated in disease brains, respectively (Wilcoxon rank sum test, FDR-adjusted P value < 0.05 and absolute logFC > 0.25 using natural logarithm (ln)). k–m, Violin plots showing the expression level distributions of example DEGs of Ast-0 (k), Ast-1 (l) and Ast-2 (m). n, Violin plots showing F3 gene expression in all major cell types in the putamen. o, Representative images of RNAScope in situ hybridization analysis of F3 transcript expression in the putamen. p, Single-cell F3 in situ hybridization signal from four images each for four subjects from each group were quantified, AD (n = 863 cells), PD (n = 387 cells) and control (CTRL, n = 1,120 cells) using one-way analysis of variance with Tukey’s multiple comparisons test, ***P < 0.001, *P < 0.05, AD versus CTRL P value < 0.001, PD versus CTRL P value < 0.001, PD versus AD P value = 0.016). Data are presented as mean values ± standard deviation (s.d.). Minima = 3.69, maxima = 5.41, mean CTRL = 4.63, AD = 4.38, PD = 4.27. The lower and upper hinges correspond to the 25th and 75th percentiles. The upper/lower whisker extends from the hinge to the largest/smallest value no further than 1.5× interquartile range from the hinge. Down: downregulated; Up: upregulated; NotSig: not statistically significant; log10(IntDen + 1): logarithm to the base 10 of the integrated density.
Shared astrocytic transcriptomic changes between AD and PD
To understand the functional significance of astrocyte subpopulations in pathogenesis, we compared astrocyte gene expression in disease samples to that in controls within each population and detected 124 to 668 differentially expressed genes (DEGs) (Figs. 2e–m and 3a and Supplementary Tables 12–17). Interestingly, all putamen astrocyte subpopulations had nearly 2/3 or more DEGs upregulated in AD and PD, including CRYAB, HSPB1, multiple metallothionein (MT) family genes, EGFR and TLR4 (Fig. 2e–m), consistent with observed expression increase in patients with AD and PD22–27. Downregulated DEGs include the AD risk gene APOE (Fig. 2f,h,i,l), consistent with previous snRNA-seq studies7,10. Tissue factor (F3) expression was significantly downregulated in AD and PD as validated using RNAScope in situ hybridization and quantification (Fig. 2e–j,m–p). Within each disease condition, astrocyte subpopulations shared extensive transcriptomic changes (p < 0.01, hypergeometric test) with 100% concordance in the directions of the gene expression change (Extended Data Fig. 5a). Gene expression fold changes of all genes in the genome were highly correlated in all pair-wise correlation analyses (Pearson’s correlation coefficient r = 0.718 to 0.894, FDR-adjusted P value < 0.01; Fig. 3b). Pathway analysis revealed concordant changes of multiple pathways across all putamen astrocyte subpopulations (Fig. 3c). Together, these results demonstrate shared transcriptomic changes among the three astrocyte subpopulations in each disease condition.
Fig. 3 |. Regional differences in astrocytic transcriptomic changes in disease.
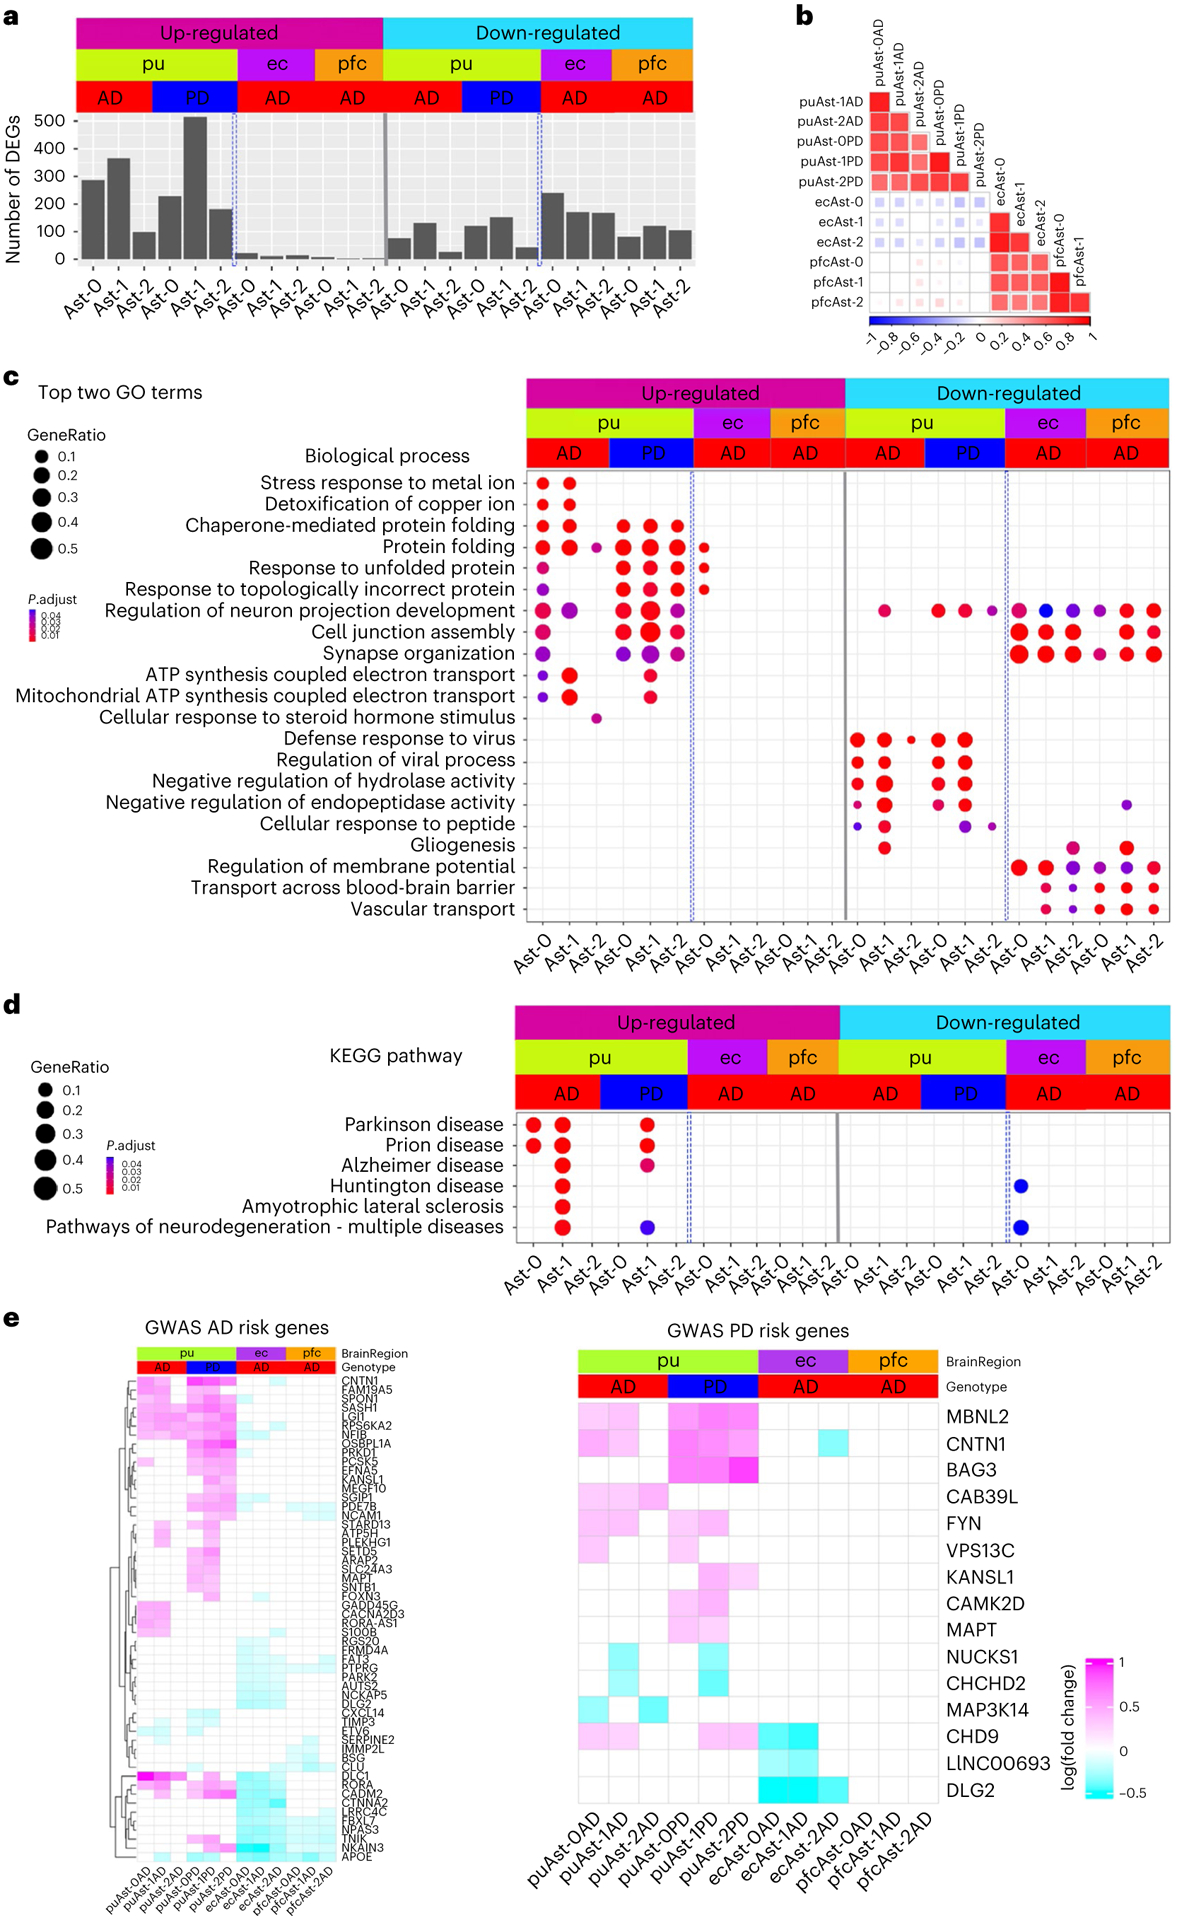
a, Bar plot showing the number of up- and downregulated differentially expressed genes (DEG) in the three astrocyte subpopulations from the putamen (pu), ec and pfc (Wilcoxon rank sum test, FDR-adjusted P value < 0.05 and logFC > 0.25 using natural logarithm (ln)). Number of subjects: AD (n = 4), PD (n = 4) controls (n = 4). b, Heatmap of Pearson’s correlation coefficient of genome-wide gene expression logFC among the three astrocyte subpopulations from the pu, ec and pfc. The color represents the correlation’s directionality, and the shade of color represents the significant levels. Only significant correlations were plotted (FDR-correlated P value < 0.05). c, Top two biological process pathways enriched in the DEGs. d, Neurodegenerative disease-related KEGG pathways enriched in the DEGs (hypergeometric test, FDR-adjusted P value < 0.05, ≥ 5 query gene). e, Heatmaps showing the logFC of significant DEGs for GWAS AD- and PD-risk genes; GWAS genes differentially expressed in at least two subpopulations were plotted for visualization. Upregulated: upregulated in disease samples. Downregulated: downregulated in disease samples.
Our analysis indicated that transcriptomic changes in astrocytes are highly concordant between AD and PD samples. For each astrocyte subpopulation, AD and PD samples had significant overlap and concordant change of DEGs (P < 0.01, hypergeometric test), a significant correlation of genome-wide gene expression level changes (r = 0.542–0.795, P < 0.001), and common pathways dysregulated in disease conditions (Fig. 3b,c and Extended Data Fig. 5b,d). Interestingly, upregulated DEGs in both AD and PD astrocytes were significantly enriched for multiple neurodegenerative disease pathways (Fig. 3d). However, discordant transcriptomic changes between AD and PD were also detected, especially for the downregulation of the amyloid-beta (Aβ) binding pathway in PD astrocytes (Extended Data Fig. 5d). Thus, our results suggest a possible link between astrocytic transcriptomic changes to neurodegenerative diseases and reveal common and unique dysregulated genes in AD and PD, possibly linking to differential Aβ pathology between the two diseases.
Regional differences in astrocytic transcriptomic changes
Next, we compared astrocytic gene expression changes in disease conditions across different brain regions. We detected 181–263 and 90–123 DEGs for the three ec and pfc astrocyte populations, respectively (Fig. 3a and Supplementary Tables 18–23). Although numbers of downregulated genes in each brain region were comparable, over 90% of DEGs were downregulated for all cortical astrocytes (91.1–97.6%), in contrast to fewer than 1/3 in putamen astrocytes (Fig. 3a). Additionally, DEGs overlapped appreciably among cortical astrocyte subpopulations and between the two brain regions but were largely non-overlapping with, or regulated in opposite directions to putamen astrocyte DEGs (Extended Data Fig. 5c). Furthermore, genome-wide gene expression changes of the cortical astrocytes were significantly correlated (r = 0.51 to 0.68, FDR-adjusted P value < 0.01) but were not with that of the putamen astrocytes (r ≤ 0.14; Fig. 3b). Many pathways were differentially regulated between cortical and putamen astrocytes, including multiple neurodegenerative disease pathways (Fig. 3c,d). We therefore examined AD and PD risk genes7,28–30 identified by genome-wide association studies (GWASs), and found ~10% of these genes differentially expressed in at least two clusters (Fig. 3e). Expression changes of AD risk genes in the putamen were concordant between AD and PD but largely in opposite directions compared with the cortex, except for APOE and CLU (Fig. 3e). Many PD risk genes were differentially expressed in putamen astrocytes, but few were affected in cortical astrocytes. In summary, our results demonstrate that cortical astrocytes had similar transcriptomic changes in AD but were distinct from putamen astrocytes.
Four distinct immune cell populations in the human brain
We next investigated immune cell heterogeneity in the putamen and identified four subpopulations (Fig. 4a,b). Conserved marker genes of T cell cluster included T cell-specific markers BCL11B, CD247 and SKAP131,32, and were enriched for T cell-specific functions (Fig. 4c,e). Perivascular macrophages (PVMs) and microglia shared macrophage markers CSF1R and C1QB but can be distinguished by the expression of PVM-specific markers such as MRC1, LYVE1, CD163 and F13A1 (Fig. 4c and Extended Data Fig. 6a) and microglia-specific markers such as P2RY12 and CX3CR133–35. The two microglia subpopulations, referred to as Micr-0 and Micr-1 herein, can be distinguished by the unique enrichment of AIF1 and APOC1 in Micr-1 cells as validated using immunohistochemistry staining of P2RY12 combined with in situ hybridization for AIF1 or APOC1 (Fig. 4d,f,g and Extended Data Fig. 6d,e). Decreased P2RY12 expression and higher AIF1, CD14, FTL and MHC-II gene expression in Micr-1 suggested that Micr-0 and Micr-1 represented homeostatic and activated microglia, respectively. Consistently, Micr-1 signature genes were enriched for pathways associated with activated microglia36 (Fig. 4e). Each cluster contained a similar percentage of cells from all cases of all diagnostic groups (Extended Data Fig. 6c). The conservation of marker genes in control, AD and PD brains indicated these distinct immune cell populations existed independent of disease status.
Fig. 4 |. Four distinct immune cell populations.
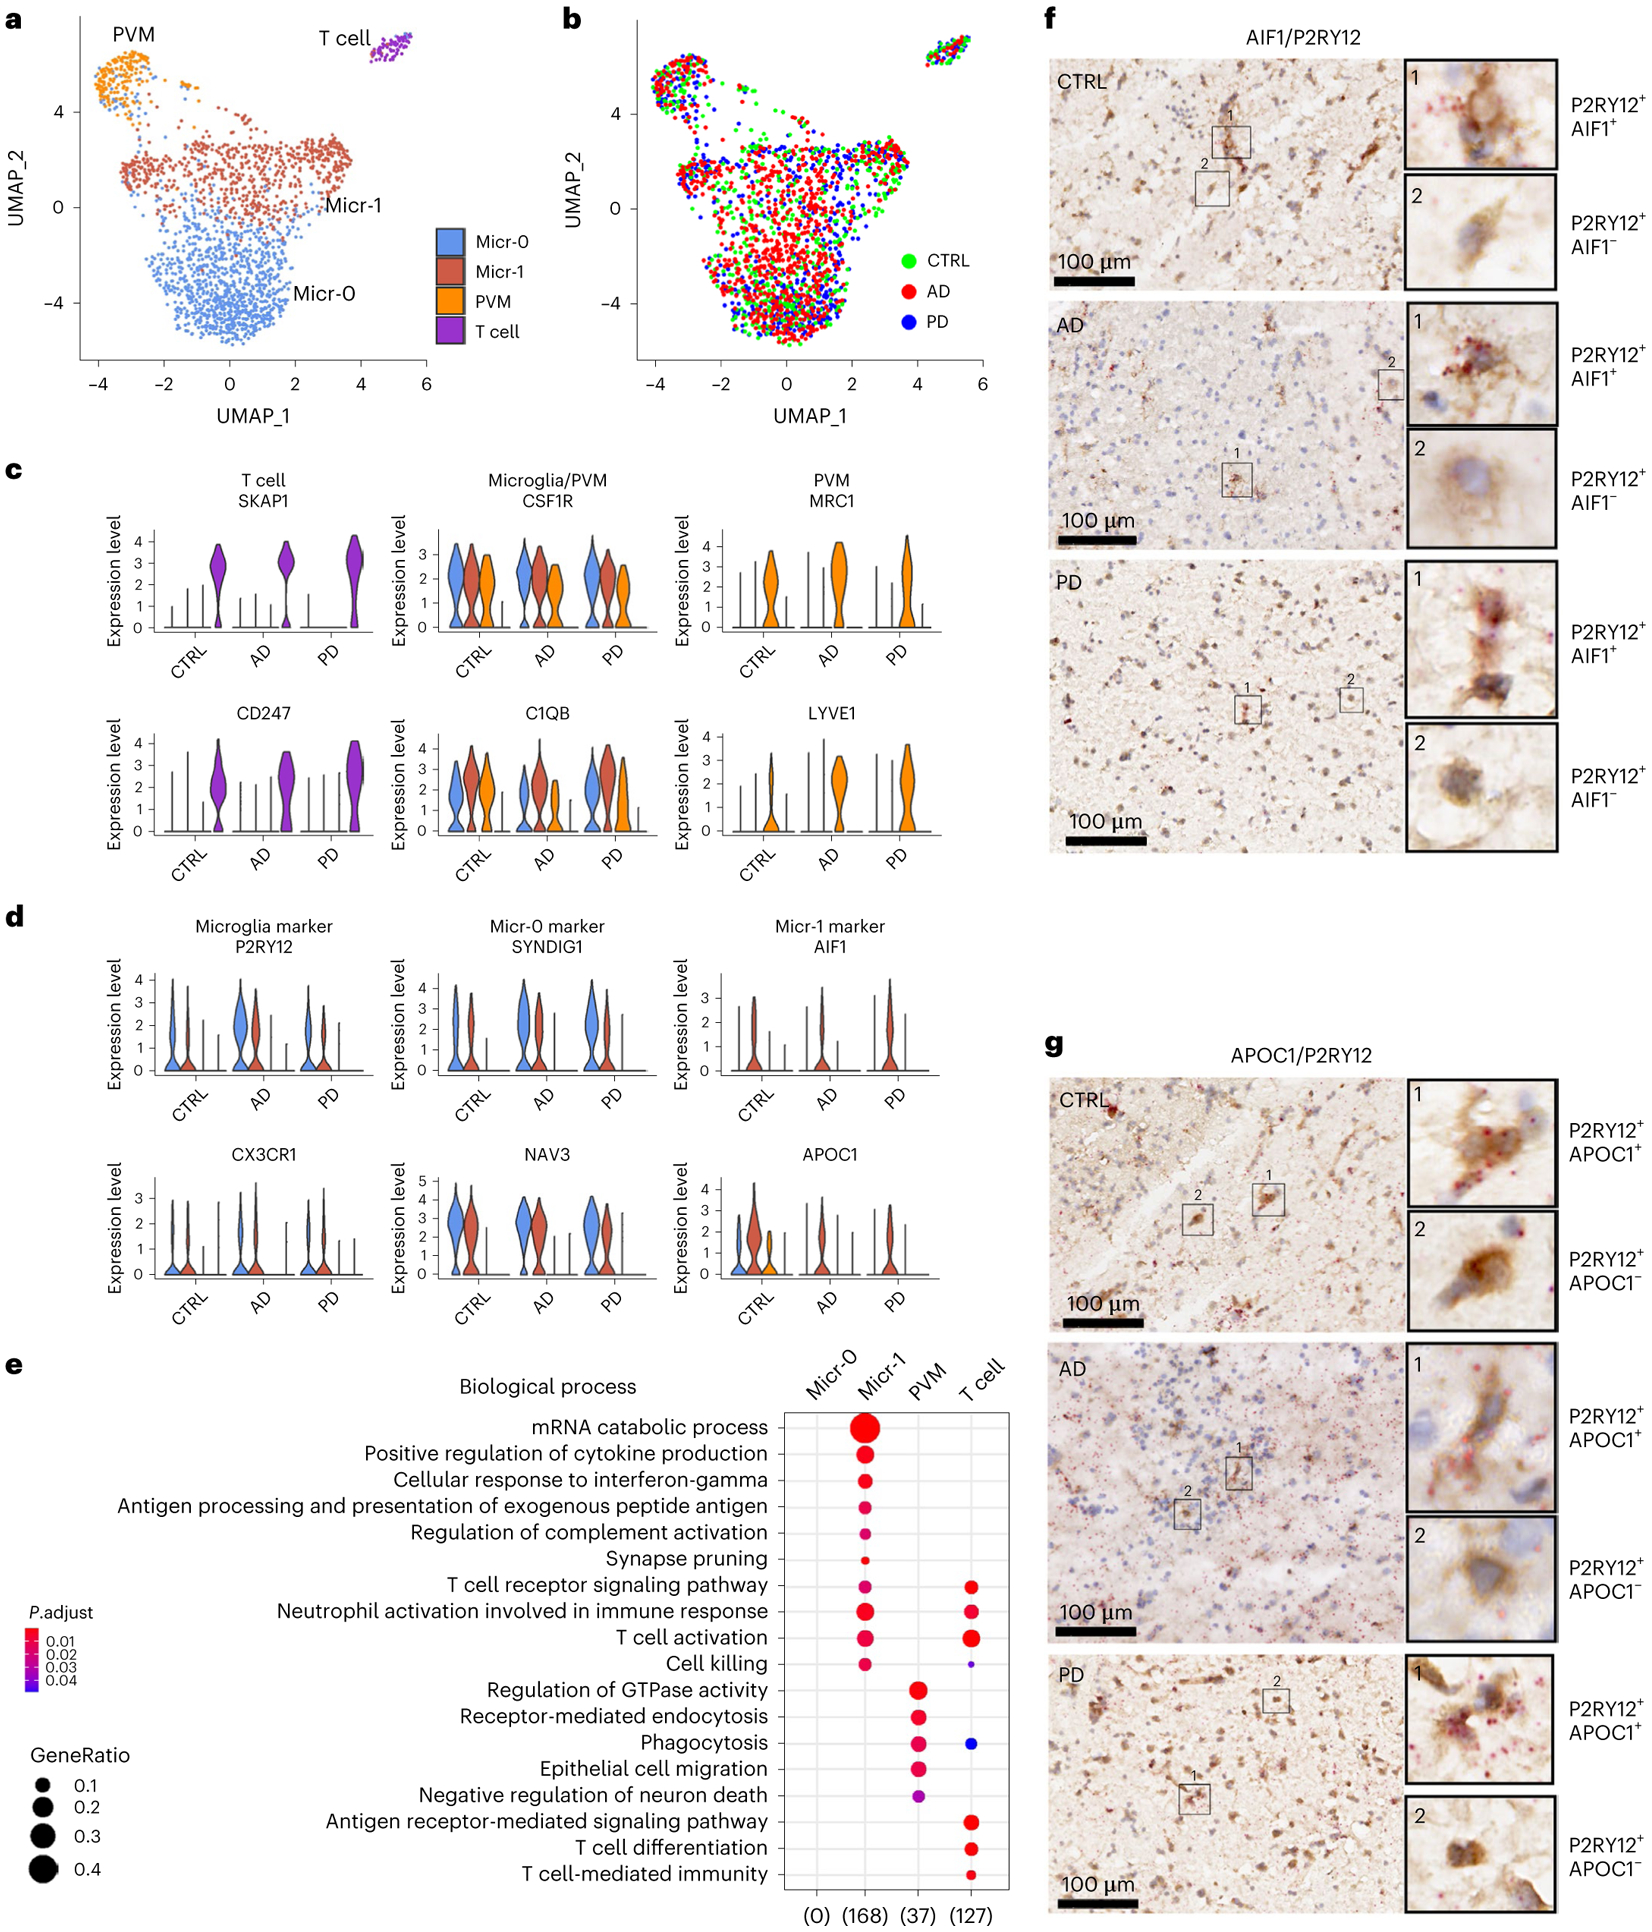
a,b, UMAP visualization of subclusters of immune cells (total nuclei: control 558, AD 827, PD 619) colored by cell cluster (a) or disease diagnosis (b). c,d, Violin plots showing the expression level distributions of genes for T cell, microglia and PVM shared markers and PVM unique markers (c); microglia-specific markers and microglia subpopulation markers (d). The color code is the same as in panel a. e, Subcluster signaturegene enriched GO terms in the Biological Process category (hypergeometric test, FDR-adjusted P value < 0.05, ≥ 5 query genes). f,g, Immunohistochemistry staining (brown) of marker protein P2RY12 and RNAscope in situ hybridization analysis (red) of AIF1 (f) and APOC1 (g) transcript expression in the adjacent tissue sections from the putamen tissue of a control, AD or PD brain. Hematoxylin-positive cell nuclei are shown in blue. For all data, the experiment was performed once. UMAP were generated using default parameters except reduction = ’pca’, dims = 1:30. Cell cluster were defined using resolution = 0.2. Conserved marker genes were determined by FindConservedMarkers using Wilcoxon Rank Sum test and metap R package with meta-analysis combined P value < 0.05. Number of subjects: AD (n = 4), PD (n = 4) and the controls (n = 4). Scale bars, 100 μm.
To determine whether immune cell subpopulations identified in the striatum existed in other human brain regions, we analyzed the four published snRNA-seq data independently7–10. All four immune cell subpopulations were detected in the Mathys-pfc10 and the Feleke-acc8 data with most of the conserved marker genes shared by the immune cells in these two datasets (Extended Data Fig. 7). However, some genes were not detected or statically insignificant in the Mathys-pfc data likely due to the low cell numbers and the sequencing depth (Supplementary Table 11). Both microglia subpopulations were also present in the ec and Lau-pfc data. FRMD4A and ST6GALNAC3 were identified as the marker genes of Micr-0, whereas activated microglia markers such as APOE, HLA-DRA, HLA-DPB1, FTH1 and FTL were identified as the marker genes of Micr-1, which were shared across all five datasets and among the control, AD, PD, PD dementia and dementia with Lewy bodies samples (Extended Data Figs. 6f–k and 7d,h). These results suggest that the two microglia subpopulations identified in the putamen were also present in all the other brain regions, irrespective of disease status.
Micr-1 share transcriptomic signatures with murine DAM
Interestingly, 32 of the 83 Micr-1 conserved marker genes overlapped with signature genes of murine DAM37 (P value = 6.46 × 10⁻³³, hypergeometric test; Fig. 5a and Supplementary Table 24). When we compared Micr-1 with homeostatic Micr-0 microglia from AD samples, we identified more DAM signature genes and a greater significant overlap with murine DAM gene signatures (Fig. 5a; 40 out of 111 genes, P value = 3.03 × 10−40, hypergeometric test). The upregulation of APOE, B2M and TYROBP in Micr-1 cells compared to homeostatic Micr-0 microglia was observed across all diagnostic groups (Fig. 5b), which was similar to the reported expression changes during murine DAM activation37. In particular, TYROBP-APOE signaling is implicated in the initiation of DAM phenotypes independent of TREM238, whereas TREM2 is critical for the transition of DAM from an intermediate state to a fully activated state37,39. Consistent with this, TREM2 expression was more enriched in Micr-1 cells in AD and PD brains (Fig. 5b,e), suggesting a possible transition from an intermediate activated state in controls to a fully activated state in the disease conditions37. Thus, Micr-1 represents human activated microglia and shares similar transcriptomic changes with murine DAM, suggesting a general microglia activation response to central nervous system (CNS) challenge conserved in the murine models37.
Fig. 5 |. Characterization of the human activated microglia.
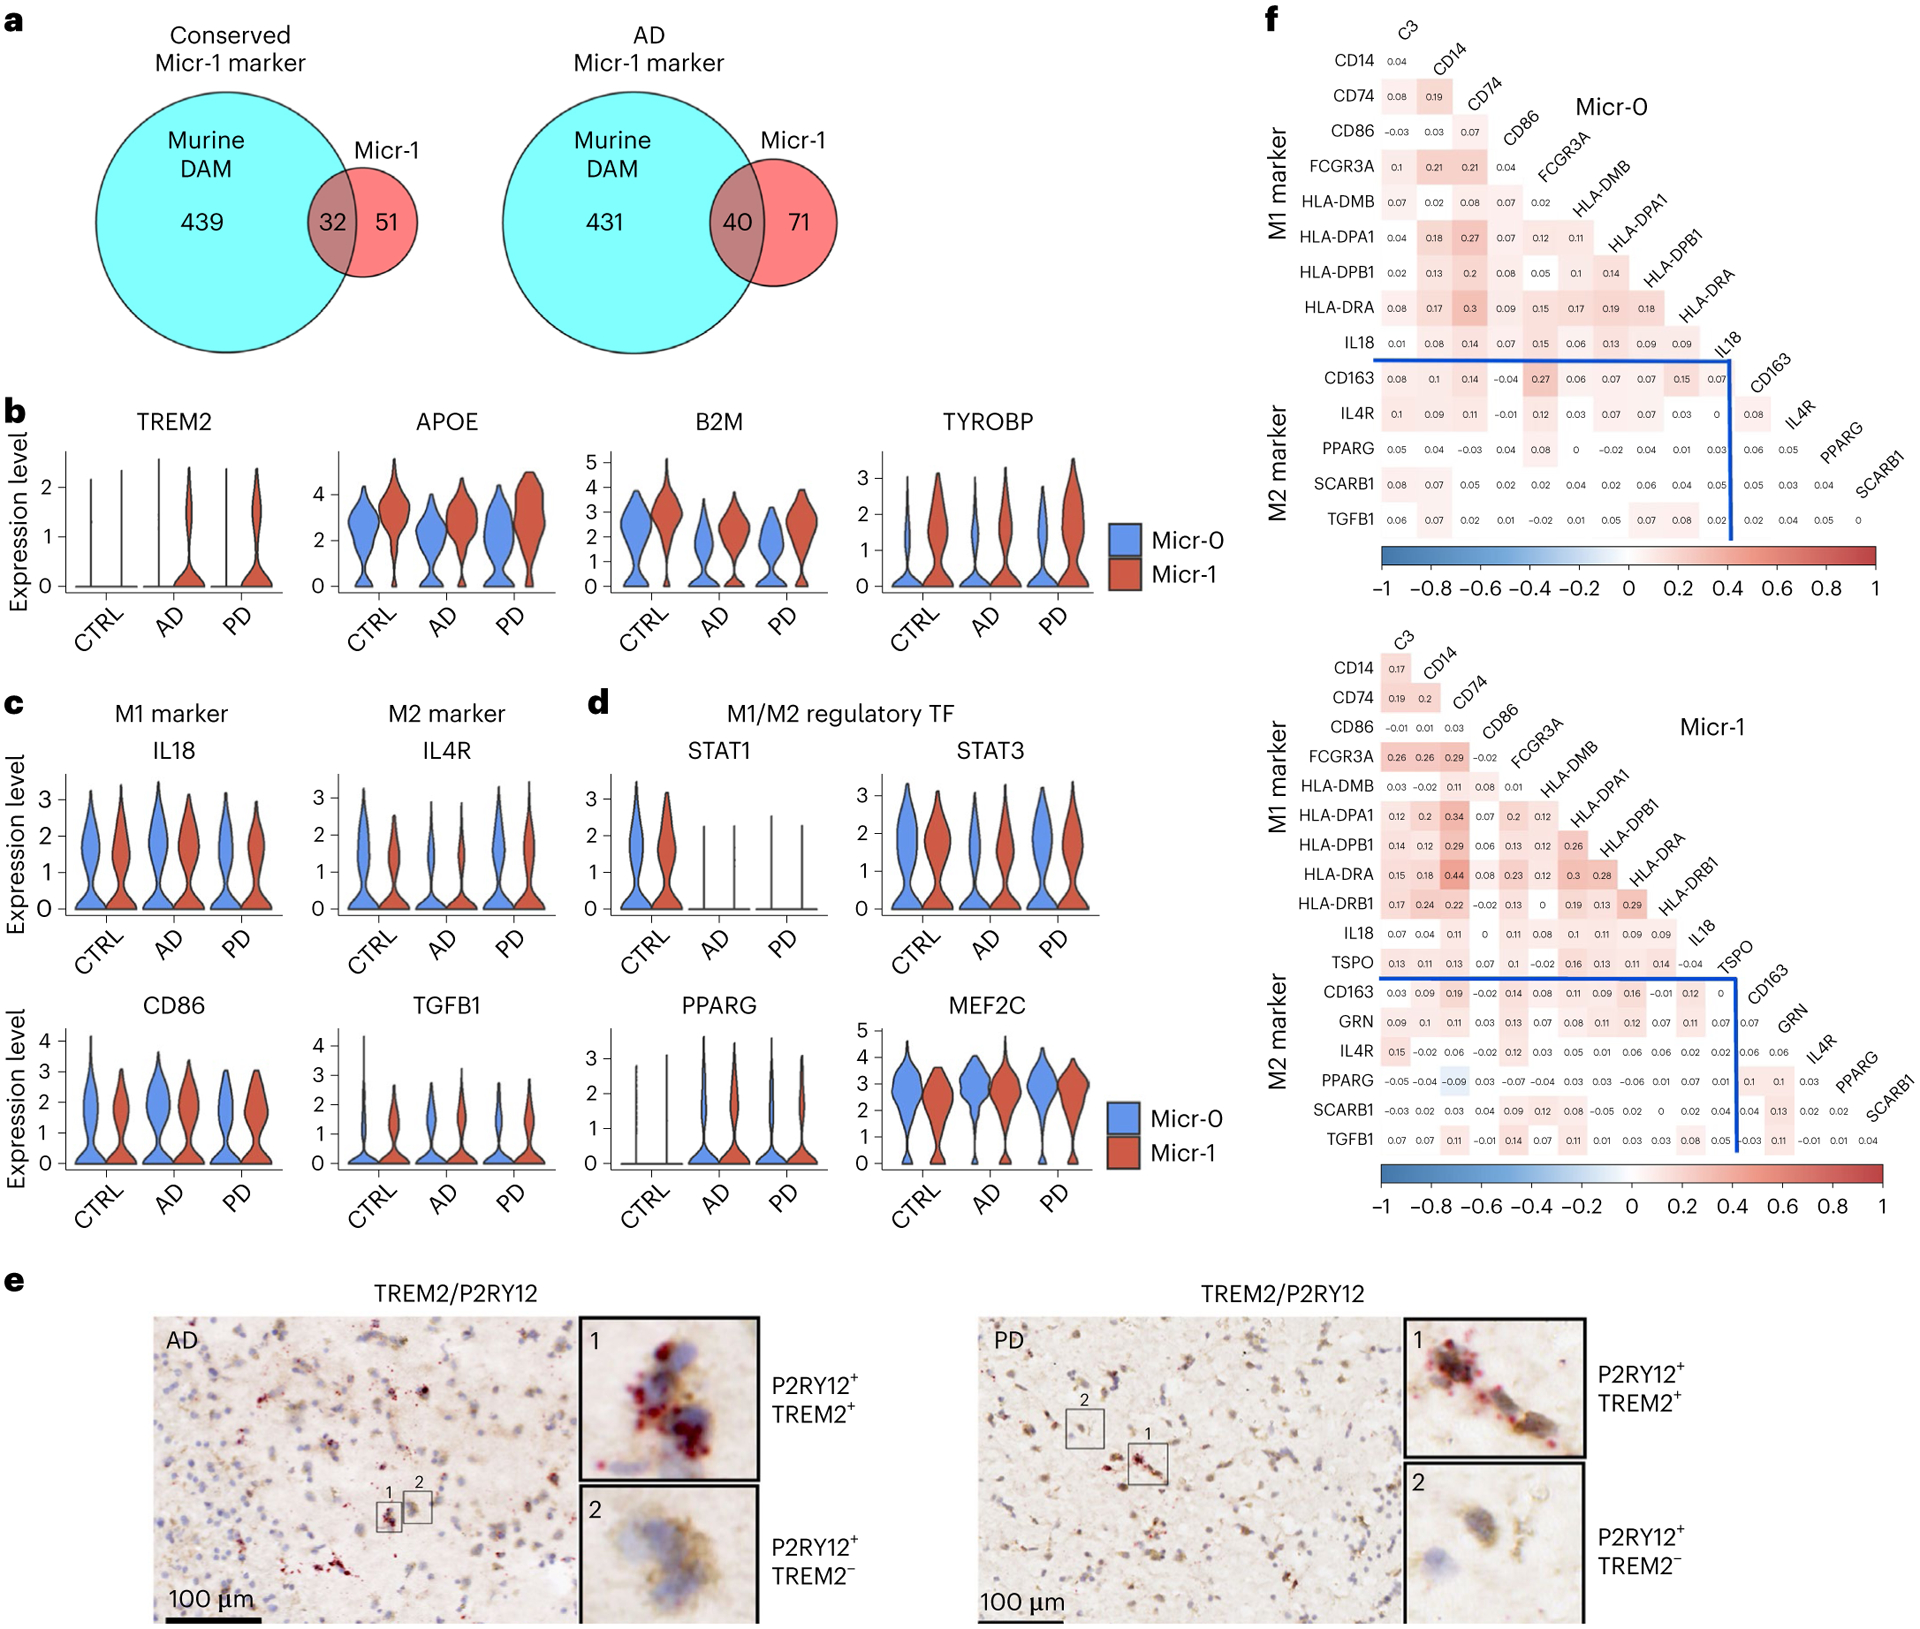
a, Venn diagram demonstrating overlap (hypergeometric test) between murine DAM marker genes and the conserved marker genes of human activated microglia (Micr-1) of AD, PD and controls (left, P value = 6.46 × 10⁻³³) or marker genes of AD-only human activated microglia (right, P value = 3.03 × 10−40). b–d, Violin plots showing the expression level distributions of (b) TREM2, APOE, B2M and TYROBP; (c) M1- and M2- microglia markers; (d) M1- and M2- microglia regulatory transcription factors (TF). e, Immunohistochemistry staining (brown) of marker protein P2RY12 and RNAscope in situ hybridization analysis (red) of TREM2 transcript expression in the adjacent tissue sections from the putamen of an AD and a PD case. For all data, the experiment was performed once. Hematoxylin-positive cell nuclei are shown in blue. f, Heatmap of Pearson’s correlation coefficient of M1- and M2- microglia marker gene expression for Micr-0 and Micr-1 microglia respectively. The shade of the color represents the significance levels (FDR-correlated P value < 0.05). The color represents the directionality of correlation. APOE, B2M and TYROBP were determined to be conserved cluster marker for Micr-1 by FindConservedMarkers using Wilcoxon rank sum test and metap R package with meta-analysis combined P value < 0.05 comparing gene expression in Micr-1 cluster with the other cell clusters for AD (n = 4), PD (n = 4), and the controls (n = 4). Scale bars, 100 μm.
Undescribed activation states of human microglia
To define the activation states of human microglia, we investigated the expression of canonical M1 and M2 marker genes. M1 markers, such as IL-18 and CD86, and M2 markers, such as IL4R and TGFB140, were expressed in both microglia subpopulations at similar levels across all diagnostic groups (Fig. 5c). We calculated pairwise expression correlation among all known M1 and M2 marker genes36,40 expressed in at least 20% of Micr-0 and Micr-1 cells. Most of these genes were expressed in the same cells and were positively correlated irrespective of being an M1 or M2 marker (Fig. 5f). STAT1, PPARG, STAT3 and MEF2C, transcription factors critical for M1 or M2 polarization41,42, were expressed at similar levels in both populations (Fig. 5d). Therefore, the activation state of human microglia could not be distinguished using known markers, suggesting that human microglia may have an activation state distinct from what had been observed in vitro and in animal models.
Co-expression modules shared by control, AD and PD microglia
To better understand gene expression dynamics during human microglia activation, we reconstructed microglia activation trajectories (Fig. 6a). We identified 549, 516 and 437 genes whose expression changes were significantly associated with pseudotime progression (pseudotime DEG) for control, AD and PD samples, respectively (Supplementary Tables 25–27). Interestingly, pseudotime DEGs were significantly enriched for AD risk genes43,44 (Extended Data Fig. 8a; FDR-adjusted P value < 0.05, hypergeometric test), resembling findings in an App knockin mouse model45, with APOC1, APOE, HLA-DRB1, INPP5D and MEF2C shared by all diagnostic groups. PD risk genes CHCHD2, FBXO7 and PARK728,29 also overlapped with pseudotime DEGs. Consensus k-means partitioning identified three co-expression modules for each diagnostic group (Fig. 6d and Supplementary Tables 25–27). Module 1 consisted of genes downregulated during microglia activation. Modules 2 and 3 were comprised of genes upregulated in early and late activated microglia. Many genes were shared among all three conditions with highly concordant expression within each module and between different conditions (Fig. 6g,j and Extended Data Fig. 8b). Top-ranking genes in modules 2 and 3 (APOE, B2M, FTH1, FTL and CD74; Fig. 6j) are involved in microglia transition from a homeostatic to an activated stage associated with neurodegeneration in humans and mice37,46,47. We defined the set of genes that were present in all three conditions in module 1 (26 genes, downregulated) or modules 2 + 3 (179 genes, upregulated) as the core gene co-expression modules. Upregulated core genes were enriched for hallmark pathways of activated microglia (Fig. 6k), confirming that our pseudotime analysis captured the true transcriptomic dynamics associated with microglia activation.
Fig. 6 |. Transcriptome transition during microglia activation.
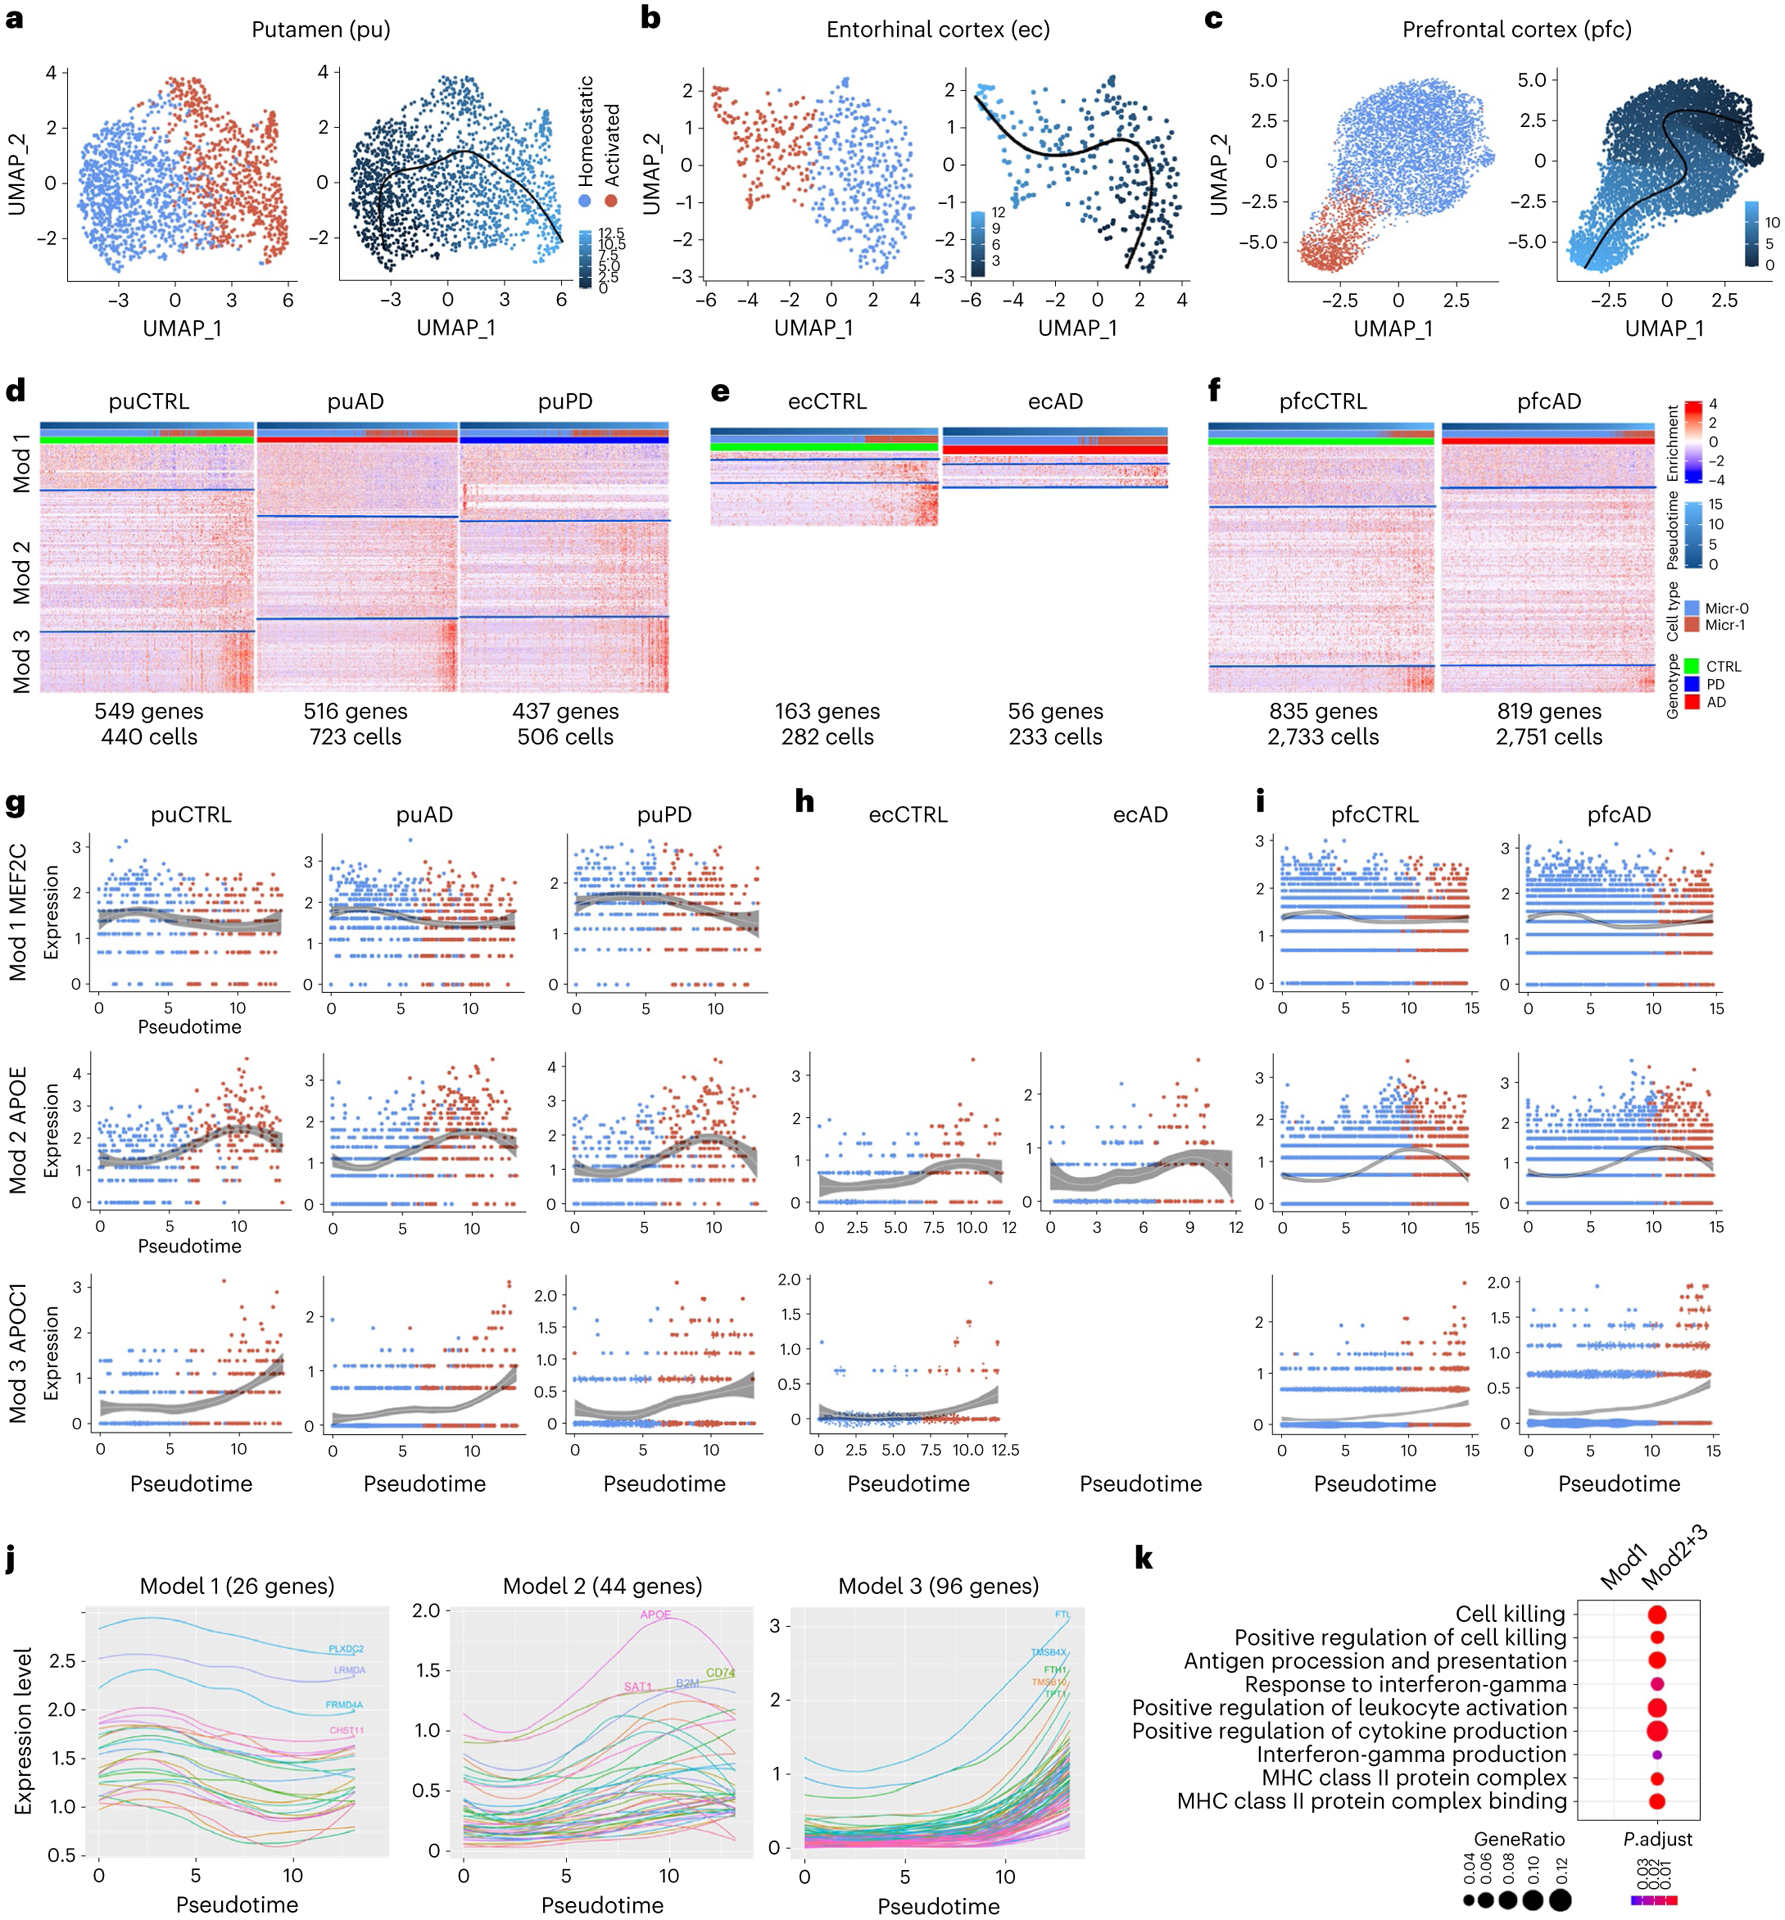
a–c, UMAP visualization of pseudotemporal trajectory for microglia of putamen (a), ec (b) and pfc (c). UMAP were generated using default parameters except reduction = ’pca’, dims = 1:10. Cell cluster were defined using resolution = 0.15. d–f, Heatmap of the three pseudotime DEG co-expression modules in the microglia of putamen (d), ec (e) and pfc (f) for each condition. Pseudotime DEGs are genes whose expression significantly associated with pseudotime progression (generalized additive model, FDR-adjusted P value < 0.05). g–i, Gene expression changes along pseudotime trajectory for example genes in module 1, 2 or 3 in the microglia of putamen (g), ec (h) and pfc (i) for each condition. LOESS Regression were performed using loess() function in R with 95% confidence intervals plotted. Only statistically significant pseudotime DEGs (FDR-adjusted P value < 0.05) were shown. j, Expression dynamics along the pseudotime trajectory of pseudotime DEGs shared by the control, AD and PD samples in module 1, 2 or 3. k, Microglia-activation-related gene ontology terms enriched in the core gene-co-expression module genes in module 1 (Mod1) or module 2 and 3 combined (Mod2+3) (hypergeometric test, FDR-adjusted P value < 0.05, ≥ 5 query genes).
Core modules shared by diverse brain regions and disorders
We took two different approaches to investigate whether the microglia activation-associated core modules were shared by activated microglia in other human studies. First, we analyzed pfc microglia and identified 835 and 819 pseudotime DEGs for control and AD microglia, respectively (Fig. 6f and Supplementary Tables 29 and 30). AD risk genes APOC1, APOE, HLA-DRB1, INPP5D and MEF2C were associated with pseudotime progression in both AD and control samples (Fig. 6i), similar to their expression changes in putamen microglia. Analysis of ec microglia identified only 163 and 56 pseudotime DEGs likely due to the limited number of cells (Fig. 6e and Supplementary Tables 31 and 32). However, our analysis was sufficiently powered to identify APOE and APOC1 as pseudotime DEGs of modules 2 and 3, respectively (Fig. 6h), as in the other two brain regions. One hundred and two genes were shared by six out of the seven datasets with concordant direction of changes across all datasets detected (Extended Data Fig. 8c; P value < 0.001). Second, we retrieved pseudotime DEGs reported by Sankowski et al.48, which examined glioma-associated microglia (GAM) from the temporal or frontal lobes of glioblastoma multiforme patients. Out of the 545 reported pseudotime DEGs 79 were shared by seven out of the eight datasets with concordant direction of change across all datasets, including many genes commonly upregulated during microglia activation (Fig. 7a). To investigate whether the core modules are present in mice, we compared the pseudotime DEGs of DAMs37 and ARMs (activated response microglia)45 from AD mouse models. Only a partial list of ARM pseudotime DEGs is available45, and limited similarities were observed between DAMs and ARMs (Extended Data Fig. 8e). However, APOE and TYROBP were shared between human and mouse with concordant expression changes, and TYROBP-APOE signaling has been implicated in the initiation of DAM phenotypes38. In conclusion, human activated microglia, including Micr-1 subpopulations identified in our study, the previously identified GAM, and likely other reported activated microglia subpopulations, share a core gene co-expression module regardless of disease status and brain region. The shared TYROBP-APOE signaling also suggests that some core changes are likely evolutionarily conserved.
Fig. 7 |. Comparison of genes and pathways of microglia activation-associated transcriptome changes.
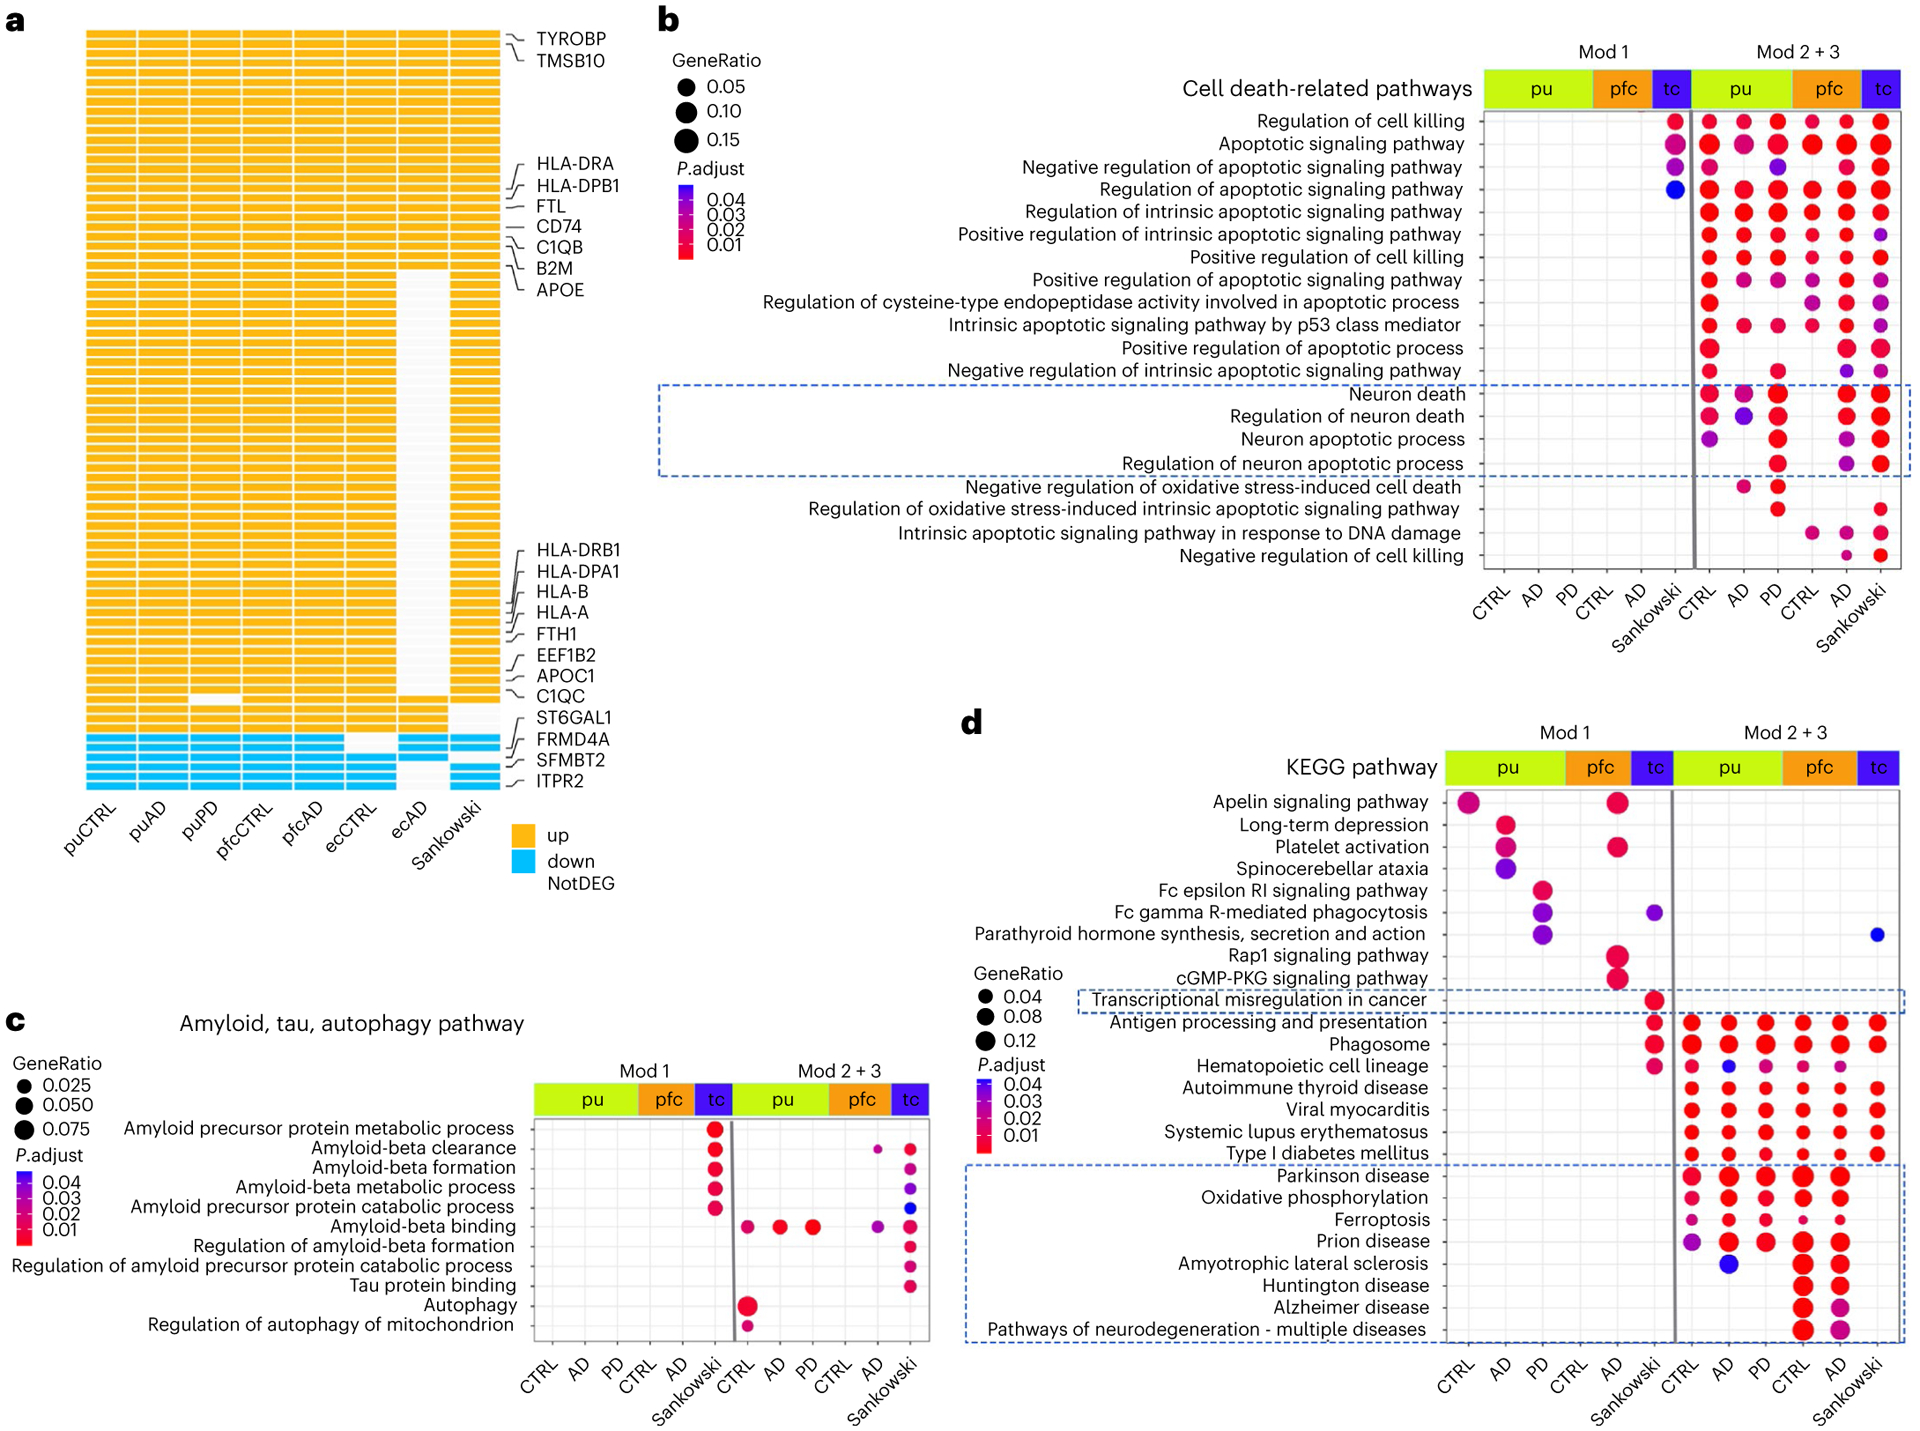
a, Pseudotime DEGs (generalized additive model, FDR-adjusted P value < 0.05) shared by human activated microglia isolated from the putamen of cognitively normal controls (CTRL), AD and PD samples, pfc of control and AD samples, ec of control and AD samples and temporal or frontal lobes (tc) of glioblastoma multiforme samples reported by Sankowski et al. b, Cell death-related GO terms enriched in the pseudotime DEGs. c, GO terms related to Aβ pathology, tauopathy, and autophagy that were enriched in the pseudotime DEGs. d, Top KEGG pathways enriched in the pseudotime DEGs. Pathways with FDR-adjusted P value < 0.05 (hypergeometric test) and at least five query genes were considered statistically significant. Up: upregulated; down: downregulated; NotDEG: not pseudotime DEG.
Common and disease-only changes during microglia activation
Next, we compared pathways that were dynamically regulated during microglia activation between control, AD and PD, as well as between different brain regions. We focused our pathway analysis on the putamen and pfc microglia and GAMs as they have sufficient numbers of pseudotime DEGs. The most prominent observation was the upregulated pathways shared among all conditions and across all brain regions. Many of the pathways are known to change during microglia activation in animal studies, such as the regulation of the intrinsic apoptotic signaling pathway, positive regulation of cytokine production including interferon-γ, response to interferon-γ, nuclear factor κB signaling, phagocytic capacity and antigen processing and presentation33,49(module 2 + 3; Fig. 7b,d and Extended Data Fig. 8d,f). These results suggest shared changes in major metabolic states and immune properties during human microglia activation across all conditions and different brain regions.
Interestingly, there were also major differences indicating diseasespecific transcriptome changes associated with human microglia activation. First, pathways downregulated during microglia activation were largely unique to each condition and brain region (module 1; Fig. 7d and Extended Data Fig. 8f). Second, some pathways were uniquely linked to disease pathology. For example, the ‘transcriptional misregulation in cancer’ pathway was specifically downregulated in the GAMs, whereas multiple neurodegenerative disease pathways were uniquely upregulated in the putamen and pfc microglia (Fig. 7d). Third, although the positive regulation of cytokine production pathway was shared by all microglia there were significant differences in the specific cytokines being regulated in different conditions and brain regions (Extended Data Fig. 8d). Lastly, the Aβ-binding pathway was upregulated in most datasets (Fig. 7c) providing in vivo evidence linking microglia activation and Aβ pathology in humans, a phenomenon widely-observed in animal studies50. Interestingly, many more Aβ-related pathways and the tau protein binding pathway were uniquely regulated during GAM activation (Fig. 7c), matching with the speculated role of GAM in reducing the risk of developing AD51. Whether and how these disease-specific transcriptome changes associated with human microglia activation could contribute to disease pathogenesis remain to be elucidated. The robust core gene signature of microglia activation defined in our study will help reveal disease-specific roles of microglial activation in various CNS diseases.
Microglia and Aβ pathology, tauopathy and neuron death
Comparing microglia from AD and PD brains with those of controls identified 112–245 DEGs with the majority (65.3–75.4%) being downregulated in the diseased brains (Extended Data Fig. 9a and Supplementary Tables 33–36). Micr-0 and Micr-1 shared many DEGs and their genome-wide transcriptional changes were significantly correlated (Extended Data Figs. 9a,b and 10a,b). Global gene expression changes between AD and PD were highly correlated sharing many downregulated DEGs (45.8% and 35.1%) and a few upregulated DEGs (7.4% and 8.0%) (Extended Data Fig. 10a,c). Pathway analyses revealed many disease-related changes in AD and PD microglia. For example, the Aβ binding pathway was downregulated in both diseases including MSR1 and CST3 (Extended Data Fig. 9a,b,e). In contrast, multiple protein folding pathway components including genes encoding stress-inducible heat shock protein HSP90AA1 and HSP90AB1 and their co-chaperone, FKBP4, were uniquely upregulated in PD microglia (Extended Data Figs. 9d and 10d). Hsp90 regulates tauopathy through co-chaperone complexes, and overexpression of FKBP4 prevents the accumulation of tau52. Therefore, our data suggest that microglia may play a beneficial role in preventing tau pathology, consistent with the less severe tauopathy in patients with PD. Additionally, multiple neuronal death pathways were downregulated in AD (Extended Data Fig. 9e). Gene expression analysis of GWAS AD and PD risk genes demonstrated largely distinct up-regulation of disease risk genes between AD and PD microglia (Extended Data Fig. 9f).
We detected 14–56 DEGs in the ec and pfc microglia subpopulations (Extended Data Fig. 10e), which was much fewer than that of the putamen microglia. Nonetheless, gene expression analysis of GWAS AD and PD risk genes demonstrated largely distinct regulation of disease risk genes between AD and PD microglia and between cortical and subcortical brain regions (Extended Data Fig. 9f). Some pathways were regulated in the opposite direction between the putamen and cortical microglia (Extended Data Fig. 10d). Our results suggest significant regional differences in microglial responses which may contribute to differential regional vulnerability.
Neuronal diversity of the human putamen
The human striatum neuronal heterogeneity has not been characterized at the single-cell level. We identified 13 transcriptionally distinct neuronal populations through subclustering analysis: eight MSN and five interneuron clusters (Fig. 8a and Supplementary Tables 38–50), revealing a greater MSN heterogeneity than previously suggested in the mouse and the non-human primate (NHP) striata. The expression of PPP1R1B and MEIS2, MSN marker genes53,54, versus ELAVL255, broadly distinguished the MSNs from the interneurons (Fig. 8b and Supplementary Fig. 1a). Conventionally, the co-expression of dopamine receptor DRD1 with neuropeptide TAC1 versus DRD2 with proenkephalin PENK has been used to delineate D1 direct-pathway neurons from D2 indirect-pathway neurons, respectively11,56. Four MSN subpopulations displayed conventional combinatorial expressions patterns, whereas the other four subpopulations had distinct combinatorial patterns. The co-expression of DRD1 with TAC1 by ‘mD1’ and ‘pD1’ neurons is consistent with their D1 neuron identity. The expression of STXBP6 and EPHA4 in mD1 neurons indicates their matrix compartment localization, whereas the expression of KCNIP1, BACH2 and the D1-patch– specific marker PDYN in pD1 neurons indicates patch compartment localization (Fig. 8c and Supplementary Fig. 1a)11,57. In contrast, ‘ncD1’ neurons expressed DRD1 but had a very low levels of TAC1 expression (thus named ‘non-canonical D1’). Moreover, ncD1 expressed multiple unique marker genes, such as RXFP2, FAM210B and MPP3, supporting its unique identity (Fig. 8b and Supplementary Fig. 1a). Similarly, the co-expression of DRD2 with PENK by ‘mD2’ and ‘pD2’ neurons is consistent with their D2 neuron identity, and the matrix/patch marker genes indicate matrix versus patch localization of mD2 and pD2 respectively (Fig. 8b,c). ‘ncD2,’ the non-canonical D2 MSN, expressed DRD2 but had a low expression level of PENK. Instead, ncD2 exhibited aberrantly high levels of TAC1, the canonical D1 MSN marker gene (Fig. 8b and Supplementary Fig. 1a). Furthermore, ncD2 expressed multiple unique marker genes, such as POU6F2, LGR5 and FHAD1, supporting its unique identity. The third type of non-canonical MSN exhibited expression of both dopamine receptor genes and both TAC1 and PENK, named hybrid MSN (hMSN) herein. hMSN expressed unique conserved marker genes RXFP1, MKX and JAG1, indicating it is a distinct neuronal subtype rather than an artifact of doublets (Fig. 8b and Supplementary Fig. 1a). The D1/D2 ‘hybrid’ MSN has been reported in NHP striatum11 and human nucleus accumbens12, with the same co-expression of D1 and D2 markers and unique RXFP1 expression. In contrast to these undescribed MSN subtypes having their own unique conserved marker genes, cluster ‘sMSN’ did not have any well-characterized marker genes uniquely expressed in the cluster. Instead, the conserved marker genes of this cluster had unique enrichment for many stress- and unfolded protein response-related pathways (Fig. 8e,f). We thus referred to this cluster as stressed MSN (sMSN).
Fig. 8 |. Characterization of neuronal subpopulations and gene expression changes in disease conditions.
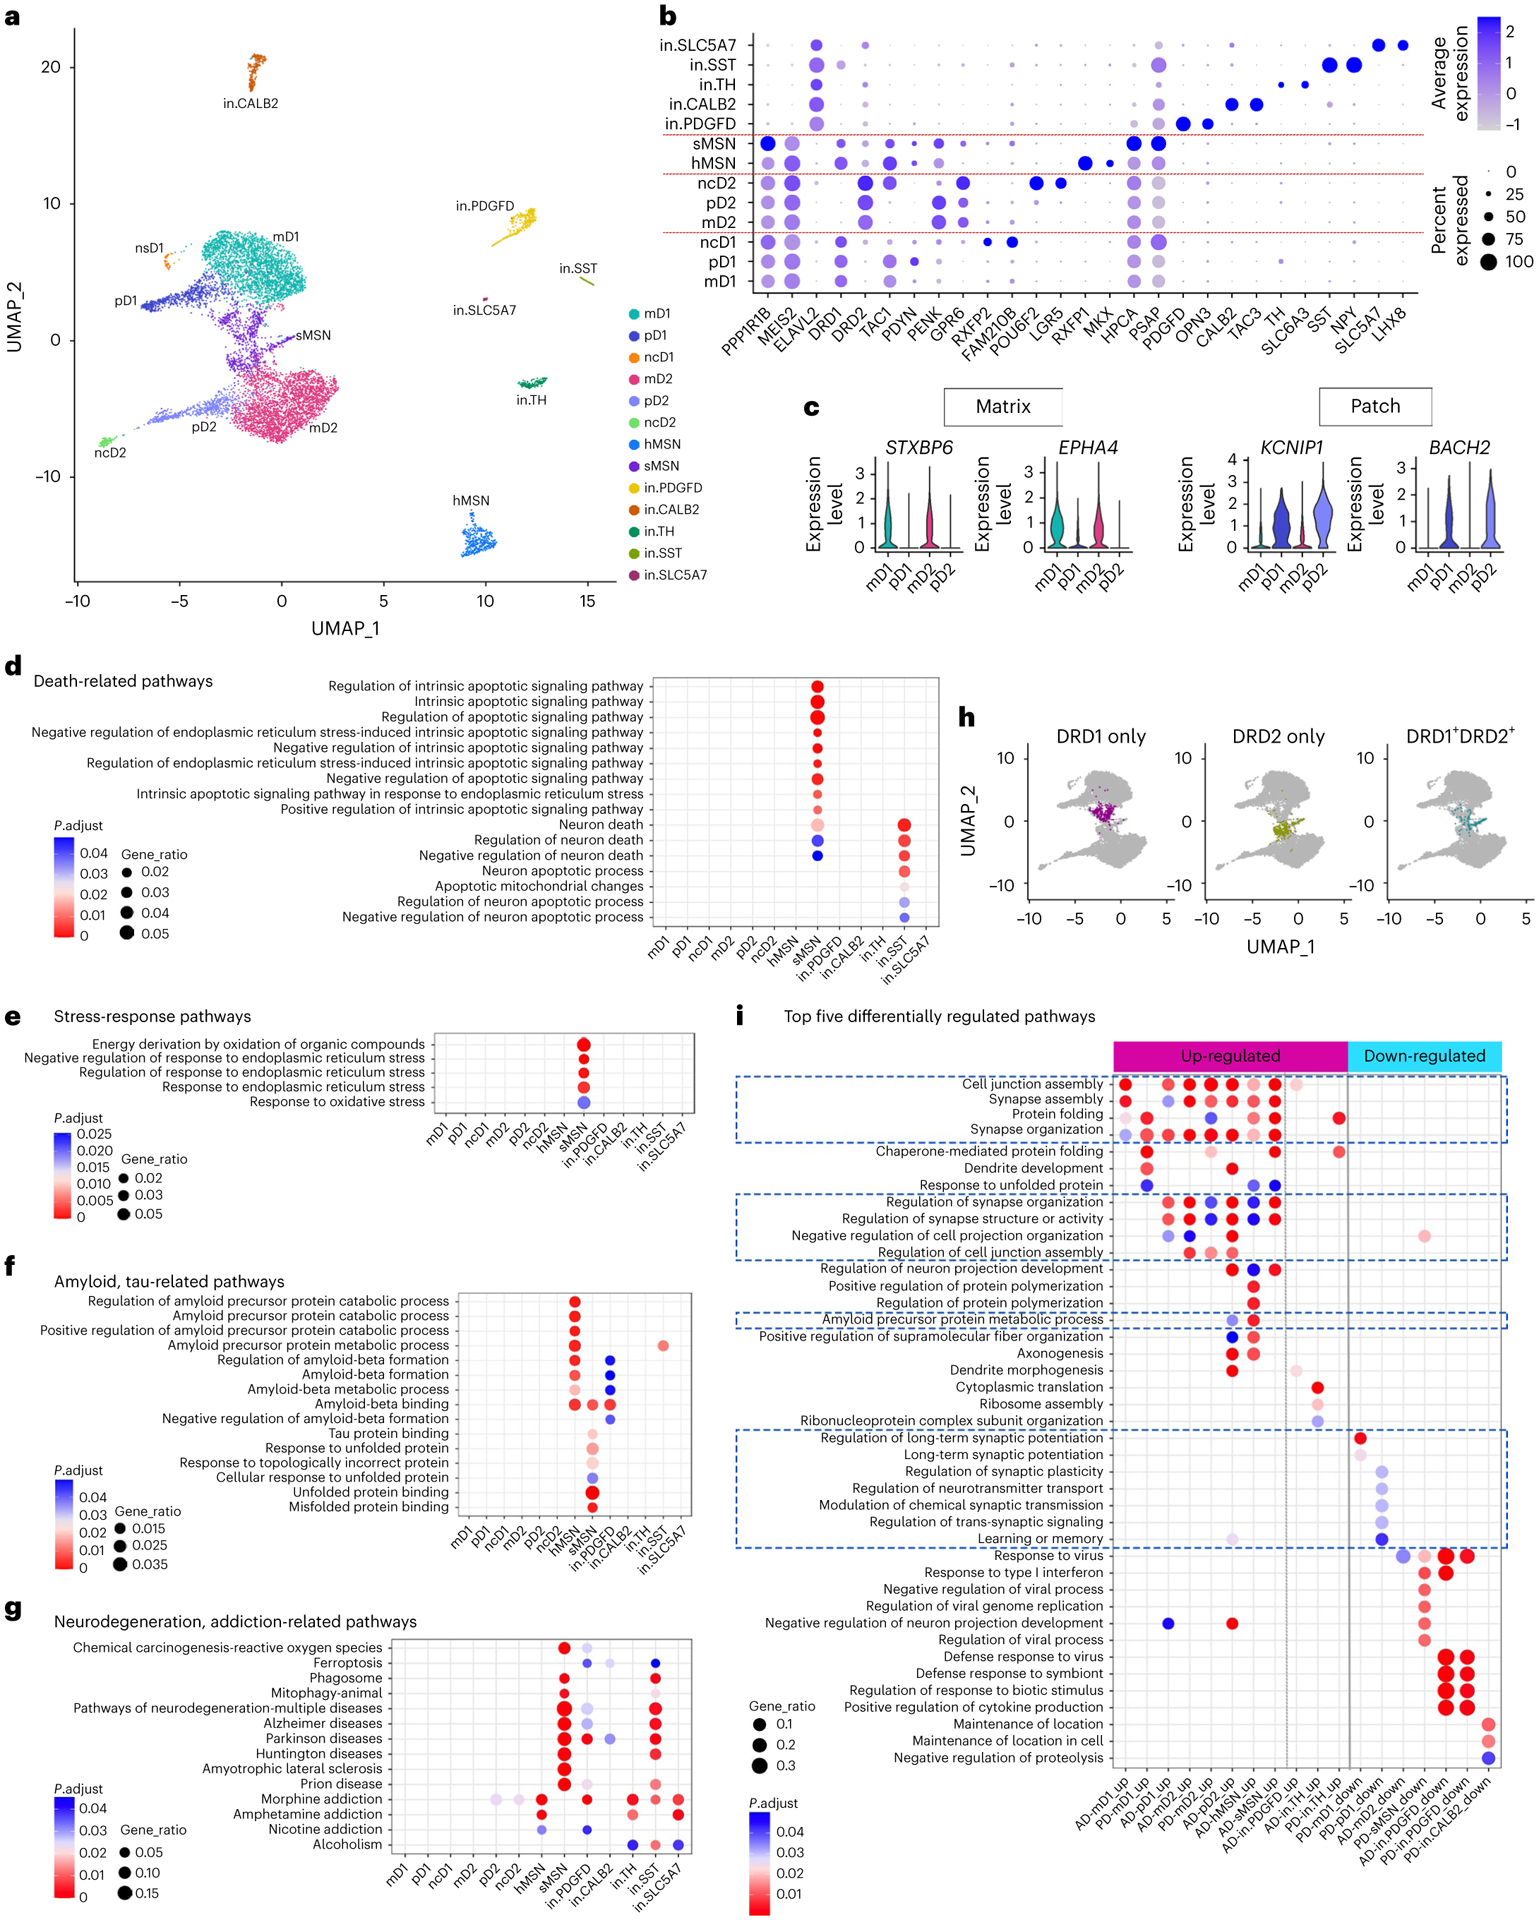
a, UMAP visualization of neuron subpopulations colored by cluster identity. b, Dot plot of neuronal subpopulation conserved marker gene expression (FindConservedMarkers using Wilcoxon rank sum test and metap R package with meta-analysis combined P value < 0.05). c, Violin plot showing the expression of matrix- and patch-compartment marker gene expression in mD1, pD1, mD2 and pD2 neurons (FindConservedMarkers using Wilcoxon rank sum test and metap R package with meta-analysis combined P value < 0.05). d–f, GO terms enriched in the conserved cluster marker genes of each neuronal subpopulation related to cell death (d), stress response (e), amyloid and tau metabolism and unfolded protein response pathways (f). g, Neurodegeneration and addiction-related KEGG pathway terms enriched in the conserved cluster marker genes of each neuronal subpopulation. h, UMAP visualization of MSN neuron subpopulations with sMSN colored by cells expressing only DRD1 (left), only DRD2 (middle) or both DRD1 and DRD2 (right). i, Top five GO terms in the Biological Process category enriched in the DEGs of each neuronal subpopulation in AD and PD. Only cell subpopulations with enriched GO terms are shown. Pathways with FDR-adjusted P value < 0.05 (hypergeometric test) and at least five query genes were considered statistically significant.
Five interneuron subtypes were identified, accounting for 9.32% of all neurons in the precommissural putamen, as reported58. The ‘in.PDGFD’ neurons had specific and robust expression of PDGFD, OPN3 and PTHLH (Fig. 8b and Supplementary Fig. 1b), similar to the co-expression of Opn3 with Pthlh in mouse striatal interneurons59. Cluster ‘in.CALB2’ co-expressed calretinin (CALB2) and TAC3. Striatal CALB2+ and TAC3+ interneurons have been described in rodents, NHP59 and human striata11,61. The ‘in.TH’ neurons robustly expressed tyrosine hydroxylase (TH), dopamine reuptake transporter SLC6A3, vesicular monoamine transporter-2 SLC18A2, dopaminergic neuron-specific transcription factor BNC2 and ALDH1A1 (ref.61), which defines a dopaminergic neuron subpopulation in the substantia nigra pars compacta, suggesting their dopaminergic identity. The ‘in.SST’ neurons expressed SST, NPY and NOS1 as described in the mammalian striatum11,59,60. The ‘in.SLC5A7’ cluster expressed the high-affinity choline uptake transporter SLC5A7, choline acetyltransferase CHAT and the key cholinergic neuronal function regulator LHX8, which are characteristic features of cholinergic neurons59.
Neuronal transcriptome and selective neuronal vulnerability
Pathway enrichment analysis on the conserved marker genes in each cluster found extensively shared pathways across different neuronal subpopulations related to neuronal functions (Supplementary Fig. 1c). Many neuronal clusters were uniquely enriched for specific pathways (Supplementary Fig. 1d), suggesting they represent neurons with distinct functions. Multiple neuronal death, neurodegenerative disease and amyloid- and tau-related pathways were selectively enriched in the hMSN, sMSN, in.PDGFD, in.CALB2 and in.SST neurons (Fig. 8d,f,g), suggesting a possible link to selective neuronal vulnerability in the putamen. The enrichment of multiple addiction pathways across many neuronal clusters is consistent with the known involvement of the striatum in addictive behavior63.
Analysis of MSN subtype marker gene expression revealed that sMSN represents a heterogenous population composed of both D1 and D2 MSNs, as well as a population of unknown identity. Of its 755 MSNs, 42.5% express DRD1 receptors only, 36.8% express DRD2 receptors only, and 13.5% co-expressed DRD1 and DRD2 but lacked any of the MSN subtype-specific markers. The conserved marker genes were uniquely enriched for multiple stress-related pathways, amyloid and tau protein binding, response to unfolded protein binding, chemical carcinogenesis-reactive oxygen species and negative regulation of endoplasmic reticulum stress-induced intrinsic apoptotic signaling pathway (Fig. 8d–g), suggesting that sMSN may represent MSNs that had responded to various types of stress and altered their original cellular identity or function. Interestingly, HPCA, PSAP and DKK3 are conserved marker genes overexpressed in sMSN (Fig. 8b and Supplementary Fig. 1a), all of which have neuroprotection function against various types of stress such as endoplasmic reticulum stress-induced neurodegeneration, heat stress, Aβ susceptibility and oxidative stress64–67. These results suggest that this heterogenous group of MSNs shares the same stress responses irrespective of disease.
To understand neuronal damage in AD and PD, we compared the transcriptomic responses of each neuronal cluster between disease and control conditions and detected 23–652 DEGs per cluster (Supplementary Fig. 1e and Supplementary Tables 51–69). AD neurons generally had more upregulated genes, whereas PD neurons had more downregulated genes. Pathway analyses showed broad disturbance of pathways critical to normal neuronal function in MSNs, but not in interneurons (Fig. 8i). Regulations of long-term synaptic potentiation, synaptic plasticity, neurotransmitter transport and learning or memory pathways were uniquely downregulated in D1 neurons from PD samples (Fig. 8i). This finding is consistent with previous findings that long-term synaptic potentiation is selectively impaired in dSPNs (D1 neurons) in the parkinsonian state68,69, which is a critical cellular and circuit mechanism associated with PD pathophysiology. Interestingly, pD2 and hMSN from AD samples were enriched for the APP metabolic process pathway, signifying a differential predisposition to Aβ-related pathology in these neurons.
Discussion
Astrocytes and microglia exert many essential actions that are crucial for neuronal survival and function in healthy CNS tissues. Mounting evidence demonstrates how glial cells play a key role in neurodegenerative disease33,44,70. However, most current knowledge is derived from in vitro systems or animal models whose relevance to human disease remains under debate71. Using unbiased snRNA-seq technology, we identified three astrocyte and two microglia subpopulations in human putamen that are conserved across multiple brain regions and different disease conditions, as well as between humans and mice. Importantly, our study revealed common microglia activation-associated genes and pathways shared by cognitively normal controls and diverse human disease conditions such as AD, PD and glioblastoma multiforme, irrespective of the brain region being studied. These analyses also revealed diseasespecific microglia-activation-associated transcriptomic changes linking human microglia activation to Aβ pathology, neuroinflammation and neurodegeneration. Our study discovered regional differences in pathology-associated transcriptomic changes in astrocytes and microglia, which may underlie selective regional vulnerability of the cortex and striatum. Finally, we described striatal MSN heterogeneity and neuronal transcriptomic profiles indicating disease-specific changes and selective neuronal vulnerability.
Our analyses revealed regionally distinct astrocytic transcriptomic changes relevant to neurodegenerative diseases, including differences related to Aβ pathology, neurodegeneration, neuroinflammation and synapse organization. DEG overlap examination, genome-wide gene expression change correlation analysis, pathway analysis and GWAS AD and PD risk gene expression analysis together provide strong support for distinct transcriptomic changes in AD between putamen and cortical astrocytes. Although cortical astrocytes were examined at a lower sequencing depth than the putamen astrocytes (Supplementary Table 11), the directionality of gene expression changes, the proportion of genes being dysregulated in the disease condition, the genome-wide gene expression change correlation analysis and the GWAS risk gene analyses results are independent of sequencing depth supporting the biological relevance of the findings rather than being sequencing artifacts. Regional heterogeneity in glia response to aging and injury has been described in mice and humans72. It is well documented that cortical amyloid plaques appear early in the disease and present in many nondemented older adults, whereas striatal plaques occur only at later histopathological stages of AD, and largely after dementia onset4–6. The observed region-specific astrocytic and microglial disease-pathologyrelated transcriptomic alterations might contribute to these spatial variations in disease pathology and neuronal vulnerability.
Previous comparison of signature genes of reactive microglial populations revealed a heterogenous microglial response to AD pathology in mice and humans73. By comparing pseudotime DEGs, we observed a high concordance of a set of microglia activation-associated genes shared by diverse human disease conditions and brain regions (Fig. 7a), supporting the hypothesis that reactive microglia share a common microglial response to CNS pathology, irrespective of the disease etiology37,74. The number of cells, sequencing depth, temporal dynamic nature of gene transcription regulation and the end stage at sampling all could contribute to the discrepancy of signature genes, whereas pseudotime DEGs are less affected by those factors, which may explain the differences between the two comparison methods. APOE and TYROBP were shared between human and mice with concordant expression changes in all 10 datasets (probability of 10−6), and TYROBP-APOE signaling has been implicated in the initiation of DAM phenotypes38 suggesting evolutionally conserved microglial activation mechanism. We also discovered that microglia of varying disease conditions elicit a disease-specific response relevant to disease pathology (Fig. 7d). The robust core gene signature identified in this study will help to define disease-specific roles of microglial activation in various CNS diseases.
Our study reveals shared astrocytic transcriptome changes between AD and PD but largely distinct changes for microglia, suggesting common and divergent cell-type-specific mechanisms of pathogenesis. Interestingly, the ‘amyloid precursor protein metabolic process’ was uniquely upregulated in AD MSNs, whereas ‘long-term synaptic potentiation’ was uniquely downregulated in PD neurons. Furthermore, multiple neurodegenerative disease pathways were dysregulated in astrocytes, but not in neurons. Whether disease-specific glial transcriptomics changes are causal to disease-specific neuronal changes needs future investigation. A better understanding of how neurons and glia communicate as well as whether and how those pathways in corresponding glial cells contribute to disease pathogenesis may offer new ways to combat neurodegenerative diseases.
Limitations of the study
The sample size of our study is limited. However, using the same approaches, we validated our findings in four independent datasets for both astrocytes and microglia subpopulations, suggesting that our findings are representative. All snRNA-seq studies used samples from postmortem brain tissues and shared the limitations associated with all postmortem tissue studies.
Methods
Subjects
In agreement with local ethical committee requirements, patients provided written informed consent before cognitive impairment, or the next of kinsperson supplied consent antemortem or postmortem (Washington University Institutional Review Board, Washington University School of Medicine, St Louis, MO). Clinically and neuropathologically well-defined human brain tissues were collected from the Charles F. and Joanne Knight Alzheimer Disease Research Center (Knight ADRC) and The Movement Disorders Center (MDC) Brain Bank at Washington University School of Medicine. (The clinical information and pathological characteristics are summarized in Supplementary Table 1.) The use of tissue for genetics, autoradiography and biochemistry research was approved by the Knight ADRC and MDC Leadership Committees (ethics approval reference number T1705). Dementia level was assessed by Clinical Dementia Rating (CDR)75 according to the CDR criteria for diagnosing dementia in PD. Individuals with a CDR ≥ 1 were taken. AD pathological changes were classified using Braak staging76. Braak stages of Aβ accumulation use letter ratings: (A) the initial deposits in the basal neocortex, (B) deposits that extend into the adjacent areas of the neocortex and (C) heavy deposition throughout the entire cortex. Stages of neurofibrillary pathology were characterized as transentorhinal (I-II), limbic (III-IV) and neocortical (V and VI). All the cases were previously comprehensively examined by the MDC and Knight ADRC neuropathology core for their pathologic stages for Aβ (plaque), tau (NFT) and α-synucleinopathy (Lewy body) before being released to research laboratories. The systematic neuropathological characterization and AD grading were conducted and previously reported by our team77, and α-synucleinopathy with Lewy bodies was rated according to the scheme proposed by McKeith et al.78 and modified by Burack et al.77. Histologic stains include hematoxylin and eosin. Pathological staining was performed using the related antibodies Aβ (10D5, Elan Pharmaceuticals), tau (PHF-1, Abcam) and α-synuclein (LB- 509, Zymed), as we have reported79–83. The selected cases had highly similar pathological profiles for each group in this study. The AD cases had Braak Aβ stage of C (n = 4), NFT stage V (n = 1) and VI (n = 3) and Lewy body stage of 0 (n = 4). The PD cases had Braak Aβ stage of C (n = 2), 0 (n = 1) and B (n = 1); NFT stage I (n = 2), II (n = 1), and III (n = 1); and Lewy body stage of 6 (n = 4). The cognitively healthy control cases had Braak Aβ stage of 0 (n = 4), NFT stage I (n = 1), II (n = 1) and III (n = 2), and Lewy body stage of 0 (n = 4). Although there are unavoidable pathological overlaps in Aβ and NFT in these aged patients between the three groups, the AD group had higher average stages of Aβ and NFT than the control and PD groups. In addition, the PD group had a higher Lewy body stage than AD and controls. The average age and postmortem interval time did not significantly differ across groups. The tissues harvested were as follows: four AD (two males, two females) aged 71–82 (mean: 75 ± 2) years at death, four PD (two males, two females) aged 69–77 (mean: 73 ± 2) years at death, and four age-matched healthy control cases (two males, two females) aged 73–85 (mean: 79 ± 2) years at death. No statistical methods were used to predetermine sample sizes, but our sample sizes are similar to those reported in previous publications7,8.
Sample processing and nuclei isolation
Brains were obtained at the time of the autopsy. The right hemisphere was coronally sectioned and snap-frozen using liquid nitrogen vapor. The tissue blocks were preserved at −80 °C until use. The putamen tissue (~50 mg) was carefully dissected out with a scalpel at −20 °C using the autoradiography images of dopaminergic biomarkers80–84, and the tissue was then homogenized using a glass Dounce grinder in 4 ml ice-cold homogenization buffer (HB; consisting of 0.1 mM DTT (Promega, P1171), 1X Protease inhibitor cocktail (Promega, G6521), 0.2 U μl−1 RNasin Plus RNase Inhibitor (Promega, N2615), and 0.1% Triton X-100 (Sigma, T8787) in nuclei isolation media (consisting of 10 mM Tris buffer pH 8.0 (ThermoFisher Scientific, AM9856), 250 mM sucrose (VWR 97061), 25 mM KCl (ThermoFisher Scientific, AM9640G) and 5 mM MgCl2 (ThermoFisher Scientific, AM9530G) in molecular biology grade water)). An additional 2 ml HB was added to the solution, and it was incubated on ice for five min. Then, the homogenized solutions were passed through a 70 μm cell strainer first and then filtered for an additional time with a 30 μm cell strainer. The double-strained homogenate was centrifuged (900 g, for 10 min at 4 °C), and the supernatant was removed. The remaining nuclei pellet was resuspended in 3 ml blocking buffer (BB; consisting of 1X PBS (Life Technologies, AM9625), 1% BSA (Sigma, 126625), and 0.2 U μl−1 RNasin Plus RNase Inhibitor (Promega, N2615) in molecular biology grade water). Then, 30 μl myelin remove beads was added to the nuclei suspension, and the solution was incubated at 4 °C for 15 min after resuspension. After incubation, an additional 3 ml BB was added to the solution, which was centrifuged (500 g, for five min at 4 °C), and then the supernatant was removed. Then, the resulting pellet was resuspended in 3 ml BB and incubated on a Dynamag magnet (ThermoFisher Scientific, 12301D) for 15 min at 4 °C refrigerator. Finally, the supernatant was removed and filtered through a 30 μm cell strainer. For accurate quantification, the nuclei-enriched supernatant was stained with DAPI (1:1,000) (ThermoFisher Scientific, D1306), and the nuclei were counted with a Countess II Automated Cell Counter (ThermoFisher Scientific, AMQAX1000).
Library construction and sequencing
Purified nuclei were delivered to the McDonnell Genome Institute (MGI) at Washington University School of Medicine to generate 10x Genomics libraries using Chromium Single Cell 3′ V3 Reagent Kits according to the 10x Genomics protocol. The generated libraries were sequenced on the NovaSeq S4 platform (Illumina). Sequencing saturation ranged from 60.8% to 94.8%. MGI demultiplexed raw base sequence calls generated from the sequencer into sample-specific FASTQ files.
Mapping snRNA-seq data to the reference genome and cell quality control
CellRanger 3.0.2 (10x Genomics, https://support.10xgenomics.com/) was used to align FASTQ files to the human GRCh38 pre-mRNA reference genome. The aligned reads were traced back to individual cells, and the gene expression level of individual genes was quantified based on the number of UMIs (unique molecular indices) detected in each cell. The filtered gene-cell barcode matrices generated with CellRanger were used for further analysis with the R package Seurat v3.0 (ref.13), 4.0.5 (ref.85). R version 4.0.2, 4.0.4, 4.1.1 was used for statistical analysis and plotting (R Core Team (2013). R: A language and environment for statistical computing. R Foundation for Statistical Computing, Vienna, Austria; http://www.R-project.org/).
Quality control was implemented as the first step in data analysis. We first filtered out genes that were detected in less than five nuclei. Nuclei that were doublets or low quality were further filtered out by two criteria. First, nuclei with less than 500 genes, more than 10% mitochondrial content or an extremely high number of detected genes or UMIs were filtered out. Cutoffs for UMI and gene number were determined on the basis of a scatter plot showing the number of genes as a function of the number of UMI per cell. A cutoff of 500–70,000 UMI and 500–9,000 genes was applied. Next, after unsupervised clustering, cell clusters with a mixed expression of markers from different cell types and clusters with low quality were removed, including clusters with a high percentage of mitochondrial genes and clusters without marker genes conserved across control, AD and PD groups. The initial dataset contained 38,929 cells. After these quality control procedures, we obtained 30,908 high-quality single-nucleus gene expression profiles (an average of 2,576 cells/subject) and detected a median of 2,187 genes and 4,363 transcripts per nucleus.
Cell clustering and cell-type identification
For integrative analysis, we followed the workflow described in the Seurat guided analysis for ‘Performing integration on datasets normalized with SCTransform86‘. We use SCTransform to normalize gene expression levels and to regress out variations from mitochondrial gene expressions. To integrate the single-cell data from individual donor samples, we used function SelectIntegrationFeatures (nfeatures = 3,000) to identify highly variable genes. Functions PrepSCTIntegration, FindIntegrationAnchors (normalization.method = ’SCT’) and IntegrateData (normalization.method = ’SCT’) from Seurat v3.0 were implemented. The top 3,000 most variable genes were selected as integration features and used for integration anchor selection. Principal component analysis was performed using the top 30 PCAs. UMAP analysis was performed with the top 20 dimensions. Clusters were identified with the functions FindNeighbors (dims = 1:20) and FindClusters (resolution = 0.1). A resolution of 0.1 was selected for the downstream analysis because clusters were clearly separated and matched visual inspection. Default parameters were used unless noted.
Cell-type identification
The function FindConservedMarkers (assay = ’SCT’, slot = ’data’, test. use = ’wilcox’, min.pct = 0.2, grouping.var = ’Genotype’, only.pos = TRUE) implemented in Seurat v3.0 was used for identifying marker genes that were conserved in the control, AD and PD groups. This function first calculates differentially expressed genes of each cluster against all other clusters for each condition using the function FindMarkers, and then the metap R package with default meta-analysis method metap::minimump to perform meta-analysis of P values (significance values) to generate a combined P value. max_pval < 0.05 was used as a cutoff to determine the conserved marker genes for each cluster, identifying positive markers for a given cluster that are shared by control, AD and PD. Identified markers were compared with celltype-specific markers from mouse striatum87 and human brains7–10,88. Cell type was manually annotated based on the expression for the following known marker genes: astrocytes (GFAP, AQP4, SLC1A2, ALDH1L1, GJA1, SLC1A3), endothelial cells and pericytes (FLT1, CLDN5, RGS5, PDG-FRB), immune cells and microglia (PTPRC, C1QB, CSF1R, CD74, CX3CR1, P2RY12, HLA-DRA, ITGAM, RUNX1), neurons (SYT1, SNAP25, RBFOX1, RBFOX3, GRIK2, GRIA1, GRIN2B, GAD1, GAD2, GRIN1), oligodendrocytes (MOG, MBP, MOBP, PLP1, CLDN11, SOX10, OLIG1, OLIG2) and oligodendrocyte precursors (VCAN, PCDH15, MEGF11, SOX10, OLIG1, OLIG2).
Astrocyte subcluster analysis
We first isolated nuclei of the astrocyte cluster (control = 1,203, AD = 1,642, PD = 1,433 nuclei) from the original Seurat object using the subset function. The data were split into individual samples based on the subject identity. Then we performed data integration and unsupervised clustering following the procedure similar to that used for our initial cell-type clustering using default parameters except noted below: SCTransform86 normalization (vars.to.regress = c(‘nCount_ RNA’, ‘percent.mt’), SelectIntegrationFeatures (nfeatures = 3,000), PrepSCTIntegration(anchor.features = selected.features), FindIntegrationAnchors (normalization.method = ’SCT’, anchor.features = selected.features, normalization.method = ’SCT’, reduction = ’cca’, k.filter = 170), IntegrateData (anchorset = selected.anchors, normalization.method = ’SCT’), RunPCA(npcs = 30). Additional low-quality cell clusters, including cell clusters that showed mixed expression of markers of astrocyte with markers from other cell types, which likely represent doublets, and cell clusters containing a high percentage of reads mapped to mitochondrial genes, were further filtered. To measure the effect of parameters on clustering results and determine the most stable cell population structure, a total of 48 different combinations of parameters for dimensionality (5, 10, 15, 20, 25, 30) and resolution (0.05, 0.1, 0.15, 0.2, 0.25, 0.3, 0.35, 0.4) were used to perform cell clustering. The concordance of cluster identity was measured using the adjusted Rand index (ARI) calculated using the adjustedRandIndex function implemented in the mclust R package. To measure the concordance of cell identity between using all cells (cells from control, AD and PD cases) for clustering and using only cells from AD and controls for clustering, we used different combinations of parameters to perform cell clustering in each situation, and ARI for shared cells were calculated. The clustering results were stable across a wide range of parameter combinations. With a dimensionality of 15 and resolution of 0.25, the parameters resulted in the highest ARI (0.96) between the two situations and were used for all the downstream analyses for astrocytes. The same approach and parameters were used for analyzing the Grubman et al.7, Lau et al.9 and Feleke et al.8 datasets whereas different parameters were used for Mathys et al.10 data (dimensionality = 30, resolution = 0.5).
Immune cell subcluster analysis
We first isolated nuclei of the immune cell cluster (control = 558, AD = 827, PD = 619 nuclei) from the original Seurat object using the subset function. The data were split into individual samples based on the subject identity, and we performed data integration and unsupervised clustering following the procedure similar to that used for our initial cell-type clustering using default parameters except noted below. Due to the small number of cells in one subject, some parameters were adjusted. SCTransform normalization (vars.to.regress = c(‘nCount_ RNA’, ‘percent.mt’), SelectIntegrationFeatures (nfeatures = 3000), PrepSCTIntegration(anchor.features = selected.features), FindIntegrationAnchors (normalization.method = ’SCT’, anchor.features = selected. features, normalization.method = ’SCT’, dims = 1:20, k.anchor = 5, k.filter = 20, k.score = 20, max.features = 200), IntegrateData (anchorset = selected.anchors, normalization.method = ’SCT’), RunPCA(npcs = 30). Cell clusters were defined using resolution = 0.2. To perform microglia pseudotime analysis, we isolated microglia nuclei using the subset function and determined the best parameters for obtaining the most stable microglia subpopulation structure as described above for the astrocyte subpopulation analysis. A dimensionality of 10 and resolution of 0.15 were selected for our microglia data analyses, and for the Grubman et al.7 and Lau et al.9 datasets whereas different parameters were used for the Feleke et al.8 (dimensionality = 20, resolution = 0.15) and the Mathys et al.10 (dimensionality = 40, resolution = 0.5) data.
Neuronal cell subcluster analysis
We first isolated the nuclei of the neuronal clusters (control = 2259, AD = 3343, PD = 3286 nuclei) from the original Seurat object using the subset function. The data were split into individual samples based on the subject identity, Then we performed data integration and unsupervised clustering following the procedure similar to that used for our initial cell-type clustering using default parameters except noted below. SCTransform normalization (vars.to.regress = c(‘nCount_RNA’, ‘percent.mt’)), SelectIntegrationFeatures (nfeatures = 3,000), PrepSCTIntegration(anchor.features = selected.features), FindIntegrationAnchors (normalization.method = ’SCT’, anchor. features = selected.features, normalization.method = ’SCT’, dims = 1:30), IntegrateData (anchorset = selected.anchors, normalization. method = ’SCT’), RunPCA(npcs = 30). Additional low-quality cell clusters, including cell clusters that showed mixed expression of markers of neurons with markers from other cell types, which likely represent doublets, and cell clusters that containing a high percentage of reads that mapped to mitochondrial genes, were further filtered. Cell clusters were defined using a dimensionality of 20 and a resolution of 0.3. Cluster ‘ncD1,’ a cluster discretely separate from the other clusters but clustered with ‘sMSN,’ was manually selected using the CellSelector function of the Seurat R package. Conserved marker analysis of the cluster confirmed it was transcriptionally distinct, with its unique marker genes. The neuronal subtypes were manually annotated using the following markers: MSNs (PPP1R1B, MEIS2), interneurons (ELAVL2, PDGFD, OPN3, CALB2, TAC3, TH, SLC6A3, SST, NPY, SLC5A7, LHX8), D1 and D2 (DRD1, DRD2), classical D1 (TAC1), classical D2 (PENK), matrix MSNs (STXBP6, EPHA4) and patch MSNs (KCNIP1, BACH2).
Analysis of gene differential expression
FindConservedMarkers function (assay = ’SCT’, slot = ’data’, test. use = ’wilcox’, min.pct = 0.2) was used to determine statistically significant cluster marker genes that were conserved in the control, AD and PD cases. A gene with meta-analysis combined P value < 0.05 determined by the default function metap was determined to be statistically significant. FindMarkers function (assay = ’SCT’, slot = ’data’, test.use = ’wilcox’, min. pct = 0.2) was used to determine differentially expressed genes (DEGs) in disease conditions compared to the controls. We used base = exp(1) (the default parameter for calculating fold change in the DEG analysis implemented in Seurat v3.0) for all the comparisons to keep the analysis consistent within the manuscript. A gene with a Benjamini–Hochberg (FDR) adjusted P value < 0.05 and a natural logarithm of fold change > 0.25 or < −0.25 was determined to be statistically significant. An absolute value of logFC > 0.25 (natural logarithm of fold change, Seurat v3.0 default parameter) is equivalent to 1.28-fold.
Gene set enrichment analysis and comparison with previously published microglia-activation-associated pseudotime DEGs
GO and KEGG89 pathway enrichment analyses were performed using the R package clusterProfiler v3.16.1 (ref.90). Results with FDR-corrected P value < 0.05 and at least five query genes were reported as significantly enriched pathways. We performed GO term enrichment analysis under the following three sub-ontologies: biological process, molecular function and cellular component. Gene signatures of DAM were obtained from Keren-Shaul et al.37. Gene signatures of disease-associated astrocyte (DAA) were obtained from Habib et al.14. Signature gene enrichment was evaluated using the hypergeometric test implemented in the phyper function in the R Hypergeometric package with lower.tail= FALSE. The total number of features that were detected at least once in the cell population being analyzed was used as the background gene set in GO and KEGG pathway enrichment analysis.
To compare with previously published pseudotime DEGs of activated microglia populations, pseudotime DEGs and direction of change as the cells transition from homeostatic to activated states were retrieved from the following publications: From Sankowski et al.48, ‘supplementary table 11‘ was downloaded. From Keren-Shaul et al.37, Supplementary Table 7 was downloaded. Gene names and gene expression direction changes were obtained Sala Frigerio et al.45 (Figure S5 and main text; this is not a complete list of pseudotime DEGs, as these authors only reported AD risk genes in Figure S5). The data were plotted using R package ComplexHeatmap version 2.12.0 (ref. 91).
Statistics and reproducibility
No statistical methods were used to predetermine sample sizes, but our sample sizes are similar to those reported in previous publications. Wilcoxon rank sum test is a nonparametric test, which does not require normal distribution of the data. The study participants were allocated into groups based on their clinical diagnoses. We selected one case from each group for RNAscope mRNA in situ hybridization combined with immunohistochemistry assays. We were not blinded to allocation during experiments and outcome assessment, although the F3 RNAScope in situ hybridization signal quantifications were conducted blind to the conditions of the experiments. The sample of PD subject 1654 was replaced with the sample of PD subject 5212 in F3 RNAScope in situ hybridization signal quantifications experiment because not enough tissue from subject 1654 was available for the experiment. Our findings were replicated in four independent datasets for both astrocytes and microglia subpopulations, suggesting that our findings are representative.
Reporting summary
Further information on research design is available in the Nature Portfolio Reporting Summary linked to this article.
Extended Data
Extended Data Fig. 1 |. snRNA-seq profiling and characterization of major cell types.
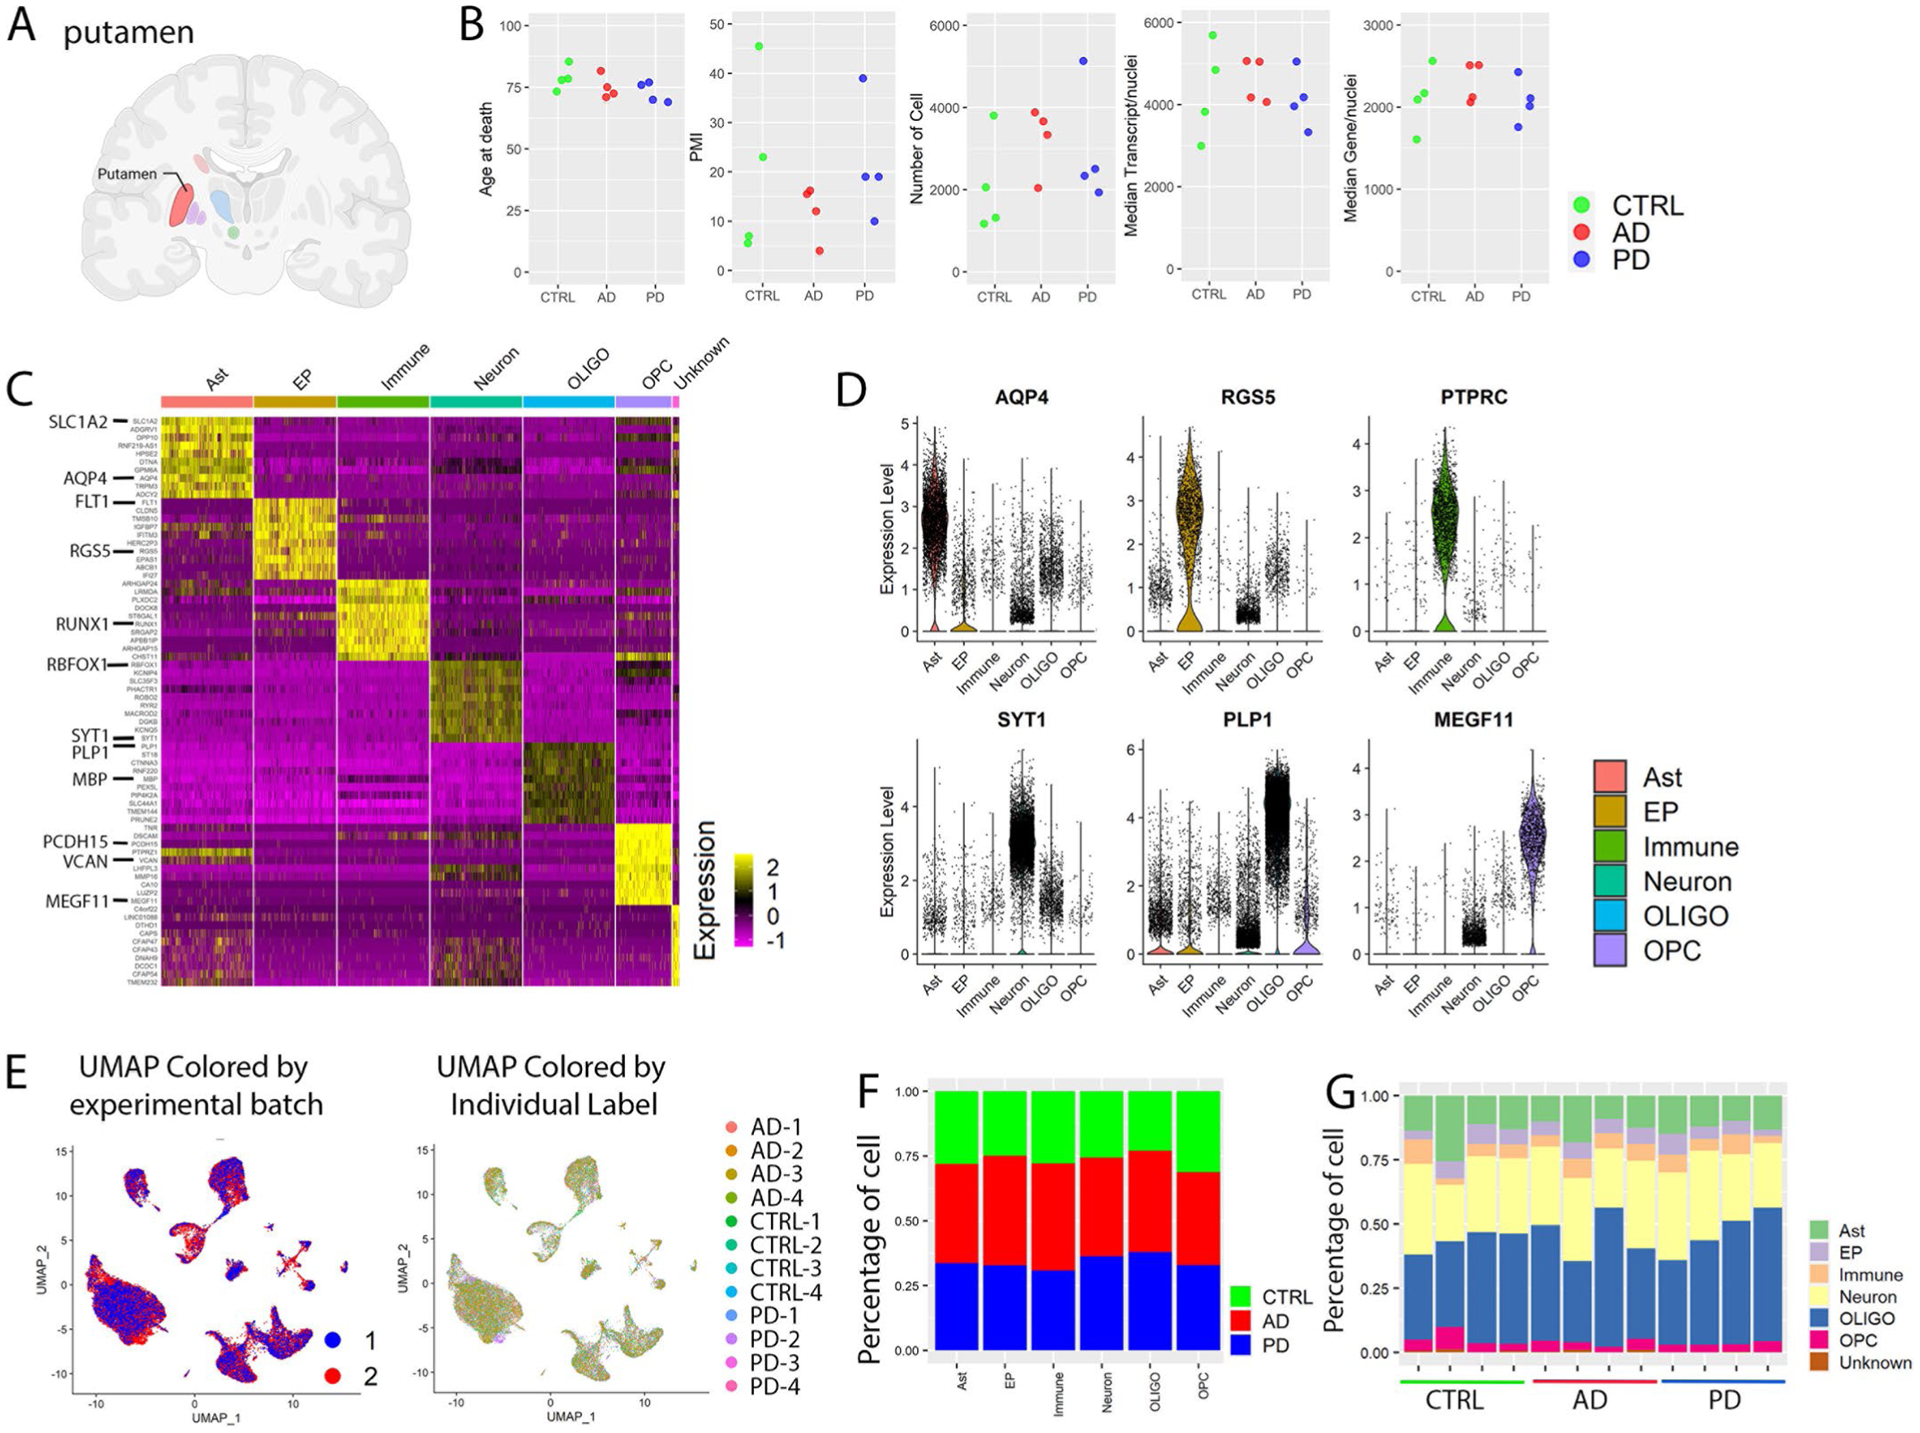
a, Brain region analyzed with snRNA-seq. Created with BioRender. com. b, Comparison of age, postmortem interval (PMI), number of cells, the median number of transcripts and median number of genes per nucleus among control, AD and PD groups. c, Heatmap of the relative expression level of top 10 marker genes for each cell type. d, Violin plots of gene expression levels of known cell-type-specific marker genes. e, UMAP plot colored by experimental batch or individual label. UMAP were generated using the same parameters as described in Fig. 1. f,g, Percentage of cells from (f) each disease group or (g) individuals of each disease group in each of the major cell type. Ast: Astrocyte; EP: Endothelia cell and pericyte; Immune: Immune cell including microglia; OLIGO: Oligodendrocyte; OPC: Oligodendrocyte precursor cell. Conserved marker genes were determined by FindConservedMarkers using Wilcoxon Rank Sum test and metap R package with meta-analysis combined P value < 0.05 comparing gene expression in the given cluster with the other cell clusters for AD (n = 4), PD (n = 4) and the controls (n = 4).
Extended Data Fig. 2 |. Identification and validation of the three astrocytes subpopulations.
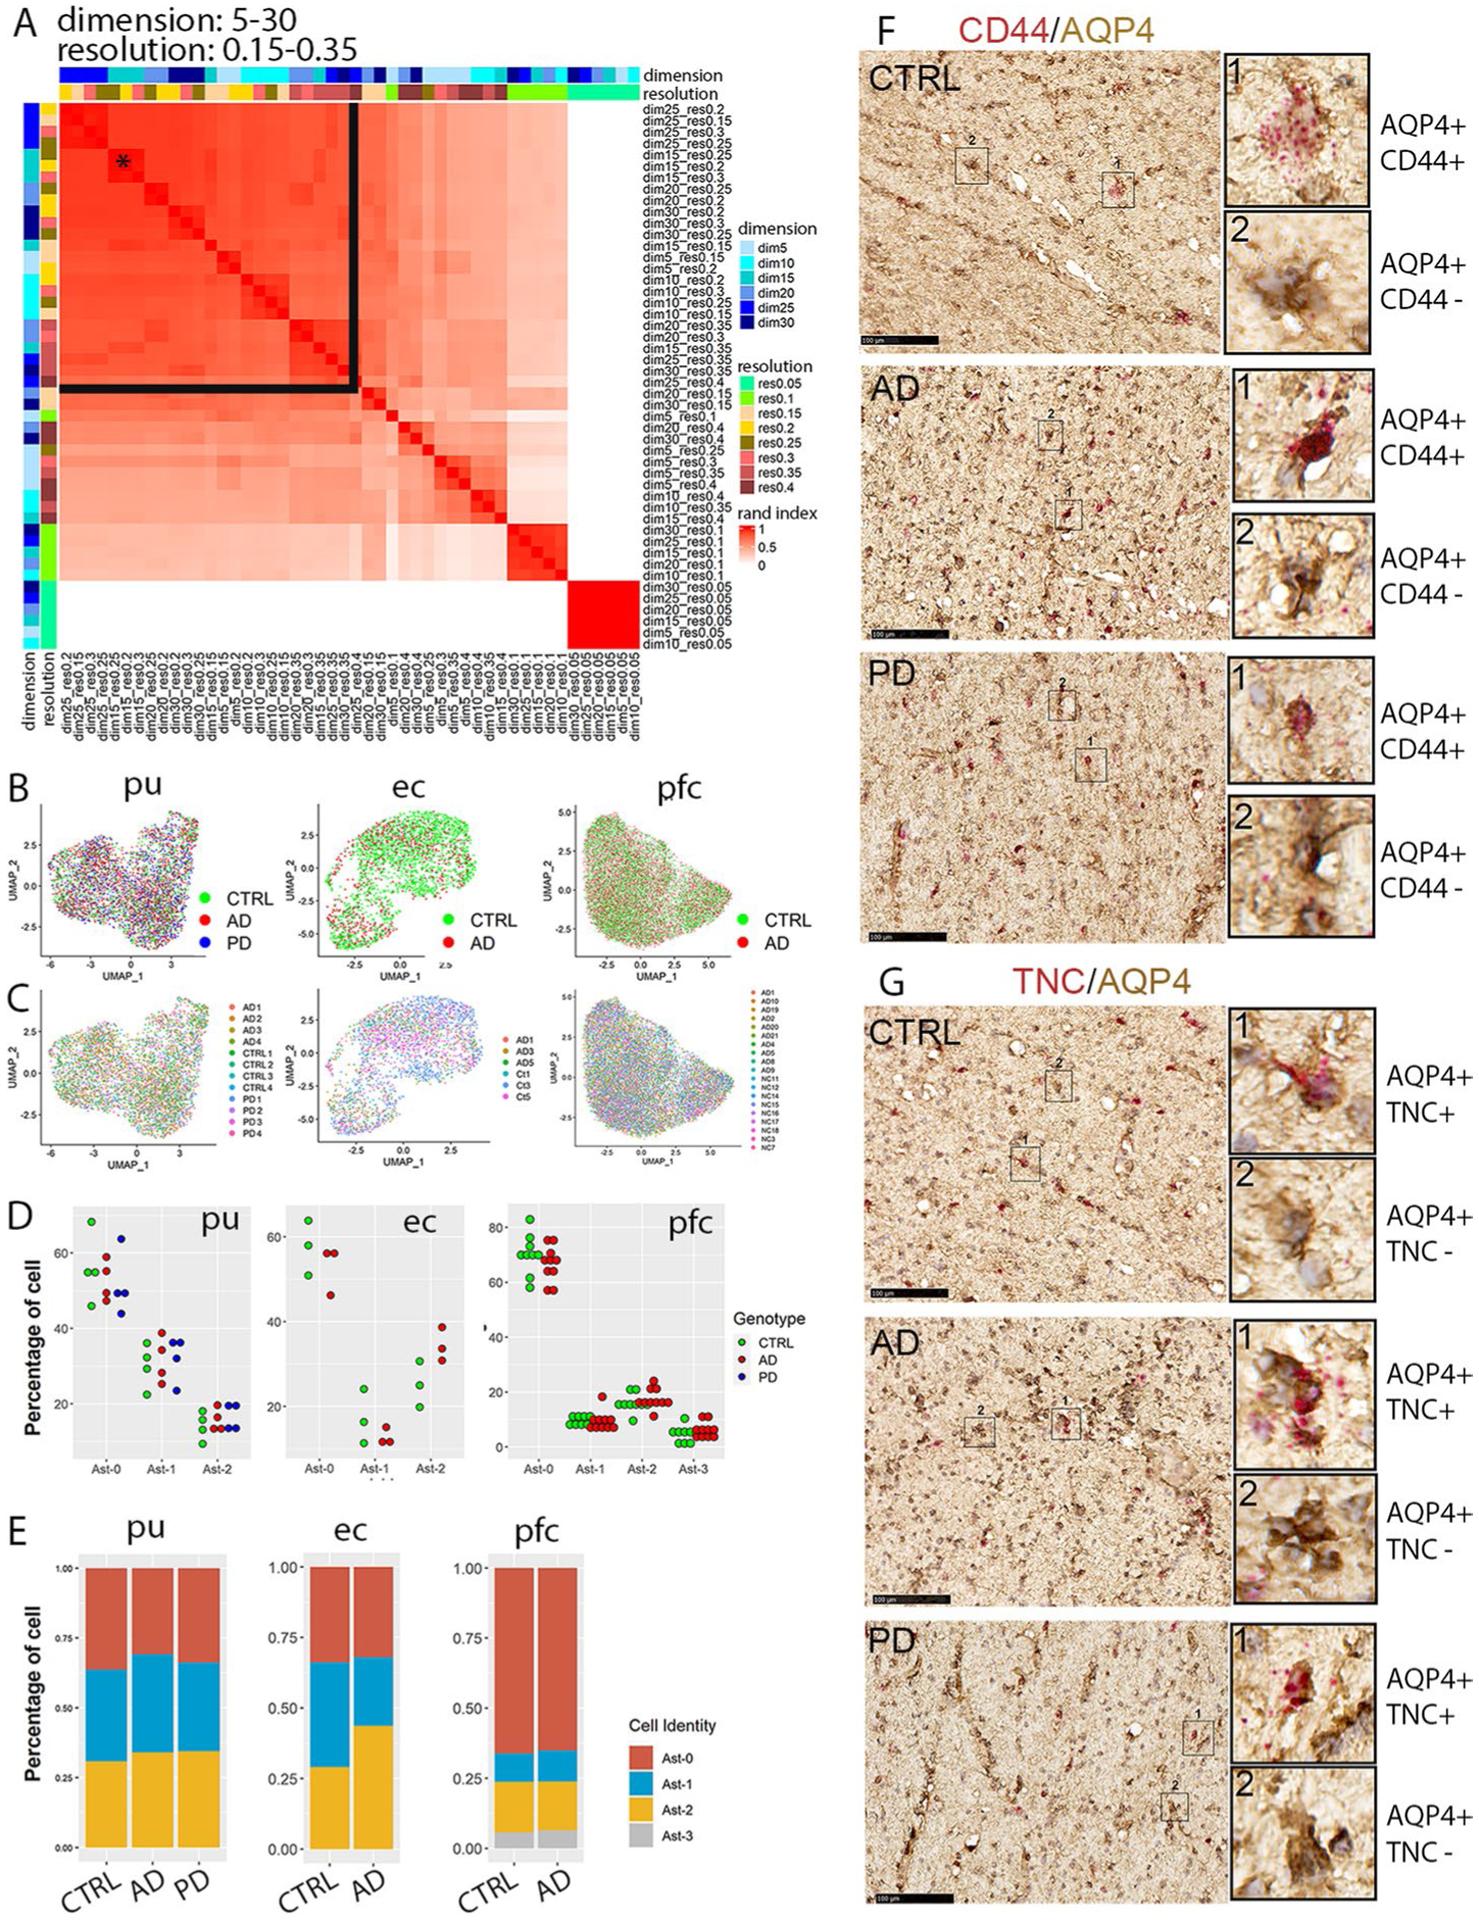
a, Heatmap plot of the adjusted rand index (ARI) of pair-wise clustering result comparison using all cells with a range of dimensionality (5–30) and resolution (0.05–0.35). The black star indicates the parameter selected for all downstream analyses including analyses of entorhinal and prefrontal cortex astrocytes (dimensionality = 15, resolution = 0.25). The black lines delineate the range of parameters that generated high ARIs. b,c, UMAP visualization of subclusters of astrocytes colored by (b) disease diagnosis or (c) individual identity. d, Distribution of cells from each diagnostic group in the astrocyte subpopulations. Each dot represents an individual except entorhinal cortex data where each dot represents samples from two subjects that were processed together. e, Distribution of cells from each astrocyte subpopulation in different diagnostic groups. f,g, RNAscope in situ hybridization (ISH) analysis of Ast-2 conserved marker genes CD44 (f) and TNC (g) transcript expression (red) and immunohistochemistry staining (brown) of AQP4 in the internal capsule tissue sections of the same subjects of the control (CTRL), AD and PD groups shown in Fig. 1. For all data, the experiment was performed once. Hematoxylin-positive cell nuclei are shown in blue. Scale bar = 100 μm.
Extended Data Fig. 3 |. Characterization of astrocyte subpopulations in the prefrontal cortex (pfc) of Mathys et al., 2019 and the anterior cingulate cortex (acc) of the Feleke et al. 2021 data.
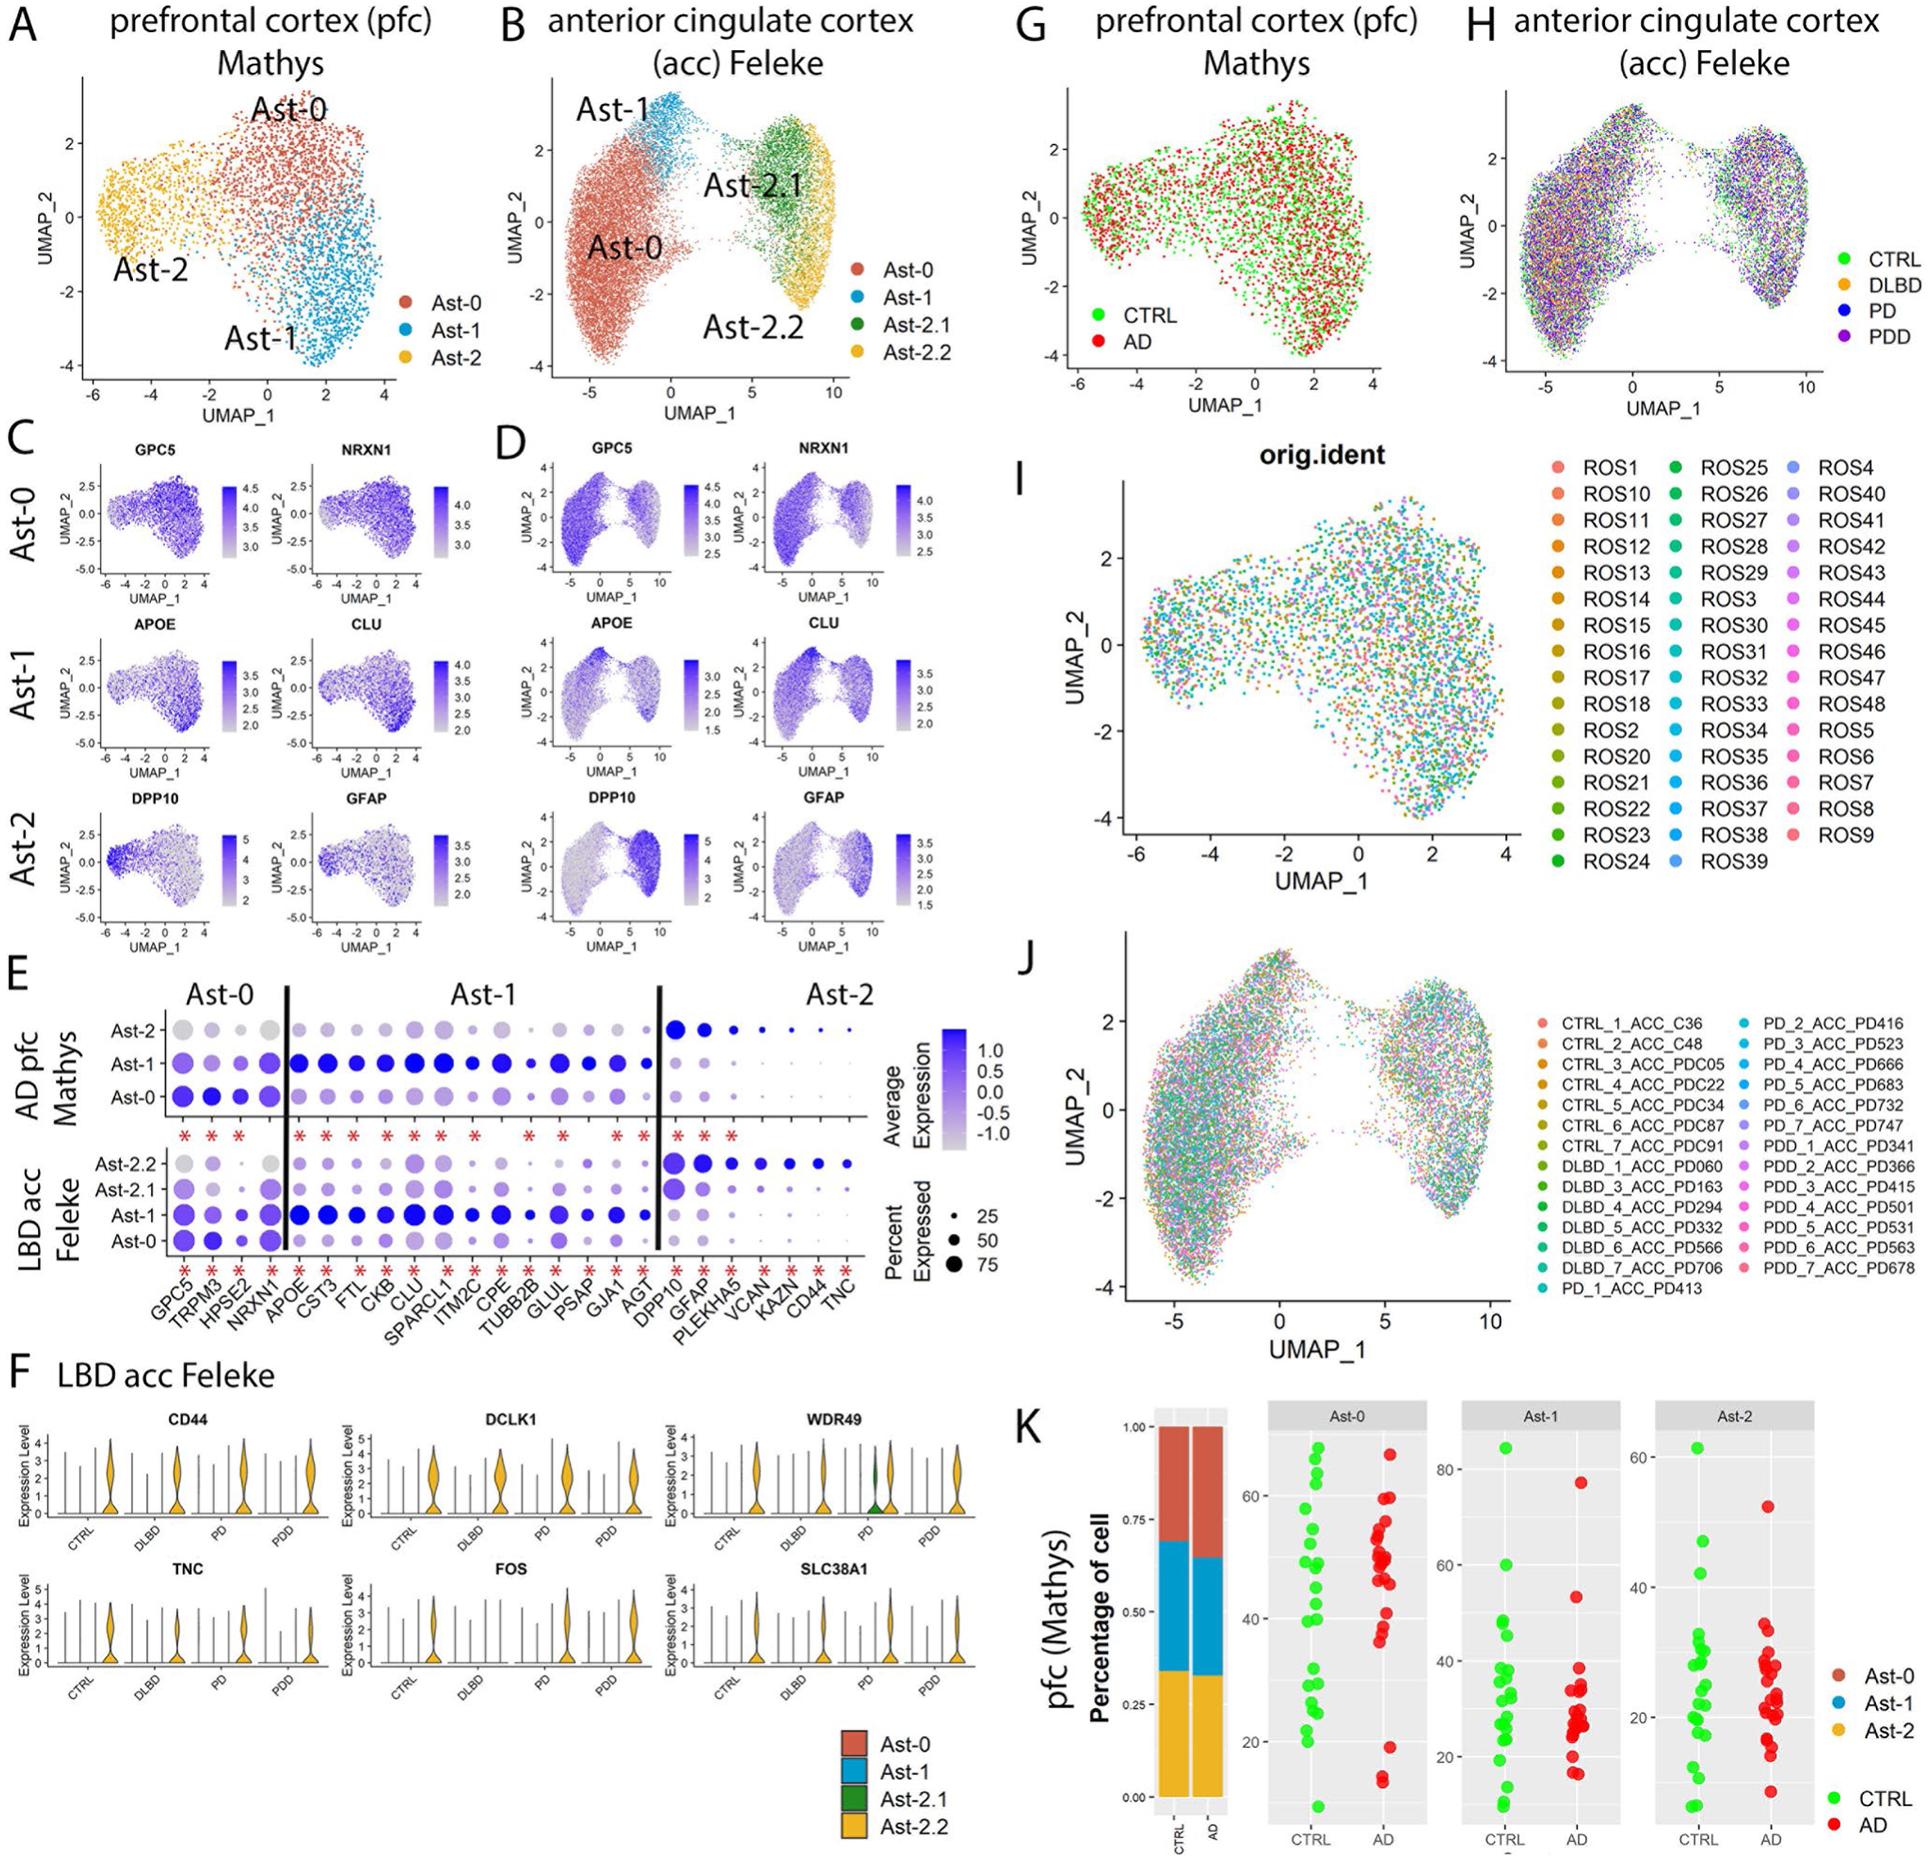
a,b, UMAP visualization of astrocyte subpopulations colored by cluster identity for (a) prefrontal cortex and (b) anterior cingulate cortex astrocytes. c,d UMAP visualization of astrocyte subpopulations colored by conserved marker gene expression levels for (c) prefrontal cortex and (d) anterior cingulate cortex. e, Dot plot of conserved marker gene expression levels in Ast-0, Ast-1 and Ast-2 astrocytes from the two brain regions. f, Violin plot showing the expression of Ast-2 conserved marker genes shared with putamen Ast-2. g–j UMAP visualization of subclusters of astrocytes colored by (g,h) disease diagnosis or (i,j) individual identity. k, The distribution of cells from each astrocyte subpopulation in different diagnostic groups (left) and the distribution of cells from each diagnostic group in the astrocyte subpopulations (right) of the Mathys et al., 2019 data. Each dot represents an individual. Conserved marker genes were genes whose expression is significantly higher than its expression in other cell clusters in all diagnostic groups determined by FindConservedMarkers using Wilcoxon Rank Sum test and metap R package with meta-analysis combined P value < 0.05. Red asterisks (*) indicate statistical significant conserved marker genes.
Extended Data Fig. 4 |. Characterization and comparison of the three astrocytes subpopulations from the putamen (pu), entorhinal cortex (ec), and prefrontal cortex (pfc) of Lau et al. data.
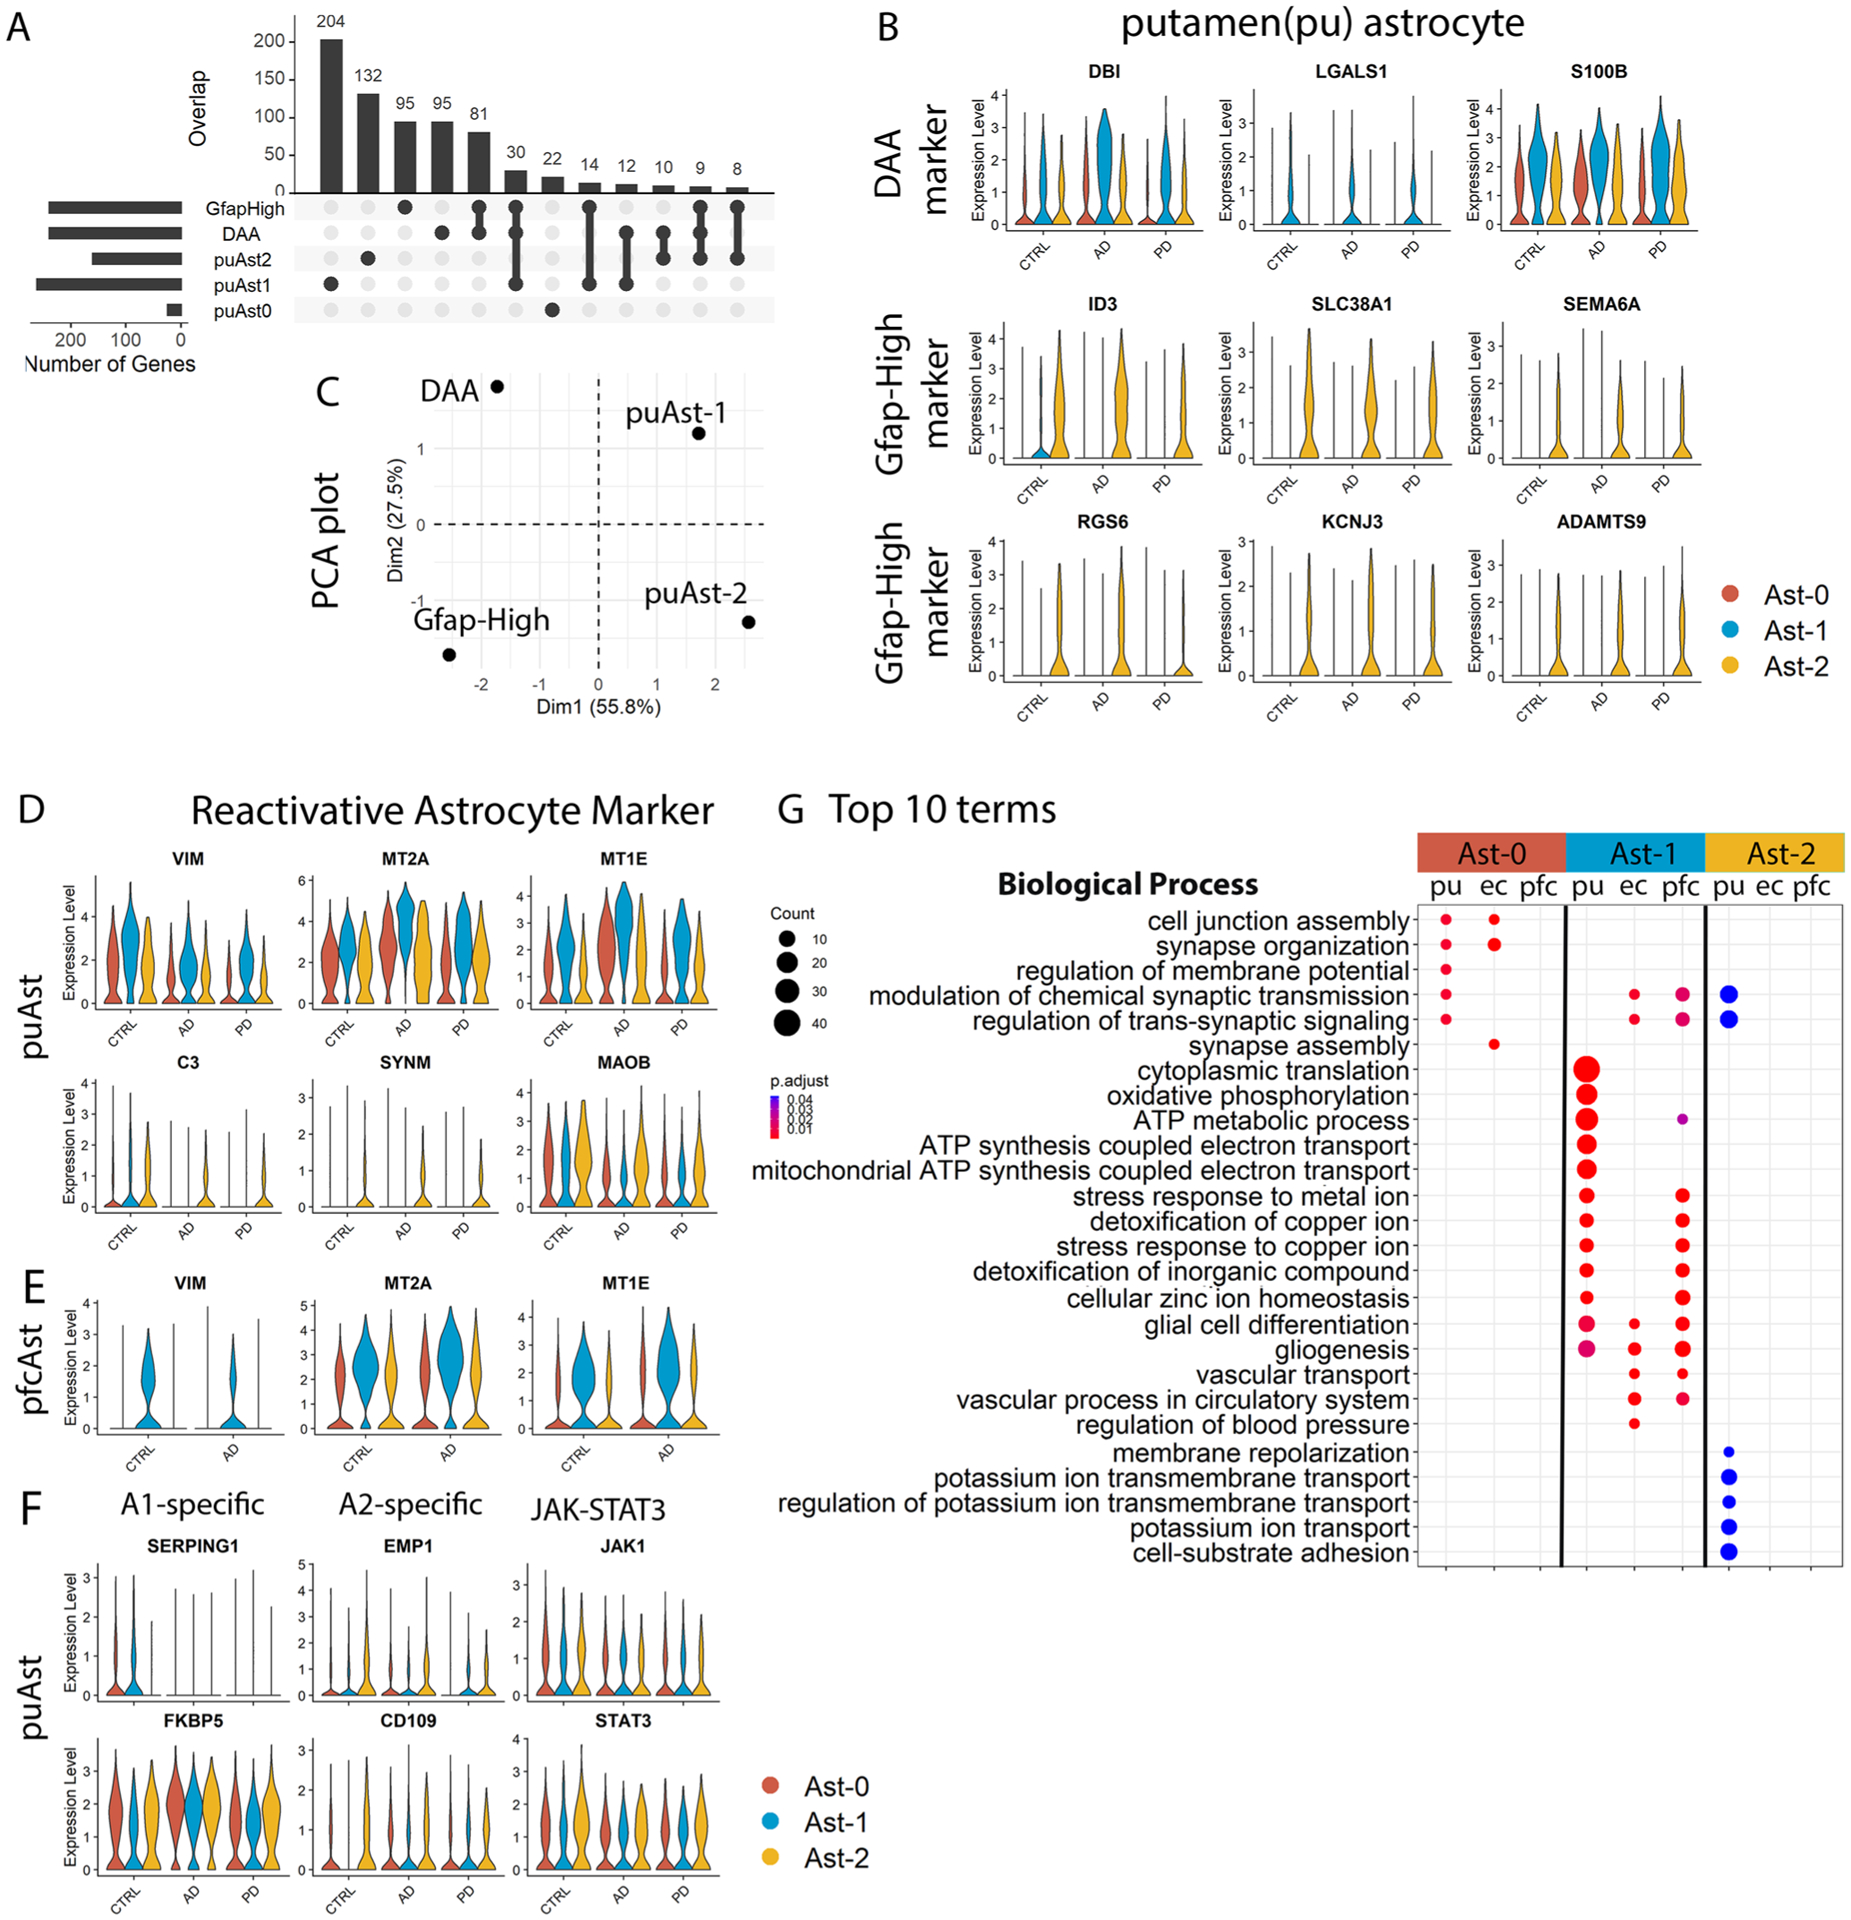
a, Upset plot showing the overlap between putamen conserved marker genes of Ast-0, Ast-1 and Ast-2 astrocyte with marker genes of mouse DAA and Gfap-high astrocytes from Habib et al., 2020. b, Violin plots showing the expression level distributions of orthologous genes of murine DAA and Gfap-high astrocyte marker genes in the putamen astrocytes. c, PCA plot using murine DAA and Gfap-high astrocyte marker gene logFC of gene expression (comparing murine DAA and Gfap-high astrocyte with Gfap-low astrocytes, downloaded from Habib et al., 2020) and the logFC of the human orthologous genes (comparing putamen Ast-1 and Ast-2 with Ast-0 astrocytes). d,e, Violin plots showing the expression level distributions of reactive astrocyte marker genes in astrocytes from the (d) putamen and (e) prefrontal cortex. f, Violin plots showing the expression level distributions of A1-, A2-specific activated astrocyte markers and JAK-STAT3 pathway genes. g, Top 10 GO terms in the Biological Process category enriched in the astrocyte subpopulation signature genes (hypergeometric test, FDR-adjusted P value < 0.05, ≥ 5 query genes). Conserved marker genes plotted in panel (b), (d) and (e) were determined by FindConservedMarkers using Wilcoxon Rank Sum test and metap R package with meta-analysis combined P value < 0.05 comparing gene expression in the given cluster with the other cell clusters for AD (n = 4), PD (n = 4) and the controls (n = 4). Genes plotted in (f) were not statistically significantly higher in any of the astrocyte subpopulations.
Extended Data Fig. 5 |. Comparison of differentially expressed genes (DEGs) of the three astrocyte subpopulations from the putamen (pu), entorhinal cortex (ec), and prefrontal cortex (pfc) from the Lau et al., data.
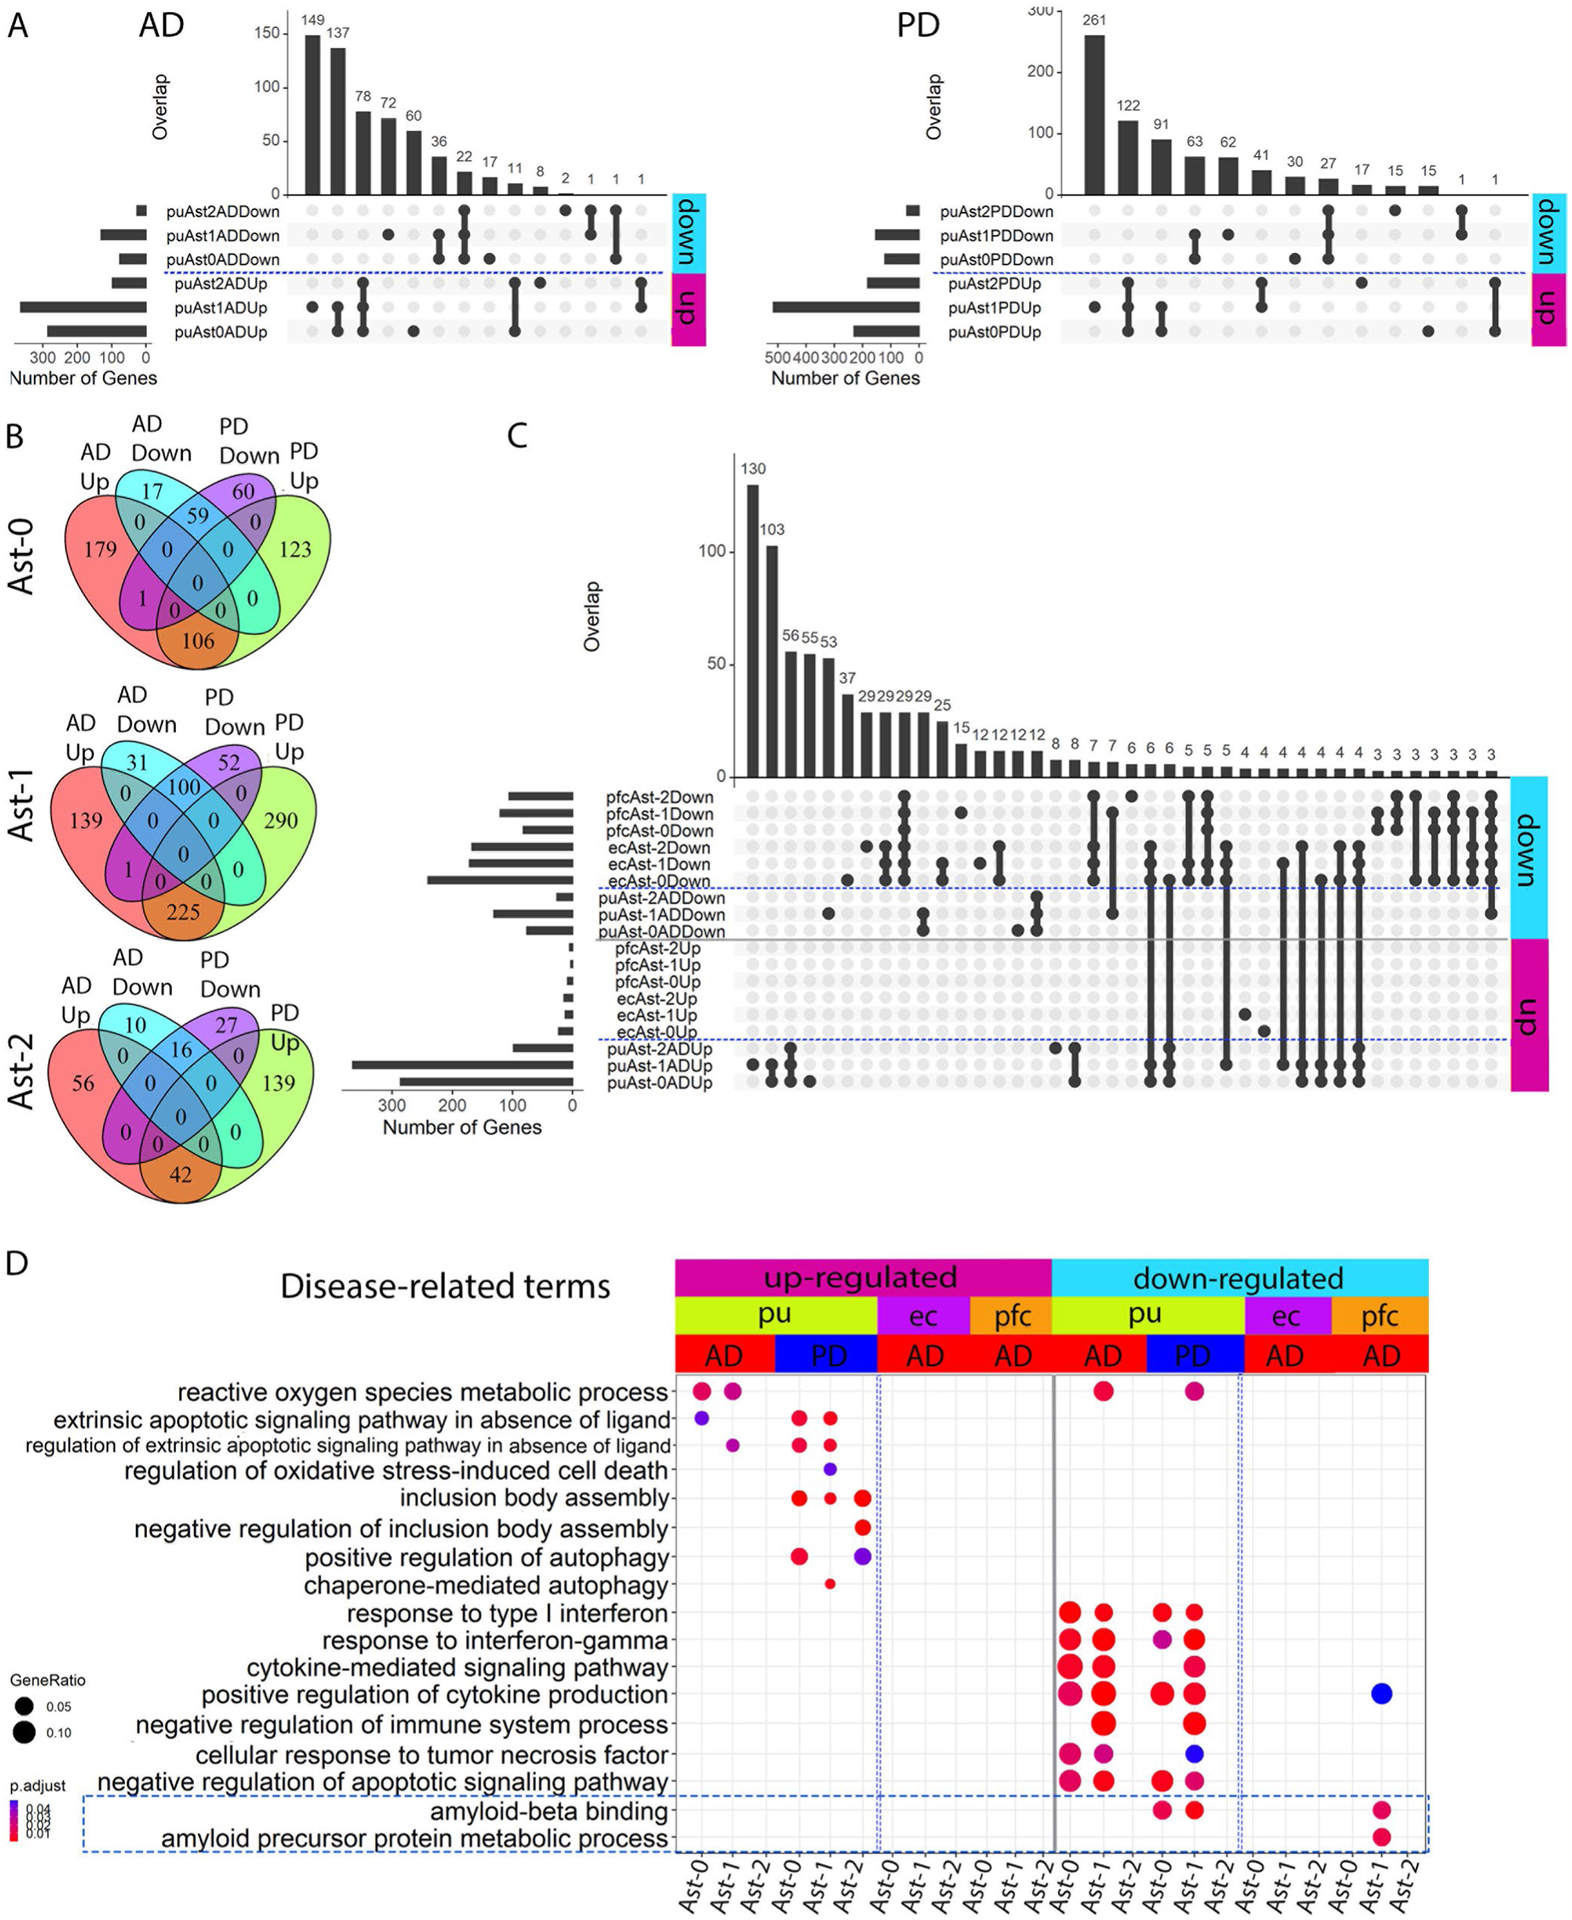
a, UpSet plot showing the number of overlapping up- and downregulated DEGs among the three astrocyte subpopulations for AD (left) and PD (right) astrocytes. b, Venn diagram showing the overlap of up- and downregulated DEG between AD and PD in each putamen astrocyte subpopulation (hypergeometric test). c, UpSet plot showing the overlap of DEGs that were up- or downregulated in AD between putamen (pu), entorhinal cortex (ec) and prefrontal cortex (pfc) astrocyte subpopulations. d, Disease-related Gene Ontology (GO) terms enriched in the astrocyte DEGs (hypergeometric test, FDR-adjusted P value < 0.05, ≥ 5 query genes). UP: upregulated in disease samples. Down: downregulated in disease samples.
Extended Data Fig. 6 |. Identification of immune cells and validation of microglia subpopulations.
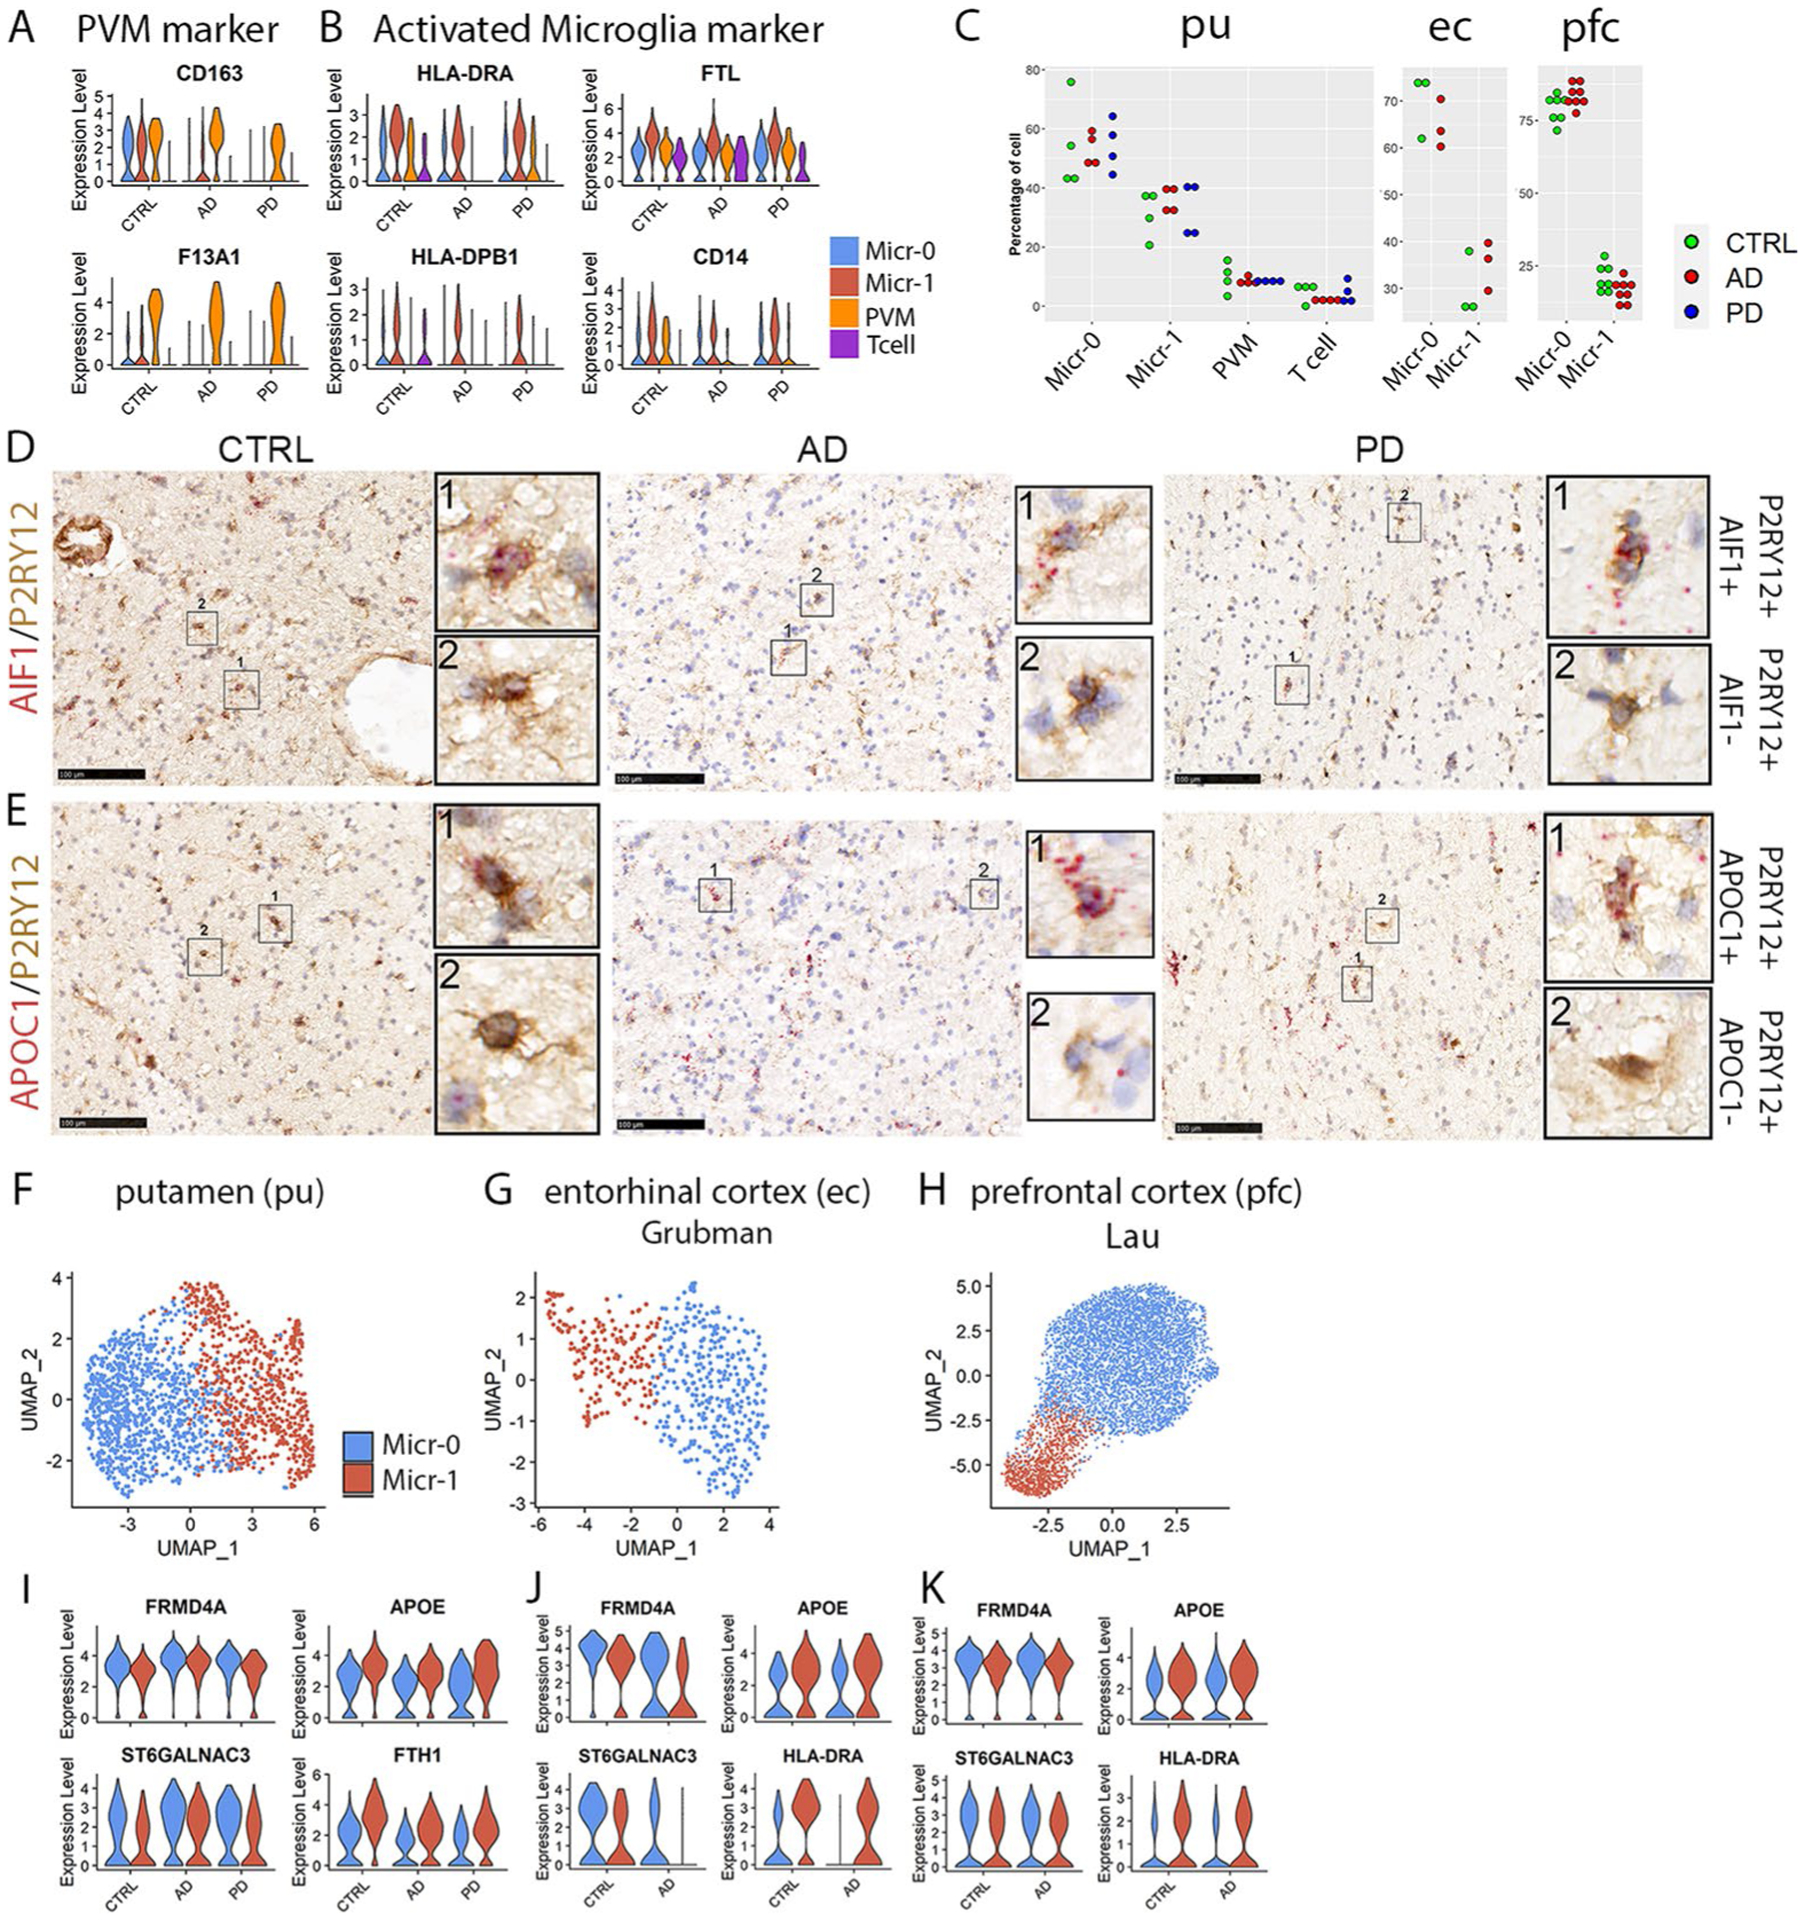
a,b, Violin plots showing the expression level distributions of marker genes for (a) PVM and (b) activated microglia. c, Distribution of percentage of cells from each subject in each immune cell cluster of the putamen (pu), entorhinal cortex (ec) from the Grubman et al. data and prefrontal cortex (pfc) from the Lau et al. data (one-way ANOVA or student’s t-test). Each dot represents a subject except the ec data. d,e, Immunohistochemistry staining (brown) of microglia marker protein P2RY12 and RNAscope in situ hybridization (ISH) analysis (red) of (d) AIF1 and (e) APOC1 transcript expression in the internal capsule tissue of the same subjects shown in Fig. 1. Hematoxylin-positive cell nuclei are shown in blue. For all data, the experiment was performed once. f–h, UMAP visualization of only microglia subpopulations from (f) pu, (g) ec and (h) pfc. UMAPs were generated using a dimensionality of 10 and resolution of 0.15. i–k, Violin plots showing the expression level distributions of conserved microglial subpopulation marker genes in putamen (i), entorhinal cortex (j) and preprontal cortex (k) microglia subpopulations. Conserved marker genes plotted in panel (a), and HLA-DRA, HLA-DPB1, FTL and CD14 plotted in panel (b) were determined by FindConservedMarkers using Wilcoxon Rank Sum test and metap R package with meta-analysis combined P value < 0.05 comparing gene expression in the given cluster with the other cell clusters for AD (n = 4), PD (n = 4) and the controls (n = 4).
Extended Data Fig. 7 |. Four distinct immune cell populations in (A-D) the prefrontal cortex (pfc) of the Mathys et al., and (E-H) the anterior cingulate cortex (acc) data of the Feleke et al. data.
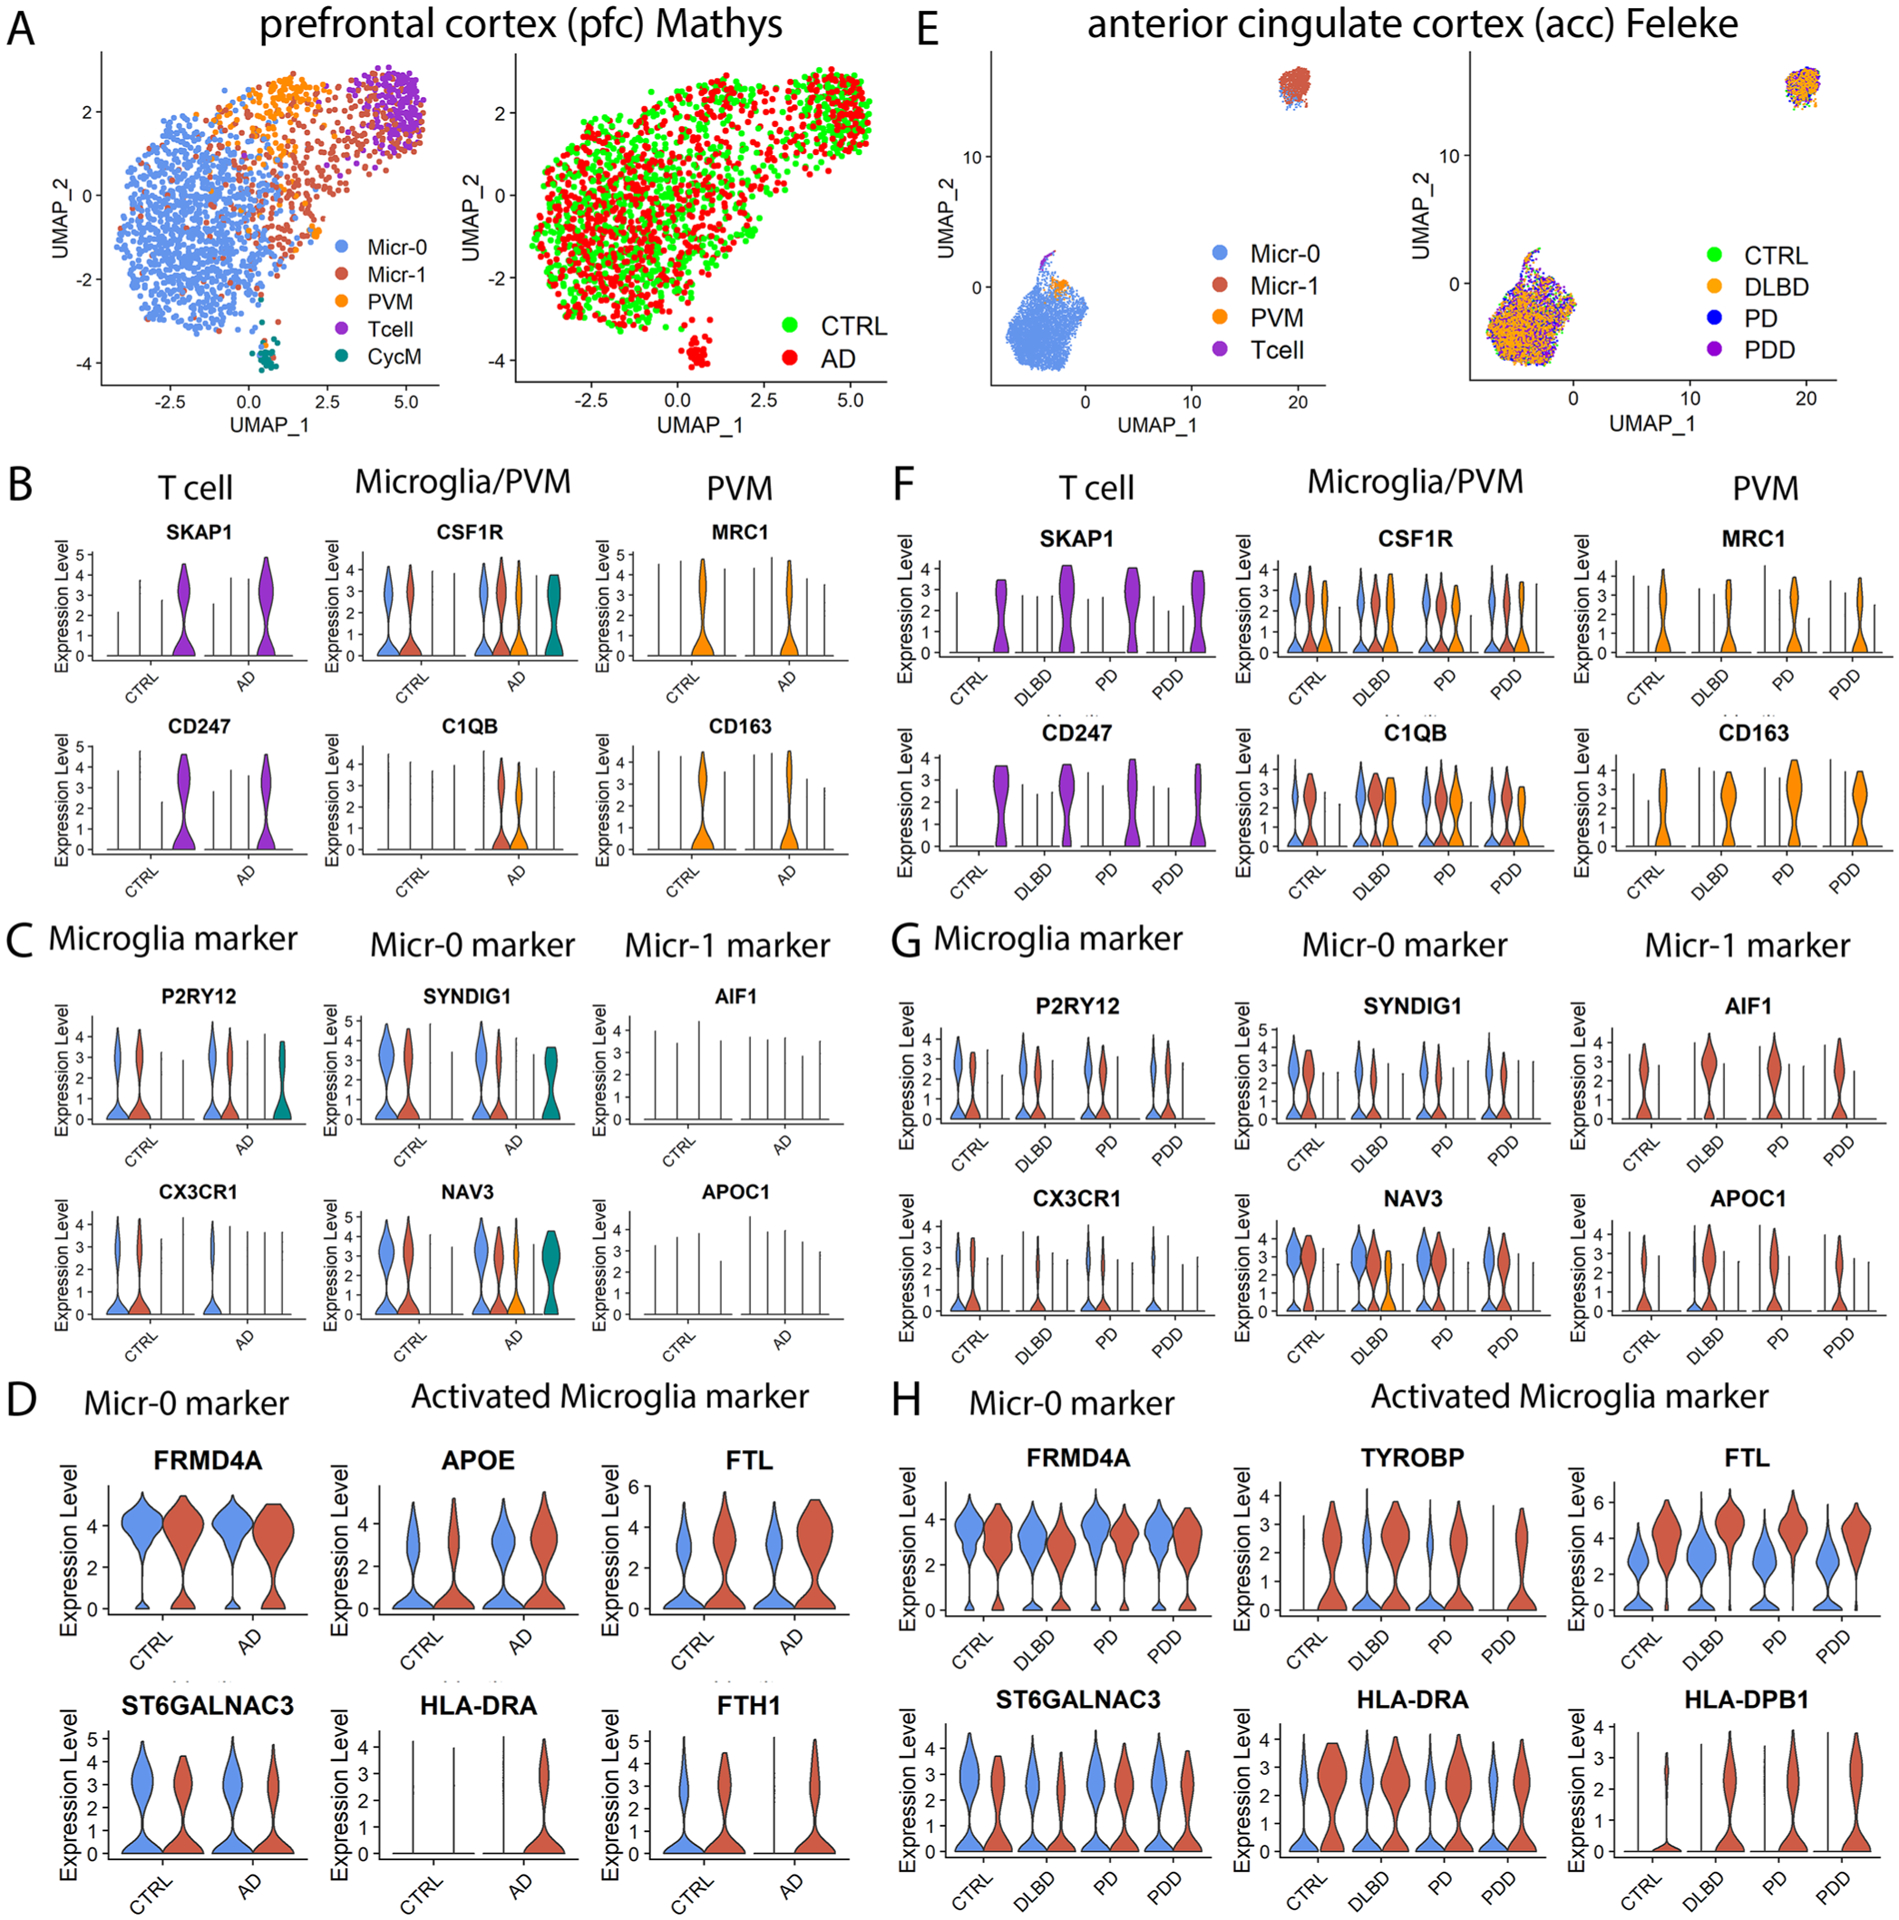
a,e, UMAP visualization of subclusters of immune cells colored by cell cluster (left) or disease diagnosis (right). UMAPs were generated using parameters of dimensionality of 40 and resolution of 0.5 for the Mathys et al. data (AD n = 24, controls n = 24) and dimensionality of 20 and resolution of 0.15 for the Feleke et al. data (n = 7 each for the control, DLBD, PD and PDD samples). Violin plots showing the expression level distributions of genes for (b, f) T cell, microglia and PVM shared markers and PVM unique markers; (c, g) microglia-specific markers, and microglia subpopulation markers; (d, h) Micr-0 marker and activated microglia markers. The color code is the same as in (a) and (e), respectively. The conserved marker genes were determined by FindConservedMarkers using Wilcoxon Rank Sum test and metap R package with meta-analysis combined P value < 0.05 comparing gene expression in the cells of given cluster with that of the other cells. PVM: perivascular macrophage; CycM: cycling microglia.
Extended Data Fig. 8 |. Comparison of microglial pseudotime DEGs.
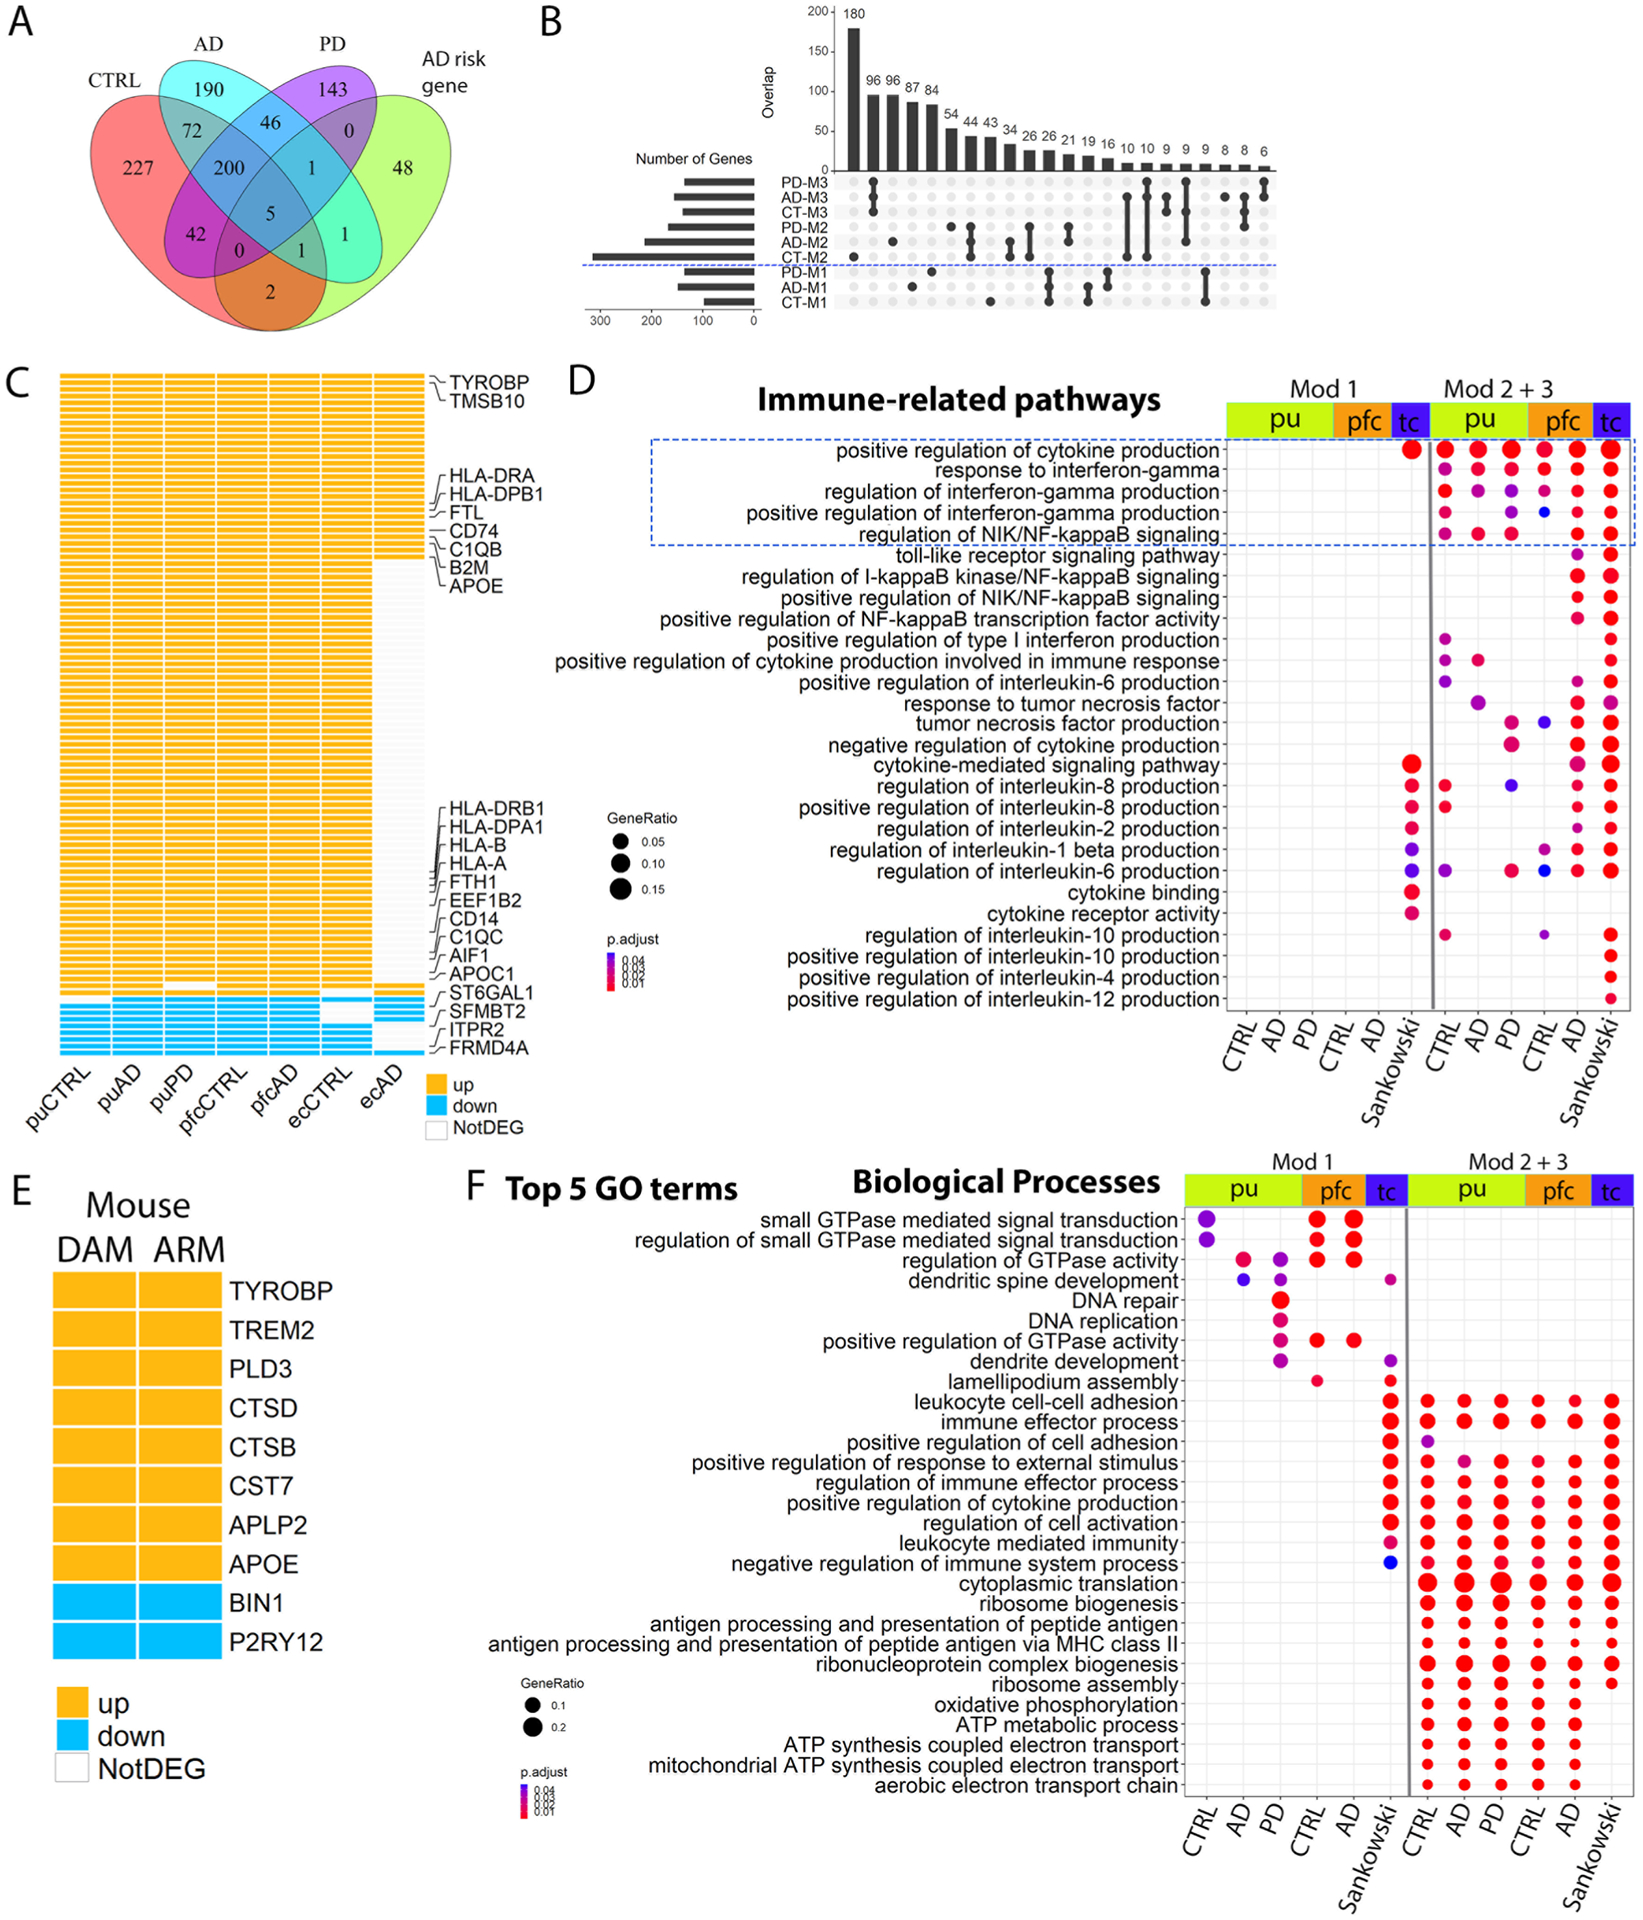
a, Venn diagram showing the overlap between pseudotime DEGs of control, AD and PD microglia with AD-risk genes (hypergeometric test). Pseudotime DEGs are genes whose expression significantly associated with pseudotime progression (generalized addictive model, FDR-adjusted P value < 0.05). b, UpSet plot showing the overlap between control, AD and PD microglial pseudotime gene coexpression modules from putamen microgla. c, Heatmap showing pseudotime DEGs shared by human activated microglia from the putamen (pu) of cognitively normal controls, AD and PD samples, from prefrontal cortex (pfc) of the control and AD samples and from the entorhinal cortex (ec) of the control and AD samples. d, GO terms related to immune functions enriched in the microglia pseudotime DEGs. e, Heatmap showing pseudotime DEGs shared by the mouse activated microglia DAM and ARM. f, Top 5 GO terms in the biological process category enriched in the microglia pseudotime DEGs. Pathways with FDR-adjusted P value < 0.05 (hypergeometric test) and at least five query genes were considered statistically significant. DAM: Disease-associated microglia; ARM: activated response microglia. UP: upregulated during pseudotime progress (module 2 and 3 genes). Down: downregulated during pseudotime progress (module 1 genes). Mod 1: module 1 genes; Mod 2 + 3: module 2 and 3 genes combined.
Extended Data Fig. 9 |. Microglia transcriptomic changes in disease contributed to Aβ pathology, tauopathy and neuronal death.
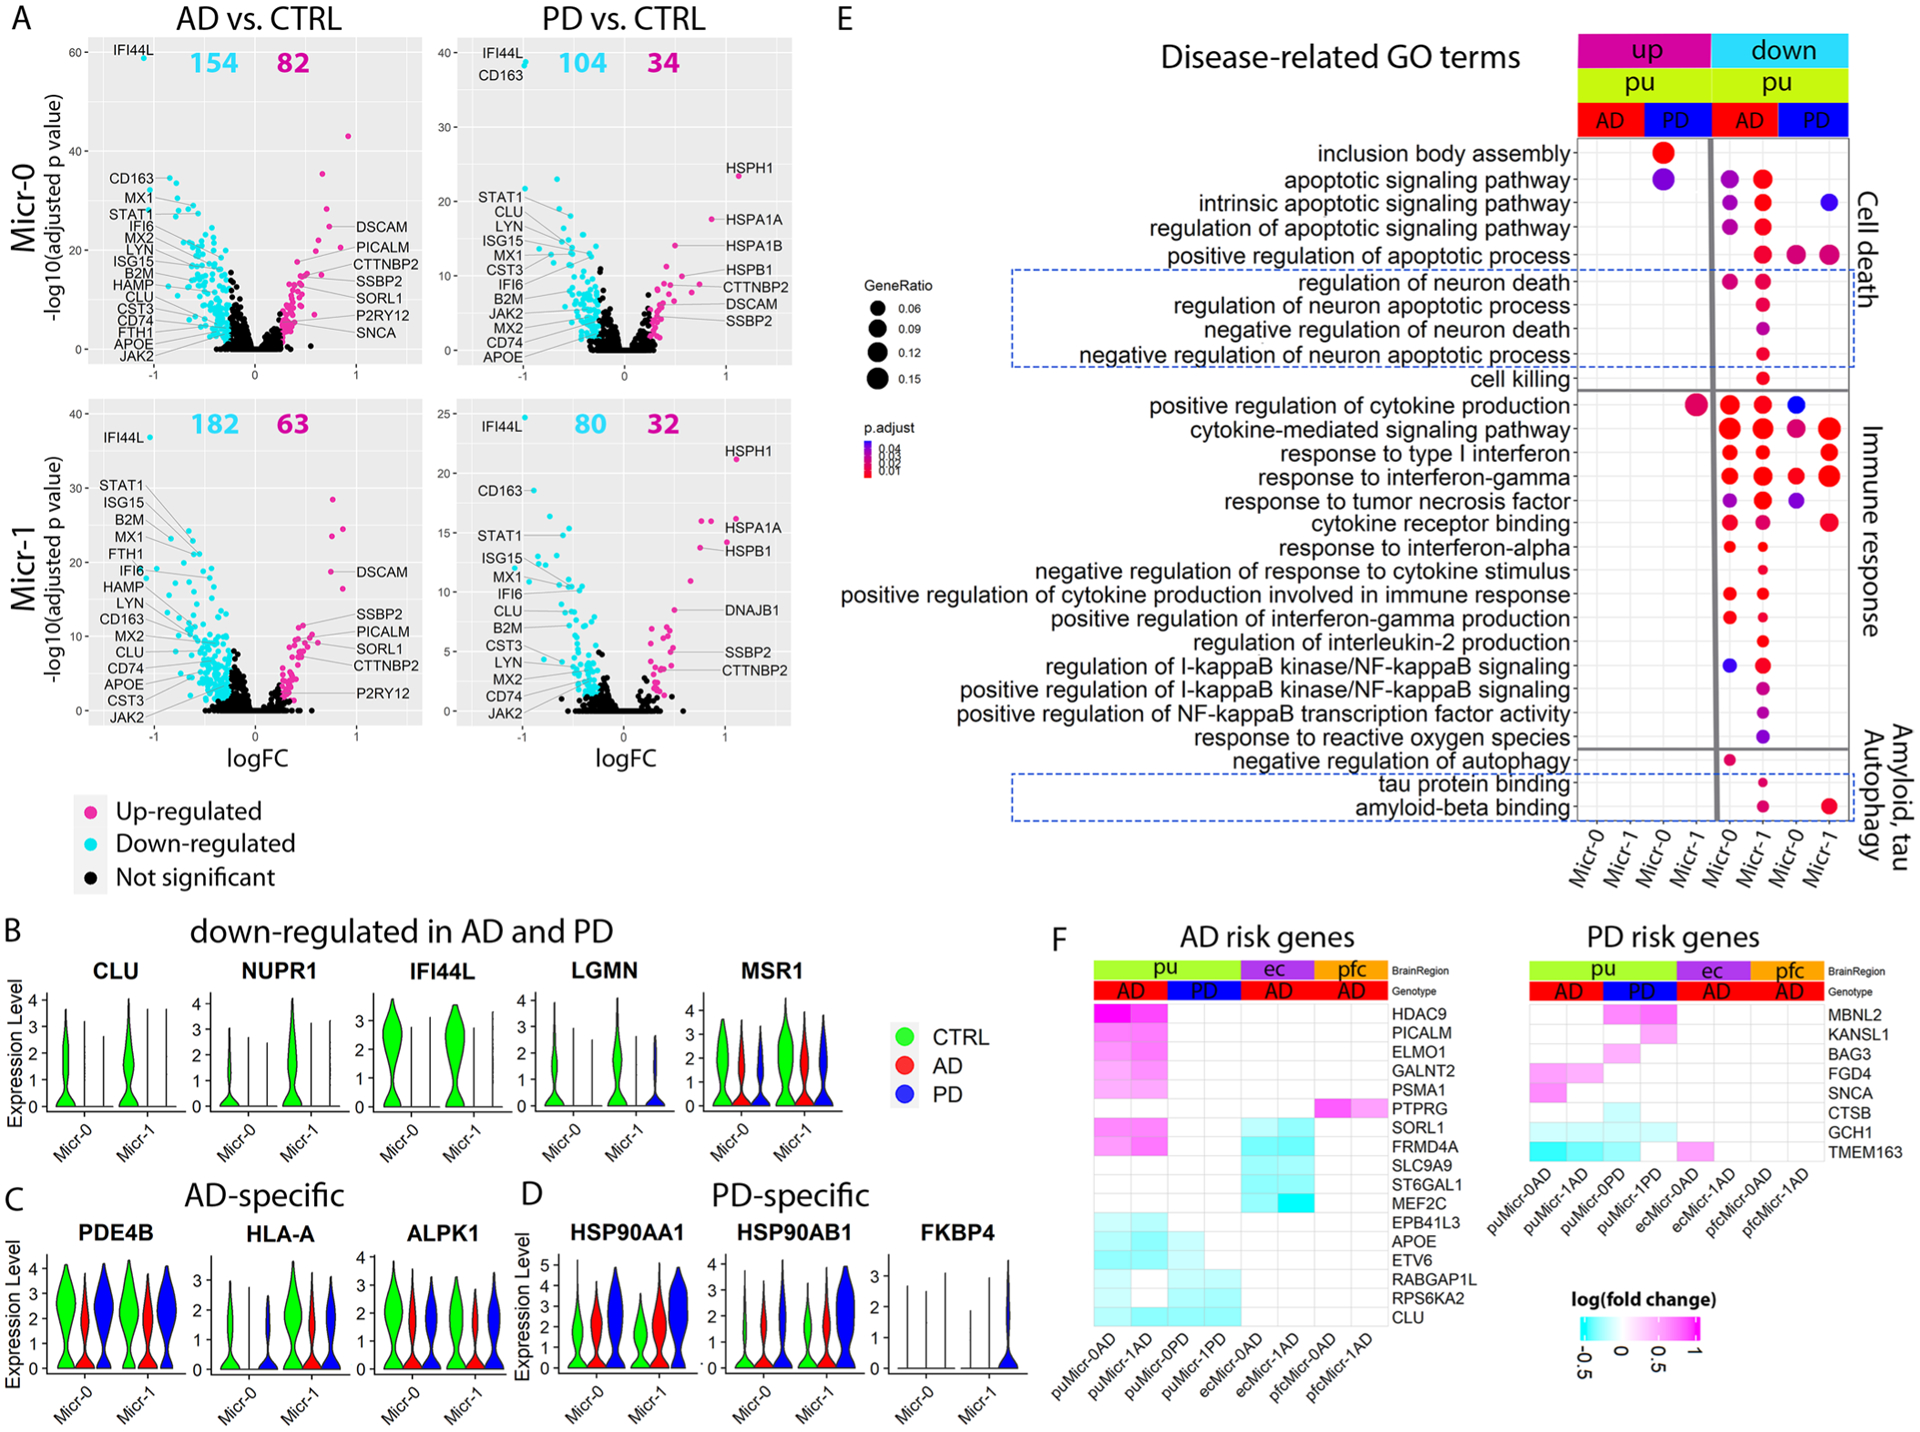
a–d, Volcano plots showing significant DEGs in Micr-0 and Micr-1 comparing cells from AD (left panels) or PD (right panels) with cells from the controls (CTRL). The x-axis specifies the logFC and the y-axis specifies the negative logarithm to the base 10 of the FDR-adjusted P values. Magenta and cyan dots represent genes expressed at significantly higher or lower levels respectively in disease samples (Wilcoxon Rank Sum test, FDR-adjusted P value < 0.05, absolute logFC > 0.25) comparing AD (Micr-0 = 440, Micr-1 = 299 cells) or PD (Micr-0 = 329, Micr-1 = 201 cells) microglia to the control (Micr-0 = 264, Micr-1 = 198 cells) microglia. Violin plots showing the expression level distributions of example DEGs that were (b) downregulated in both AD and PD microglia, (c) uniquely downregulated in AD or (d) uniquely upregulated in PD. e, GO terms related to neuron death, Aβ pathology and tauopathy enriched in microglial DEGs (hypergeometric test, FDR-adjusted P value < 0.05, ≥ 5 query genes). f, Heatmaps showing the logFC of expression level of significant DEGs for GWAS AD- and PD-risk genes; GWAS genes differentially expressed in at least two subpopulations were plotted for visualization. UP: upregulated in disease samples. Down: downregulated in disease samples.
Extended Data Fig. 10 |. Comparison of microglia DEGs.
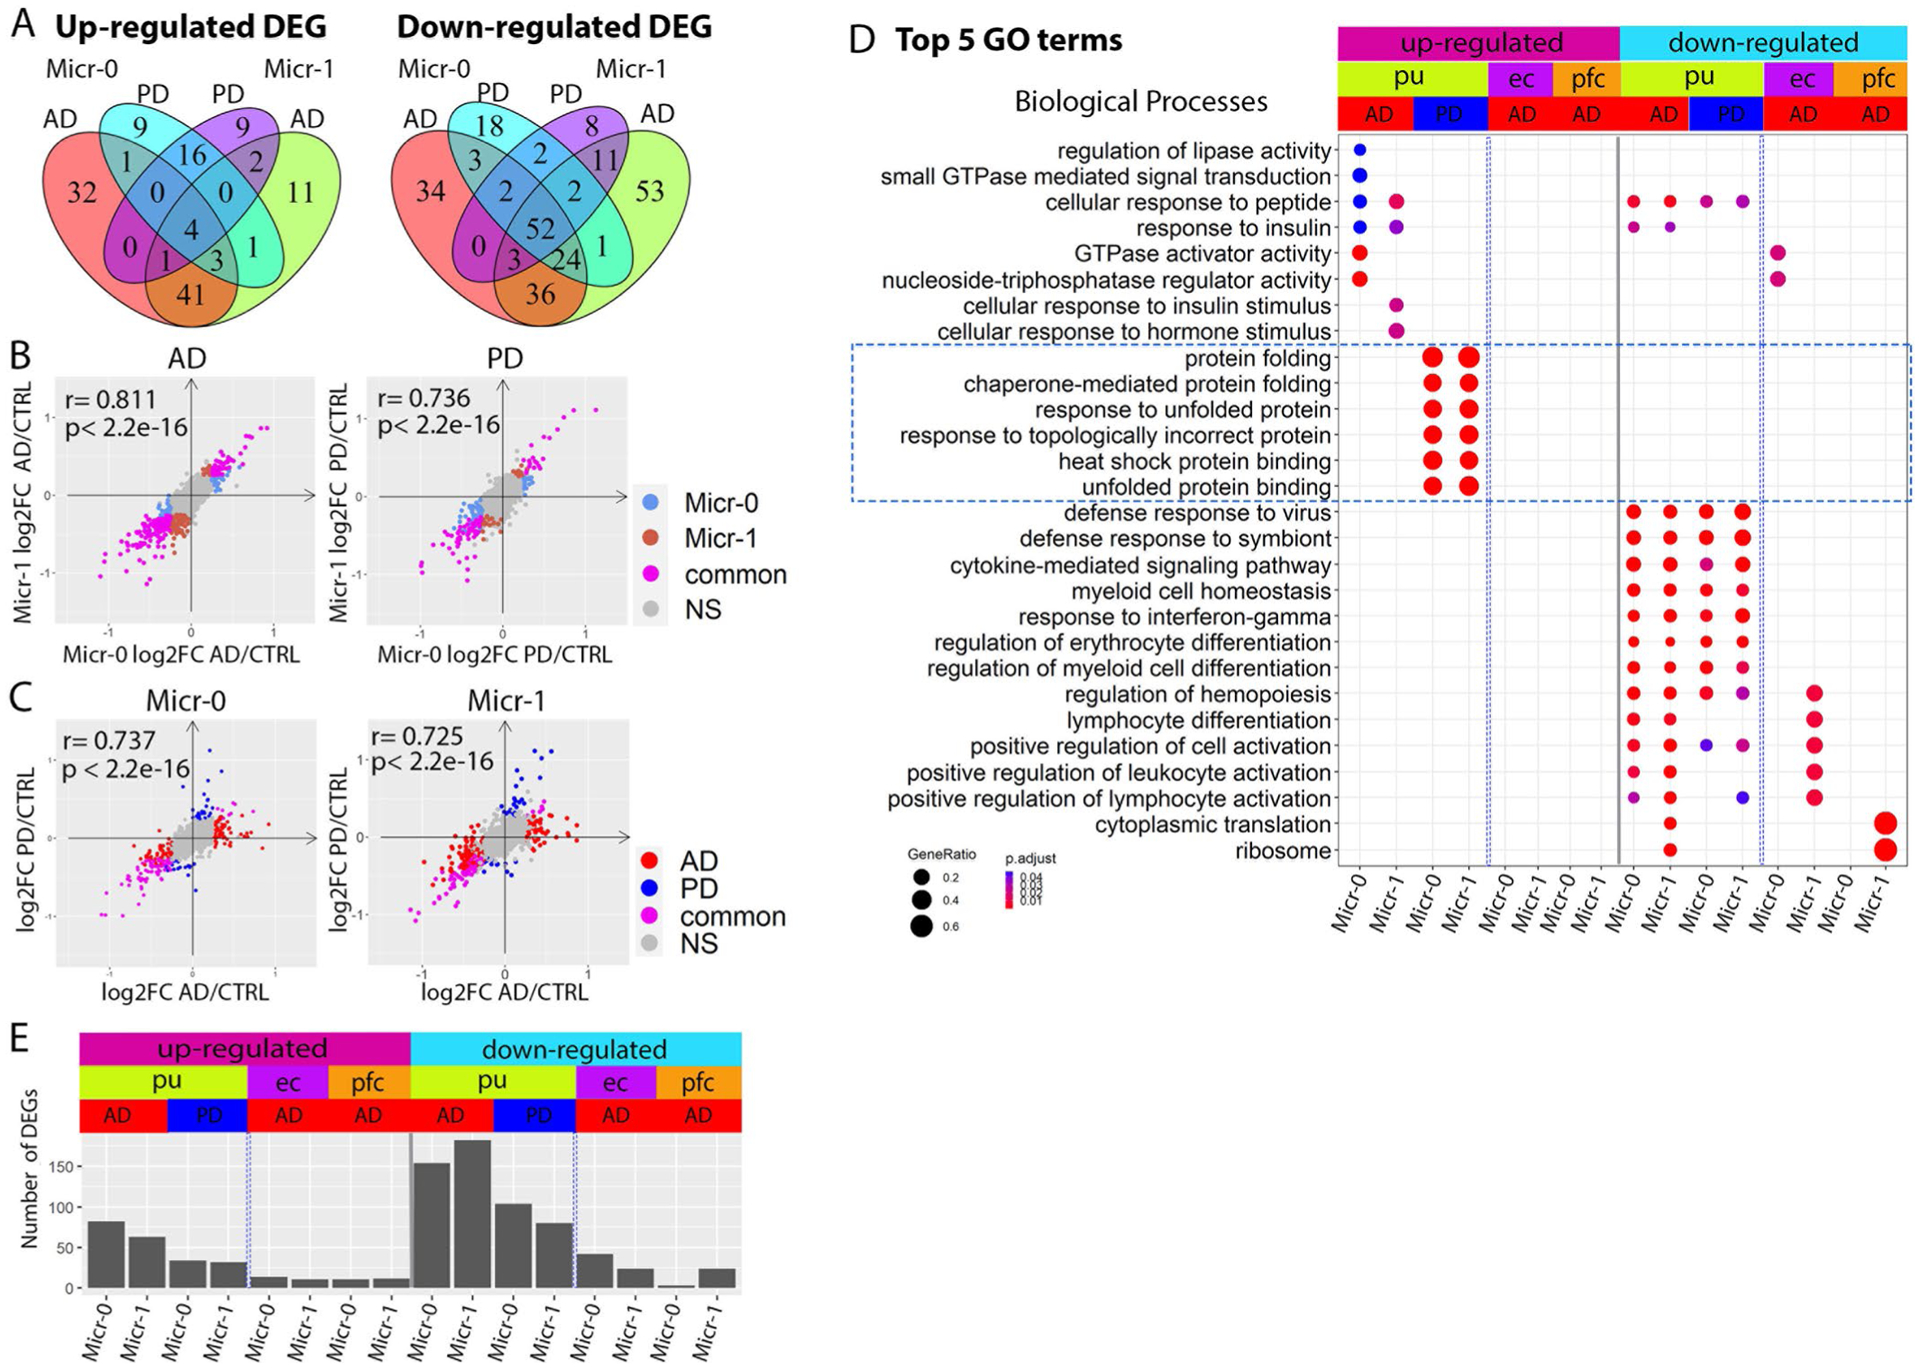
a, Venn diagram demonstrating overlap between AD and PD DEGs in the Micr-0 and Micr-1 cells for DEGs upregulated (left) or downregulated (right) in the disease samples. b,c, Scatter plots showing pair-wise correlations of genome-wide gene expression logFC (b) between Micr-0 and Micr-1 in AD (left) or PD (right) samples and (c) between AD and PD samples in Micr-0 (left) or Micr-1 (right) cells respectively. d, Top 5 GO terms in the biological process category enriched in the DEGs of the microglia subpopulations from the putamen (pu), entorhinal cortex (ec), prefrontal cortex (pfc) (hypergeometric test, FDR-adjusted P value < 0.05, ≥ 5 query genes). e, Bar plot showing the number of DEGs for each subpopulation of microglia from the three brain regions (Wilcoxon Rank Sum test, FDR-adjusted P value < 0.05 and absolute logFC >0.25). UP: upregulated in disease samples. Down: downregulated in disease samples.
Supplementary Material
Acknowledgements
We thank all participants and their families for their commitment and dedication to advancing research of diagnosis and treatment for AD and PD, and the Knight-ADRC and MDC research staff for their contributions. We thank N. Cairns, E.E. Franklin and M. Baxter of the Knight ADRC Neuropathology Core at Washington University School of Medicine (WUSM) for coordination of the tissue preparation and technical assistance. We thank the Genome Technology Access Center at the McDonnell Genome Institute at Washington University School of Medicine for help with genomic analysis. The Center is partially supported by NCI Cancer Center Support Grant P30 CA91842 to the Siteman Cancer Center from the National Center for Research Resources (NCRR), a component of the National Institutes of Health (NIH), and NIH Roadmap for Medical Research. We thank Brian Koebbe and Eric Martin from the High-Throughput Computing Facility at WUSM for providing high-throughput computational resources and support. The results published here are in whole or in part based on data obtained from the AD Knowledge Portal (https://adknowledgeportal.org). Samples for this study were provided by the Rush Alzheimer’s Disease Center, Rush University Medical Center, Chicago. Data collection was supported through funding by the NIA (grants P30AG10161, R01AG15819, R01AG17917, R01AG30146, R01AG36836, U01AG32984 and U01AG46152), the Illinois Department of Public Health and the Translational Genomics Research Institute. Finally, we thank the reviewers for their insightful suggestions that have enabled many of the discoveries reported in this manuscript. This work was supported by the GTAC@MGI Symposium Pilot Project Funding; the NIH/National Center for Advancing Translational Sciences (NCATS) grant UL1TR002345 to G.Z.; NIH grant 5T U24 HG012070 to T.W. and G.Z.; NIH grants R03AG070474, R21AG077643 and R01NS123571 in partial support of J.X. and G.Z.; NIH grants R01AG052550, R01AG054567 to T.L.S.B., research funded by NIH R01NS092865, R01AG054567, R01AG052550, U19AG032438 and P30AG06644 in support of H.L.F., W.C.K. and J.X.; by the Philip and Sima Needleman Student Fellowship in Regenerative Medicine in partial support of Y.H. and the Philippine Department of Science and Technology through the Philippine Council for Health Research and Development in partial support of B.A.L. This publication is solely the responsibility of the authors and does not necessarily represent the official view of the National Institute of Health. The funders had no role in study design, data collection and analysis, decision to publish or preparation of the manuscript
Footnotes
Competing interests
The authors declare no competing interests. S.Y. is an employee of Daiichi Sankyo.
Extended data is available for this paper at https://doi.org/10.1038/s43587-023-00363-8.
Supplementary information
The online version contains supplementary material available at https://doi.org/10.1038/s43587-023-00363-8.
Reprints and permissions information is available at www.nature.com/reprints.
Code availability
Code used for whole population analysis, plotting, astrocyte and microglia subpopulation plotting is available at https://github.com/guoyanzhao/snRNA_Putamen_ADPD.
Data availability
All raw and processed sequencing data generated in this study have been submitted to the NCBI Gene Expression Omnibus (GEO; http://www.ncbi.nlm.nih.gov/geo/) under accession number GSE161045. Interactive cell clustering and gene expression analyses based on the sequencing data processed in the current study are available through the following URL: http://epigenome.wustl.edu/snRNA_Put_ADPD. The gene expression data and metadata for Grubman et al.7 (accession number GSE138852), Lau et al.9 (accession number GSE157827) and Feleke et al.8 (accession number GSE178146) were downloaded from the Gene Expression Omnibus (GEO). The snRNA-seq data for Mathys et al.10 were downloaded at Synapse (https://www.synapse.org/#!Synapse:syn18485175) under the https://doi.org/10.7303/syn18485175. The ROSMAP metadata can be accessed at https://www.synapse.org/#!Synapse:syn3157322.
References
- 1.Taylor JP, Hardy J & Fischbeck KH Toxic proteins in neurodegenerative disease. Science 296, 1991–1995 (2002). [DOI] [PubMed] [Google Scholar]
- 2.Spires-Jones TL, Attems J & Thal DR Interactions of pathological proteins in neurodegenerative diseases. Acta Neuropathol 134, 187–205 (2017). [DOI] [PMC free article] [PubMed] [Google Scholar]
- 3.Gan L, Cookson MR, Petrucelli L & La Spada AR Converging pathways in neurodegeneration, from genetics to mechanisms. Nat. Neurosci 21, 1300–1309 (2018). [DOI] [PMC free article] [PubMed] [Google Scholar]
- 4.Thal DR, Rub U, Orantes M & Braak H Phases of A beta-deposition in the human brain and its relevance for the development of AD. Neurology 58, 1791–1800 (2002). [DOI] [PubMed] [Google Scholar]
- 5.Beach TG et al. Striatal amyloid plaque density predicts Braak neurofibrillary stage and clinicopathological Alzheimer’s disease: implications for amyloid imaging. J. Alzheimers Dis 28, 869–876 (2012). [DOI] [PMC free article] [PubMed] [Google Scholar]
- 6.Braak H & Braak E Alzheimer’s disease: striatal amyloid deposits and neurofibrillary changes. J. Neuropathol. Exp. Neurol 49, 215–224 (1990). [PubMed] [Google Scholar]
- 7.Grubman A et al. A single-cell atlas of entorhinal cortex from individuals with Alzheimer’s disease reveals cell-type-specific gene expression regulation. Nat. Neurosci 22, 2087–2097 (2019). [DOI] [PubMed] [Google Scholar]
- 8.Feleke R et al. Cross-platform transcriptional profiling identifies common and distinct molecular pathologies in Lewy body diseases. Acta Neuropathol 142, 449–474 (2021). [DOI] [PMC free article] [PubMed] [Google Scholar]
- 9.Lau SF, Cao H, Fu AKY & Ip NY Single-nucleus transcriptome analysis reveals dysregulation of angiogenic endothelial cells and neuroprotective glia in Alzheimer’s disease. Proc. Natl Acad. Sci. U S A 117, 25800–25809 (2020). [DOI] [PMC free article] [PubMed] [Google Scholar]
- 10.Mathys H et al. Single-cell transcriptomic analysis of Alzheimer’s disease. Nature 570, 332–337 (2019). [DOI] [PMC free article] [PubMed] [Google Scholar]
- 11.He J et al. Transcriptional and anatomical diversity of medium spiny neurons in the primate striatum. Curr Biol 31, 5473–5486 (2021). [DOI] [PMC free article] [PubMed] [Google Scholar]
- 12.Tran MN et al. Single-nucleus transcriptome analysis reveals cell-type-specific molecular signatures across reward circuitry in the human brain. Neuron 109, 3088–3103 (2021). [DOI] [PMC free article] [PubMed] [Google Scholar]
- 13.Butler A, Hoffman P, Smibert P, Papalexi E & Satija R Integrating single-cell transcriptomic data across different conditions, technologies, and species. Nat. Biotechnol 36, 411–420 (2018). [DOI] [PMC free article] [PubMed] [Google Scholar]
- 14.Habib N et al. Disease-associated astrocytes in Alzheimer’s disease and aging. Nat. Neurosci 23, 701–706 (2020). [DOI] [PMC free article] [PubMed] [Google Scholar]
- 15.Escartin C et al. Reactive astrocyte nomenclature, definitions, and future directions. Nat. Neurosci 24, 312–325 (2021). [DOI] [PMC free article] [PubMed] [Google Scholar]
- 16.Liddelow SA et al. Neurotoxic reactive astrocytes are induced by activated microglia. Nature 541, 481–487 (2017). [DOI] [PMC free article] [PubMed] [Google Scholar]
- 17.Liddelow SA & Barres BA Reactive astrocytes: Production, function, and therapeutic potential. Immunity 46, 957–967 (2017). [DOI] [PubMed] [Google Scholar]
- 18.Lyon MS & Milligan C Extracellular heat shock proteins in neurodegenerative diseases: New perspectives. Neurosci. Lett 711, 134462 (2019). [DOI] [PubMed] [Google Scholar]
- 19.Liu Z, Zhou T, Ziegler AC, Dimitrion P & Zuo L Oxidative stress in neurodegenerative diseases: From molecular mechanisms to clinical applications. Oxid. Med. Cell Longev 2017, 2525967 (2017). [DOI] [PMC free article] [PubMed] [Google Scholar]
- 20.Yanagida T et al. Oxidative stress induction of DJ-1 protein in reactive astrocytes scavenges free radicals and reduces cell injury. Oxid. Med. Cell Longev 2, 36–42 (2009). [DOI] [PMC free article] [PubMed] [Google Scholar]
- 21.Miyazaki I et al. Astrocyte-derived metallothionein protects dopaminergic neurons from dopamine quinone toxicity. Glia 59, 435–451 (2011). [DOI] [PubMed] [Google Scholar]
- 22.Wilhelmus MM et al. Specific association of small heat shock proteins with the pathological hallmarks of Alzheimer’s disease brains. Neuropathol. Appl. Neurobiol 32, 119–130 (2006) [DOI] [PubMed] [Google Scholar]
- 23.Renkawek K, Voorter CE, Bosman GJ, van Workum FP & de Jong WW Expression of alpha B-crystallin in Alzheimer’s disease. Acta Neuropathol 87, 155–160 (1994). [DOI] [PubMed] [Google Scholar]
- 24.Walter S et al. Role of the toll-like receptor 4 in neuroinflammation in Alzheimer’s disease. Cell. Physiol. Biochem 20, 947–956 (2007). [DOI] [PubMed] [Google Scholar]
- 25.Romano R & Bucci C Role of EGFR in the nervous system.Cells 9, 1887 (2020). [DOI] [PMC free article] [PubMed] [Google Scholar]
- 26.Liu Y et al. Upregulation of alphaB-crystallin expression in the substantia nigra of patients with Parkinson’s disease. Neurobiol. Aging 36, 1686–1691 (2015). [DOI] [PubMed] [Google Scholar]
- 27.Michael GJ et al. Up-regulation of metallothionein gene expression in parkinsonian astrocytes. Neurogenetics 12, 295–305 (2011). [DOI] [PubMed] [Google Scholar]
- 28.Deng H, Wang P & Jankovic J The genetics of Parkinson disease. Ageing Res. Rev 42, 72–85 (2018). [DOI] [PubMed] [Google Scholar]
- 29.Kumar S, Yadav N, Pandey S & Thelma BK Advances in the discovery of genetic risk factors for complex forms of neurodegenerative disorders: contemporary approaches, success, challenges and prospects. J. Genet 97, 625–648 (2018). [PubMed] [Google Scholar]
- 30.Nalls MA et al. Identification of novel risk loci, causal insights, and heritable risk for Parkinson’s disease: a meta-analysis of genome-wide association studies. Lancet Neurol. 18, 1091–1102 (2019). [DOI] [PMC free article] [PubMed] [Google Scholar]
- 31.Raab M et al. T cell receptor “inside-out” pathway via signaling module SKAP1-RapL regulates T cell motility and interactions in lymph nodes. Immunity 32, 541–556 (2010). [DOI] [PMC free article] [PubMed] [Google Scholar]
- 32.Liu P, Li P & Burke S Critical roles of Bcl11b in T-cell development and maintenance of T-cell identity. Immunol. Rev 238, 138–149 (2010). [DOI] [PubMed] [Google Scholar]
- 33.Li Q & Barres BA Microglia and macrophages in brain homeostasis and disease. Nat. Rev. Immunol 18, 225–242 (2018). [DOI] [PubMed] [Google Scholar]
- 34.Masuda T, Sankowski R, Staszewski O & Prinz M Microglia heterogeneity in the single-cell era. Cell Rep. 30, 1271–1281 (2020). [DOI] [PubMed] [Google Scholar]
- 35.Yang T, Guo R & Zhang F Brain perivascular macrophages: Recent advances and implications in health and diseases. CNS Neurosci. Ther 25, 1318–1328 (2019). [DOI] [PMC free article] [PubMed] [Google Scholar]
- 36.Jurga AM, Paleczna M & Kuter KZ Overview of general and discriminating markers of differential microglia phenotypes. Front. Cell Neurosci 14, 198 (2020). [DOI] [PMC free article] [PubMed] [Google Scholar]
- 37.Keren-Shaul H et al. A unique microglia type associated with restricting development of Alzheimer’s disease. Cell 169, 1276–1290 (2017). [DOI] [PubMed] [Google Scholar]
- 38.Audrain M et al. Reactive or transgenic increase in microglial TYROBP reveals a TREM2-independent TYROBP-APOE link in wild-type and Alzheimer’s-related mice. Alzheimers Dement. 17, 149–163 (2021). [DOI] [PMC free article] [PubMed] [Google Scholar]
- 39.Konishi H & Kiyama H Microglial TREM2/DAP12 Signaling: A double-edged sword in neural diseases. Front. Cell Neurosci. 12, 206 (2018). [DOI] [PMC free article] [PubMed] [Google Scholar]
- 40.Franco R & Fernandez-Suarez D Alternatively activated microglia and macrophages in the central nervous system. Prog. Neurobiol 131, 65–86 (2015). [DOI] [PubMed] [Google Scholar]
- 41.Villapol S Roles of peroxisome proliferator-activated receptor gamma on brain and peripheral inflammation. Cell Mol. Neurobiol 38, 121–132 (2018). [DOI] [PMC free article] [PubMed] [Google Scholar]
- 42.Deczkowska A et al. Mef2C restrains microglial inflammatory response and is lost in brain ageing in an IFN-I-dependent manner. Nat. Commun 8, 717 (2017). [DOI] [PMC free article] [PubMed] [Google Scholar]
- 43.Karch CM & Goate AM Alzheimer’s disease risk genes and mechanisms of disease pathogenesis. Biol. Psychiatry 77, 43–51 (2015). [DOI] [PMC free article] [PubMed] [Google Scholar]
- 44.McQuade A & Blurton-Jones M Microglia in Alzheimer’s disease: Exploring how genetics and phenotype influence risk. J. Mol. Biol 431, 1805–1817 (2019). [DOI] [PMC free article] [PubMed] [Google Scholar]
- 45.Sala Frigerio C et al. The major risk factors for Alzheimer’s disease: Age, sex, and genes modulate the microglia response to abeta plaques. Cell Rep. 27, 1293–1306 (2019). [DOI] [PMC free article] [PubMed] [Google Scholar]
- 46.Krasemann S et al. The TREM2-APOE pathway drives the transcriptional phenotype of dysfunctional microglia in neurodegenerative diseases. Immunity 47, 566–581 (2017). [DOI] [PMC free article] [PubMed] [Google Scholar]
- 47.Kenkhuis B et al. Iron loading is a prominent feature of activated microglia in Alzheimer’s disease patients. Acta Neuropathol. Commun 9, 27 (2021). [DOI] [PMC free article] [PubMed] [Google Scholar]
- 48.Sankowski R et al. Mapping microglia states in the human brain through the integration of high-dimensional techniques. Nat. Neurosci 22, 2098–2110 (2019). [DOI] [PubMed] [Google Scholar]
- 49.Yang S et al. Microglia reprogram metabolic profiles for phenotype and function changes in central nervous system. Neurobiol. Dis 152, 105290 (2021). [DOI] [PubMed] [Google Scholar]
- 50.Li Q & Haney MS The role of glia in protein aggregation. Neurobiol. Dis 143, 105015 (2020). [DOI] [PubMed] [Google Scholar]
- 51.Cheray M, Stratoulias V, Joseph B & Grabert K The rules of engagement: Do microglia seal the fate in the inverse relation of Glioma and Alzheimer’s disease? Front. Cell Neurosci. 13, 522 (2019). [DOI] [PMC free article] [PubMed] [Google Scholar]
- 52.Salminen A, Ojala J, Kaarniranta K, Hiltunen M & Soininen H Hsp90 regulates tau pathology through co-chaperone complexes in Alzheimer’s disease. Prog. Neurobiol 93, 99–110 (2011). [DOI] [PubMed] [Google Scholar]
- 53.Ouimet CC & Greengard P Distribution of DARPP-32 in the basal ganglia: an electron microscopic study. J. Neurocytol 19, 39–52 (1990). [DOI] [PubMed] [Google Scholar]
- 54.Su Z et al. Dlx1/2-dependent expression of Meis2 promotes neuronal fate determination in the mammalian striatum. Development 149, dev200035 (2022). [DOI] [PMC free article] [PubMed] [Google Scholar]
- 55.Zeisel A et al. Brain structure. Cell types in the mouse cortex and hippocampus revealed by single-cell RNA-seq. Science 347, 1138–1142 (2015). [DOI] [PubMed] [Google Scholar]
- 56.Gerfen CR & Surmeier DJ Modulation of striatal projection systems by dopamine. Annu. Rev. Neurosci 34, 441–466 (2011). [DOI] [PMC free article] [PubMed] [Google Scholar]
- 57.Prager EM & Plotkin JL Compartmental function and modulation of the striatum. J. Neurosci. Res 97, 1503–1514 (2019). [DOI] [PMC free article] [PubMed] [Google Scholar]
- 58.Lecumberri A, Lopez-Janeiro A, Corral-Domenge C & Bernacer J Neuronal density and proportion of interneurons in the associative, sensorimotor and limbic human striatum. Brain Struct. Funct 223, 1615–1625 (2018). [DOI] [PubMed] [Google Scholar]
- 59.Munoz-Manchado AB et al. Diversity of interneurons in the dorsal striatum revealed by single-cell RNA sequencing and patchseq. Cell Rep. 24, 2179–2190 (2018). [DOI] [PMC free article] [PubMed] [Google Scholar]
- 60.Tepper JM et al. Heterogeneity and diversity of atriatal GABAergic interneurons: Update 2018. Front. Neuroanat 12, 91 (2018). [DOI] [PMC free article] [PubMed] [Google Scholar]
- 61.Krienen FM et al. Innovations present in the primate interneuron repertoire. Nature 586, 262–269 (2020). [DOI] [PMC free article] [PubMed] [Google Scholar]
- 62.Carmichael K et al. Function and regulation of ALDH1A1- positive nigrostriatal dopaminergic neurons in motor control and Parkinson’s disease. Front. Neural Circuits 15, 644776 (2021). [DOI] [PMC free article] [PubMed] [Google Scholar]
- 63.Lipton DM, Gonzales BJ & Citri A Dorsal striatal circuits for habits, compulsions and addictions. Front. Syst. Neurosci 13, 28 (2019). [DOI] [PMC free article] [PubMed] [Google Scholar]
- 64.Korhonen L et al. Hippocalcin protects against caspase-12- induced and age-dependent neuronal degeneration. Mol. Cell Neurosci 28, 85–95 (2005). [DOI] [PubMed] [Google Scholar]
- 65.Lim YA et al. Role of hippocalcin in mediating Abeta toxicity. Biochim. Biophys. Acta 1822, 1247–1257 (2012). [DOI] [PubMed] [Google Scholar]
- 66.Liu B et al. Glio- and neuro-protection by prosaposin is mediated by orphan G-protein coupled receptors GPR37L1 and GPR37. Glia 66, 2414–2426 (2018). [DOI] [PMC free article] [PubMed] [Google Scholar]
- 67.Qui S, Kano J & Noguchi M Dickkopf 3 attenuates xanthine dehydrogenase expression to prevent oxidative stress-induced apoptosis. Genes Cells 22, 406–417 (2017). [DOI] [PubMed] [Google Scholar]
- 68.Thiele SL et al. Selective loss of bi-directional synaptic plasticity in the direct and indirect striatal output pathways accompanies generation of parkinsonism and l-DOPA induced dyskinesia in mouse models. Neurobiol. Dis 71, 334–344 (2014). [DOI] [PMC free article] [PubMed] [Google Scholar]
- 69.Shen W, Flajolet M, Greengard P & Surmeier DJ Dichotomous dopaminergic control of striatal synaptic plasticity. Science 321, 848–851 (2008). [DOI] [PMC free article] [PubMed] [Google Scholar]
- 70.Phatnani H & Maniatis T Astrocytes in neurodegenerative disease. Cold Spring Harb. Perspect. Biol 7, a020628 (2015). [DOI] [PMC free article] [PubMed] [Google Scholar]
- 71.Felsky D et al. Neuropathological correlates and genetic architecture of microglial activation in elderly human brain. Nat. Commun 10, 409 (2019). [DOI] [PMC free article] [PubMed] [Google Scholar]
- 72.Pandya VA & Patani R Region-specific vulnerability in neurodegeneration: lessons from normal ageing. Ageing Res. Rev 67, 101311 (2021). [DOI] [PMC free article] [PubMed] [Google Scholar]
- 73.Chen Y & Colonna M Microglia in Alzheimer’s disease at single-cell level. Are there common patterns in humans and mice? J. Exp. Med 218, e20202717 (2021). [DOI] [PMC free article] [PubMed] [Google Scholar]
- 74.Deczkowska A et al. Disease-associated microglia: A universal immune sensor of neurodegeneration. Cell 173, 1073–1081 (2018). [DOI] [PubMed] [Google Scholar]
- 75.Emre M et al. Clinical diagnostic criteria for dementia associated with Parkinson’s disease. Mov. Disord 22, 1689–1707, quiz 1837 (2007). [DOI] [PubMed] [Google Scholar]
- 76.Thal DR & Braak H [Post-mortem diagnosis of Alzheimer’s disease]. Der Pathologe 26, 201–213 (2005). [DOI] [PubMed] [Google Scholar]
- 77.Burack MA et al. In vivo amyloid imaging in autopsy-confirmed Parkinson disease with dementia. Neurology 74, 77–84 (2010). [DOI] [PMC free article] [PubMed] [Google Scholar]
- 78.McKeith IG et al. Diagnosis and management of dementia with Lewy bodies: third report of the DLB Consortium. Neurology 65, 1863–1872 (2005). [DOI] [PubMed] [Google Scholar]
- 79.Han F et al. Neuroinflammation and myelin status in Alzheimer’s disease, Parkinson’s disease, and normal aging brains: A small sample study. Parkinsons Dis 2019, 7975407 (2019). [DOI] [PMC free article] [PubMed] [Google Scholar]
- 80.Li H et al. Microglia implicated in tauopathy in the striatum of neurodegenerative disease patients from genotype to phenotype.Int. J. Mol. Sci 21, 6047 (2020). [DOI] [PMC free article] [PubMed] [Google Scholar]
- 81.Li H et al. The interactions of dopamine and oxidative damage in the striatum of patients with neurodegenerative diseases. J. Neurochem 152, 235–251 (2020). [DOI] [PMC free article] [PubMed] [Google Scholar]
- 82.Sun J, Cairns NJ, Perlmutter JS, Mach RH & Xu J Regulation of dopamine D3 receptor in the striatal regions and substantia nigra in diffuse Lewy body disease. Neuroscience 248C, 112–126 (2013). [DOI] [PMC free article] [PubMed] [Google Scholar]
- 83.Xu J et al. Translocator protein in late stage Alzheimer’s disease and dementia with Lewy bodies brains. Ann. Clin. Transl. Neurol 6, 1423–1434 (2019). [DOI] [PMC free article] [PubMed] [Google Scholar]
- 84.Yang P, Perlmutter JS, Benzinger TLS, Morris JC & Xu J Dopamine D3 receptor: A neglected participant in Parkinson disease pathogenesis and treatment? Ageing Res. Rev 57, 100994 (2020). [DOI] [PMC free article] [PubMed] [Google Scholar]
- 85.Hao Y et al. Integrated analysis of multimodal single-cell data. Cell 184, 3573–3587 (2021). [DOI] [PMC free article] [PubMed] [Google Scholar]
- 86.Hafemeister C & Satija R Normalization and variance stabilization of single-cell RNA-seq data using regularized negative binomial regression. Genome Biol 20, 296 (2019). [DOI] [PMC free article] [PubMed] [Google Scholar]
- 87.Gokce O et al. Cellular taxonomy of the mouse striatum as revealed by single-cell RNA-seq. Cell Rep 16, 1126–1137 (2016). [DOI] [PMC free article] [PubMed] [Google Scholar]
- 88.Velmeshev D et al. Single-cell genomics identifies cell type-specific molecular changes in autism. Science 364, 685–689 (2019). [DOI] [PMC free article] [PubMed] [Google Scholar]
- 89.Kanehisa M & Goto S KEGG: kyoto encyclopedia of genes and genomes. Nucleic Acids Res 28, 27–30 (2000). [DOI] [PMC free article] [PubMed] [Google Scholar]
- 90.Yu G, Wang LG, Han Y & He QY clusterProfiler: An R package for comparing biological themes among gene clusters. OMICS 16, 284–287 (2012). [DOI] [PMC free article] [PubMed] [Google Scholar]
- 91.Gu Z, Eils R & Schlesner M Complex heatmaps reveal patterns and correlations in multidimensional genomic data. Bioinformatics. 32, 2847–2849 (2016). [DOI] [PubMed] [Google Scholar]
Associated Data
This section collects any data citations, data availability statements, or supplementary materials included in this article.
Supplementary Materials
Data Availability Statement
All raw and processed sequencing data generated in this study have been submitted to the NCBI Gene Expression Omnibus (GEO; http://www.ncbi.nlm.nih.gov/geo/) under accession number GSE161045. Interactive cell clustering and gene expression analyses based on the sequencing data processed in the current study are available through the following URL: http://epigenome.wustl.edu/snRNA_Put_ADPD. The gene expression data and metadata for Grubman et al.7 (accession number GSE138852), Lau et al.9 (accession number GSE157827) and Feleke et al.8 (accession number GSE178146) were downloaded from the Gene Expression Omnibus (GEO). The snRNA-seq data for Mathys et al.10 were downloaded at Synapse (https://www.synapse.org/#!Synapse:syn18485175) under the https://doi.org/10.7303/syn18485175. The ROSMAP metadata can be accessed at https://www.synapse.org/#!Synapse:syn3157322.


