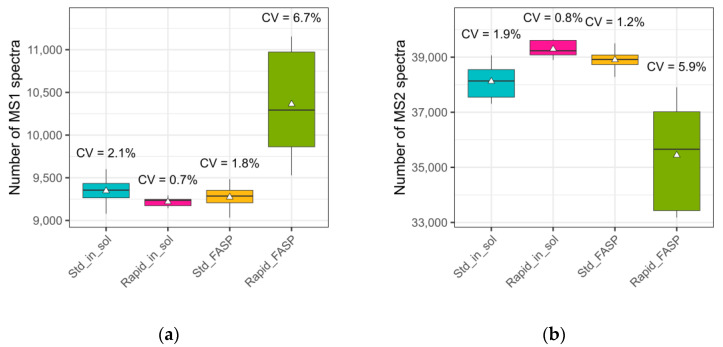
Figure 1.
Raw data quality assessment: number of MS1 and MS2 spectra. CSF samples were digested using different approaches: Std_in_sol—standard in-solution digestion; Rapid_in_sol—rapid in-solution digestion; Std_FASP—standard filter-aided preparation; Rapid_FASP—rapid filter-aided preparation. Some 500 ng of the respective digestions were measured with nanoLC-MS and the acquired data were analyzed using our in-house developed quality control tool MaCProQC. (a) the number of precursor spectra and (b) number of fragment spectra as well as the coefficient of variation (CV) of these between replicates (n = 5) were analyzed. The highest variation in both the number of MS1 and MS2 spectra was observed for the rapid FASP; the lowest one for the rapid in-solution digestion.

