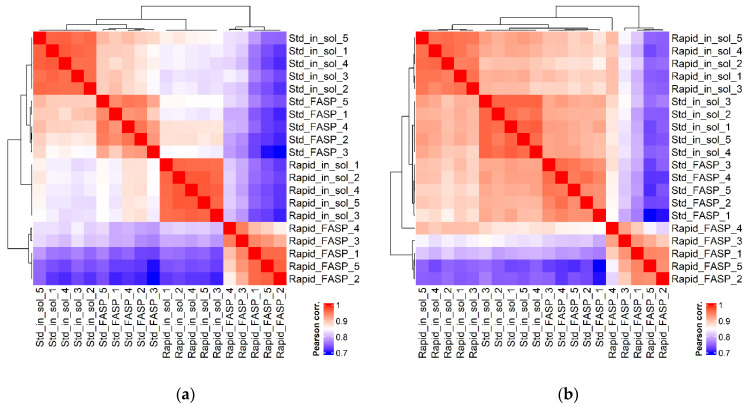
Figure 9.
Replicate clustering based on correlation. Hierarchical clustering heatmap of Pearson correlation coefficients between dataset replicates for peptide (a) and PG (b) intensities. Correlations are colored on a scale from red (1.0, maximal possible correlation) to blue (0.7, lower correlation). Numerical values are shown in Supplemental materials (Correlations_peptides.xlsx and Correlations_proteins.xlsx). Std_in_sol—standard in-solution digestion; Rapid_in_sol—rapid in-solution digestion; Std_FASP—standard filter-aided preparation; Rapid_FASP—rapid filter-aided preparation. Rapid FASP was demonstrated to be the most divergent from other datasets and showed the lowest Pearson correlation coefficient between the individual replicates.

