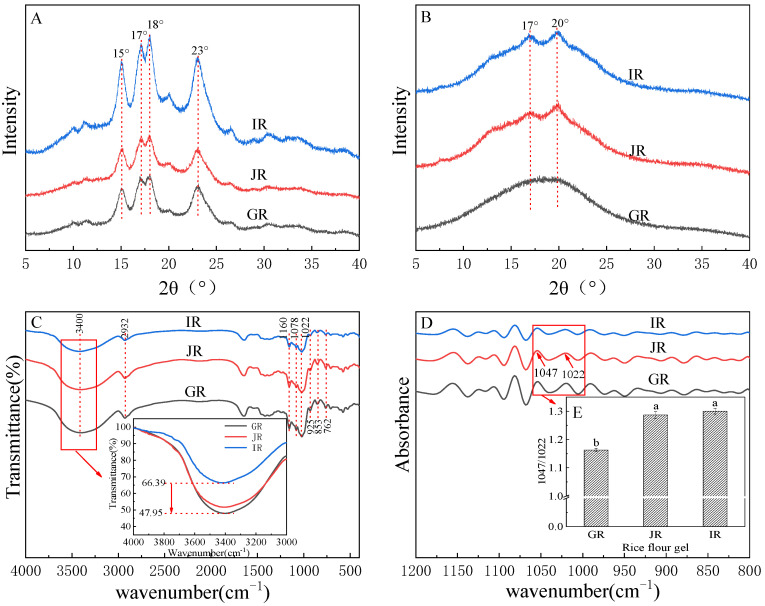
Figure 2.
X-ray diffraction patterns of rice flour (A); the gel retrograded at 4 °C for 7 days (B); the FTIR spectra (C) and the deconvolved FTIR spectra (D) of the gel retrograded at 4 °C for 7 days; and the relative amount of short-range ordered structure to the amorphous region of the gel retrograded at 4 °C for 7 days (E), chart bars with no letter in common are significantly different for p < 0.05.

