

Abstract
Background
In ovarian cancer (OC) therapy, even initially responsive patients develop drug resistance.
Methods
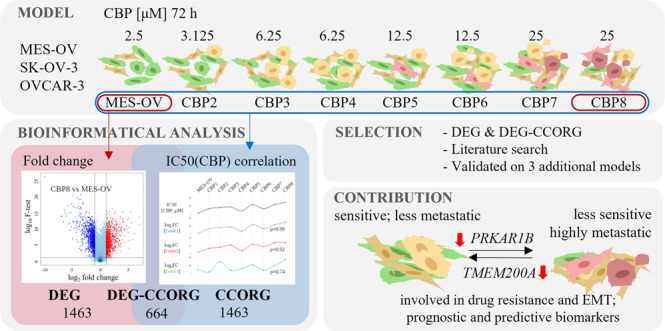
Here, we present an OC cell model composed of variants with differing degrees of acquired resistance to carboplatin (CBP), cross-resistance to paclitaxel, and CBP-induced metastatic properties (migration and invasion). Transcriptome data were analysed by two approaches identifying differentially expressed genes and CBP sensitivity-correlating genes. The impact of selected genes and signalling pathways on drug resistance and metastatic potential, along with their clinical relevance, was examined by in vitro and in silico approaches.
Results
TMEM200A and PRKAR1B were recognised as potentially involved in both phenomena, also having high predictive and prognostic values for OC patients. CBP-resistant MES-OV CBP8 cells were more sensitive to PI3K/Akt/mTOR pathway inhibitors Rapamycin, Wortmannin, SB216763, and transcription inhibitor Triptolide compared with parental MES-OV cells. When combined with CBP, Rapamycin decreased the sensitivity of parental cells while Triptolide sensitised drug-resistant cells to CBP. Four PI3K/Akt/mTOR inhibitors reduced migration in both cell lines.
Conclusions
A newly established research model and two distinct transcriptome analysis approaches identified novel candidate genes enrolled in CBP resistance development and/or CBP-induced EMT and implied that one-gene targeting could be a better approach than signalling pathway inhibition for influencing both phenomena.
Subject terms: Cancer genomics, Transcriptomics
Background
Ovarian cancer (OC) is a deadly gynaecological disease with an annual worldwide incidence of approximately 240,000 and a mortality rate of 152,000 [1]. Almost 90% of all OCs are of epithelial origin [2], with high-grade serous ovarian cancer (HGSOC) accounting for up to 70% of all diagnosed cases [1]. Almost all OC patients initially undergo the same treatment consisting of surgical removal of tumour mass followed by six treatment cycles of paclitaxel/carboplatin (CBP) therapy. However, regardless of the good initial response, many OC patients become resistant to therapy over time. Therefore, high mortality can be attributed to the lack of early and specific symptoms that leads to the absence of a timely diagnosis, therapy resistance, cancer recurrence, and poor prognosis [1].
Despite its extensive and long history of clinical use, the development of CBP resistance, often accompanied by cross-resistance to taxanes, is the major and still unsolved problem of potentially successful therapy. So far, different molecular mechanisms have been described as being involved in resistance to platinum drugs [3, 4] and taxanes [5]. Tumour heterogeneity, inter-individual variations in gene expression, posttranscriptional and posttranslational modifications, tumour microenvironment, and epigenetic regulations make the understanding and solutions to this phenomenon much more complex [6–9].
Epithelial-mesenchymal transition (EMT) is a process that allows a polarised epithelial cell to undergo multiple biochemical changes that enable it to adopt a mesenchymal cell phenotype which includes enhanced migratory capacity and invasiveness, elevated resistance to apoptosis, and greatly increased production of extracellular matrix (ECM) components [10]. We and others have shown that EMT is associated with the development of drug resistance in OC cell models [11, 12] and that EMT status [13] influences the tumour cell’s response to platinum drug treatment. But there is a lack of data showing molecules and/or exploring signalling pathways involved in both processes.
Recent developments in bioinformatics and an increasing number of new databases enable better interpretation of gene expression landscapes, extensive data analyses, and predictions of their putative impact, either as direct functional players, driver genes, or predictive biomarkers. They are dynamically reshaping modern science, allowing researchers to tackle specific problems and get new meaningful insights. Despite an increasing amount of data obtained and the selection of promising candidate genes, most of them are not functionally explored.
Therefore, the main objective of this study was to establish and characterise a new model of acquired CBP resistance and identify novel genes with a dual role; role in CBP resistance and CBP-induced EMT. For this purpose, two different approaches were used for the identification of genes and pathways underlying the acquired changes in vitro. The first approach, based on a comparative analysis between the most resistant variant obtained by the treatment with a final dose of CBP, and the parental OC cell line, resulted in a list of differentially expressed genes (DEG). The second approach was based on the characterisation of the complete spectrum of newly established cell variants in terms of CBP resistance and integration of the connection between CBP resistance and gene expression data, which resulted in a list of CBP-correlating genes (CCORG). Two gene lists were analysed for protein interactions, gene set enrichment, and signalling pathways. The individual gene candidates were selected for further analysis by either focusing solely on the DEG list or considering both DEG and CCORG lists. Numerous candidate genes were further filtered based on available literature data regarding drug resistance and EMT, and by confirming the expression patterns of selected genes across three additional in-house established CBP-resistant OC cell models. Finally, eight candidate genes and seven signalling pathways were explored for their putative roles in the development of CBP resistance, CBP-induced EMT, and as predictive/prognostic markers using either siRNA technology, pharmacological inhibitors of specific signalling pathways or bioinformatics tools.
Methods
Chemicals
CBP was purchased from Sigma-Aldrich-Merck (USA) and dissolved in water. Paclitaxel (Taxol®, TAX) was acquired from the National Cancer Institute (USA) and dissolved in ethanol. Rapamycin, AZD1080, SB216763, Idelalisib, LY294002, Wortmannin, Roscovitine (CYC-202), Rilpivirine, TIC-10, TVB-3166, Febuxostat, Triptolide, Akti-1/2 and Cilengitide were purchased from MedChemExpress (USA) and dissolved in DMSO. All chemicals were kept at –20 °C.
Cell lines
MES-OV human ovarian cystadenocarcinoma cell line was established in Prof. Sikic Laboratory (Stanford University, USA) and submitted to the ATCC (USA) [14]. In addition, two ovarian adenocarcinoma cell lines, OVCAR-3 and SK-OV-3, were purchased from ATCC. All cell lines were cultured in McCoy’s 5A Medium with L-Glutamine (Capricorn Scientific, Germany) supplemented with 10% foetal bovine serum (FBS; Gibco BRL Life Technologies-ThermoFisher Scientific, USA). The cells were grown at 37 °C and 5% CO2 in a humidified incubator. The starvation medium was prepared with 2% FBS. Cells were frozen in FBS and 10% DMSO (Gram Mol, Croatia). Authentication of all cell lines was performed by STR DNA profiling analysis (Microsynth AG, Switzerland). The test for detection of mycoplasma was run every 4 weeks.
Development of stable CBP-resistant variants
CBP-resistant variants were developed by consecutive 72-h treatments of parental MES-OV cells with increasing concentrations of CBP, finally reaching the dose of 25 μM. CBP-resistant MES-OV variants (MES-OV CBP2 to MES-OV CBP8) were cultured and passaged until a stably growing population was obtained. Upon each thawing step, the CBP resistance of the variant was measured by cell survival assay (ThermoFisher Scientific, USA). A similar procedure for establishing two additional OC cell lines resistant to CBP, OVCAR-3 CBP7, and SK-OV-3 CBP6, was used. Treatment protocols differed in the number of CBP treatment repeats. The goal was to establish three similar CBP-resistant OC cell models differing in their origin and establishment protocol, thus showing variances in drug-induced changes.
Cell survival assay based on resazurin dye (AlamarBlue)
Cells were seeded in 96-well plates and day after treated with different concentrations of a drug. If an inhibition experiment was performed, cells were pre-treated with an inhibitor 2 h before the drug treatment. After 72 h incubation, the medium was removed and 10-fold diluted resazurin solution (0.1% resazurin (ThermoFisher Scientific) in NaCl/PI buffer) in McCoy’s 5A Medium with L-Glutamine, without Phenol Red (Capricorn Scientific, Germany) was added. After 3 h in dark at 37 °C and 5% CO2 in a humidified incubator, the optical density of the reaction product was measured by using a multi-well spectrophotometer at 564 nm (Tecan Infinite M200, Tecan Group, Switzerland). Absorbance data were obtained by subtracting the absorbance of an empty well and analysed in GraphPad Prism 5 (GraphPad Software, USA). The results were shown as mean absorbance values or as mean percentages of cell viability compared to control ± SD. Concentrations that inhibited cell viability to 50% (IC50 values) were calculated from the curve fitted by non-linear regression.
Wound healing (scratch) assay
Cells were seeded in 24-well plates in two replicates. The growing medium was removed a day after, and a starvation medium was applied for 24 h to stop proliferation after which three precise scratches were made with a 20 µL sterile pipette tip. Cells were washed twice with PBS, and a standard culture medium was added. Cells were observed and photographed (n = 12) on a marked site immediately and after 6 h by bright-field microscope (Olympus BX 51, Olympus Lifescience Ltd., USA). Cell-free areas were measured by ImageJ software (National Institute of Health, USA). The wounding area after 6 h was compared to the area at time point 0 h, expressed as a percentage of migrated cells and plotted as folds of control.
Cell invasion assay
The desired number of transwell inserts coated with 40 µL of Matrigel® (Corning, USA) were prepared and inserted into wells of a 24-well plate. Cells were trypsinized, washed three times with culture medium without FBS, and re-suspended in the same medium. The gelled Matrigel® was then washed with warm FBS-free culture medium, the same number of cells was added, and the transwell inserts were transferred into the wells filled with culture medium with FBS. Cells were incubated for 22 h at 37 °C. Trans-wells inserts were removed from 24-well plates and gently scraped with a cotton swab to remove the Matrigel® and non-invaded cells from the upper side of the membrane. Cells on the lower side of the membrane were then stained with 1% crystal violet in PBS upon fixation in 3.7% paraformaldehyde. Invaded cells were photographed using a bright-field microscope (Olympus BX 51, Olympus Lifescience Ltd.). The area covered by invaded cells was measured by ImageJ software as an area under the curve (AUC), normalised to control, and plotted as a fold of control.
Reverse transcription-quantitative polymerase chain reaction (RT-qPCR)
Cells were seeded and collected by trypsinisation 24 h later. After washing in PBS twice, the total RNA was isolated by All Prep DNA/RNA Mini Kit (Qiagen, Germany) according to the producer’s protocol except that instead of 70%, absolute ethanol was used. Oligonucleotide primers were purchased from Sigma-Aldrich-Merck (Supplementary Table S1). cDNA was synthesised by RevertAid First Strand cDNA Synthesis Kit (ThermoFisher Scientific) according to the manufacturer’s protocol. Quantitative PCR was assessed on the AB7300 device (Applied Biosciences, USA) by mixing Power SYBR Green PCR Master Mix (Applied Biosciences) and primers (Supplementary Table S1) in adequate amounts. Data were analysed in Microsoft Excel (Microsoft Corporation, USA) and GraphPad Prism 5 (GraphPad Software) and presented as fold changes (FC, 2-ΔΔCt) or log2 of the fold changes (log2FC) of controls.
Microarray assay
Gene expression analysis was performed on 32 samples (8 samples with 4 biological replicas): MES-OV cell line and seven CBP-derived variants (MES-OV CBP2-8), in Genomics and Transcriptomics Laboratory, University of Düsseldorf, Germany. Each sample concentration was measured by NanoDrop (ThermoFisher Scientific) and diluted to 50 ng/µL to obtain assay working range concentrations. Capillary gel electrophoresis was done with FragmentAnalyzer (Advanced Analytical Technologies-Agilent Technologies, USA) to check the RNA integrity. An additional concentration check was performed using RNA-specific fluorometric Qubit RNA HS Assay (ThermoFisher Scientific). The samples were prepared using GeneChip WT PLUS Reagent Kit (ThermoFisher Scientific), which generates amplified and biotinylated sense-stranded DNA targets using the reverse transcription priming method. DNA targets were targeted using Clariom™ S Assay (ThermoFisher Scientific). After binding of targeted genes, GeneChip™ Fluidics Station 450 (ThermoFisher Scientific) was used to wash and stain the samples. The final image of biotin signals was scanned by GeneChip Scanner (ThermoFisher Scientific). Raw .cel and .cdf files were imported in Transcriptome Analysis Console 4.0 (TAC 4.0; ThermoFisher Scientific). Probe normalisation and a quality check were automatically performed by the software.
Transient transfection using siRNAs
For gene silencing, ON-TARGET plus Human siRNA for DNER, TMEM200A, MIR99AHG, SERPINE2, FBLN5, WDR46, HES7, PRKAR1B, and Non-targeting SMART pools were used (Dharmacon, Horizon Discovery, UK). The pools consisted of four different siRNAs for the same target to increase the likelihood of successful silencing. The transfection was performed using DharmaFECTTM Transfection reagent I (Dharmacon) according to the manufacturer’s instructions. Twenty-four hours after transfection, the cells were seeded in a 6-well plate for gene expression or cell death analysis, in a 96-well plate for the assessment of cell viability upon drug treatment, and in 24-well plates for migration and invasion assays.
Cell death detection by Annexin V-FITC and propidium iodide
After transfection, cells were seeded in 6-well plates and treated with different concentrations of CBP the next day. Seventy-two hours later, both floating and adherent cells were collected, centrifuged, and washed with PBS. An equal number of cells was transferred in tubes for flow cytometry, centrifuged, and re-suspended twice in 1× Annexin V-binding buffer (ABB). In the meantime, propidium iodide (PI) and Annexin V-FITC solutions were prepared. Prepared solutions were added to samples and incubated for 30 min in the dark at RT. An additional 350 µL of 1×ABB buffer was added and chilled on ice. PI and Annexin V-FITC signals of samples, along with non-treated cells (negative control), dual-stained PI and Annexin V-FITC heat-shocked cells (96 °C, 10 min; positive control), and single-stained PI and Annexin V-FITC cells, were measured on a BD FACSCalibur device (Beckton Dickinson, USA) and the data were analysed using FlowLogic software (Inivai, Australia). Cells were first gated to exclude cell fragments, detritus, and cell doublets. Compensation and further gating were performed by the software using the single-stained controls. Percentages of early apoptotic (Annexin V-FITC+/PI–), late apoptotic/necrotic (Annexin V-FITC+/PI+), and necrotic cells (Annexin V-FITC–/PI+) were all counted as dead cells, analysed in GraphPad Prism 5 and plotted as percentages of dead cells.
Development of the CBP-resistant clones
MES-OV cells were single-treated with 25 µM CBP for 72 h after which the drug was removed, fresh medium was added, and cells were left to grow. After the stably dividing cell population named MES-OV 25C was established, the cloning of this population was performed. The MES-OV 25C cell line was collected and seeded in a 96-well plate (1 cell/well). In the first attempt, out of 96 cells seeded, only five cells managed to establish a colony. They were named MES-OV 25C A1/96, A2/96, A3/96, A5/96, and A6/96. The second attempt resulted in only one clone named MES-OV 25C B1/96. Cells were cultured and characterised in terms of drug resistance (Supplementary Fig. S1a) and EMT status (Supplementary Fig. S1b) by cell viability assay and RT-qPCR, respectively.
Bioinformatics analysis
Raw data analysis
Transcriptomes of the established variants were compared to the transcriptome of MES-OV parental cells in the TAC 4.0 software. The analysis of variance (ANOVA) method was used to compare gene expressions. A two-tailed Student’s t-test was used to compare two samples. Gene lists were additionally normalised to internal housekeeping controls (geometric mean of GAPDH and ACTB), and gene expression difference was calculated as log2 fold change (log2FC) of signal intensity values of variants, compared to parental MES-OV cell line. Spearman’s rank correlation coefficients of each gene and IC50 values for CBP were calculated between all the cell variants in R (GNU project, Free Software Foundation) by using the base (version 4.0.3), ggplot2 (version 3.3.3), and stats (version 3.6.2) packages.
Grouping of samples
PCA Mapping of all samples was automatically performed using the default settings in TAC 4.0 software (ThermoFisher Scientific). The hierarchically clustered heatmaps were generated by importing .csv files with log2FC values of gene expression into the matrix visualisation and the analysis software Morpheus (Broad Institute, USA) and choosing the ‘one minus spearman rank correlation’ and an ‘average linkage’ method.
Protein–protein interaction (PPI) analysis
Gene lists were imported to a Search Tool for the Retrieval of Interacting Genes/Proteins (STRING) and analysed for protein interactions [15]. Interactions were filtered by ‘confidence score’ which ranks from 0 to 1, with 1 being the highest possible confidence. Interactions were also analysed in terms of individual criteria (text mining, experiments, databases, and expression).
Gene set enrichment analysis (GSEA)
Genes were analysed in the GO database of Biological Processes, Kyoto Encyclopedia of Genes and Genomes (KEGG), and WikiPathways via Enrichr online tool [16–18], using the default settings.
Analysis of the prognostic and predictive value of genes
The prognostic value of selected targets was examined using Kaplan–Meier (KM) Plotter, an online meta-analysis tool [19]. Analyses were performed on custom-filtered datasets from Gene Expression Omnibus, European Genome-phenome Archive, and the Cancer Genome Atlas transcriptomic databases. Patient cohorts were selected according to cancer histology type (serous), grade (2–4), and the treatment they received (platinum), if not indicated differently. Patients were split according to the automatically computed best-fit gene expression cut-off for every single target. Data were presented on a KM plot, along with hazard ratio (HR) and log-rank p values, with additional information about the median survival of patients with high and low expressions of genes in a separate table. The predictive value was analysed on the same patient cohort as mentioned above, by the ROC Plotter tool [20]. Data were presented on a ROC plot, along with the AUC and p values.
Western blot assay
Samples were collected 24 h after the seeding, washed, and re-suspended in PBS. Suspensions were kept on ice and sonicated (Cole-Palmer 130-Watt Ultrasonic Processors 44347, Cole-Palmer, USA). Protein concentrations were measured using PierceTM BCA Protein Assay Kit (ThermoFisher Scientific). Equal amounts of proteins were loaded onto Any-kDTM Mini-PROTEAN TGX Precast Gels (Bio-Rad, USA), along with the marker (PageRuler® Prestained Protein Ladder, 26616, ThermoFisher Scientific) and ran on a vertical electrophoresis system (2.5 h, 80 V) (Bio-Rad). Transfer to 0.2-μm nitrocellulose membrane was performed by Trans-Blot Turbo Transfer System (Bio-Rad). Transfer efficiency was checked by staining with Ponceau S (Sigma-Aldrich-Merck). Membranes were blocked for 1 h at RT in 5% non-fat dry milk in 0.1% Tween 20 in TBS (TBS-T) and incubated with primary antibodies in 5% non-fat milk-TBS-T against Akt1/2 (H-136) (sc-8312, Santa Cruz Biotechnology, USA), p-Akt (S473) (9271L, Cell Signaling Technology, USA), E-cadherin (24E10) (3195, Cell Signaling Technology), N-cadherin (610920, BD Biosciences, USA), Vimentin (D21H3) (5741, Cell Signaling Technology), Fibronectin (ab3413, Abcam) or ERK1/2 (K-23) antibody (sc-94, Santa Cruz Biotechnology) for 2 h at RT. Afterwards, the membranes were washed in TBS-T and incubated with a corresponding horseradish-peroxidase-coupled secondary antibody (goat anti-Rabbit IgG (H+L), 31466, Invitrogen or goat anti-Mouse IgG (H+L), G21040, Invitrogen) for an additional 2 h at RT. Proteins were visualised by Western LighteningTM Plus-ECL (Perkin-Elmer, USA). Band intensities were measured in ImageJ software and normalised to the ERK1/2 signal.
Statistical analysis
Statistical analysis of data was performed in GraphPad Prism 5 on raw data. The unpaired two-tailed Student’s t-test for comparing two samples or an ordinary one-way ANOVA with Dunnett’s post hoc tests for comparing three or more samples were used. Either two-way ANOVA with Bonferroni’s post hoc tests or a related-measure (factorial) ANOVA was used to compare two or more samples with multiple independent variables. In the latter, the interaction effect (IE) was used to determine the significance of the combined effect of the two treatments (silencing/inhibition and CBP). The combined effect was considered significant if the IE p value was < 0.05 (NI, no interaction; *p < 0.05; **p < 0.01; ***p < 0.001; ****p < 0.0001).
Results
Established MES-OV CBP variants are resistant to CBP, cross-resistant to TAX, show hybrid EMT phenotype, and have increased metastatic properties
Parental MES-OV cells and newly established MES-OV CBP-resistant variants (short: CBP2-8; Fig. 1a) were treated with different concentrations of either CBP or TAX (Fig. 1b). According to the IC50 values, variants were more sensitive (CBP4) or 1.4–3.0‐fold resistant to CBP and 1.4–2.2‐fold cross-resistant to TAX (Fig. 1b) compared with MES-OV cells. The CBP8 variant showed the highest (3-fold) resistance to CBP. The established acquired resistance was stable for more than 30 cell passages and multiple freezing cycles post‐drug selections (data not shown). Morphology of the most resistant cell line MES-OV CBP8 was significantly different from the parental cells; displaying more elongated and non-polarised shape and forming colonies without clearly defined edges due to the larger distance between the cells compared with the population of parental cells (Supplementary Fig. S2a). Upon transcriptome analysis of more than 21,000 genes, similarities among biological replicas of each variant were confirmed by PCA analysis. Variants CBP2 and CBP3, as well as CBP7 and CBP8, shared gene expression similarities, compared with MES-OV (Supplementary Fig. S2b), while the MES-OV CBP5 variant shared likeness with CBP4 and CBP6. The same was noticed by hierarchical clustering, where CBP4 and CBP5 showed distinct gene expression profiles compared with the other variants (Supplementary Fig. S2c). These two could thus be considered ‘transitional’ variants. Expressions of four EMT markers (epithelial: CHD1; mesenchymal: CDH2, FN1, VIM) were measured by Microarray (Supplementary Fig. S2e) and validated by RT-qPCR (Fig. 1c) (on all variants) and western blot (Supplementary Fig. S2d) (on parental and the most resistant variant). The expression of EMT markers varied significantly across variants. The downregulation of CDH1 in the most resistant variant was confirmed on both, transcriptional and protein levels. This was not the case for the N-cadherin and Vimentin which were downregulated on the transcriptional level but upregulated on the protein level. Although downregulated on transcriptional, Fibronectin was unchanged on the protein level. An additional set of 17 literature-derived EMT-related genes was also screened using Microarray data. Results showed that the expressions of DSP, FOXC2, GCSH, ITGB6, MMP2, OCLN, SNAI1 and SNAI2 were dynamically changed between the CBP variants, but only DSP (ρ = –0.64) and SNAI2 (ρ = 0.74) correlated well with CBP resistance in the MES-OV CBP8 variant (Supplementary Fig. S2e). Furthermore, cell migration was analysed, and the increase in migratory potential of MES-OV CBP8, as compared with MES-OV cells, was observed (Fig. 1d). An increased migratory potential was also determined in the variants CBP1, CBP3, and CBP4 (Fig. 1d). To further examine the CBP-induced metastatic potential, a cell invasion assay was performed with the most resistant variant, showing a significant increase in MES-OV CBP8 invasion compared with the parental MES-OV cell line (Fig. 1e).
Fig. 1. Characterisation of MES-OV and MES-OV CBP variants regarding their sensitivity to CBP and TAX, EMT phenotype, and metastatic potential.

a The schema of the protocol used for establishing the OC cell model with acquired CBP resistance. The epithelial or mesenchymal-like phenotype was determined visually by observing morphological differences in cell shape under the microscope. b Parental and CBP variants were treated with different concentrations of either CBP or TAX for 72 h, after which the cell survival was measured by AlamarBlue assay. The average IC50 ± SD of three experiments was shown. c Constitutive expressions of four EMT markers (CDH1, CDH2, FN1, VIM) were determined by RT-qPCR and plotted as fold changes compared with MES-OV. The average of at least three experiments was shown. Statistical significance between samples was calculated by one-way ANOVA with Dunnett’s post hoc tests. d Cell migration was analysed by wound healing assay and plotted as a fold of MES-OV cells value set as 1. Statistical significance was calculated by Student’s t-test. The average values of three independent experiments were shown. e Cell invasion was analysed by cell invasion assay and plotted as a fold of MES-OV cells value set as 1. The average values of three independent experiments were shown. Statistical significance was calculated by Student’s t-test. *p < 0.05; **p < 0.01; ***p < 0.001; ****p < 0.0001.
Gene selection by integration of the CBP sensitivity data as a selection criterion results in a significantly different gene list and enriched signalling pathways compared with the more frequently used DEG analysis
The selection of different genes that could potentially be involved in CBP-induced resistance and EMT was analysed following two different approaches. The first one compared the gene expression profile of the most resistant MES-OV CBP8 cell line with the parental MES-OV cell line. Genes that passed filters (p value < 0.05, logFC > |1|) (Supplementary Fig. S3a) were named DEGs. The second approach correlated the expressions of individual genes across all established variants (MES-OV, CBP2, CBP3,…, CBP8) with the corresponding resistance to CBP (logIC50). Genes were filtered by Spearman’s rank correlation coefficients (Spearman’s ρ > |0.670|, manually set to result in the same number of genes as DEGs). The generated gene list was named CCORG. In both lists, genes were sorted by the FC, starting from the most upregulated one. The two lists were examined based on descriptive statistics, protein interactions (PPI), enrichment in GO Ontology of biological processes, and KEGG and WikiPathways databases.
Lists consisted of 2127 genes, shared 647 of them, and had a similar number of up- and downregulated genes, thus making the descriptive statistics data comparable. As expected, the DEG list had higher means/medians of log2FC and |log2FC| compared with the CCORG. Expectedly, CCORGs had higher mean/median values of Spearman’s ρ (Table 1). Interestingly, PPI analysis showed a 66.37% higher incidence of all protein interactions between the proteins coded by the genes from the CCORG group (13,285), compared with DEG (7985), at 0.500 ‘confidence score’. The increased number of interactions in the CCORG group was further confirmed by analysing different interactions generated separately from text mining data (4835, +27.04%), experiments (3049, +228.20%), curated databases (4073, +54.75%) and co-expression data (2893, +243.58%). Interestingly, both DEG-enriched categories of signalling pathways highlighted the importance of differentiation processes and PI3K-Akt signalling pathway, while CCORG-enriched categories of biological processes and KEGG pathways highlighted the importance of RNA processing, metabolism, and translation.
Table 1.
Comparison of DEG and CCORG gene lists.
| Differentially expressed genes (DEG) | CBP-correlating genes (CCORG) | |
|---|---|---|
| Descriptive statistics | ||
| Number of genes | 2127 | 2127 |
| Number of genes UP/DOWN | 950/1177 (44.6/55.3%) | 1001/1126 (47.1/52.9%) |
| Mean/median log2FC | –0.181/–1.055 | –0.001/–0.075 |
| Mean/median |log2FC| | 1.698/1.415 | 0.882/0.735 |
| Min/max FC | –9.935/6.915 | –9.935/5.305 |
| Mean/median ρ | –0.043/–0.250 | 0.882/0.735 |
| Mean/median |ρ| | 0.548/0.571 | 0.768/0.750 |
| Min/max ρ | –1/1 | –1/1 |
| PPI analysis | ||
| Nodes (proteins) | 2064 | 2077 |
| Edges (interactions) | 7985 | 13,285 |
| Text mining | 3806 | 4835 |
| Experiment | 929 | 3049 |
| Databases | 2632 | 4073 |
| Co-expression | 842 | 2893 |
| Gene set enrichment analysis (GSEA) (q value) | ||
| Gene Ontology: biological processesa | Endoderm formation (GO:0001706) (q = 0.0056) | Ribosome biogenesis (GO:0042254) (q = 2.32E–09) |
| Endodermal cell differentiation (GO:0035987) (q = 0.0100) | rRNA processing (GO:0006364) (q = 8.08E–09) | |
| Regulation of cell migration (GO:0030334) (q = 0.0100) | rRNA metabolic process (GO:0016072) (q = 1.89E–08) | |
| Extracellular matrix organisation (GO:0030198) (q = 0.0100) | ncRNA processing (GO:0034470) (q = 1.63E–07) | |
| Positive regulation of multicellular organismal process (GO:0051240) (q = 0.0100) | Mitochondrial translation (GO:0032543) (q = 1.66E–04) | |
| Regulation of MAP kinase activity (GO:0043405) (q = 0.0100) | Mitochondrial translational termination (GO:0070126) (q = 1.66E–04) | |
| Axonogenesis (GO:0007409) (q = 0.0100) | Translational termination (GO:0006415) (q = 7.61E–04) | |
| Positive regulation of cell migration (GO:0030335) (q = 0.0100) | Mitochondrial translational elongation (GO:0070125) (q = 0.0017) | |
| Intrinsic apoptotic signalling pathway (GO:0097193) (q = 0.0187) | Nuclear RNA surveillance (GO:0071027) (q = 0.0020) | |
| Positive regulation of cell motility (GO:2000147) (q = 0.0190) | Positive regulation of protein localisation to chromosome, telomeric region (GO:1904816) (q = 0.0020) | |
| KEGG Pathwaysa | Axon guidance (q = 0.0004) | Ribosome biogenesis in eukaryotes (q = 0.0124) |
| Pathways in cancer (q = 0.0019) | RNA degradation (q = 0.0124) | |
| Calcium signalling pathway (q = 0.0434) | Mitophagy (q = 0.0124) | |
| PI3K-Akt signalling pathway (q = 0.0434) | Spliceosome (q = 0.0124) | |
| Ras signalling pathway (q = 0.0590) | RNA transport (q = 0.0124) | |
| Rap1 signalling pathway (q = 0.0780) | Ribosome (q = 0.0216) | |
| Fluid shear stress and atherosclerosis (q = 0.0780) | RNA polymerase (q = 0.0382) | |
| Hepatocellular carcinoma (q = 0.0780) | Colorectal cancer (q = 0.0476) | |
| Proteoglycans in cancer (q = 0.0780) | Pancreatic cancer (q = 0.0598) | |
| Lysosome (q = 0.0957) | Autophagy (q = 0.0598) | |
| WikiPathwaysa | Ectoderm Differentiation WP2858 (q = 0.0000) | Integrated breast cancer pathway WP1984 (q = 0.0030) |
| Mesodermal commitment pathway WP2857 (q = 0.0037) | Fatty Acid Biosynthesis WP357 (q = 0.0083) | |
| Glucocorticoid Receptor Pathway WP2880 (q = 0.0037) | Pyrimidine metabolism WP4022 (q = 0.0083) | |
| PI3K-Akt signalling pathway WP4172 (q = 0.0078) | One-carbon metabolism WP241 (q = 0.0486) | |
| Type I collagen synthesis in the context of Osteogenesis imperfecta WP4786 (q = 0.0590) | Copper homoeostasis WP3286 (q = 0.0486) | |
| Nuclear Receptors Meta-Pathway WP2882 (q = 0.0114) | Androgen receptor signalling pathway WP138 (q = 0.0486) | |
| Lung fibrosis WP3624 (q = 0.0141) | Metabolic reprogramming in colon cancer WP4290 (q = 0.0486) | |
| GDNF/RET signalling axis WP4830 (q = 0.0211) | Mitochondrial LC-Fatty Acid Beta-Oxidation WP368 (q = 0.0486) | |
| Development of ureteric collection system WP5053 (q = 0.0457) | Thyroid-stimulating hormone (TSH) signalling pathway WP2032 (q = 0.0486) | |
| Cardiac Progenitor Differentiation WP2406 (q = 0.0457) | TGF-beta signalling Pathway WP366 (q = 0.0486) | |
aOnly the top 10 results or results q value < 0.05 are shown.
Obtained data showed that two approaches resulted in different sets of genes regarding their protein–protein interactions, enrichment in GO Ontology of biological processes, KEGG, and WikiPathways databases.
Selected differentially expressed genes (DEGs) show promising roles in drug resistance, drug-induced EMT, and as biomarkers, with TMEM200A potentially relevant in all three
First, the most used approach of comparing gene expression patterns between the most resistant MES-OV CBP8 and parental MES-OV cell line was used. Top 50 up- and downregulated DEGs were explored in the literature for their known cell function, possible role in drug resistance, EMT, and regulation by epigenetic elements, by using keywords ‘ovarian cancer’, ‘HGSOC’, ‘platinum’, ‘carboplatin’ ‘cisplatin’, ‘resistance’ and a ‘gene name’ (accessed: 13 July 2020). Out of 100 candidates, 14 were selected for further analysis (DNER, ELOVL7, SLC38A5, FRG2, MFSD6, TMEM200A, MIR99AHG, PLTP, AUTS2, HS3ST3A1, HS3ST3B1, SERPINE2, TMEM47, TSPAN18). The expression of selected genes was investigated by RT-qPCR in two additional OC cell pairs, OVCAR-3/OVCAR-3 CBP7 and SK-OV-3/SK-OV-3 CBP6, to avoid the cell-specific outcome (Supplementary Fig. S3b). Only four genes had similar expression patterns in all three cell models – MIR99AHG, DNER, TMEM200A, and SERPINE2. Their expression was additionally explored by RT-qPCR (Supplementary Fig. S3c) in CBP-resistant clones (MES-OV 25C A5/96 and MES-OV 25C A6/96; see Materials and Methods section ‘Development of the CBP-resistant clones’). The selected clones had a prominent resistant phenotype (Supplementary Fig. S1a) acquired upon single treatment with 25 µM CBP - the final dose used for the development of all CBP-resistant cell lines. Based on the obtained data, it was concluded that only expressions of MIR99AHG, DNER, TMEM200A, and SERPINE2 correlated in all four established OC cell models, and they were chosen for functional analysis.
Transfection of cells with specific siRNAs was performed to test whether selected genes could alter the sensitivity of MES-OV and MES-OV CBP8 cells to CBP and/or their metastatic capacity. Transfection conditions that significantly reduced target gene expression levels (Supplementary Fig. S3d) and reduced cell viability by no more than 20% were considered for functional experiments. Silencing of MIR99AHG was performed in MES-OV cells, where its constitutive expression was higher compared with MES-OV CBP8 cells. In the case of DNER, TMEM200A, and SERPINE2, MES-OV CBP8 cells were transiently transfected with corresponding siRNAs.
Silencing of MIR99AHG in MES-OV cells showed no significant impact on the sensitivity to CBP compared with MES-OV cells transfected with non-target control (Supplementary Table S2 and Fig. 2a). On the other hand, silencing of DNER unexpectedly rendered MES-OV CBP8 cells more resistant to CBP, while TMEM200A silencing increased the sensitivity to CBP compared with non-target control (Fig. 2a and Supplementary Table S2). The decrease in SERPINE2 expression did not influence cell viability upon CBP treatment (Fig. 2a and Supplementary Table S2). To specifically explore a possible role of the investigated genes in cell death regulation, the effects of gene silencing on CBP stress response were analysed by Annexin V-FITC/PI assay. MIR99AHG silencing slightly increased the number of MES-OV dead cells upon CBP (Fig. 2b and Supplementary Table S2). A decrease in DNER expression did not affect the death response rate of MES-OV CBP8 cells to the treatment with CBP compared with the non-target control (Fig. 2b and Supplementary Table S2). Silencing of TMEM200A and SERPINE2 in MES-OV CBP8 cells increased the percentage of dead cells upon CBP compared with non-target MES-OV CBP8 control cells (Fig. 2b and Supplementary Table S2). In summary, it was only the silencing of TMEM200A that sensitised MES-OV CBP8 cells to CBP treatment, measured by both cell viability and cell death assays.
Fig. 2. Functional analysis of MIR99AHG, DNER, TMEM200A, and SERPINE2 in CBP resistance, drug-induced metastatic potential, and their possible clinical application.

a Transiently transfected MES-OV cells with siMIR99AHG and MES-OV CBP8 cells with siDNER, siTMEM200A, or siSERPINE2 were seeded and 24 h after treated with different concentrations of CBP. The effect of silencing on cell viability was determined 72 h after with the AlamarBlue assay. All data were plotted as the average absorbance values – blank. Statistical significance was determined by two-way ANOVA with Bonferroni’s post hoc tests. IE p values < 0.05 were considered significant. The representative data of three experiments was shown. b Twenty-four hours after seeding transiently transfected cells, MES-OV and MES-OV CBP8 cells were treated for 72 h with IC50 values of 50 and 150 μM CBP, respectively. The cell death was measured by flow cytometry upon cell staining with Annexin V-FITC and PI. Statistical significance was determined by two-way ANOVA with Bonferroni’s post hoc tests. IE p values < 0.05 were considered significant. The representative data from three experiments was shown. c Twenty-four hours after the seeding of transiently transfected cells, confluent MES-OV and MES-OV CBP8 were scratched. Scratch was photographed (n = 12) immediately and after 6 h. Data were expressed as the average percentage of migrated cells calculated from three independent experiments and plotted as a fold of MES-OV si(-). Statistical significance was determined by one-way ANOVA with Dunnett’s post hoc tests. The average of three independent experiments was shown. d Transfected MES-OV and MES-OV CBP8 cells were seeded in transwell chambers coated with Matrigel® in a 24-well plate for invasion assay. After 22 h, invaded cells from the bottom side of the membrane were fixated, stained, and photographed (×10 magnification). Total areas covered by invaded cells were measured and expressed as a fold of MES-OV si(-). The average of three independent experiments was shown. Statistical significance was determined by one-way ANOVA with Dunnett’s post hoc tests. *p < 0.05; **p < 0.01; ***p < 0.001; ****p < 0.0001. Detailed statistics are available upon request. e Prognostic value of genes was analysed using KM Plotter online tool on specific cohorts of OC patients (OS, n = 406; PFS, n = 403) and presented as KM plots, along with HR and log-rank p values. f Predictive value of genes was analysed using ROC Plotter online tool on specific cohorts of OC patients (RFS at 6 months, n = 426) and presented as ROC curves with indicated AUC and p values. Significant p values were shown in bold.
The effects of selected genes on cell migration and invasion were examined by wound healing and invasion assays. The migration of MES-OV cells was not changed after MIR99AHG was silenced. Also, the migration of MES-OV CBP8 cells did not change when DNER was silenced. On the other hand, a significant decrease in the migration of MES-OV CBP8 cells was observed after silencing TMEM200A and SERPINE2 (Fig. 2c and Supplementary Table S2). An increase in invasion rate was observed after silencing of MIR99AHG (p < 0.01) in MES-OV cells, while a decrease in invasion rate of MES-OV CBP8 cells was observed after silencing of DNER (p < 0.05), TMEM200A (p < 0.05) and SERPINE2 (p < 0.01) (Fig. 2d and Supplementary Table S2). To conclude, TMEM200A and SERPINE2 silencing resulted in a decrease in both migration and invasion in the MES-OV CBP8 cell line.
From DEG obtained list, only TMEM200A silencing impacted all four investigated processes.
In addition, MIR99AHG, DNER, TMEM200A, and SERPINE2 were analysed for their prognostic value by the KM Plotter online tool (patients filtered to include only those determined according to The International Federation of Gynecology and Obstetrics (FIGO) as stage I–III and who received platinum therapy). The HR of MIR99AHG overall survival (OS) and progression-free survival (PFS) was high (1.8, p = 0.000 and 1.41, p = 0.004), implying a better prognosis for the patients where the expression of MIR99AHG was low, which is opposite to our in vitro findings (Supplementary Fig. S3b). Among the other genes, DNER showed the highest HR score in OS (1.63, p = 0.002), while lower in PFS (1.34, p = 0.008). TMEM200A had an OS and PFS HR of 1.44 (p = 0.007) and 1.53 (p = 0.000), showing a more prominent prognostic value in PFS. OS HR of SERPINE2 was statistically insignificant (p = 0.1600), while the PFS HR was somewhat lower than that of the other genes (1.25, p = 0.008). When all four genes were taken into consideration (Signature), OS and PFS HRs of 1.52 (p = 0.006) and 1.51 (p = 0.001) were reported (Fig. 2e and Supplementary Table S3). Predictive values of genes were evaluated using ROC Plotter tool. DNER and TMEM200A AUC scores were 0.603 (p = 0.002) and 0.635 (p = 0.000), respectively, while MIR99AHG and SERPINE2 had lower but not statistically significant AUC values (Fig. 2f and Supplementary Table S3). The combined Signature score was 0.609 (p = 0.001). When independently analysed on patient cohorts with optimal debulking who received platinum or platinum + paclitaxel therapies, high and statistically significant AUC values of 0.761 (p = 3.5e–05) and 0.726 (p = 3e–03) were observed for TMEM200A (Supplementary Fig. S4), suggesting its possible use in determining the outcome of platinum-based therapy in patients with optimal debulking. Nothing similar was observed for other investigated genes (data not shown). According to the results, it seems that expressions of DNER and TMEM200A, as well as the score of all four genes combined (Signature), correlate well with the patients’ OS, PFS, and relapse-free survival after 6 months, implying their possible usefulness as prognostic and predictive markers.
Selected DEGs with high CBP correlation show promising roles in drug resistance or drug-induced EMT, with PRKAR1B being involved in both processes and having the potential to be a predictive biomarker
A gradual increase in CBP resistance, the unique characteristic of our cell model, was exploited as an additional gene selection filter. First, log2IC50 was calculated for every established cell line in the model. These values were then added to the matrix of log2FC values of all DEGs. Spearman’s Rho correlation coefficients were then calculated in R software. All genes were filtered to include only those with significant confidence statistics (adjusted p < 0.05), logFC > |1|, and a correlation higher than |0.800|. Notably, the correlation coefficient cut-off was higher than the one used in Table 1 (|0.670|) to generate a shorter list of highly correlating genes. This intersection of DEG and CCORG lists, visualised by VennPainter software [21], resulted in 664 common genes (Supplementary Fig. S5a). The resulting list was sorted by the |log2FC| and 100 top genes were searched in literature for their known cell function, possible role in drug resistance, and EMT (accessed: 13 July 2020), same as DEGs. Eleven genes (FBLN5, GRAMD1B, SAMD9, FILIP1L, HES7, NTM, FAM167A, MAP1B, PIK3R1, PRKAR1B, and WDR46) were chosen and their expression was examined by RT-qPCR in additional OC cell line models (Supplementary Fig. S5b, c). Only four genes (FBLN5, WDR46, HES7, and PRKAR1B) were selected for functional experiments.
MES-OV cells were transiently transfected with siRNAs for PRKAR1B, HES7, and WDR46, while, in the case of FBLN5, transfection was performed in MES-OV CBP8 cells (Supplementary Fig. S5d). The impacts of silencing on cell viability and cell death upon drug treatment, as well as cell migration and invasion, were determined.
Silencing of PRKAR1B decreased the sensitivity of MES-OV cells to CBP (Fig. 3a and Supplementary Table S4), while HES7 and WDR46 silencing had no impact on MES-OV cell line viability upon CBP treatment (Fig. 3a and Supplementary Table S4). Silencing of FBLN5 in MES-OV CBP8 did not affect cell viability upon CBP treatment (Fig. 3a and Supplementary Table S4). The effect of PRKAR1B silencing on MES-OV cell viability was confirmed by cell death assay, showing a statistically significant reduction in the percentage of dead cells compared with the non-target MES-OV control (Fig. 3b and Supplementary Table S4). Silencing of HES7 did have a statistically significant IE (IE = 0.0380) but failed to influence MES-OV cell death upon CBP. Decreased WDR46 expression had no impact on MES-OV cells’ sensitivity to CBP compared with non-target MES-OV control cells (Fig. 3b and Supplementary Table S4). Interestingly, the silencing of FBLN5 increased the sensitivity of MES-OV CBP8 cells to CBP (Fig. 3b and Supplementary Table S4). PRKAR1B was the only gene whose silencing impacted the sensitivity of MES-OV cells to CBP using both assays. FBLN5 could also be a potential candidate for future experiments concerning its possible role in CBP stress response.
Fig. 3. Functional analyses of PRKAR1B, HES7, WDR46, and FBLN5 in CBP resistance and drug-induced metastatic potential.

a Transiently transfected MES-OV cells with siPRKAR1B, siHES7, and siWDR46, and MES-OV CBP8 cells with siFBLN5 were seeded and after 24 h treated with different concentrations of CBP. The effect of silencing on cell viability was determined after 72 h with the AlamarBlue assay. All data were plotted as the average absorbance values – blank. Statistical significance was determined by two-way ANOVA with Bonferroni’s post hoc tests. IE p values < 0.05 were considered significant. The representative data of three experiments was shown. b Twenty-four hours after seeding transiently transfected cells in a 24-well plate, MES-OV and MES-OV CBP8 cells were treated for 72 h with IC50 values of 50 and 150 μM CBP, respectively. Cell death was measured by flow cytometry upon cell staining with Annexin V-FITC and PI. Statistical significance was determined by two-way ANOVA with Bonferroni’s post hoc tests. IE p values < 0.05 were considered significant. The representative data from three experiments was shown. c Twenty-four hours after the seeding of transiently transfected cells, confluent MES-OV and MES-OV CBP8 were scratched. Scratch was photographed (n = 12) immediately and after 6 h. Data were expressed as the average percentage of migrated cells calculated from three independent experiments and plotted as a fold of MES-OV si(-). Statistical significance was determined by one-way ANOVA with Dunnett’s post hoc tests. d Transfected MES-OV and MES-OV CBP8 cells were seeded in transwell chambers coated with Matrigel® in a 24-well plate for invasion assay. After 22 h, invaded cells from the bottom side of the membrane were fixated, stained, and photographed (×10 magnification). Total areas covered by invaded cells were measured and expressed as a fold of MES-OV si(-). The average of three independent experiments was shown. Statistical significance was determined by one-way ANOVA with Dunnett’s post hoc tests. *p < 0.05; **p < 0.01; ***p < 0.001; ****p < 0.0001. Detailed statistics are available upon request. e Prognostic value of genes was analysed using KM Plotter online tool on specific cohorts of OC patients (OS, n = 406; PFS, n = 403) and presented as KM plots, along with HR and log-rank p values. f Predictive value of genes was analysed using ROC Plotter online tool on specific cohorts of OC patients (RFS at 6 months, n = 426) and presented as ROC curves with indicated AUC and p values. Significant p values were shown in bold.
Silencing of PRKAR1B increased MES-OV cell migration. This effect was not observed upon a decrease in HES7 and WDR46 expression. Silencing of FBLN5 reduced the migration of MES-OV CBP8 cells compared with non-target MES-OV CBP8 control cells (Fig. 3c and Supplementary Table S4). Data obtained by the invasion assay correlated with the migration-based data in the case of PRKAR1B (Fig. 3d and Supplementary Table S4), reporting high invasiveness of PRKAR1B-silenced MES-OV cells compared with non-target MES-OV control cells. Silencing of HES7 did not impact the invasive potential of MES-OV cells while silencing of WDR46 significantly increased the invasion of MES-OV cells. MES-OV CBP8 cells with silenced FBLN5 showed a significantly reduced invasion compared with non-target MES-OV CBP8 control cells (p < 0.01; Fig. 3d and Supplementary Table S4). Interestingly, the observed impact on cell migration and invasion was similar for PRKAR1B and FBLN5, supporting their potential influence on the cell’s metastatic capacity. To conclude, PRKAR1B was the only gene whose silencing effects were confirmed in all four investigated processes, while the consequence of FBLN5 silencing was observed on all examined processes only not on cell viability upon treatment with CBP (Supplementary Table S4).
The highest individual HR values were reported for FBLN5 (OS HR = 1.27, p = 0.0062), while HR values for PRKAR1B, HES7, and WDR46 were small or not statistically significant (Supplementary Table S5 and Fig. 3e). The Signature (all four genes) values were 1.38 (p = 0.014) and 1.40 (p = 0.0032) for OS and PFS, respectively. Predictive values of PRKAR1B (AUC = 0.638, p = 2.2e–06), FBLN5 (AUC = 0.576, p = 2.3e–02) and gene signature (AUC = 0.576, p = 2.3e–02) were significant, while predictive values of other selected genes were mostly small or insignificant (Fig. 3f and Supplementary Table S5). Compared with the DEGs analysed above (Fig. 2e, f and Supplementary Table S3), four CCORG were greatly outperformed. The only exception was the high predictive value of PRKAR1B, suggesting its potential in predicting the response of HGSOC patients to platinum-based therapy.
Triptolide and Rapamycin decreased the sensitivity of MES-OV cells but sensitised MES-OV CBP8 to CBP, while LY294002, Wortmannin, AZD1080, and Akti-1/2 reduced migration in both cell lines
To explore whether targeting associated gene sets referred to in a pathway instead of the individual gene(s) could be a better approach for influencing the sensitivity of OC cells to CBP, commercially available inhibitors were used. Upon detailed literature search of signalling pathways and processes indicated in Table 1, with a focus on the one described in the context of platinum drugs resistance and platinum drugs-induced EMT (accessed: 13 July 2020), 14 inhibitors were chosen: Rapamycin (Sirolimus; mTOR inhibitor), LY294002 (PI3Kα/δ/β inhibitor), Wortmannin (PI3K inhibitor), Idelalisib (PI3K p110δ inhibitor), AZD1080 (GSK-3 inhibitor), SB216763 (GSK-3 inhibitor), Akti-1/2 (Akt1/Akt2 inhibitor), TIC-10 (Akt/ERK inhibitor), Cilengitide (integrin receptor inhibitor), Triptolide (NF-κB inhibitor), Rilpivirine (non-nucleoside reverse transcriptase inhibitor), Roscovitine (CDK inhibitor), Febuxostat (xanthine oxidase inhibitor, ECM), and TVB-3166 (fatty acid synthase inhibitor). To observe the effect of inhibitors on cell survival and identify effective inhibitor concentrations, MES-OV and MES-OV CBP8 cells were treated with different concentrations of each inhibitor or DMSO as a negative control.
The results showed that MES-OV CBP8 cells were less sensitive to LY294002, Idelalisib, AZD1080, Akti-1/2, Cilengitide, Rilpivirine, Roscovitine, Febuxostat, and TVB-3166 treatment compared with MES-OV cells, while both cell lines were similarly sensitive to TIC-10. Interestingly, MES-OV CBP8 cells were more sensitive to Rapamycin, Wortmannin, SB216763, and Triptolide compared with MES-OV cells (Supplementary Fig. S6). Therefore, we wanted to explore whether pre-treatment of MES-OV and MES-OV CBP8 cells with Rapamycin, Wortmannin, SB216763, or Triptolide influences cell response to CBP. Only concentrations that reduced cell viability by up to 20% in both cell variants were used to avoid cell toxicity of the inhibitor itself. If the effect of combination treatment was statistically significant on raw absorbance data (IE < 0.05), results were normalised to corresponding treatment controls to make conclusions (Supplementary Table S6). Rapamycin and Wortmannin reduced the sensitivity of MES-OV cells to CBP, while other inhibitors had no significant effect (Supplementary Table S6 and Fig. 4a). On the other hand, Rapamycin and Triptolide sensitised MES-OV CBP8 cells to CBP, while Wortmannin had the opposite effect (Supplementary Table S6 and Fig. 4a). Next, a flow cytometric Annexin V-FITC/PI assay was performed to assess the influence on cell death. Rapamycin reduced MES-OV cell death upon CBP, which confirmed previous results obtained by cell viability assay, while MES-OV CBP8 cells became less prone to CBP-induced cell death, which is opposite from data obtained by cell viability assay (Fig. 4b). Triptolide reduced cell death upon CBP in MES-OV cells, while a slight, statistically irrelevant increase in cell death upon CBP was observed in MES-OV CBP8 cells (Supplementary Table S6 and Fig. 4c).
Fig. 4. Functional analysis of inhibitors in CBP resistance and drug-induced metastatic potential.

a Cells were seeded and after 24 h pre-treated with inhibitors or DMSO as a control. After 2 h, cells were treated with different concentrations of CBP, and the effects on cell survival were determined after 72 h with the AlamarBlue assay. All data were plotted as the average absorbance values. The statistical significance of the combinatory effect was determined by the two-way ANOVA with Bonferroni’s post hoc tests. Interaction effect (IE) p values < 0.05 were considered significant. The representative data of three experiments was shown. b, c Twenty-four hours after the seeding of cells in a 24-well plate, cells were pre-treated with inhibitors. After 2 h, MES-OV and MES-OV CBP8 cells were treated for 72 h with IC50 values of 50 and 150 μM CBP, respectively. Cell death was measured by flow cytometry upon cell staining with Annexin V-FITC and PI. Statistical significance was determined by two-way ANOVA with Bonferroni’s post hoc tests. The representative data from three experiments was shown. d Twenty-four hours after the seeding, cells were starved for 24 h, pre-treated with inhibitors or DMSO, and scratched. Scratch was photographed immediately and after 6 h. Data were expressed as the average percentage of migrated cells calculated from three independent experiments. Statistical significance was determined by one-way ANOVA with Dunnett’s post hoc tests or two-way ANOVA with Bonferroni post hoc tests. *p < 0.05; **p < 0.01; ***p < 0.001; ****p < 0.0001. Detailed statistics are available upon request.
In summary, the only results confirmed by both assays were the reduced sensitivity of MES-OV cells to CBP after Rapamycin pre-treatment and, more interesting, the sensitisation of MES-OV CBP8 cells upon CBP after Triptolide pre-treatment. The discrepancy between cell viability and cell death assay data could be a consequence of other cell processes triggered by combination treatment, such as cell proliferation or other types of cell death not detected by Annexin V-FITC/PI staining.
Treatment of MES-OV cell pair with Rapamycin, Idelalisib, TIC-10, Cilengitide, Triptolide, Rilpivirine, Roscovitine, Febuxostat, and TVB-3166 did not influence cell migration in both cell variants. LY294002, Wortmannin, AZD1080, and Akti-1/2 reduced migration in both cell lines. Only SB216763 increased migration in MES-OV CBP8 (Fig. 4d). Statistical analysis showed that none of the explored inhibitors had a significantly different impact on the two cell variants. Therefore, invasion experiments were not performed. To conclude, LY294002, Wortmannin, AZD1080, and Akti-1/2 reduced the migration of both parental MES-OV and resistant MES-OV CBP8 cells. Data implies their possible use as an addition to drug therapy for highly invasive tumours.
Discussion
The scientific community has been investigating tumour drug resistance mechanisms trying to find the best therapeutic targets for years. The increasing body of evidence shows chemotherapy itself triggers adaptive drug resistance [22], tumour lymphangiogenesis [23], and metastasis [24, 25]. In other words, the metastatic potential of tumour cells that survived chemotherapy is often stronger than before therapy. Collection, storage, analysis, and dissemination of biological data, obtained from genome sequencing or Microarray gene expression analysis, is one of the approaches to finding the novel therapeutic target(s) which will weaken or inhibit tumour cell viability and invasive capacity. Unfortunately, most of the data obtained are discussed only in the context of possible predictive or prognostic values, without detailed research of their possible relevance for the development or regulation of drug resistance and/or metastasis [9, 26, 27]. However, recent studies report that certain proteases, components of the ECM, chemokines, proangiogenic factors [28], microRNAs, DNA methylation factors [7], combination therapies with metformin and cisplatin (cDDP) [29], and even multi-functional flavonoids [30] could play an important role either in altering sensitivity to platinum drugs or spreading and invasion.
Here, we wanted to explore specifically the possible overlapping molecule(s) involved in drug resistance and drug-induced EMT. For this purpose, we established and characterised the HGSOC cell model of a gradual increase in CBP resistance and performed transcriptome analysis on seven variants obtained along the way. Although this procedure has been used for years in developing drug-resistant cell lines, researchers mainly focused on changes seen in the most resistant cell variant. The only examples of analysing all developed variants were reported by Hassan et al. [31] in TAX-resistant KF-28 OC cells and by Szenajch et al. [32] in TAX-resistant and cDDP-inversely resistant A2780 OC cells, where they observed miRNA or mRNA expressions, respectively. Notably, they used different resistance-establishment protocols and algorithms to select genes. Up to now, no model of gradual increase of acquired resistance to CBP in OC and a comprehensive CBP response-based approach of selecting genes was reported. The CBP-resistant cell variants established in our lab showed a gradual, non-linear increase in CBP resistance, cross-resistance to TAX, and an increase in migration and invasion rates, both described as underlying metastasis processes. Intriguingly, expressions of EMT markers across variants and the expressions of mesenchymal markers CDH2, FN1 and VIM in the most resistant variant did not reflect the observed EMT-like morphological changes and CBP resistance. On the other hand, protein expressions of E-cadherin, N-cadherin, and Vimentin followed a well-known, conventional EMT pattern. The observed contrasting gene and protein expressions of selected mesenchymal markers was not unexpected, and was reported before [33, 34]. The reasons could be the concentration, production and turnover rate differences between mRNAs and proteins, reservoirs (‘pools’) of proteins regulated by disturbed signalling networks established during the development of acquired drug resistance, or the population heterogeneity of the established resistant variants [34]. Studies showed that inside the total tumour population, some cell subpopulations can have different drug responses, altered expression of EMT markers, and changed stem and metastatic properties [35–37]. Moreover, these studies showed that although it would be expected that cell subpopulations with high expression of mesenchymal markers would be the most resistant ones, those with non-definable expressions of EMT markers, characterised as ‘intermediate/hybrid EMT phenotype’ [13], often had more substantial metastatic potential, higher drug resistance, and stronger tumour-initiating potential. To support this, we checked the expression of other EMT-related genes included in the Microarray probe and found a changed expression and high correlation between CBP resistance and the expression of DSP and SNAI2, both previously reported in various resistance mechanisms [38, 39]. However, in-depth analysis and additional experiments need to be performed to understand this phenomenon better. In addition, a significant difference in gene expression pattern was observed between resistant variants MES-OV CBP4 and MES-OV CBP5, suggesting a possible turning point in gene regulation. Since the underlying mechanisms of these phenomena are still unknown, they will be the focus of our future research.
Two different approaches were used to find key players orchestrating both drug resistance and metastasis. DEGs between the CBP-resistant and the parental cell line were analysed in one approach. In the other, transcriptome data of all seven variants were compared with the parental cell line and correlated with their sensitivity to CBP (named CCORG). Compared with the work of Szenajch et al. [32], who used Spearman’s rank coefficient correlation of gene expressions and log10 of cDDP and TAX sensitivity just to describe gene expression patterns between established cell variants resistant to TAX, but used the most resistant vs. parental analysis for further candidate gene(s) search, we directly used correlations as an additional filter for finding genes that could guide acquired resistance. The two approaches used here resulted in significantly different gene lists and enriched signalling pathways, with CCORGs having a higher number of interactions compared with DEGs, indicating that these genes were previously more functionally described and that the pathway analysis of CCORGs could result in the identification of pathways with greater functional value. Everything mentioned suggests that implementation of correlation coefficients in drug resistance research could be not only novel and beneficial in finding new targets, but result in more meaningful pathway enrichments and help to uncover the complex overlapping regulatory networks behind drug resistance and metastasis.
The selection of single genes to find possible key players involved in drug resistance and metastasis was comprehensively performed using the same MES-OV cell line model but with different filtering priorities (DEG vs DEG ∩ CCORG). Furthermore, additional cell models of acquired drug resistance (SK-OV-3/SK-OV-3 CBP6, OVCAR-3/OVCAR-3 CBP7) were implemented to confirm the results and further support our findings. Since these models were developed using similar treatment protocols, we hoped to mimic the diversity of CBP-induced transcriptome changes. Moreover, we established MES-OV CBP-resistant clones and used them as an additional selection cell model. The concept of resistant clones was previously described as a valuable model for investigating drug resistance [40]. With that in mind, only genes having similar expression patterns in all four cell models (MES-OV, SK-OV-3, OVCAR-3 cell pairs, and MES-OV CBP-resistant clones) were considered for further experiments. By implementing all mentioned models in candidate selection, we selected eight genes to perform functional experiments.
After the functional analysis of MIR99AHG, DNER, TMEM200A, SERPINE2, PRKAR1B, HES7, WDR46, and FBLN5, significant alterations in cell viability, cell death, migration, and invasion were observed when TMEM200A and PRKAR1B were silenced. Silencing of transmembrane protein 200A (TMEM200A) reduced cell viability and metastatic potential of highly resistant and invasive MES-OV CBP8 cells, suggesting its role in both processes. TMEM200A is predicted to be an integral component of the cell membrane, but its function is still unknown. Even as a single gene, TMEM200A was successfully shown as prognostic and predictive in patients who received platinum-based therapy with OS and PFS HR of 1.44 and 1.53, and ROC of 0.761. Transmembrane proteins (TMEM) are a group of proteins found in the plasma membrane and the membranes of organelles with mostly unknown functions [41]. So far, it is known that TMEM expressions can be down- or upregulated in tumour tissues compared with adjacent healthy tissues. Some TMEMs, such as TMEM48 or TMEM97, are defined as potential prognostic biomarkers for lung cancer. Experimental evidence suggests that TMEM proteins can be described as tumour suppressors or oncogenes. TMEM45A and TMEM205 have also been implicated in tumour progression, invasion, and chemoresistance [42]. In addition, we showed that PRKAR1B silencing potentiates resistance and metastasis development in parental MES-OV cells. PRKAR1B was previously shown to contribute to adrenal tumour formation [43], while PRKAR1B-AS2 long non-coding RNA and circ-PRKAR1B promoted tumorigenesis, viability, and chemoresistance in ovarian and liver cancer [44, 45]. No data regarding PRKAR1B in OC were reported, but since it’s a regulatory subunit of protein kinase A (PKA), which was shown to be involved in OC progression [46, 47], PRKAR1B presents a perspective novel candidate for future research. When SERPINE2 and FBLN5 were silenced in MES-OV CBP8 cells, an increase in cell death and a reduction in migration and invasion were observed. However, an increase in cell death was not detected by the cell viability assay. Annexin V-FITC/PI measures early apoptosis and late apoptosis/necrosis through the incorporation of PI and binding of Annexin V, while the cell viability assay detects metabolically active cells [48]. The different outputs of these two methods could be a reason for unexpected results. Therefore, it is also not surprising that the data we obtained by cell death assay and cell viability assay do not correlate in cases of MIR99AHG, DNER, SERPINE2, WDR46, FBLN5, and inhibitors. Nevertheless, both SERPINE2 and FBLN5 were previously described to be involved in cancer progression, drug resistance, and metastasis [49–52], with FBLN5 being mostly downregulated in resistant cells and tumours (opposite of our findings). Serpin E2/Glia-derived nexin (SERPINE2) is a serine protease inhibitor, mainly present in the ECM, secreted by many cell types, and shows activity towards thrombin, trypsin, and urokinase [53]. Fibulin 5 (FBLN5) is an ECM protein that is important for normal embryonic development and organogenesis [54, 55]. Its expression may also be associated with the suppression of tumour formation through its control of cell proliferation, motility, and angiogenic sprouting [55]. Studies have shown that FBLN5 overexpression significantly inhibited the migration, invasion, and proliferation abilities of OC cells in vitro [50]. However, no data regarding CBP stress response were reported, presenting the first indication of SERPINE2 and FBLN5 involvement in CBP resistance. In addition, TMEM200A and PRKAR1B both had very high CBP-correlating coefficients (0.714 and –0.964, respectively). Therefore, it can be concluded that in our experimental setting, DEGs outperformed CCORG in prognostic and predictive capacities, while implementing correlation data resulted in functionally more important genes. Applying the same approach in other studies could enhance cancer research productivity.
Despite the complex regulation of drug resistance and drug-induced metastasis, the single gene manipulation influenced the cell’s drug response and/or cell metastatic potential (Figs. 2 and 3). It was further expected that more significant changes in cell viability, death, migration, and invasion would be observed when specific inhibitors of the most enriched signalling pathways were applied. However, the effects of transient single-gene transfections and inhibitors were surprisingly similar. CBP-resistant cells were more sensitive only to treatments with mTOR inhibitor Rapamycin, wide-range PI3K inhibitor Wortmannin, GSK-3 inhibitor SB216763 and NF-κB inhibitor Triptolide, when compared with the MES-OV cells. In addition, only Rapamycin and Triptolide partially sensitised MES-OV CBP8 cells in combination with CBP. These results potentially suggest that primary targets of Rapamycin (mTOR [56]) and Triptolide (NF-κB [57]), or some of their indirect targets such as p70S6K, 4E-BP1 [58], cyclin-D, Bcl-2, Fas, Bax [59] could play a role in the response of MES-OV CBP8 cells to CBP. The presented effects of Rapamycin [58, 60], and Triptolide [61–64] on cell viability were previously reported in OC. Triptolide was also shown to inhibit EMT in TAX-resistant lung cancer [65] and cDDP resistance in vitro and in vivo through inhibition of the PI3K/Akt/NF-κB pathway [62] and AKT phosphorylation [66]. These data present interesting possible crosstalk, not only between drug resistance and EMT, but also between TAX and cDDP resistance, as well as between signalling pathways targeted by Rapamycin and Triptolide. Interestingly, we were not able to sensitise MES-OV CBP8 cells on CBP by targeting Akt or PI3K specifically. We expected the opposite effect on cells since these molecules are often investigated in the context of the platinum drug resistance [67] and PI3K-Akt is one of the most enriched pathways in MES-OV CBP variants (Table 1). Results regarding total Akt and p-Akt show that MES-OV CBP8 resistant cell variant has acquired increased constitutive expression of an Akt1/2 inhibitor-targeted molecule(s) and its active form (Supplementary Fig. S7a). Moreover, despite the decrease in p-Akt upon Akti-1/2 treatment the expression of Akt increased in MES-OV CBP8 cells (data not shown). Drug-resistant cells seem to have alternative survival pathways that help them resist inhibitors’ action consequences. Also, in this specific case, the possible ‘survival’ mechanism could include Akt3 (Supplementary Fig. S7b). AKT3 showed a significant correlation (r = 0.750) with TAX cell response (Supplementary Fig. S7c), supporting its possible role in the response of MES-OV CBP variants to the TAX-based therapy [68].
In addition, none of the inhibitors influenced the migratory capacity of the resistant MES-OV CBP8 variant differently than it affected the parental cells. However, LY294002, Wortmannin, AZD1080, and Akti-1/2, all targeting the PI3K/Akt pathway, reduced migration in both cell lines, suggesting a possible role of PI3K/Akt pathway members in the regulation of EMT.
It is important to note that no direct or indirect protein interactions were reported in STRING between TMEM200A, SERPINE2, PRKAR1B, FBLN5, and any Rapamycin or Triptolide targets (data not shown). Knowing the background of STRING algorithms, we can conclude that these genes are not yet thoroughly investigated and understood and will be the focus of our future studies regarding their more detailed function and signalling in CBP-induced cell stress response.
In conclusion, our results suggest that acquired resistance of OC cells to CBP and CBP-induced EMT are interconnected by sharing common genes and pathways. Identifying such dual-role genes, with potential as prognostic and predictive markers, is important for the future improvement of OC patients’ treatment. Our in vitro model with stable acquired resistance to CBP and TAX seems to support the need for new compounds which will target two phenomena, acquired resistance and metastatic capacity of the treated tumour in clinical settings. Further investigation of TMEM200A, PRKAR1B, as well as SERPINE2 and FBLN5, their regulation, and highlighted putative role in drug resistance and drug-induced EMT is necessary, both in vitro and in vivo.
Supplementary information
Acknowledgements
The authors would like to thank Professor Gerhard Fritz (University of Düsseldorf, Germany) and Professor Maja T. Tomicic (University Medical Center of the Johannes Gutenberg University of Mainz) for critical reading of the manuscript and helpful suggestions regarding its improvement and outlook, Graduate Engineer Marina Šutalo (Ruđer Bošković Institute, Croatia) for technical assistance, Mrs. Carla Edwards for language editing and members of the Centre for Information and Media Technology at Heinrich-Heine-University Düsseldorf who provided the computational infrastructure and support.
Author contributions
AB and JK designed the study. JK, MPK, SD, DSP and TW performed the experiments. AB, JK and KK provided conceptual advice. JK and AB wrote the manuscript. AB secured the funding.
Funding
These materials are based on the work financed by the Croatian Science Foundation (CSF, project numbers IP-2016-06-1036 and DOK-2018-01-8086), COST Action 17104, and Croatian League against Cancer.
Data availability
All data supporting the findings of this study are included within the article and its Supplementary Information files (and Reporting summary). Also, the data will be shared upon reasonable request to the corresponding author from colleagues who want to analyse in deep our findings.
Competing interests
The authors declare no competing interests.
Footnotes
Publisher’s note Springer Nature remains neutral with regard to jurisdictional claims in published maps and institutional affiliations.
Supplementary information
The online version contains supplementary material available at 10.1038/s41416-023-02140-1.
References
- 1.Reid BM, Permuth JB, Sellers TA. Epidemiology of ovarian cancer: a review. Cancer Biol Med. 2017;14:9–32. doi: 10.20892/j.issn.2095-3941.2016.0084. [DOI] [PMC free article] [PubMed] [Google Scholar]
- 2.Desai A, Xu J, Aysola K, Qin Y, Okoli C, Hariprasad R, et al. Epithelial ovarian cancer: an overview. World J Transl Med. 2014;3:1–8. doi: 10.5528/wjtm.v3.i1.1. [DOI] [PMC free article] [PubMed] [Google Scholar]
- 3.Brozovic A, Ambriović-Ristov A, Osmak M. The relationship between cisplatin-induced reactive oxygen species, glutathione, and BCL-2 and resistance to cisplatin. Crit Rev Toxicol. 2010;40:347–59. doi: 10.3109/10408441003601836. [DOI] [PubMed] [Google Scholar]
- 4.Tchounwou PB, Dasari S, Noubissi FK, Ray P, Kumar S. Advances in our understanding of the molecular mechanisms of action of cisplatin in cancer therapy. J Exp Pharmacol. 2021;13:303–28. doi: 10.2147/JEP.S267383. [DOI] [PMC free article] [PubMed] [Google Scholar]
- 5.Mosca L, Ilari A, Fazi F, Assaraf YG, Colotti G. Taxanes in cancer treatment: activity, chemoresistance and its overcoming. Drug Resist Updat. 2021;54:100742. doi: 10.1016/j.drup.2020.100742. [DOI] [PubMed] [Google Scholar]
- 6.Mellor HR, Snelling S, Hall MD, Modok S, Jaffar M, Hambley TW, et al. The influence of tumour microenvironmental factors on the efficacy of cisplatin and novel platinum(IV) complexes. Biochem Pharmacol. 2005;70:1137–46. doi: 10.1016/j.bcp.2005.07.016. [DOI] [PubMed] [Google Scholar]
- 7.Fang F, Cardenas H, Huang H, Jiang G, Perkins SM, Zhang C, et al. Genomic and epigenomic signatures in ovarian cancer associated with resensitization to platinum drugs. Cancer Res. 2018;78:631–44. doi: 10.1158/0008-5472.CAN-17-1492. [DOI] [PMC free article] [PubMed] [Google Scholar]
- 8.Kamble PR, Breed AA, Pawar A, Kasle G, Pathak BR. Prognostic utility of the ovarian cancer secretome: a systematic investigation. Arch Gynecol Obstet. 2022;306:639–62. doi: 10.1007/s00404-021-06361-8. [DOI] [PubMed] [Google Scholar]
- 9.Wu W, Wang Q, Yin F, Yang Z, Zhang W, Gabra H, et al. Identification of proteomic and metabolic signatures associated with chemoresistance of human epithelial ovarian cancer. Int J Oncol. 2016;49:1651–65. doi: 10.3892/ijo.2016.3652. [DOI] [PubMed] [Google Scholar]
- 10.Theiry JP. Epithelial-mesenchymal transitions in tumour progression. Nat Rev Cancer. 2002;2:442–54. doi: 10.1038/nrc822. [DOI] [PubMed] [Google Scholar]
- 11.Brozovic A. The relationship between platinum drug resistance and epithelial–mesenchymal transition. Arch Toxicol. 2017;91:605–19. doi: 10.1007/s00204-016-1912-7. [DOI] [PubMed] [Google Scholar]
- 12.Brozovic A, Duran GE, Wang YC, Francisco EB, Sikic BI. The miR-200 family differentially regulates sensitivity to paclitaxel and carboplatin in human ovarian carcinoma OVCAR-3 and MES-OV cells. Mol Oncol. 2015;9:1678–93. doi: 10.1016/j.molonc.2015.04.015. [DOI] [PMC free article] [PubMed] [Google Scholar]
- 13.Yang J, Antin P, Berx G, Blanpain C, Brabletz T, Bronner M, et al. Guidelines and definitions for research on epithelial–mesenchymal transition. Nat Rev Mol Cell Biol. 2020;21:341–52. doi: 10.1038/s41580-020-0237-9. [DOI] [PMC free article] [PubMed] [Google Scholar]
- 14.Moisan F, Francisco EB, Brozovic A, Duran GE, Wang YC, Chaturvedi S, et al. Enhancement of paclitaxel and carboplatin therapies by CCL2 blockade in ovarian cancers. Mol Oncol. 2014;8:1231–9. doi: 10.1016/j.molonc.2014.03.016. [DOI] [PMC free article] [PubMed] [Google Scholar]
- 15.von Mering C, Jensen LJ, Snel B, Hooper SD, Krupp M, Foglierini M, et al. STRING: known and predicted protein–protein associations, integrated and transferred across organisms. Nucleic Acids Res. 2004;33:D433–7. doi: 10.1093/nar/gki005. [DOI] [PMC free article] [PubMed] [Google Scholar]
- 16.Kuleshov MV, Jones MR, Rouillard AD, Fernandez NF, Duan Q, Wang Z, et al. Enrichr: a comprehensive gene set enrichment analysis web server 2016 update. Nucleic Acids Res. 2016;44:W90–7. doi: 10.1093/nar/gkw377. [DOI] [PMC free article] [PubMed] [Google Scholar]
- 17.Xie Z, Bailey A, Kuleshov MV, Clarke DJB, Evangelista JE, Jenkins SL, et al. Gene set knowledge discovery with Enrichr. Curr Protoc. 2021;1:e90. doi: 10.1002/cpz1.90. [DOI] [PMC free article] [PubMed] [Google Scholar]
- 18.Chen EY, Tan CM, Kou Y, Duan Q, Wang Z, Meirelles GV, et al. Enrichr: Interactive and collaborative HTML5 gene list enrichment analysis tool. BMC Bioinformatics. 2013;14:128. doi: 10.1186/1471-2105-14-128. [DOI] [PMC free article] [PubMed] [Google Scholar]
- 19.Fekete JT, Ősz Á, Pete I, Nagy GR, Vereczkey I, Győrffy B. Predictive biomarkers of platinum and taxane resistance using the transcriptomic data of 1816 ovarian cancer patients. Gynecol Oncol. 2020;156:654–61. doi: 10.1016/j.ygyno.2020.01.006. [DOI] [PubMed] [Google Scholar]
- 20.Fekete JT, Győrffy B. ROCplot.org: Validating predictive biomarkers of chemotherapy/hormonal therapy/anti-HER2 therapy using transcriptomic data of 3,104 breast cancer patients. Int J Cancer. 2019;145:3140–51. doi: 10.1002/ijc.32369. [DOI] [PubMed] [Google Scholar]
- 21.Lin G, Chai J, Yuan S, Mai C, Cai L, Murphy RW, et al. VennPainter: a tool for the comparison and identification of candidate genes based on Venn diagrams. PLoS One. 2016;11:e0154315. doi: 10.1371/journal.pone.0154315. [DOI] [PMC free article] [PubMed] [Google Scholar]
- 22.Lee HH, Bellat V, Law B. Chemotherapy induces adaptive drug resistance and metastatic potentials via phenotypic CXCR4-expressing cell state transition in ovarian cancer. PLoS One. 2017;12:e0171044. doi: 10.1371/journal.pone.0171044. [DOI] [PMC free article] [PubMed] [Google Scholar]
- 23.Harris AR, Esparza S, Azimi MS, Cornelison R, Azar FN, Llaneza DC, et al. Platinum chemotherapy induces lymphangiogenesis in cancerous and healthy tissues that can be prevented with adjuvant anti-VEGFR3 therapy. Front Oncol. 2022;12:801764. doi: 10.3389/fonc.2022.801764. [DOI] [PMC free article] [PubMed] [Google Scholar]
- 24.Volk-Draper L, Hall K, Griggs C, Rajput S, Kohio P, DeNardo D, et al. Paclitaxel therapy promotes breast cancer metastasis in a TLR4-dependent manner. Cancer Res. 2014;74:5421–34. doi: 10.1158/0008-5472.CAN-14-0067. [DOI] [PMC free article] [PubMed] [Google Scholar]
- 25.Volmer L, Koch A, Matovina S, Dannehl D, Weiss M, Welker G, et al. Neoadjuvant chemotherapy of patients with early breast cancer is associated with increased detection of disseminated tumor cells in the bone marrow. Cancers (Basel) 2022;14:635–48. doi: 10.3390/cancers14030635. [DOI] [PMC free article] [PubMed] [Google Scholar]
- 26.Zyl B, van, Tang D, Bowden NA. Biomarkers of platinum resistance in ovarian cancer: what can we use to improve treatment. Endocr Relat Cancer. 2018;25:303–18. doi: 10.1530/ERC-17-0336. [DOI] [PubMed] [Google Scholar]
- 27.Januchowski R, Sterzyńska K, Zawierucha P, Ruciński M, Świerczewska M, Partyka M, et al. Microarray-based detection and expression analysis of new genes associated with drug resistance in ovarian cancer cell lines. Oncotarget. 2017;8:49944–58. doi: 10.18632/oncotarget.18278. [DOI] [PMC free article] [PubMed] [Google Scholar]
- 28.Weidle UH, Birzele F, Kollmorgen G, Rueger R. Mechanisms and targets involved in dissemination of ovarian cancer. Cancer Genomics Proteom. 2016;13:407–23. doi: 10.21873/cgp.20004. [DOI] [PMC free article] [PubMed] [Google Scholar]
- 29.Ricci F, Brunelli L, Affatato R, Chilà R, Verza M, Indraccolo S, et al. Overcoming platinum-acquired resistance in ovarian cancer patient-derived xenografts. Ther Adv Med Oncol. 2019;11:1758835919839543. doi: 10.1177/1758835919839543. [DOI] [PMC free article] [PubMed] [Google Scholar]
- 30.Ye Q, Liu K, Shen Q, Li Q, Hao J, Han F, et al. Reversal of multidrug resistance in cancer by multi-functional flavonoids. Front Oncol. 2019;9:487–502. doi: 10.3389/fonc.2019.00487. [DOI] [PMC free article] [PubMed] [Google Scholar]
- 31.Hassan MK, Waly AA, Elsayed W, Keshk S, Allam WR, El-khamisy SF. Integrative microRNA and gene expression analysis identifies new epigenetically regulated microRNAs mediating taxane resistance in ovarian cancer. Sci Rep. 2021;11:562–78. doi: 10.1038/s41598-020-78596-5. [DOI] [PMC free article] [PubMed] [Google Scholar]
- 32.Szenajch J, Szabelska-Beręsewicz A, Świercz A, Zyprych-Walczak J, Siatkowski I, Góralski M, et al. Transcriptome remodeling in gradual development of inverse resistance between paclitaxel and cisplatin in ovarian cancer cells. Int J Mol Sci. 2020;21:9218–48. doi: 10.3390/ijms21239218. [DOI] [PMC free article] [PubMed] [Google Scholar]
- 33.Van Den Berg PR, Budnik B, Slavov N & Semrau S. Dynamic post-transcriptional regulation during embryonic stem cell differentiation. bioRxiv [Preprint] 2017. Available from: 10.1101/123497.
- 34.Vogel C, Marcotte EM. Insights into the regulation of protein abundance from proteomic and transcriptomic analyses. Nat Rev Genet. 2012;13:227–32. doi: 10.1038/nrg3185. [DOI] [PMC free article] [PubMed] [Google Scholar]
- 35.Jolly MK, Boareto M, Huang B, Jia D, Lu M, Onuchic JN, et al. Implications of the hybrid epithelial/mesenchymal phenotype in metastasis. Front Oncol. 2015;5:155–74. doi: 10.3389/fonc.2015.00155. [DOI] [PMC free article] [PubMed] [Google Scholar]
- 36.Pastushenko I, Blanpain C. EMT transition states during tumor progression and metastasis. Trends Cell Biol. 2019;29:212–26. doi: 10.1016/j.tcb.2018.12.001. [DOI] [PubMed] [Google Scholar]
- 37.Strauss R, Li ZY, Liu Y, Beyer I, Persson J, Sova P, et al. Analysis of epithelial and mesenchymal markers in ovarian cancer reveals phenotypic heterogeneity and plasticity. PLoS One. 2011;6:e16186. doi: 10.1371/journal.pone.0016186. [DOI] [PMC free article] [PubMed] [Google Scholar]
- 38.Alves CL, Elias D, Lyng MB, Bak M, Ditzel HJ. SNAI2 upregulation is associated with an aggressive phenotype in fulvestrant-resistant breast cancer cells and is an indicator of poor response to endocrine therapy in estrogen receptor-positive metastatic breast cancer. Breast Cancer Res. 2018;20:60–72. doi: 10.1186/s13058-018-0988-9. [DOI] [PMC free article] [PubMed] [Google Scholar]
- 39.Huang RYJ, Wong MK, Tan TZ, Kuay KT, Ng AHC, Chung VY, et al. An EMT spectrum defines an anoikis-resistant and spheroidogenic intermediate mesenchymal state that is sensitive to e-cadherin restoration by a src-kinase inhibitor, saracatinib (AZD0530) Cell Death Dis. 2013;4:e915. doi: 10.1038/cddis.2013.442. [DOI] [PMC free article] [PubMed] [Google Scholar]
- 40.Greaves M, Maley CC. Clonal evolution in cancer. Nature. 2012;481:306–13. doi: 10.1038/nature10762. [DOI] [PMC free article] [PubMed] [Google Scholar]
- 41.Schmit K, Michiels C. TMEM proteins in cancer: a review. Front Pharmacol. 2018;9:1345–58. doi: 10.3389/fphar.2018.01345. [DOI] [PMC free article] [PubMed] [Google Scholar]
- 42.Marx S, Dal Maso T, Chen JW, Bury M, Wouters J, Michiels C, et al. Transmembrane (TMEM) protein family members: poorly characterized even if essential for the metastatic process. Semin Cancer Biol. 2020;60:96–106. doi: 10.1016/j.semcancer.2019.08.018. [DOI] [PubMed] [Google Scholar]
- 43.Drougat L, Settas N, Ronchi CL, Bathon K, Calebiro D, Maria AG, et al. Genomic and sequence variants of protein kinase A regulatory subunit type 1β (PRKAR1B) in patients with adrenocortical disease and Cushing syndrome. Genet Med J Am Coll Med Genet. 2021;23:174–82. doi: 10.1038/s41436-020-00958-1. [DOI] [PMC free article] [PubMed] [Google Scholar]
- 44.Elsayed AM, Bayraktar E, Amero P, Salama SA, Abdelaziz AH, Ismail RS, et al. PRKAR1B-AS2 long noncoding RNA promotes tumorigenesis, survival, and chemoresistance via the PI3K/AKT/mTOR pathway. Int J Mol Sci. 2021;22:1–25. doi: 10.3390/ijms22041882. [DOI] [PMC free article] [PubMed] [Google Scholar]
- 45.Liu G, Ouyang X, Gong L, Yao L, Liu S, Li J, et al. E2F3 promotes liver cancer progression under the regulation of circ-PRKAR1B. Mol Ther Nucleic Acids. 2021;26:104–13. doi: 10.1016/j.omtn.2021.07.002. [DOI] [PMC free article] [PubMed] [Google Scholar]
- 46.Cui Y, Yang S, Fu X, Feng J, Xu S, Ying G. High levels of KAP1 expression are associated with aggressive clinical features in ovarian cancer. Int J Mol Sci. 2015;16:363–77. doi: 10.3390/ijms16010363. [DOI] [PMC free article] [PubMed] [Google Scholar]
- 47.Hu M, Fu X, Cui Y, Xu S, Xu Y, Dong Q, et al. Expression of KAP1 in epithelial ovarian cancer and its correlation with drug-resistance. Int J Clin Exp Med. 2015;8:17308–20. [PMC free article] [PubMed] [Google Scholar]
- 48.Li B, Dou SX, Yuan JW, Liu YR, Li W, Ye F, et al. Intracellular transport is accelerated in early apoptotic cells. Proc Natl Acad Sci USA. 2018;115:12118–23. doi: 10.1073/pnas.1810017115. [DOI] [PMC free article] [PubMed] [Google Scholar]
- 49.Manders DB, Kishore HA, Gazdar AF, Keller PW, Tsunezumi J, Yanagisawa H, et al. Dysregulation of fibulin-5 and matrix metalloproteases in epithelial ovarian cancer. Oncotarget. 2018;9:14251–67. doi: 10.18632/oncotarget.24484. [DOI] [PMC free article] [PubMed] [Google Scholar]
- 50.Li R, Wu H, Jiang H, Wang Q, Dou Z, Ma H, et al. FBLN5 is targeted by microRNA-27a-3p and suppresses tumorigenesis and progression in high-grade serous ovarian carcinoma. Oncol Rep. 2020;44:2143–51. doi: 10.3892/or.2020.7749. [DOI] [PMC free article] [PubMed] [Google Scholar]
- 51.Chuang HW, Hsia KT, Liao J, Bin, Yeh CC, Kuo WT, et al. Serpine2 overexpression is associated with poor prognosis of urothelial carcinoma. Diagnostics. 2021;11:1928–39. doi: 10.3390/diagnostics11101928. [DOI] [PMC free article] [PubMed] [Google Scholar]
- 52.Mao M, Wang W. SerpinE2 promotes multiple cell proliferation and drug resistance in osteosarcoma. Mol Med Rep. 2016;14:881–7. doi: 10.3892/mmr.2016.5316. [DOI] [PubMed] [Google Scholar]
- 53.Yang Y, Xin X, Fu X, Xu D. Expression pattern of human SERPINE2 in a variety of human tumors. Oncol Lett. 2018;15:4523–30. doi: 10.3892/ol.2018.7819. [DOI] [PMC free article] [PubMed] [Google Scholar]
- 54.Møller HD, Ralfkjær U, Cremers N, Frankel M, Pedersen RT, Klingelhöfer J, et al. Role of fibulin-5 in metastatic organ colonization. Mol Cancer Res MCR. 2011;9:553–63. doi: 10.1158/1541-7786.MCR-11-0093. [DOI] [PubMed] [Google Scholar]
- 55.Albig AR, Schiemann WP. Fibulin-5 function during tumorigenesis. Futur Oncol. 2005;1:23–35. doi: 10.1517/14796694.1.1.23. [DOI] [PubMed] [Google Scholar]
- 56.Lin N, Sato T, Ito A. Triptolide, a novel diterpenoid triepoxide from Tripterygium wilfordii Hook. f., suppresses the production and gene expression of pro-matrix metalloproteinases 1 and 3 and augments those of tissue inhibitors of metalloproteinases 1 and 2 in human synovial. Arthritis Rheum. 2001;44:2193–2200. doi: 10.1002/1529-0131(200109)44:9<2193::AID-ART373>3.0.CO;2-5. [DOI] [PubMed] [Google Scholar]
- 57.Vispé S, DeVries L, Créancier L, Besse J, Bréand S, Hobson DJ, et al. Triptolide is an inhibitor of RNA polymerase I and II-dependent transcription leading predominantly to down-regulation of short-lived mRNA. Mol Cancer Ther. 2009;8:2780–90. doi: 10.1158/1535-7163.MCT-09-0549. [DOI] [PubMed] [Google Scholar]
- 58.Liu J, Zhang L, Zhang X, Xing X. Rapamycin enhanced the antitumor efficacy of oxaliplatin in cisplatin-resistant ovarian cancer cells A2780cis both in vitro and in vivo. J Chemother. 2015;27:358–64. doi: 10.1179/1973947815Y.0000000021. [DOI] [PubMed] [Google Scholar]
- 59.Guo Q, Nan XX, Yang JR, Yi L, Liang BL, Wei YB, et al. Triptolide inhibits the multidrug resistance in prostate cancer cells via the downregulation of MDR1 expression. Neoplasma. 2013;60:598–604. doi: 10.4149/neo_2013_077. [DOI] [PubMed] [Google Scholar]
- 60.Schlosshauer PW, Li W, Lin KT, Chan JLK, Wang LH. Rapamycin by itself and additively in combination with carboplatin inhibits the growth of ovarian cancer cells. Gynecol Oncol. 2009;114:516–22. doi: 10.1016/j.ygyno.2009.06.002. [DOI] [PMC free article] [PubMed] [Google Scholar]
- 61.Zhong Y, Le F, Cheng J, Luo C, Zhang X, Wu X, et al. Triptolide inhibits JAK2/STAT3 signaling and induces lethal autophagy through ROS generation in cisplatin-resistant SKOV3/DDP ovarian cancer cells. Oncol Rep. 2021;45:1–10. doi: 10.3892/or.2021.8020. [DOI] [PMC free article] [PubMed] [Google Scholar]
- 62.Le F, Yang L, Han Y, Zhong Y, Zhan F, Feng Y, et al. TPL inhibits the invasion and migration of drug-resistant ovarian cancer by targeting the PI3K/AKT/NF-κB-signaling pathway to inhibit the polarization of M2 TAMs. Front Oncol. 2021;11:704001. doi: 10.3389/fonc.2021.704001. [DOI] [PMC free article] [PubMed] [Google Scholar]
- 63.Wang R, Ma X, Su S, Liu Y. Triptolide antagonized the cisplatin resistance in human ovarian cancer cell line A2780/CP70 via hsa-mir-6751. Future Med Chem. 2018;10:1947–55. doi: 10.4155/fmc-2018-0108. [DOI] [PubMed] [Google Scholar]
- 64.Zhong YY, Chen HP, Tan BZ, Yu HH, Huang XS. Triptolide avoids cisplatin resistance and induces apoptosis via the reactive oxygen species/nuclear factor-κB pathway in SKOV3PT platinum-resistant human ovarian cancer cells. Oncol Lett. 2013;6:1084–92. doi: 10.3892/ol.2013.1524. [DOI] [PMC free article] [PubMed] [Google Scholar]
- 65.Tian Y, Li P, Xiao Z, Zhou J, Xue X, Jiang N, et al. Triptolide inhibits epithelial-mesenchymal transition phenotype through the p70S6k/GSK3/β-catenin signaling pathway in taxol-resistant human lung adenocarcinoma. Genet Med. 2021;10:1007–19. doi: 10.21037/tlcr-21-145. [DOI] [PMC free article] [PubMed] [Google Scholar]
- 66.Huang G, Hu H, Zhang Y, Zhu Y, Liu J, Tan B, et al. Triptolide sensitizes cisplatin-resistant human epithelial ovarian cancer by inhibiting the phosphorylation of AKT. J Cancer. 2019;10:3012–20. doi: 10.7150/jca.30669. [DOI] [PMC free article] [PubMed] [Google Scholar]
- 67.Liu R, Chen Y, Liu G, Li C, Song Y, Cao Z, et al. PI3K/AKT pathway as a key link modulates the multidrug resistance of cancers. Cell Death Dis. 2020;11:1–12. doi: 10.1038/s41419-020-02998-6. [DOI] [PMC free article] [PubMed] [Google Scholar]
- 68.Huang X, Li Z, Zhang Q, Wang W, Li B, Wang L, et al. Circular RNA AKT3 upregulates PIK3R1 to enhance cisplatin resistance in gastric cancer via miR-198 suppression. Mol Cancer. 2019;18:1–20. doi: 10.1186/s12943-019-0969-3. [DOI] [PMC free article] [PubMed] [Google Scholar]
Associated Data
This section collects any data citations, data availability statements, or supplementary materials included in this article.
Supplementary Materials
Data Availability Statement
All data supporting the findings of this study are included within the article and its Supplementary Information files (and Reporting summary). Also, the data will be shared upon reasonable request to the corresponding author from colleagues who want to analyse in deep our findings.