

Abstract
Autism spectrum disorders (ASD) is a neurodevelopmental disorder that causes repetitive stereotyped behavior and social difficulties, early diagnosis and intervention are beneficial to improve treatment effect. Although multi-site data expand sample size, they suffer from inter-site heterogeneitys, which degrades the performance of identitying ASD from normal controls (NC). To solve the problem, in this paper a multi-view ensemble learning network based on deep learning is proposed to improve the classification performance with multi-site functional MRI (fMRI). Specifically, the LSTM-Conv model was firstly proposed to obtain dynamic spatiotemporal features of the mean time series of fMRI data; then the low/high-level brain functional connectivity features of the brain functional network were extracted by principal component analysis algorithm and a 3-layer stacked denoising autoencoder; finally, feature selection and ensemble learning were carried out for the above three brain functional features, and a classification accuracy of 72% was obtained on multi-site data of ABIDE dataset. The experimental result illustrates that the proposed method can effectively improve the classification performance of ASD and NC. Compared with single-view learning, multi-view ensemble learning can mine various brain functional features of fMRI data from different perspectives and alleviate the problems caused by data heterogeneity. In addition, this study also employed leave-one-out cross validation to test the single-site data, and the results showed that the proposed method has strong generalization capability, in which the highest classification accuracy of 92.9% was obtained at the CMU site.
Keywords: fMRI, Autism, LSTM, Autoencoder, Ensemble learning
Introduction
Autism spectrum disorders (ASD) is a psychological and neurodevelopmental disorder characterized by social alienation, poor communication skills, narrow range of interests and repetitive stereotypical behaviors Disorder American Psychiatric Association Autism Spectrum (2013). In the past 50 years, ASD has gone from a narrowly defined, rare disorder of childhood onset to a well publicised, advocated, and researched lifelong condition, recognised as fairly common and very heterogeneous (Tiffany Kodak and Samantha Bergmann 2020). At present, the clear etiology and pathogenesis of ASD have not been investigated nationally or internationally, and in the past, the diagnosis of ASD could only be performed by assessing the outward clinical manifestations of ASD, which is a time-consuming way of screening and monitoring, and the assessment results may also be influenced by the subjective factors (Rahman et al. 2020). Accurate diagnosis and early intervention care for patients with ASD would be beneficial to improve overall treatment effect (Yang and Gui 2020; Liu et al. 2020b).
In recent years, with the rapid development of machine learning, many impressive results have been achieved in computer-aided diagnosis techniques. At present, many researches combine machine learning algorithm and various kinds of neuroimaging technique to diagnose ASD intelligently. fMRI (functional MRI) is the most commonly used neuroimaging technique to diagnose ASD, which can be used to observe neural activity in the brain by reconstructing 3D MRI brain images at multiple time points for observing changes of blood oxygen levels in different regions of interest (ROI) (Khan et al. 2020).Currently, ASD intelligent diagnosis research mainly uses raw 4D fMRI image data, ROI mean time series and brain functional connectivity (BFC) as the input data of machine learning models. Among them, BFC-based analysis has received increasing attention due to its computational simplicity and strong interpretability, and some studies have found interpretable markers from the BFC for differentiating ASD from normal controls (NC) (Muller et al. 2011; Kazeminejad and Sotero 2019; Guo et al. 2017). The most commonly used method for generating BFC is to use Pearson correlation coefficient (PCC) to measure the closeness of functional associations between ROIs. Several studies have utilized PCC-based BFC for intelligent diagnosis of ASD, for example, Hailong et al. (2018) proposed a deep transfer learning neural network (DTL-NN) framework to classify ASD and NC using the BFC data of four sites in the ABIDE dataset, and the highest accuracy of 70.4% was obtained in USM site. Different from Li et al. using deep learning models to learn important features, Wang et al. (2019) proposed a support vector machine recursive feature elimination (SVM-RFECV) feature selection algorithm to extract the most discriminative features from functional connectivity directly, and obtained the highest accuracy of 95.6% on the data of single-site. Huang et al. (2020) used sparse representation model to reconstruct BFC and proposed a multi-template multi-centre ensemble classification method for automatic diagnosis of ASD. The complete dataset on the ABIDE website consists of the data from 17 international sites, different sites use different scanners, scanner parameters and physicians, which enhances the heterogeneity of the fMRI data. The studies above based on single-site data of ASD obtained high classification accuracy, however, it is still challenging to distinguish ASD patients from NC in the presence of strong data heterogeneity. The actual clinical application also faces the problem of data heterogeneity. In order to align with the clinic, some studies have attempted to classify ASD and NC using the multi-site data of ABIDE dataset. For example, to model inter-site heterogeneity within each category, Wang et al. (2022) used similarity-driven multi-view linear reorganization to restructure significant data heterogeneity caused by study populations across different scanners or multiple sites. Abraham et al. (2016) used multiple brain atlases to estimate ROI, then extracted ROI mean time series to construct BFC and finally used SVM for classification. Heinsfeld et al. (2018) used stacked autoencoders (SAE) to learn hidden features of BFC. Wang et al. (2020) further proposed using stacked denoising autoencoders (SDAE) as a pre-trained model to extract brain functional features. SDAE adds random noise to the input data, which helps to enhance the robustness of the model. Dvornek et al. (2017) attempted to extract brain functional change features directly from the original time series, and first proposed to use LSTM (long short term memory) to classify ASD and NC, and obtained a classification accuracy of 68.5% on the ABIDE dataset. Further, the authors added phenotypic data to the training of the LSTM network in different forms, and the accuracy was improved by 1.6% (Dvornek et al. 2018). It is clear that LSTM can learn features directly from the fMRI time series that facilitate the distinction between ASD and NC.
In this paper, we propose a multi-view ensemble learning network for identifying ASD and NC using fMRI data. We first downloaded all ROI mean time series from the ABIDE website and removed the subjects with missing data. Then a time series dataset and a functional connected dataset were constructed using time series. Three different feature representations were then extracted from three perspectives based on these two datasets. Specifically, we proposed the LSTM-Conv model for extracting dynamic spatiotemporal features of the ROI mean time series, and then principal component analysis (PCA) and SDAE model were used to learn the low/high-level functional connectivity features respectively. Finally the above three brain functional features were used for feature selection and ensemble learning, and the classification performance was assessed using the main voting results of the predicted labels. Based on the data processed by AAL and cc200 brain template, the multi-view ensemble learning network obtained 70.2% and 72% classification accuracy respectively. The proposed method obtains the most discriminative features from different perspectives for ensemble learning, which can lead to more robust results. To validate the generalization capability of the method, we also used the leave-one-out method to classify the single-site data, where the highest classification accuracy of 92.9% was obtained at the CMU site.
This paper is organized next as follows: Section II introduces the acquisition of dataset and the experimental framework. Section III presents the experimental setup and the experimental results. Section IV discusses the influencing factors and details of the experiment. Section V summarizes the work of this study.
Method and materials
Data set
Data sources
The experimental data used in this study were obtained from the publicly available ABIDE I (Autism Brain Imaging Data Exchange) dataset (Di Martino et al. 2014; Craddock et al. 2013). This dataset brings together structural and functional MRI imaging data collected from 17 international sites , related phenotypic information such as age, gender, and ASD diagnostic observation scores of subjects for scientific studies (Lord et al. 2000). Each site uses different scanner parameters and protocols, but all uses resting-state blood-oxygen level dependent fMRI (BOLD-fMRI) as the imaging scheme. The download, storage and processing of resting-state fMRI data are computationally expensive. The original ABIDE dataset contained a total of 1112 subjects, including 529 ASD subjects and 573 normal subjects, however, the time series of some subjects is incomplete, so the experiment excluded those subjects with data missing. The demographic information related to the dataset based on the AAL template and the cc200 template is shown in Table 1.
Table 1.
Demographic information related to the ABIDE dataset
| Item | Template | ASD | NC |
|---|---|---|---|
| Age | AAL | 16.96 ± 8.45 | 16.92 ± 7.47 |
| cc200 | 16.74 ± 8.22 | 16.76 ± 7.33 | |
| Gender (f/m) | AAL | 59/418 | 95/411 |
| cc200 | 58/410 | 91/404 | |
| Number | AAL | 477 | 506 |
| cc200 | 468 | 495 |
Data pre-processing
In this study, the ROI mean time series of fMRI images were used as experimental data, which were preprocessed by the Configuration Pipeline for the Analysis of Connectome (CPAC) of the PCP (Preprocessed Connectomes Project). CPAC consists of open-source tools, and the pre-processing steps for obtaining the ROI mean time series are divided into the following steps: the fMRI brain images are first processed in the following 4 steps: 1. Slice time correction using AFNI’s 3dTshift; 2. Motion correct to the average image using AFNI’s 3dvolreg (two iterations); 3. Skull-strip using AFNI’s 3dAutomask; 4. Global mean intensity normalization to 10,000. Interference regression was then performed to remove signal fluctuations caused by head motion, respiration, heart beat and scanner drift. Next, the fMRI images were aligned to the structural images using the BBreg tool of the FSL software, and then the aligned images were normalized to standard MNI (Montreal Neurological Institute) space using the nonlinear alignment method of the AFNI software. Finally, the brain was segmented into multiple distinct ROIs with different functions using the brain partition template, and the corresponding mean time series for each ROI was extracted. In this study, we selected ROI mean time series data preprocessed by AAL and CC200 brain partition template. AAL template is divided into 116 ROIs, but the experiment will exclude data from 26 ROIs located in the cerebellum, and the cc200 template is divided into 200 ROIs.
Dataset creation
This study aimed to find hidden brain functional features from the raw ROI mean time series and brain functional connectivity for classification, so time series dataset and functional connectivity dataset were created. The data for each subject in the time series dataset were ROI mean time series. In addition, to obtain more training data, we augmented the ROI mean time series for each subject. Specifically, we used a fixed-length window to intercept the time series, so that each subject could obtain 10 time series matrices. Figure 1a shows the process of window interception for the original time series, let the window length be L and the total length of the time series be N, then the distance of the window shift is (N-L)/10. The window lengths of the time series based on the AAL and cc200 templates are set to 90 and 100, respectively. Since the scanners and scanning parameters used at each data collection site are different, N is set according to different sites.
Fig. 1.
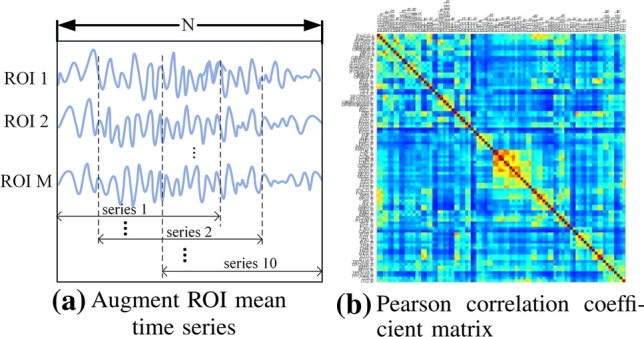
ROI mean time series and brain functional connectivity data for one of the subjects
In the functional connectivity dataset, the data of each subject are Pearson correlation coefficient(PCC) matrix, as shown in Fig. 1b. It can be seen that the matrix is symmetric, to reduce unnecessary redundancy, the experiment only took the upper triangular data of the matrix and flattened them into a one-dimensional vector to construct the dataset. The PCC indicates the degree of correlation between two time series, which corresponds to the degree of interaction between two brain regions in the brain, and its calculation formula is shown in Equation (1), where, and denote the ith value of two time series, respectively, and denotes the mean value of two time series, respectively. Values of r range from − 1 to 1, and when , it means that the time series of two ROI are positively correlated, and the larger the value, the stronger the positive correlation. At this time, the BOLD signal intensities of the two time series weaken or strengthen simultaneously with time. Conversely, when , the two time series are negatively correlated, and the smaller the value, the stronger the negative correlation. At this time, the BOLD signal intensities of the two time series change toward the opposite trend with time. When r is 0, it means that the two time series are independent of each other.
| 1 |
Multi-view ensemble learning network
Network framework
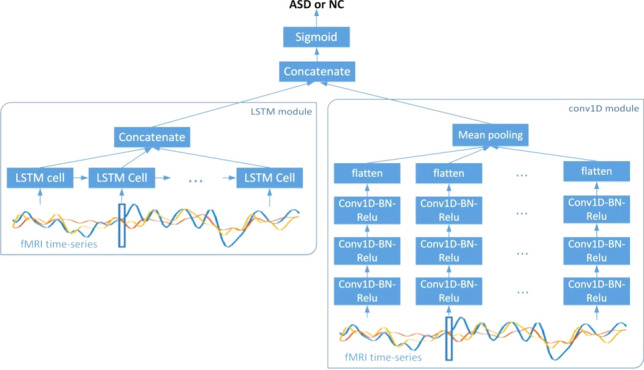
The stronger heterogeneity of the ABIDE dataset, although more in line with the actual clinical application environment, will pose a great challenge to data analysis. Based on this, this study proposes a multi-view ensemble learning framework to classify ASD and NC, and the network framework is shown in Fig. 2. The pre-trained LSTM-Conv (Long Short Time Memory-Convolution) model and SDAE model in the figure have fitted to the training set of time series dataset and functional connectivity dataset, respectively.
Fig. 2.

Total network framework, for each time series, the dimensionality of the features extracted from the LSTM-Conv model is 1600, and for each subject, the dimensionality of the features extracted from the SDAE model is 625
The network framework was divided into 3 major modules to analyze the differences in brain function between ASD and NC from 3 perspectives. Based on the characteristics of the ROI mean time series, in the first module, the spatiotemporal features of ROI mean time series are extracted using the pre-trained LSTM-Conv model. Since each subject has 10 augmented time series, the LSTM-Conv model can extract 10 one-dimensional feature matrices for each subject, and these 10 feature matrices are concatenated as a dynamic spatiotemporal feature representation of each subject. In the second module, PCA is performed to reduce dimension of PCC-based functional connectivity data. PCA can recombine the functional connectivity data while removing redundant connection, and the recombined data are represented as low-level functional connectivity features.In the third module, more abstract high-level functional connectivity features are extracted from the PCC-based functional connectivity data using the pre-trained SDAE model. The three features extracted from the above three modules are respectively used to execute the LASSO feature selection algorithm to select the more discriminative brain functional features. Then, the three selected features are respectively used for classification,and therefore three prediction labels will be generated for each subject.The main voting results of these 3 labels are used to evaluate the classification performance of the whole network.The proposed method mines the dynamic spatiotemporal features, low/high-level functional connectivity features of ASD and NC from 3 perspectives, and fuses these features in an ensemble learning manner to alleviate the limitations of single perspective analysis.
Long Short Term Memory-Convolution model
Since the ROI mean time series of fMRI images imply complex interactions between ROIs, this study employs a deep learning model dealing with time series to learn the association between different time series. In recent years, LSTM has achieved great success in processing time series. It uses three gate structures of forget gate, input gate and output gate to control the information needed to be remembered and forgotten, which can not only alleviate the problem that the original RNN is prone to gradient explosion and disappearance, but also enable the model to process long-term dependent data and alleviate the semantic fault caused by the short-term memory of original RNN. In the related study, Dvornek et al. (2017) first proposed to use LSTM to learn features of ROI mean time series and achieved good classification performance on the ABIDE multi-site dataset. Besides LSTM, Temporal Convolutional Net-works (TCN) has also been proved to be an effective model for classifying time series (Wang et al. 2017). Karim et al. (2017) combined LSTM and TCN to classify 85 different types of time series datasets in UCR (Chen et al. 2015). Inspired by this, this study proposes LSTM-Conv model to extract dynamic spatiotemporal features from ROI mean time series, and its network structure is shown in Fig. 3.
Fig. 3.
LSTM-Conv model, consisting of two parts, LSTM and Conv1D. The Conv1D module consists of three convolutional block, a flatten layer and a mean pooling layer, each convolutional block contains the operations of 1D convolution, batch normalization and nonlinear activation. Meanwhile, the LSTM module learns the BOLD signal variations and potential associations of different ROIs between each time point and fuses the features extracted at each time point. Finally, a sigmoid classifier is used to classify the spatiotemporal features fused by the two modules
The LSTM-Conv model consists of two modules, LSTM and Conv1D, where the Conv1D module consists of three convolutional block, a flatten layer and a mean pooling layer, each convolutional block contains the operations of 1D convolution, batch normalization and nonlinear activation. The Conv1D module uses a time-sharing training method to simultaneously learn spatial features at multiple time points and integrate these features using mean pooling. Meanwhile, the LSTM module learns the BOLD signal variations and potential associations of different ROIs between each time point and fuses the features extracted at each time point. In order to make the LSTM-Conv model learn the distinguishing features between ASD and NC, a sigmoid classifier is used to classify the spatiotemporal features fused by the two modules. LSTM-Conv model can learn the intricate association pattern between ROIs from the multivariate time series data. The training set data of the time series dataset is used to train the LSTM-Conv model in this paper, and the pre-trained model is used as a feature extractor to extract dynamic spatiotemporal features of ROI mean time series.
The relevant parameters of the LSTM-Conv model are as follows: the output dimension of the hidden layer of the LSTM module is 8, the size of the convolutional kernels used for the three one-dimensional convolutions in the Conv1D module are 8, 5, and 3, and the numbers are 64, 128, and 64, respectively, and the step size of all convolutional kernels is 2. For the cc200 dataset, the input ROI mean time series dimension is 100*200, where 100 is the number of time points and 200 is the number of ROIs. Correspondingly, for the AAL dataset, the input dimension is 90–90.
Stacked Denoising Autoencoder
The analytical approach of constructing brain functional connectivity using PCC is easy to understand and effective, but it is limited to find brain differences only from PCC-based functional connectivity. It would be useful to find more significant differences between ASD and NC if we can further explore the more abstract functional connectivity patterns underlying such functional connectivity.
In this study, the SDAE model is used to learn the PCC-based functional connectivity data, which encodes and decodes noisy input data with the goal of restoring the decoded output to the original unnoised data as closely as possible (Vincent et al. 2010). Adding noise to the input data can make the model can extract more robust features against the missing or contaminated original data, which is more suitable for practical application scenarios. The specific training process of the 3-layer SDAE model is shown in Fig. 4, where the first single-layer AE is first trained with the noisy training set data, then the noise is added to the output of hidden layer and the corrupted code representation is used as the input of the second AE for training, the noise is added to the output of hidden layer of the second AE and the corrupted code representation is used as the input of the third AE for training. For the classification task, the coders of these single-layer AEs can be stacked together and connected with a softmax classifier to form a deep neural network(DNN), and then the DNN can be finetuned from scratch using the training set data to update the weights of network. Wang et al. (2020) directly performed feature extraction and classification using the 3-layer SDAE model for functional connectivity data, however, the final classification accuracy reported by the authors was based on the entire dataset. To enable SDAE to generate more unbiased classification results, based on the model strcuture in Fig. 4, we use the training set data to train SDAE model and ulitize the pre-trained model to extract high-level functional connectivity features of the training and test set.
Fig. 4.

Network structure of SDAE. The left figure shows the training process of 3 denoising autoencoders, and the right figure shows the fine-tuning process of DNN. The denoising autoencoder consists of 2 parts, the first part is the encoder, which calculates the input data through the hidden layer to obtain the encoded representation of the input data, where , the second part is the decoder, which attempts to restore the encoded representation to the original input data, where and g(g) represent activation functions. The process of two-part linkage learning is similar to the fully connected neural network, but the difference is that the SDAE model adopts unsupervised learning mode, and the error is calculated from the reconstructed data and the original input data . The model adds noise to the input data by setting some value of the input node to 0 according to binomial distributions
The relevant training parameters of the SDAE model are consistent with Wang et al: number of AEs: 3; proportion of data corruption of each AE: 0.3, 0.1 and 0.1; the number of nodes in the hidden layer: 2500, 1250 and 625, respectively.
experiments
Experimental configuration
We used the proposed network framework to conduct stratified 5-fold cross validation experiments on the time series dataset and functional connectivity dataset, the dataset was divided into five unduplicated parts according to the proportion of ASD and NC, four of which were used for training and the remaining one for testing. To reduce the contingency of the experimental results, we repeated the experiment for 4 times, and finally took the average value of each fold as the final result. To investigate the effect of preprocessing templates on the experimental results, we conducted experiments on the data based on AAL and cc200 brain partitioning templates, respectively. In addition, to further test the robustness and generalization of the proposed method, the experiments were conducted using the leave-one-out method to predict the data from different sites. The leave-one-out method in this paper uses the data in one site for testing, the data in the remaining sites for training, and then all the single-site data are tested in turn.
The experimental configurations and relevant parameters of the LSTM-Conv model and SDAE model in the experimental framework are as follows:
When training the LSTM-Conv model, the optimizer adopts Adam, learning rate, batch size and number of iterations are set to 0.0001, 32 and 20 respectively. When training the three autoencoders of the SDAE model, the batch gradient descent method is adopted to optimize, learning rate and batch size are set to 0.0001 and 100 respectively. In the DNN fine-tuning phase, the optimizer adpots Momentum, the learning rate, batch size and number of iterations are set to 0.0005, 50 and 200. To alleviate the overfitting phenomenon, a dropout layer with a drop rate of 0.5 is added behind each DNN layer.
Evaluation metric
To evaluate the classification performance of multi-view ensemble learing network, the accuracy (acc), f1 score and area under the receiver operating characteristic curve (auc) were used as metrics in the experiment, where the f1 score is the harmonic average of precision and recall, the calculation formulas are shown in Eqs. (2)–(5), where TP and TN denote the number of positive cases predicted to be positive and negative cases predicted to be negative, respectively, and FP and FN denote the number of negative cases predicted to be positive and positive cases predicted to be negative.
| 2 |
| 3 |
| 4 |
| 5 |
Experimental results
The classification evaluation metric of the model was calculated by the main voting results of the prediction labels of the three branches shown in Fig. 2. Due to the experimental method of 5-fold cross validation, the mean value of each evaluation metric in the five experiments is taken as the final classification result in this study. Table 2 shows the classification accuracy results of single-view learning and multi-view ensemble learning based on AAL and cc200 dataset.
Table 2.
Classification accuracy results of single-view learning and multi-view ensemble learning based on different brain templates
| Dataset | LSTM-Conv | PCA | SDAE | Ensemble learning |
|---|---|---|---|---|
| AAL | 65.2 | 68.8 | 68.2 | 70.2 |
| cc200 | 67.4 | 69.9 | 71.2 | 72.0 |
On the one hand, it can be seen from the table that whether AAL dataset or cc200 dataset, the accuracy of high-level brain connectivity features extracted from sdae model for SVM classification is comparable to that extracted from PCA, which shows that the different functional connectivity patterns expressed from the two perspectives are beneficial to distinguish between ASD and NC. When the above two features and the dynamic spatiotemporal features extracted from the LSTM-Conv model are used for ensemble learning, higher classification accuracy is obtained. Figure 5 shows the classification results of single-view learning and multi-view ensemble learning in each experiment of 5-fold cross validation. It can be seen that although multi-view ensemble learning does not achieve the best classification accuracy in each experiment, it performs better on the whole. The above analysis indicates that the multi-view ensemble learning is more beneficial to learn more differences in brain functions between ASD and NC.
Fig. 5.
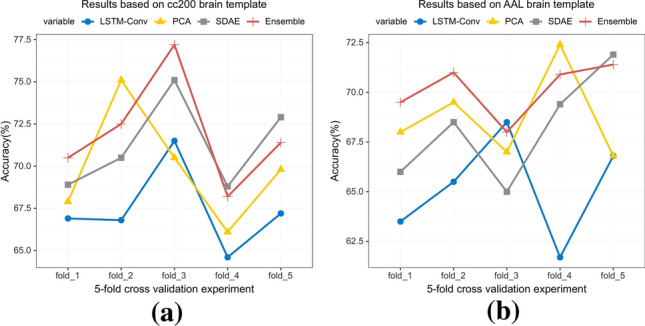
The classification accuracy results of single-view learning and multi-view ensemble learning in 5-fold cross validation. Each experiment was carried out 4 times and the results of each experiment were averaged after 4 times. The results in a and b arebased on cc200 and AAL dataset, respectively
On the other hand, the classification results of SVM in Tables 2 and 3 illustrate that the classification performance of the method based on cc200 dataset outperforms that of the method based on AAL dataset in both single-view learning and in multi-view ensemble learning. In recent years, an increasing number of studies have focused on data based on cc200 brain template (Vincent et al. 2010; Heinsfeld et al. 2018; Liu et al. 2020a). Some studies also use multiple brain partition templates for data preprocessing or data analysis. For complex diseases like ASD, more detailed brain partition is more beneficial to find the most discriminative fine-grained features and improve the classification performance. It can also be seen from Fig. 5 that the experimental results based on cc200 dataset are better than AAL dataset on the whole. In addition, for the data preprocessed by different brain templates, the classifier has different responses to the features extracted from different views. In Fig. 5a, based on data preprocessed by cc200 template, the classifier is more sensitive to features extracted by SDAE model. In Fig. 5b, the classifier is more sensitive to the features extracted by PCA based on the data preprocessed by AAL template.
Table 3.
Comparison results of experiments using different classifiers
| Classifier | AAL | cc200 |
|---|---|---|
| Linear SVM (%) | ||
| acc | 70.2 | 72.0 |
| f1 | 69.2 | 68.8 |
| auc | 71.5 | 69.8 |
| LDA (%) | ||
| acc | 68.4 | 71.4 |
| f1 | 69.5 | 71.4 |
| auc | 70.9 | 72.4 |
| KNN (%) | ||
| acc | 66.5 | 69.1 |
| f1 | 64.8 | 70.7 |
| auc | 68.0 | 71.9 |
| RF (%) | ||
| acc | 67.4 | 68.6 |
| f1 | 67.4 | 67.8 |
| auc | 69.4 | 70.4 |
Discussion
Evaluation of the separability of features from different perspectives
In this study, a multi-view ensemble learning network was used to mine the brain functional features under different perspectives. In order to investigate the separability of features under different perspectives, the brain functional features of ASD and NC in the test set were extracted from the LSTM-Conv, PCA and SDAE model for visualization, respectively, and the results are shown in Fig. 6. It can be seen that the separability of brain functional features from different perspectives is comparable, indicating that the features extracted from the above three models can roughly distinguish ASD from NC.
Fig. 6.

Feature cluster diagrams of different features. a features extracted from LSTM-Conv model; b features extracted from PCA model; c features extracted from SDAE model
However, in Fig. 6, the boundary that distinguishes the two types of features is not obvious, and there are some features of ASD and NC that cannot be easily distinguished from each other, which indicates that using features from single perspective for classifying ASD and NC has some limitations, especially for the case of strong data heterogeneity. For this reason, this study proposes the multi-view ensemble learning network to integrate the feature extraction ability of different models, so that the network can simultaneously learn the functional brain features under different views, so as to obtain better classification performance.
Evaluation of ensemble learning effect of different classifiers
In addition to using SVM as the classifier, this study also tested the ability of other classifiers to distinguish between ASD and NC features, and experimented with default parameters.In Table 3, we used the form of data to evaluate two different brain templates with 4 different classifiers. From the evaluation results, the values of all evaluation results of SVM are between 68.8 and 72.0, and the values of all evaluation results of LDA are between 68.4 and 72.4, the values of all evaluation results of KNN are between 64.8 and 71.9, and the values of all evaluation results of RF are between 67.4 and 70.4. It can be seen that SVM is the one with the most stable performance and relatively high evaluation value among the two brain templates.
Figure 7 shows the ROC curves formed by the classification results of different classifiers for different single-view features, in which the horizontal and vertical coordinates are the false positive rate and the true positive rate, respectively, and the area under the curve can be used as an indicator to evaluate the performance of the classifier. From the figure, we have adopted the form of visualization to evaluate three different modules with 4 different classifiers. From the evaluation results, only the area under the curve of the SVM reached above 0.74 in all three modules, while the area under the curve of the other three classifiers reached above 0.7 in only one of the three modules at most. In summary, the two nonlinear classifiers, Random Forest (RF) and K-Nearest Neighbors (KNN), have relatively poor classification performance, while the linear SVM classifier has obtained relatively optimal classification performance, followed by Principal Component Analysis (LDA). SVM classifier often plays an important role in intelligent medical image analysis, so this study also uses SVM classifier for evaluating the proposed method.
Fig. 7.

ROC plots of different classifiers based on cc200 template, a–d for SVM, LDA, KNN and RF classifiers, respectively
Evaluation of the generalization performance of the proposed method
In order to verify the robustness and generalization of the proposed method, based on the cc200 dataset, the leave-one-out cross validation was carries out for the ABIDE multi-site data (Abraham et al. 2016; Heinsfeld et al. 2018). The results are shown in Table 4, which also shows the number of subjects at each site. In the leave-one-out method, the data of one site is used for testing and the data of the remaining sites is used for training, so that the trained model does not see the data of the sites used for testing. According to the results in the table, it can be seen that the experiment obtained the highest classification accuracy of 92.9% in the CMU site and only 61.5% in the MAXMUN site, the average accuracy of all sites was about 75.1%, and the classification accuracy of most sites was between 70 and 80%. On the one hand, the large difference of classification results indicates the high heterogeneity of the data among sites. On the other hand, for several sites with large sample size, such as UM and NYU, good classification results can still be obtained, illustrating that the proposed method has the ability to extract the discriminative brain functional features of ASD and NC, and this ability can be effectively generalized to the data from the new site.
Table 4.
Experiment results of each site with the leave-one-out cross validation method
| Site | Size | acc (%) | f1 (%) | auc (%) |
|---|---|---|---|---|
| CAL | 21 | 71.4 | 57.1 | 67.9 |
| CMU | 14 | 92.9 | 90.9 | 94.4 |
| KKI | 48 | 75.0 | 73.9 | 75.9 |
| LEUVEN | 61 | 72.1 | 65.3 | 74.1 |
| MAXMUN | 52 | 61.5 | 58.3 | 61.3 |
| OLIN | 34 | 73.5 | 76.9 | 73.2 |
| PITT | 55 | 74.5 | 73.0 | 75.7 |
| SBL | 28 | 64.3 | 54.5 | 67.5 |
| SDSU | 29 | 79.3 | 66.7 | 81.5 |
| STANFORD | 39 | 69.2 | 71.4 | 70.1 |
| TRINITY | 45 | 73.3 | 72.8 | 73.3 |
| UCLA | 99 | 77.6 | 78.4 | 77.7 |
| UM | 140 | 75.7 | 78.2 | 78.9 |
| USM | 71 | 87.3 | 89.7 | 85.9 |
| YALE | 55 | 80.0 | 79.9 | 80.0 |
| NYU | 173 | 74.6 | 72.2 | 74.3 |
In addition, taking the four sites of UM, UCLA, USM, and NYU as examples, Fig. 8 shows the classification results of the proposed method compared with other studies. As can be seen from the figure, except NYU site, the classification accuracy of other sites is higher than that of other studies. The classification accuracy of NYU site in this study is slightly lower than that of Khan et al, however, Khan et al. did not adopt leave-one-out method for classification performance evaluation, which means that the data in the same site is used for both training and testing, in contrast, the leave-one-out method makes the model invisible to the data of the test site. The experimental results illustrate that the proposed method has a strong generalization ability, and can obtain discriminative brain functional features from fMRI data with different addresses, different instruments and different imaging parameters to diagnose ASD.
Fig. 8.
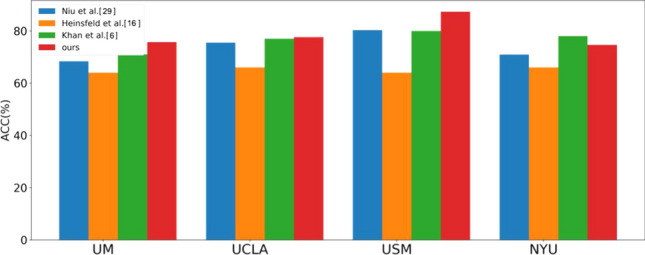
Classification accuracy of the four sites compared to other studies
Comparison of results with other studies
The classification performance of the proposed multi-view ensemble learning network in this study was compared with that of other studies, and the results are shown in Table 5, where all studies used the ABIDE multi-site dataset. As can be seen from the table, the proposed method obtained the best classification performance, which illustrates the effectiveness of the method. Due to different methods of data cleaning, the sample size of dataset used in different studies is different. In the ABIDE dataset, the values of a period of time series corresponding to a certain ROI of some subjects are 0, therefore, when calculating the Pearson correlation coefficient, the calculation result of computer will show NAN (not a number) value since the denominator is 0. For the above data missing problem, the studies with a sample size of more than 1000 in the table adopted the method of filling, while this study adopted the method of deletion to reduce the interference of such invalid data.
Table 5.
Comparison of experimental results with other studies
| Method | Sample size | Acc (%) |
|---|---|---|
| Abraham et al. (2016) | 871 | 67 |
| Dvornek et al. (2017) | 1100 | 68.5 |
| Rathore et al. (2019) | 1035 | 69.2 |
| Heinsfeld et al. (2018) | 1035 | 70 |
| Dvornek et al. (2018) | 1100 | 70.1 |
| Sherkatghanad et al. (2020) | 1035 | 70.2 |
| Ronicko et al. (2018) | 600 | 70.3 |
| Ours | 963 | 72.0 |
Bold indicates the ones with the highest accuracy
In addition, other studies in the table are based on single-view learning, for example, Dvornek et al. used a one-layer LSTM to learn the interaction between different ROIs over time, and Heinsfeld et al. used a two-layer stacked autoencoder to learn the latent brain function patterns of Pearson correlation coefficients. The pathogenesis of ASD is complex, so it is difficult to overcome the influence of strong data heterogeneity only using single-view features to diagnose ASD. The multi-view ensemble learning network proposed in this study can utlize the feature learning ability of different models to extract discriminative features from different perspectives, which is beneficial to enhance the learning ability and robustness of the model.
Conclusion
ASD is a kind of chronic central nervous system disorder with great harm, and early diagnosis and intervention is extremely important. Recently, deep learning based method has found wide application in computer-aided disease diagnosis due to its great success in classification task, in which a large number of medical samples are required to train a model based on deep learning to get favorable results. However, it is extremely difficult to obtain a large number of samples for medical images. Although multi-site data expand sample size, they suffer from inter-site heterogeneitys, which degrades the performance of identifying ASD from NC. To solve the problem, this paper proposed a new multi-view ensemble learning approach to identity autism from NC with multi-site fMRI. The framework is constructed with 3 modules from 3 perspectives. The first module combines the characteristics of fMRI data and uses an LSTM-Conv model for extracting the spatiotemporal features of the ROI mean time series. The second and third module employs PCA and SDAE model to extract the low/high-level brain functional features. The features extracted from the above three modules are used for ensemble learning, and the final classification accuracy of 72% is obtained, which illustrates the effectiveness of the method. Compared with single-view learning, the multi-view ensemble learning approach is more conducive to extracting discriminative features and improving the classification performance. In addition, to verify the generalization of the method, the experiments also employ the leave-one-out method to test the single-site data, and the classification accuracy of most sites is concentrated in the range of 70–80%, which indicates that the proposed method alleviates the impact of data heterogeneity to some extent. However, the proposed method still has some limitations, firstly, the accuracy rate still varies greatly among sites in the single-site experiments, so it is not only necessary to alleviate the problem of strong data heterogeneity from the method, but also from the data itself, for example, the data of each site can be mapped to the same standard space. Secondly, demographic information was not considered in this study, and an increasing number of studies have shown that ASD is associated with age, gender and family members (Werling and Geschwind 2013; Kana et al. 2014; Mehdizadehfar et al. 2020), for example, men are more likely to get the disease than women, and neural source connectivity analysis in fathers may be considered as a potential and promising biomarker of ASD. Finally, the present study explored brain functional abnormalities between ASD and NC only for fMRI data, combining data from multiple modalities (Kang et al. 2020) or diffusion kurtosis tensor (Kang et al. 2022) would be more beneficial to generate more robust results, for example, structural MRI data that reflect structural brain abnormalities could be combined.
Acknowledgements
Funding was provided by National Natural Science Foundation of China (Grant Nos. 81960312, 62171287) and Science and Technology Planning Project of Shenzhen Municipality (Grant No. 20200821152629001).
Data availability
All data included in this study are available upon request by contact with the corresponding author.
Declaration
Conflict of interest
We declare that we have no financial and personal relationships with other people or organizations that can inappropriately influence our work, there is no pro-fessional or other personal interest of any nature or kind in any product, service and/or company that could be construed as influencing the position presented in, or the review of the manuscript.
Footnotes
Publisher's Note
Springer Nature remains neutral with regard to jurisdictional claims in published maps and institutional affiliations.
References
- Abraham A, Milham M, Martino AD, et al. Deriving reproducible biomarkers from multi-site resting-state data: An Autism-based example. NeuroImage. 2016;147:736. doi: 10.1016/j.neuroimage.2016.10.045. [DOI] [PubMed] [Google Scholar]
- Chen Y, Keogh E, Hu B et al (2015) The UCR time series classification archive. www.cs.ucr.edu/~eamonn/time series data/
- Craddock C, Benhajali Y, Chu C, et al. The neuro bureau pre-processing initiative: open sharing of preprocessed neuroimag-ing data and derivatives. Front Neuroinform. 2013;7:66. [Google Scholar]
- Di Martino A, Yan CG, Li Q, et al. The autism brain imaging data exchange: towards a large-scale evaluation of the intrinsic brain architecture in autism. Mol Psychiatry. 2014;19(6):659–667. doi: 10.1038/mp.2013.78. [DOI] [PMC free article] [PubMed] [Google Scholar]
- Disorder American Psychiatric Association Autism Spectrum (2013) Diagnostic and statistical manual of mental disorders, 5th edition (DSM-5). American Psychiatric Publishing, Arlington, pp 50–59
- Dvornek NC, Ventola P, Pelphrey KA, et al. Identifying autism from resting-state fMRI using long short-term memory networks. Mach Learn Med Imaging. 2017;10541:362–370. doi: 10.1007/978-3-319-67389-9_42. [DOI] [PMC free article] [PubMed] [Google Scholar]
- Dvornek NC, Ventola P, Combining Duncan JS (2018) Phenotypic and resting-state fMRI data for autism classification with recurrent neural networks. In: 2018 IEEE 15th international symposium on biomedical imaging (ISBI 2018). Proceedings of the IEEE international symposium on biomed imaging, p 725 [DOI] [PMC free article] [PubMed]
- Guo X, Dominick KC, Minai AA, et al. Diagnosing autism spectrum disorder from brain resting-state functional connectivity patterns using a deep neural network with a novel feature selection method. Front Neurosci. 2017;11:460. doi: 10.3389/fnins.2017.00460. [DOI] [PMC free article] [PubMed] [Google Scholar]
- Hailong L, Parikh NA, Lili H. A novel transfer learning approach to enhance deep neural network classification of brain functional connectomes. Front Neurosci. 2018;12:491. doi: 10.3389/fnins.2018.00491. [DOI] [PMC free article] [PubMed] [Google Scholar]
- Heinsfeld AS, Franco AR, Craddock RC, et al. Identification of autism spectrum disorder using deep learning and the ABIDE dataset—ScienceDirect. NeuroImage Clin. 2018;17(C):16–23. doi: 10.1016/j.nicl.2017.08.017. [DOI] [PMC free article] [PubMed] [Google Scholar]
- Huang F, Tan EL, Yang P, et al. Self-weighted adaptive structure learning for ASD diagnosis via multi-template multi-center representation. Med Image Anal. 2020;63:101662. doi: 10.1016/j.media.2020.101662. [DOI] [PubMed] [Google Scholar]
- Kana RK, Uddin LQ, Kenet T, et al. Brain connectivity in autism. Front Hum Neurosci. 2014;8:349. doi: 10.3389/fnhum.2014.00349. [DOI] [PMC free article] [PubMed] [Google Scholar]
- Kang L, Jiang J, Huang J, et al. Identifying early mild cognitive impairment by multi-modality MRI-based deep learning. Front Aging Neurosci. 2020;12:206. doi: 10.3389/fnagi.2020.00206. [DOI] [PMC free article] [PubMed] [Google Scholar]
- Kang L, Chen J, Huang J, et al. Identifying epilepsy based on machine-learning technique with diffusion kurtosis tensor. CNS Neurosci Therap. 2022;28(3):354–363. doi: 10.1111/cns.13773. [DOI] [PMC free article] [PubMed] [Google Scholar]
- Karim F, Majumdar S, Darabi H, et al. LSTM fully convolutional networks for time series classification. IEEE Access. 2017;99:66. [Google Scholar]
- Kazeminejad A, Sotero RC. Topological properties of resting-state fMRI functional networks improve machine learning-based autism classification. Front Neurosci. 2019;12:66. doi: 10.3389/fnins.2018.01018. [DOI] [PMC free article] [PubMed] [Google Scholar]
- Khan NA, Waheeb SA, Riaz A, et al. A Three-stage teacher, student neural networks and sequential feed forward selection-based feature selection approach for the classification of autism spectrum disorder. Brain Sci. 2020;10(754):66. doi: 10.3390/brainsci10100754. [DOI] [PMC free article] [PubMed] [Google Scholar]
- Liu Y, Xu L, Li J, et al. Attentional connectivity-based prediction of autism using heterogeneous rs-fMRI data from CC200 Atlas. Exp Neurobiol. 2020;29(1):66. doi: 10.5607/en.2020.29.1.27. [DOI] [PMC free article] [PubMed] [Google Scholar]
- Liu Y, Zou Yuting H, Jihong L. Current status of research on autism in children. Gen Pract Nurs. 2020;18(33):4584–4586. [Google Scholar]
- Lord C, Risi S, Lambrecht L, et al. The autism diagnostic observation schedule-generic: a standard measure of social and communication deficits associated with the spectrum of autism. JAutism DevDisord. 2000;30:205–223. [PubMed] [Google Scholar]
- Mehdizadehfar V, Ghassemi F, Fallah A, et al. Brain connectivity analysis in fathers of children with autism. Cogn Neurodyn. 2020;14(6):781–793. doi: 10.1007/s11571-020-09625-2. [DOI] [PMC free article] [PubMed] [Google Scholar]
- Muller RA, Shih P, Keehn B, et al. Underconnected, but how a survey of functional connectivity MRI studies in autism spectrum disorders. Cereb Cortex. 2011;21(10):2233–43. doi: 10.1093/cercor/bhq296. [DOI] [PMC free article] [PubMed] [Google Scholar]
- Rahman MM, Usman OL, Muniyandi RC, et al. A review of machine learning methods of feature selection and classification for autism spectrum disorder. Brain Sci. 2020;10(12):949. doi: 10.3390/brainsci10120949. [DOI] [PMC free article] [PubMed] [Google Scholar]
- Rathore A, Palande S, Anderson JS, Features Autism Classification Using Topological, Deep Learning: A Cautionary Tale. In: Medical image computing and computer assisted intervention—MICCAI et al (2019) 22nd international conference, Shenzhen, China, October 13–17, 2019. Proceedings, Part III:2019 [DOI] [PMC free article] [PubMed]
- Ronicko J et al (2018) Diagnostic classification of autism using resting-state fMRI data and conditional random forest. In: Conference proceedings: annual international conference of the IEEE engineering in medicine and biology society. IEEE Engineering in Medicine and Biology Society. Annual conference
- Sherkatghanad Z, Akhondzadeh M, Salari S, et al. Automated detection of autism spectrum disorder using a convolutional neural network. Front Neurosci. 2020;13:1325. doi: 10.3389/fnins.2019.01325. [DOI] [PMC free article] [PubMed] [Google Scholar]
- Tiffany Kodak BDA, Samantha Bergmann BDB. Autism spectrum disorder. Pediatr Clin N Am. 2020;6:66. doi: 10.1016/j.pcl.2020.02.007. [DOI] [PubMed] [Google Scholar]
- Vincent P, Larochelle H, Lajoie I. Stacked denoising autoencoders learning useful representations in a deep network with a local denoising criterion. J Mach Learn Res. 2010;10:3371–3408. [Google Scholar]
- Wang Z, Yan W, Oates T (2017) Time series classification from scratch with deep neural networks: a strong baseline. In: 2017 International joint conference on neural networks (IJCNN). IEEE, pp 1578–1585
- Wang C, Xiao Z, Wu J. Functional connectivity-based classification of autism and control using SVM-RFECV on rs-fMRI data. Phys Med. 2019;65:99–105. doi: 10.1016/j.ejmp.2019.08.010. [DOI] [PubMed] [Google Scholar]
- Wang Y, Wang J, Wu FX, et al. AIMAFE: autism spectrum disorder identification with multi-atlas deep feature representation and ensemble learning. J Neurosci Methods. 2020;343:108840. doi: 10.1016/j.jneumeth.2020.108840. [DOI] [PubMed] [Google Scholar]
- Wang N, Yao D, Ma L, et al. Multi-site clustering and nested feature extraction for identifying autism spectrum disorder with resting-state fMRI. Med Image Anal. 2022;75:102279. doi: 10.1016/j.media.2021.102279. [DOI] [PubMed] [Google Scholar]
- Werling DM, Geschwind DH. Sex differences in autism spectrum disorders. Curr Opin Neurol. 2013;26(2):146. doi: 10.1097/WCO.0b013e32835ee548. [DOI] [PMC free article] [PubMed] [Google Scholar]
- Yang HZ, Gui YE. Exploring the effect of applying early care interventions for children with autism. Med Theory Pract. 2020;33(24):167–169. [Google Scholar]
Associated Data
This section collects any data citations, data availability statements, or supplementary materials included in this article.
Data Availability Statement
All data included in this study are available upon request by contact with the corresponding author.