Abstract
Obesity has been associated with cognitive impairments, increasing the probability of developing dementia. Recently, zinc (Zn) supplementation has attracted an increasing attention as a therapeutic agent for cognitive disorders. Here, we investigated the potential effects of low and high doses of Zn supplementation on cognitive biomarkers and leptin signaling pathway in the hippocampus of high fat diet (HFD)-fed rats. We also explored the impact of sex difference on the response to treatment. Our results revealed a significant increase in body weight, glucose, triglycerides (TG), total cholesterol (TC), total lipids and leptin levels in obese rats as compared to controls. HFD feeding also reduced brain-derived neurotrophic factor (BDNF) levels and increased acetylcholinesterase (AChE) activity in the hippocampus of both sexes. The low and high doses of Zn supplementation improved glucose, TG, leptin, BDNF levels and AChE activity in both male and female obese rats compared to untreated ones. Additionally, downregulated expression of leptin receptor (LepR) gene and increased levels of activated signal transducer and activator of transcription 3 (p-STAT3) that observed in hippocampal tissues of obese rats were successfully normalized by both doses of Zn. In this study, the male rats were more vulnerable to HFD-induced weight gain, most of the metabolic alterations and cognition deficits than females, whereas the female obese rats were more responsive to Zn treatment. In conclusion, we suggest that Zn treatment may be effective in ameliorating obesity-related metabolic dysfunction, central leptin resistance and cognitive deficits. In addition, our findings provide evidence that males and females might differ in their response to Zn treatment.
Subject terms: Biochemistry, Pathogenesis
Introduction
Obesity is one of the most important health issues of the twenty-first century, and its prevalence has increased at an alarming rate. According to recent estimates, 38% of men and 40% of women (1.9 billion) are overweight, with 11% and 14% (600 million) being obese1. More recently, obesity has been identified as a substantial risk factor for mild cognitive impairment, dementia, and Alzheimer's disease2. Through leptin receptors (LepRs) expressed on the hypothalamus nuclei, the adipokine leptin can regulate food intake, metabolism, and body weight2,3. LepRs have been identified in the hippocampus, and emerging evidence suggests that leptin promotes synaptic plasticity and improves learning and memory performance, whereas central leptin resistance is associated with memory loss4. LepRs downregulation and/or inadequate leptin signaling downstream of LepRs are linked to central leptin resistance5.
Zinc (Zn) is one of the most abundant trace elements required for brain activities and its deficiency is associated with neuronal degeneration and cognitive impairment6. It is highly concentrated in the amygdale, the auditory brain stem, the cerebral cortex, and the hippocampus7,8. Zn functions in the brain as a neurotransmitter and second messenger, controlling hippocampus long-term potentiation, boosting neuronal survival, and promoting learning and memory6.
Zn deficiency, on the other hand, is linked to obesity, insulin resistance, and hyperglycemia9–11. In obese animals, Zn supplementation can alleviate obesity, enhance insulin sensitivity, and reduce leptin levels12. However, Zn’s effect on cognitive function in obese condition and underlying mechanisms are still unknown. Furthermore, although a sex-related link between obesity and cognitive impairment has been investigated in various researches13–16, the impact of sex difference on response to Zn treatment effects needs more studies to be established.
In this context, the present study aimed to investigate the effects of different doses (low and high doses) of Zn supplementation on cognitive biomarkers and leptin signaling pathway in the hippocampus of high fat diet (HFD)˗fed rats and to determine sex difference impact on response to Zn supplementation.
Materials and methods
Ethical statement
All animal procedures and experimental protocols were performed in accordance with the International Guiding Principles for Biomedical Research Involving Animals17 and were approved by Institutional Animal Care and Use Committee (IACAUC), Medical Research Institute of Alexandria University. The current study adheres to the ARRIVE Guidelines for reporting in vivo experiments18.
Animals and experimental design
This study was conducted on 72 albino Sprague–Dawley rats (36 males and 36 females) (6 weeks old, 165 g average weight), purchased from the animal house of Institute of Graduate Studies and Research, Alexandria, Egypt. All rats were housed under the following condition; 12 h dark/light cycle at room temperature and humidity between 30 and 70% access to water, animals were divided in individual plastic cages 6 rats per cage with soft bedding.
Male as well as female rats were divided into two main groups (18 in each group): control diet (CD) and high fat diet (HFD) fed groups, (HFD) contains 45% Kcal from fats (D12451; Research Diets, Inc., New Brunswick, NJ, USA)19.
Progression of obesity was monitored through determination of the increase in body weight, serum levels of total lipids, cholesterol, and triglycerides in CD and HFD-fed rats, Table (1). After 8 weeks, rats were further divided into total six groups (6 rats each); CD, CD-low Zn (15 mg/kg ZnSO4.7H2O); Sigma, St. Louis, MO), CD-high Zn (30 mg/kg ZnSO4.7H2O), HFD, HFD-low Zn and HFD-high Zn groups. Zn solution was daily administered using oral gavage for 4 weeks after its preparation by dissolving water-soluble zinc sulfate (ZnSO4.7H2O) in distilled water20.
Table 1.
Body weight, serum glucose level, and lipid profile in control versus HFD groups after 8 weeks in males and females rats.
| Groups | Control | HFD | ||
|---|---|---|---|---|
| Males | Females | Males | Females | |
| Weight (g) | 228.2 ± 37.7a | 188.9 ± 8.0b | 306.3 ± 36.4a | 230.1 ± 8.8b |
| Glucose (mg/dl) | 95.0 ± 8.0b | 96.0 ± 10.2b | 127.9 ± 8.3a | 128.1 ± 8.1a |
| Total lipids (mg/dl) | 301.8 ± 44.2b | 220.7 ± 4.7b | 367.7 ± 17.0a | 278.8 ± 8.2a |
| Triglycerides (mg/dl) | 91.8 ± 15.2b | 159.1 ± 34.9a | 155.1 ± 37.6a | 188.7 ± 66.0a |
| Cholesterol (mg/dl) | 79.4 ± 7.1b | 92.1 ± 10.5a | 103.1 ± 14.9a | 1174.2 ± 37.2a |
Data was expressed using mean ± SD.
Means in the same raw with small common letters are not significant (i.e. means with different letters are significant).
SD standard deviation.
At the end of the experiment, all rats were fasted for 12 h, blood and brain tissues were collected after animals exposed to deep anesthesia using isoflurane, then all animals were terminated by decapitation.
Sample collection
A blood sample was collected from each rat, allowed to clot at room temperature and centrifuged at 3000 rpm; the aspirated serum was stored at − 20 °C till used for assay of glucose, leptin, Zn concentrations, lipid profile, liver and kidney functions. Brain was dissected immediately to isolate the hippocampus. The first part of hippocampal tissues of studied groups was homogenized, centrifuged and supernatants were used for determination of brain-derived neurotrophic factor (BDNF), acetylcholine esterase (AChE) and phospho-STAT3 (p-STAT3) levels. The second part was used for RNA extraction to measure the gene expression of leptin receptor (LepR). For histopathological studies, the third portion was preserved in 10% formalin.
Biochemical serum analysis
Serum aspartate aminotransferase (AST/GOT) and alanine aminotransferase (ALT/GPT), total lipids, triglycerides (TG), total cholesterol (TC), fasting glucose levels, urea, uric acid, and creatinine were assayed using commercial kits (Biosystems, Costa Brava 30, 08030 Barcelona, Spain).
Serum leptin levels were quantified using commercially available sandwich ELISA kit purchased from (BIOMATIK, 9-14 McGovern. Drive, Cambridge, Ontario, N3H4R7, Canada), according to the manufacturer’s instructions. The concentration of Zn (µg/dl) was assayed by atomic absorption spectroscopy (AAS) (SPECTRA AA-PLUS VERSION, working with air/acetylene flame and D2-background correction)21.
Determination of AChE activity, BDNF, and p-STAT3 in hippocampal tissues
Hippocampal tissue samples were homogenized in 0.1 M phosphate buffer, PH 7.5, followed by centrifugation at 14,000 rpm for 5 min, and then the supernatant was used for determination of AChE activity using AChE activity assay kit (MAK 119, Sigma Alderich). In addition, BDNF and p-STAT3 concentrations were assayed in hippocampus using sandwich ELISA kits purchased from (MyBioSource, Inc., San Diego, CA, USA and Thermo Fisher Scientific, Waltham, MA, USA), respectively.
Quantitative reverse transcriptase polymerase chain reaction (q-RT-PCR) of LepR gene expression in hippocampal tissues
Total RNA was extracted from brain tissues using Easy-RED Total RNA Extraction Kit (iNtRON Biotechnology Inc., South Korea) according to the manufacturer’s instructions. The purity and concentration of extracted RNA were evaluated by NanoDrop ND-1000 UV–Visible Spectrophotometer (Thermo Fischer Scientific, USA). Total RNA was reverse transcribed using TOPscript RT DryMixsynthesis kit (Enzynomics Inc., South Korea), following the manufacturer’s instructions. The PCR reaction was carried in 20 μl final volume, where 2 μl cDNA, 1.25 μl of the each forward and reverse primer (10pMol/µl), 10 μl (TOPreal ™ qPCR 2X PreMIX) SYBER Green master mix, and 5.5 μl RNAse-free water were dispensed into the PCR tubes. The amplification profile was as follow, initial denaturation at 95 for 15 min, followed by 35 cycles of denaturation at 95 for 10 s, annealing at 60 for 15 s, and final elongation at 72 for 30 s. The relative expression of leptin receptor was quantified relative to the expression of 18S ribosomal RNA (18S rRNA) as a reference gene, 2−∆∆ct equation was used to calculate LepR gene expression. Primer sequence for leptin receptor and 18S rRNA are represented as follows.
| Gene | Primer sequence | |
|---|---|---|
| Leptin receptor | F: CTGGCTGTCTCACATCTCCC | R: AATGAGCGTTCTTCCAACCCCC |
| 18S rRNA | F: GTAACCCGTTGAACCCATT | R: CAAGCTTATGACCCGCACTT |
Histopathological studies
The hippocampal samples were fixed with 10% neutral buffered formalin, and then passed through ascending concentrations of ethanol, cleared in xylene and embedded in paraffin. Using a rotary microtome, paraffin sections of 4 μm thickness were cut and stained with hematoxylin and eosin (H&E). Under light microscope, the hippocampus was examined for any histopathological changes.
Statistical analysis
Data were fed to the computer and analyzed using IBM SPSS software package version 20.0. (Armonk, NY: IBM Corp). The normality of the distribution was confirmed using the Kolmogorov–Smirnov test, and parametric data were represented using mean ± standard deviation. Two way ANOVA test was used to analyze the effect of zinc treatment, gender, and the possible interaction between zinc treatment and gender variation on all the studied parameters, Table (2). One way ANOVA was used to compare between more than two groups, and Post Hoc test (Tukey) for pairwise comparisons. p value ≤ 0.05 was considered statistically significant.
Table 2.
Two way ANOVA analyses of all studied parameters in all groups regarding gender, Zn treatment, and gender versus ZnSO4 treatment.
| Studied parameters | Zn-treatment | Gender | Zn-treatment/gender | |||
|---|---|---|---|---|---|---|
| F | p | F | P | F | p | |
| Total weight | 118.65 | ˂ 0.0001 | 746.18 | ˂ 0.0001 | 5.41 | 0.0002 |
| Serum markers | ||||||
| Zn | 53.72 | ˂ 0.0001 | 380.63 | ˂ 0.0001 | 11.51 | ˂ 0.0001 |
| Leptin | 228.51 | ˂ 0.0001 | 2045.89 | ˂ 0.0001 | 45.45 | ˂ 0.0001 |
| Glucose level | 80.56 | ˂ 0.0001 | 0.00 | 0.9756 | 3.74 | 0.0034 |
| Brain markers | ||||||
| Leptin receptor | 228.51 | ˂ 0.0001 | 2045.89 | ˂ 0.0001 | 45.45 | ˂ 0.0001 |
| PDNF | 1246.42 | ˂ 0.0001 | 465.32 | ˂ 0.0001 | 14.46 | ˂ 0.0001 |
| p-STAT3 | 283.27 | ˂ 0.0001 | 155.63 | ˂ 0.0001 | 4.87 | 0.0004 |
| AChE | 6.63 | ˂ 0.0001 | 61.75 | ˂ 0.0001 | 33.81 | ˂ 0.0001 |
| Lipid profile | ||||||
| Total Lipids | 23.4 | ˂ 0.0001 | 365.91 | ˂ 0.0001 | 2.91 | 0.0158 |
| Cholesterol | 20.18 | ˂ 0.0001 | 147.03 | ˂ 0.0001 | 1.21 | 0.3072 |
| Triglycerides | 110.47 | ˂ 0.0001 | 128.92 | ˂ 0.0001 | 15.24 | ˂ 0.0001 |
| Liver enzymes | ||||||
| SGOT | 34.78 | ˂ 0.0001 | 150.27 | ˂ 0.0001 | 15.22 | ˂ 0.0001 |
| SGPT | 134.15 | ˂ 0.0001 | 445.15 | ˂ 0.0001 | 37.49 | ˂ 0.0001 |
| Kidney functions test | ||||||
| Urea | 16.3 | ˂ 0.0001 | 4.54 | 0.0350 | 0.51 | 0.7681 |
| Uric acid | 39.25 | ˂ 0.0001 | 9.38 | 0.0027 | 11.90 | ˂ 0.0001 |
| Creatinine | 2.02 | 0.0798 | 7.83 | 0.0059 | 1.55 | 0.1791 |
Results
Effect of Zn treatment on anthropometric and biochemical parameters
As shown in Tables (3, 4), body weight and serum levels of glucose, total lipids, cholesterol and triglycerides were significantly increased in obese male and female rats as compared to controls (p ≤ 0.05).
Table 3.
Body weight, serum glucose level, lipid profile, liver and kidney functions in control and obese groups without ZnSO4 tretatment, low dose (15 mg) ZnSO4 treatment, and high dose (30 mg) ZnSO4 treatment in male rats.
| Studied parameters | Control group | Obese group | ||||
|---|---|---|---|---|---|---|
| Without ZnSO4 | Low dose ZnSO4 | High dose ZnSO4 | Without ZnSO4 | Low dose ZnSO4 | High dose ZnSO4 | |
| Body weight (g) | 313.4 ± 22.8bc | 300.6 ± 6.4bc | 289.4 ± 24.9c | 419.0 ± 8.2a | 324.3 ± 42.7b | 303.9 ± 20.4b |
| Glucose (mg/dl) | 92.7 ± 10.7cd | 93.7 ± 7.7bcd | 91.0 ± 6.6cd | 130.3 ± 3.5a | 94.2 ± 6.6bcd | 96.7 ± 9.8bc |
| Lipid profile | ||||||
| Lipids (mg/dl) | 347.4 ± 19.1b | 347.9 ± 21.8b | 323.5 ± 25.4bc | 406.5 ± 22.6a | 355.7 ± 14.4b | 343.3 ± 16..2bc |
| Cholesterol (mg/dl) | 97.0 ± 7.3bc | 97.7 ± 14.2bc | 99.0 ± 26.8bc | 129.0 ± 10.3a | 111.0 ± 28.0ab | 112.3 ± 13.6ab |
| Triglyceride (mg/dl) | 94.7 ± 10.4c | 90.0 ± 18.2c | 90.7 ± 15.0c | 196.3 ± 17.3a | 157.3 ± 7.4b | 153.3 ± 12.0b |
| Liver enzymes | ||||||
| GOT (U/L) | 167.3 ± 13.2bcd | 162.2 ± 13.6cde | 131.4 ± 13.0ef | 275.0 ± 57.1a | 199.2 ± 27.7b | 173.0 ± 10.7bc |
| GPT (U/L) | 63.1 ± 4.1b | 48.9 ± 7.6cd | 47.0 ± 8.9cde | 93.1 ± 5.0a | 40.9 ± 5.4ef | 41.1 ± 5.8def |
| Kidney functions | ||||||
| Urea (mg/dl) | 34.0 ± 2.0e | 37.3 ± 3.0bcde | 37.0 ± 4.3cde | 42.2 ± 2.6a | 38.3 ± 1.9abcd | 38.4 ± 2.1abc |
| Uric acid (mg/dl) | 2.6 ± 0.4e | 3.0 ± 0.4de | 3.3 ± 0.5cde | 2.6 ± 0.4e | 3.3 ± 0.6cde | 3.4 ± 0.2cd |
| Creatinine (mg/dl) | 0.6 ± 0.07ab | 0.7 ± 0.07a | 0.6 ± 0.06ab | 0.6 ± 0.05ab | 0.6 ± 0.07ab | 0.6 ± 0.08ab |
Data was expressed using mean ± SD.
Means in the same raw with small common letters are not significant (i.e. means with different letters are significant).
SD standard deviation.
Table 4.
Body weight, serum glucose level, lipid profile, liver and kidney functions in control and obese groups without ZnSO4 tretatment, low dose (15 mg) ZnSO4 treatment, and high dose (30 mg) ZnSO4 treatment in female rats.
| Studied parameters | Control group | Obese group | ||||
|---|---|---|---|---|---|---|
| Without ZnSO4 | Low dose ZnSO4 | High dose ZnSO4 | Without ZnSO4 | Low dose ZnSO4 | High dose ZnSO4 | |
| Body weight (g) | 215.6 ± 11.4d | 209.8 ± 14.8d | 205.6 ± 8.8de | 331.4 ± 16.3b | 189.1 ± 7.2de | 178.3 ± 30.5e |
| Glucose (mg/dl) | 83.0 ± 14.5d | 89.6 ± 3.0cd | 93.7 ± 9.0cd | 132.2 ± 11.0a | 105.0 ± 9.8b | 95.8 ± 5.2bc |
| Lipid profile | ||||||
| Lipids (mg/dl) | 256.0 ± 11.8ef | 232.4 ± 17.7f | 237.4 ± 29.2f | 307.2 ± 18.4cd | 283.2 ± 36.3de | 281.7 ± 40.5de |
| Cholesterol (mg/dl) | 69.1 ± 12.1de | 58.3 ± 8.8e | 54.3 ± 10.3e | 102.6 ± 8.4bc | 81.2 ± 9.1cd | 82.7 ± 25.6cd |
| Triglyceride (mg/dl) | 149.0 ± 17.5b | 146.7 ± 5.1b | 141.2 ± 23.0b | 218.7 ± 27.8a | 153.7 ± 20.3b | 160.2 ± 6.9b |
| Liver enzymes | ||||||
| GOT (U/L) | 142.8 ± 23.4cdef | 111.0 ± 25.0f | 128.4 ± 29.0ef | 154.8 ± 15.8cde | 133.1 ± 15.6def | 128.8 ± 21.2ef |
| GPT (U/L) | 31.8 ± 4.0gh | 27.6 ± 4.6 h | 30.2 ± 5.3gh | 51.6 ± 7.9c | 35.92 ± 4.4 fg | 35.6 ± 3.3 fg |
| Kidney functions | ||||||
| Urea (mg/dl) | 34.4 ± 1.3de | 35.7 ± 3.0cde | 36.4 ± 2.3cde | 41.1 ± 4.5a | 36.2 ± 3.6cde | 36.9 ± 3.1cde |
| Uric acid (mg/dl) | 3.6 ± 0.3cd | 3.7 ± 0.3cd | 3.8 ± 0.3bc | 4.5 ± 1.3bs | 3.7 ± 0.4cd | 3.7 ± 0.5cd |
| Creatinine (mg/dl) | 0.6 ± 0.02ab | 0.6 ± 0.09ab | 0.6 ± 0.08ab | 0.5 ± 0.08b | 0.6 ± 0.08ab | 0.5 ± 0.07b |
Data was expressed using Mean ± SD.
Means in the same raw with small common letters are not significant (i.e. means with different letters are significant).
SD standard deviation.
Low and high Zn doses significantly decreased body weight as well as serum levels of glucose and triglycerides in both obese male and female rats compared to untreated obese rats (p ≤ 0.05). A significant decrease in serum levels of total lipids was also detected in obese male rats (p ≤ 0.05). In contrast, the treatment with either doses didn’t show any significant effect on cholesterol levels in male and female obese rats compared to untreated obese rats, Tables (3, 4).
Regarding sex variations, obese males showed a significant increase in body weight and serum levels of total lipids and cholesterol compared to obese females (p ≤ 0.05). However, no significant differences were detected in serum levels of glucose and triglycerides. After treatment, obese females showed a significant decrease in total lipids and TC levels compared to obese males, Table (5).
Table 5.
Comparison between body weight, serum glucose level, lipid profile, liver and kidney functions in males versus female obese groups without ZnSO4 tretatment, low dose (15 mg) ZnSO4 treatment, and high dose (30 mg) ZnSO4 treatment.
| Studied parameters | Male obese group | Female obese group | ||||
|---|---|---|---|---|---|---|
| Without ZnSO4 | Low dose ZnSO4 | High dose ZnSO4 | Without ZnSO4 | Low dose ZnSO4 | High dose ZnSO4 | |
| Body weight (g) | 419 ± 8.2a | 324.3 ± 42.7 | 303.9 ± 20.4 | 331.4 ± 16.3b | 189.1 ± 7.2de | 178.3 ± 30.5e |
| Glucose (mg/dl) | 130.3 ± 3.5a | 94.2 ± 6.6bcd | 96.7 ± 9.8bc | 132.2 ± 11.0a | 105.0 ± 9.8b | 95.8 ± 5.2bc |
| Lipid profile | ||||||
| Lipids (mg/dl) | 406.5 ± 22.6a | 355.7 ± 14.4b | 343.3 ± 16..2bc | 307.2 ± 18.4cd | 283.2 ± 36.3de | 281.7 ± 40.5de |
| Cholesterol (mg/dl) | 129.0 ± 10.3a | 111.0 ± 28.0ab | 112.3 ± 13.6ab | 102.6 ± 8.4bc | 81.2 ± 9.1cd | 82.7 ± 25.6cd |
| Triglyceride (mg/dl) | 196.3 ± 17.3a | 157.3 ± 7.4b | 153.3 ± 12.0b | 218.7 ± 27.8a | 153.7 ± 20.3b | 160.2 ± 6.9b |
| Liver enzymes | ||||||
| GOT (U/L) | 275.0 ± 57.1a | 199.2 ± 27.7b | 173.0 ± 10.7bc | 154.8 ± 15.8cde | 133.1 ± 15.6def | 128.8 ± 21.2ef |
| GPT (U/L) | 93.1 ± 5.0a | 40.9 ± 5.4ef | 41.1 ± 5.8def | 51.6 ± 7.9c | 35.92 ± 4.4 fg | 35.6 ± 3.3 fg |
| Kidney functions | ||||||
| Urea (mg/dl) | 42.2 ± 2.6a | 38.3 ± 1.9abcd | 38.4 ± 2.1abc | 41.1 ± 4.5a | 36.2 ± 3.6cde | 36.9 ± 3.1cde |
| Uric acid (mg/dl) | 2.6 ± 0.4e | 3.3 ± 0.6cde | 3.4 ± 0.2cd | 4.5 ± 1.3bs | 3.7 ± 0.4cd | 3.7 ± 0.5cd |
| Creatinine (mg/dl) | 0.6 ± 0.05ab | 0.6 ± 0.07ab | 0.6 ± 0.08ab | 0.5 ± 0.08b | 0.6 ± 0.08ab | 0.5 ± 0.07b |
Data was expressed using mean ± SD.
Means in the same raw with small common letters are not significant (i.e. means with different letters are significant).
SD Standard deviation.
Effect of Zn treatment on liver and kidney function tests
The serum levels of GPT and urea were significantly increased in obese rats of both sexes compared to their corresponding controls (p ≤ 0.05), whereas uric acid levels were significantly increased only in obese female rats (p ≤ 0.05), Tables (3, 4).
In obese males, low and high doses of Zn significantly lowered serum GOT and GPT levels (p ≤ 0.05). In obese females, both doses significantly decreased GPT, urea and uric acid serum levels (p ≤ 0.05) compared to untreated obese rats, Tables (3, 4).
As compared to obese females, obese males showed a significant elevation in the levels of GOT, GPT (p ≤ 0.05). After Zn treatment, obese females showed a significant reduction in serum GOT as compared to obese males, Table (5).
Effect of zinc treatment on leptin and zinc levels
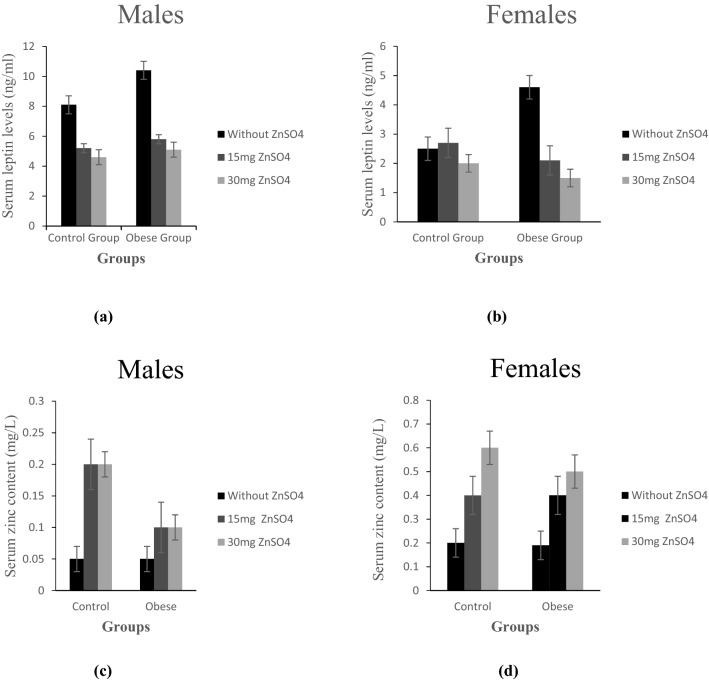
The results in Fig. (1a,b) indicated a significant increase in serum leptin in male and female obese rats, which was reversed by both doses of supplemented Zn (p ≤ 0.05).
Figure 1.
(a,b) Serum levels of leptin (ng/ml) in control and obese groups; without ZnSO4, 15 mg ZnSO4, and 30 mg ZnSO4; in male rats and female rats, respectively; (c,d) zinc content in control and obese groups; without ZnSO4, 15 mg ZnSO4, and 30 mg ZnSO4; in male and female rats, respectively; Results are expressed as (mean ± S.D).
Regarding serum Zn levels, there wasn’t any significant difference in either obese male or female groups as compared to control. Treatment with low and high Zn doses increased Zn levels in both male and female obese rats as compared to untreated rats, however, this increase was significant in obese female rats only (p ≤ 0.05), Fig. (1c,d).
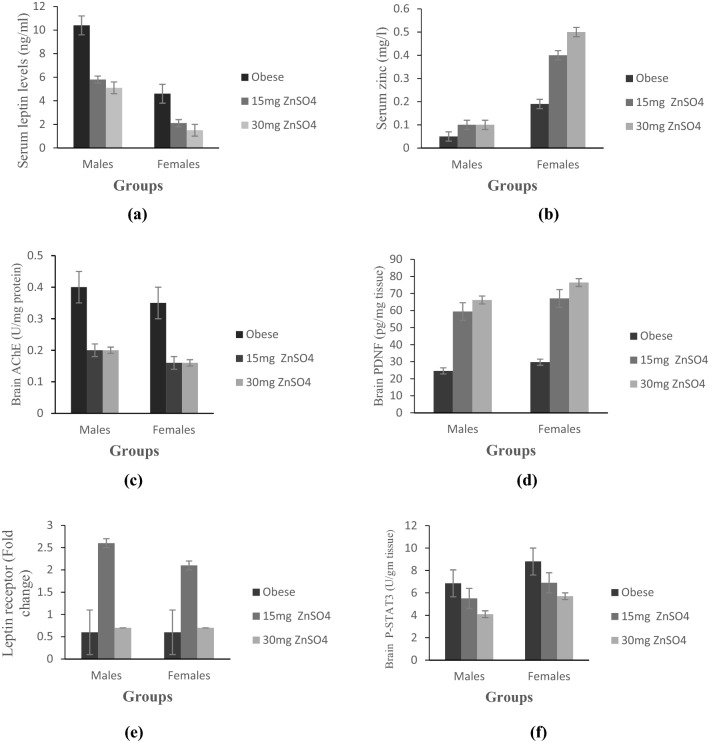
As compared to obese females, obese males showed a significant decrease in Zn levels and a significant increase in leptin levels (p ≤ 0.05). After Zn treatment, their levels were reversed significantly in obese females compared to obese males, Fig. (4a,b).
Figure 4.
Comparison between male versus female obese rats before and after 15 mg ZnSO4, and 30 mg ZnSO4 regarding; (a) serum leptin levels; (b) serum zinc content; (c) brain AChE (U/mg protein); (d) brain PDNF (pg/mg tissue); (e) fold change in leptin receptor gene expression in brain tissues; (f) brain p-STAT3 (U/mg tissue). Results are expressed as (mean ± S.D).
Effect of zinc treatment on cognitive biomarkers (hippocampal AChE activity and PDNF levels)
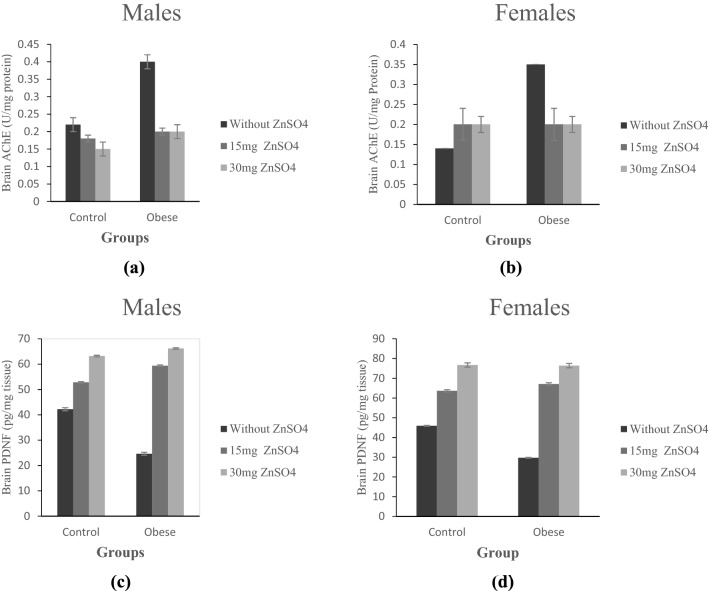
The present results indicated a significant increase in hippocampal AChE activity and a significant decrease in PDNF levels in obese male and female rats as compared to their control counterparts (p ≤ 0.05), Fig. (2a–d).
Figure 2.
(a,b) Brain tissue levels of AChE (U/mg tissue) in control and obese groups; without ZnSO4, 15 mg ZnSO4, and 30 mg ZnSO4 in male and female rats, respectively; (c,d) Brain levels of PDNF (pg/mg tissue) in control and obese groups; without ZnSO4, 15 mg ZnSO4, and 30 mg ZnSO4; in in male and female rats, respectively. Results are expressed as (mean ± S.D).
Treatment with either low or high Zn doses significantly decreased AChE activity in obese male and female rats compared to untreated obese rats (p ≤ 0.05), Fig. (2a,b). On the other side, hippocampal PDNF levels were significantly increased in both sexes of obese treated groups compared to untreated groups (p ≤ 0.05), Fig. (2c,d).
As compared to obese females, obese male rats showed a significantly higher levels of AChE activity and significantly lower PDNF levels (p ≤ 0.05), Fig. (4c,d). After treatment, AChE activity were significantly decreased, while PDNF levels were significantly increased in obese females compared to obese males.
Effect of zinc treatment on leptin signaling in the hippocampus (leptin receptor gene expression and p-STAT3 levels)
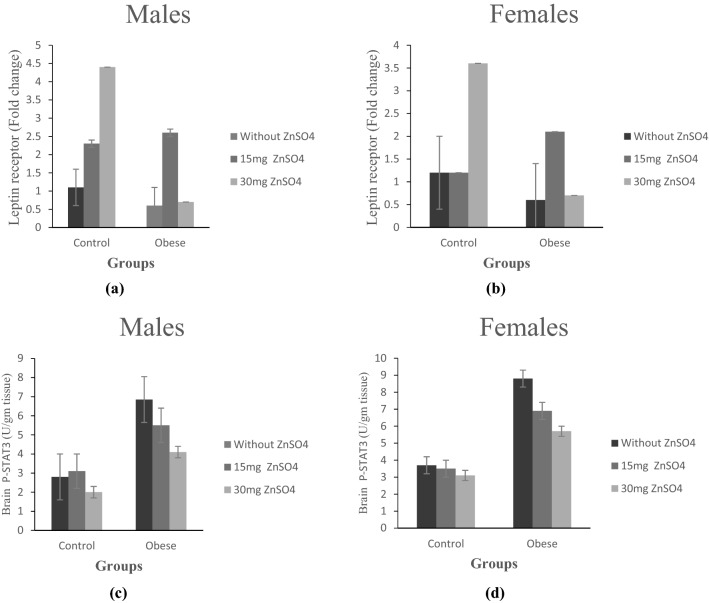
Our results indicated an insignificant downregulation of LepR gene expression and a significant elevation in p-STAT3 levels in the hippocampus of male and female obese rats as compared to their control counterparts (p ≤ 0.05), Fig. (3a–d).
Figure 3.
(a,b) Fold change in leptin receptor expression in brain tissue in control and obese groups; without ZnSO4, 15 mg ZnSO4, and 30 mg ZnSO4 in male and female rats, respectively. (c,d) Brain tissues levels of p-STAT3 (U/gm tissue) in control and obese groups; without ZnSO4, 15 mg ZnSO4, and 30 mg ZnSO4; in male and female rats, respectively. Results are expressed as (mean ± S.D).
Low dose of supplemented Zn significantly upregulated LepR gene expression, whereas both doses significantly decreased p-STAT3 levels in obese rats of both sexes as compared to untreated groups (p ≤ 0.05), Fig. (3a–d).
Regarding sex variation, no significant difference in LepR gene expression was found between obese male and female rats, Fig. (4e). However, a significant increase in hippocampal p-STAT3 levels in obese females was detected compared to obese males (p ≤ 0.05). After treatment, p-STAT3 levels were significantly increased in obese females compared to obese males, Fig. (4f).
Histopathological results
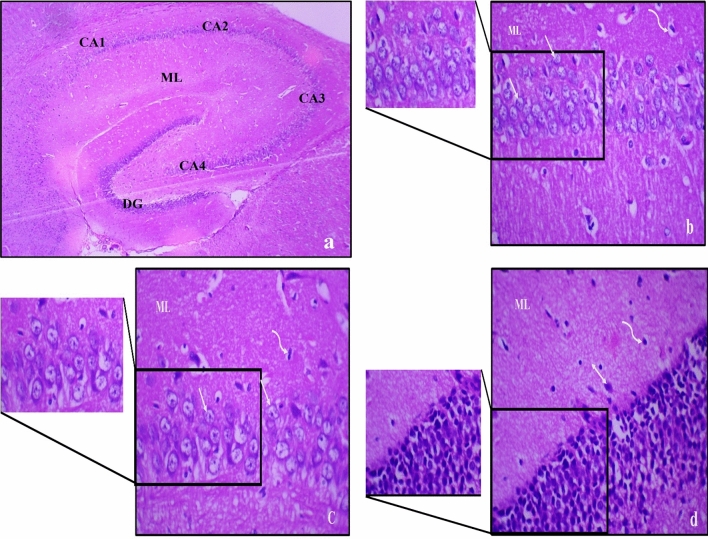
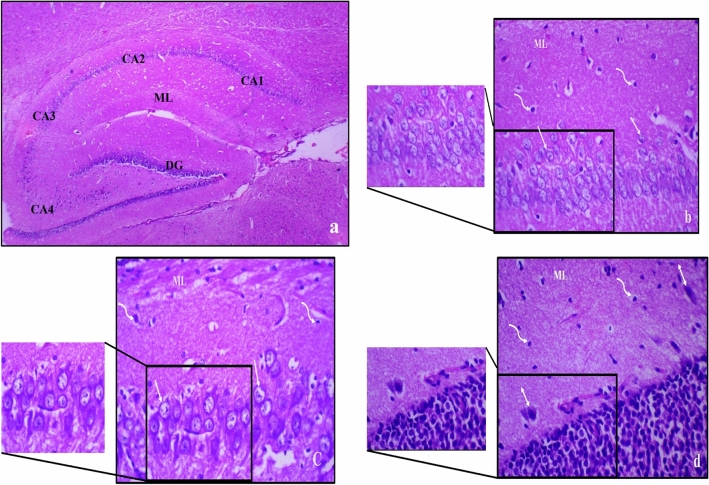
Haematoxylin and eosin (H&E)-stained sections from control male and female rats showed normal histological structure of the hippocampus, Figs. (5, 6). The main regions of the hippocampus are hippocampus proper, dentate gyrus (DG) and Subiculum (S). The molecular layer is located in between the Cornu Ammonis (CA) and characterized by a population of scattered glial and neuron cells.
Figure 5.
Photomicrograph of haematoxylin and eosin-stained sections from hippocampus of control male rat showing normal regions and histological structure of the hippocampus, where; (a) The hippocampus proper is formed of the Cornu Ammonis (CA) as CA1, CA2, CA3 & CA4 regions, and is continued as subiculum (S). Dentate gyrus (DG) is seen around CA4 by its upper & lower limbs. Molecular layer (ML) is in between CA and of DG (H & E ×40). (b) 4–5 compact layers of small pyramidal neurons of CA1 region, most with vesicular nuclei (↑); (c) shows few layers of large pyramidal neurons in CA3 region, also with vesicular nuclei (↑); (d) shows layers of compact granular cells with dark nuclei in dentate gyrus. Molecular layer (ML) shows many glial cells (wavy arrow) as well as pyramidal cells (↕) [H & E; (a) ×40, (b–d) ×400].
Figure 6.
Photomicrograph of haematoxylin and eosin-stained sections from hippocampus of control female rat showing normal regions and histological structure of the hippocampus, where; (a) The hippocampus proper is formed of the Cornu Ammonis (CA) as CA1, CA2, CA3 & CA4 regions, and is continued as subiculum (S). Dentate gyrus (DG) is seen around CA4 by its upper & lower limbs. Molecular layer (ML) is in between CA and of DG (H & E ×40). (b) 4–5 compact layers of small pyramidal cells of CA1 region, most with vesicular nuclei (↑); (c) shows few layers of large pyramidal cells in CA3 region, also with vesicular nuclei (↑); (d) shows layers of compact granular cells with dark nuclei in dentate gyrus. Molecular layer (ML) shows many glial cells (wavy arrow) as well as pyramidal cells (↕) [H & E; (a) ×40, (b–d) ×400].
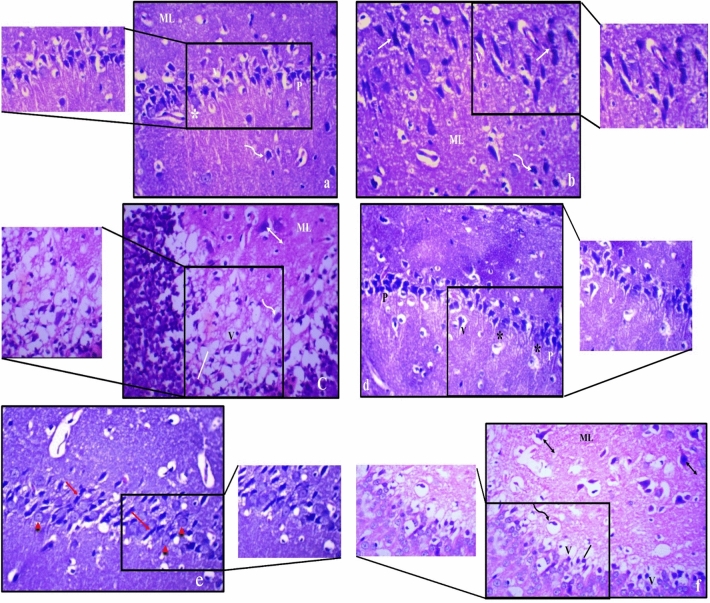
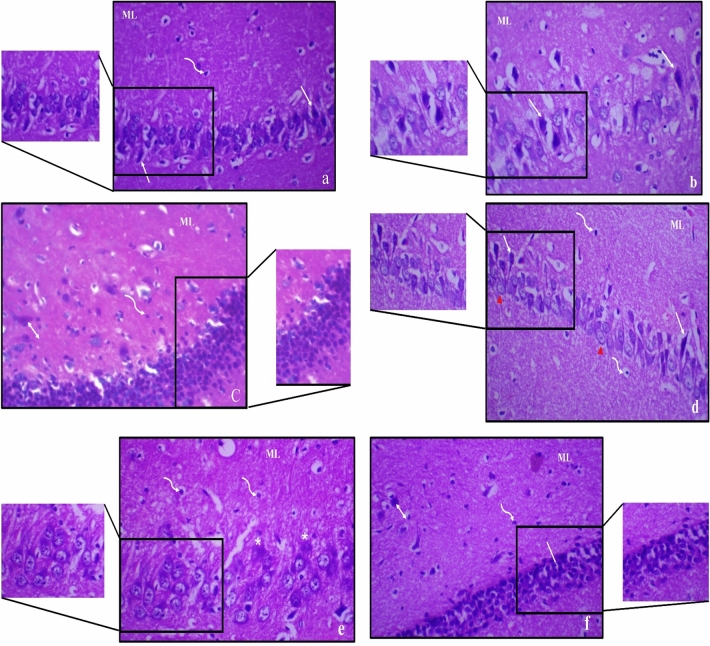
The hippocampus of male and female obese rats showed reduction of small pyramidal neurons; most were with pyknotic and karyorrhectic nuclei. Large pyramidal neurons exhibited extensive damage and disorganization; while few neurons appeared normally in female sections. The granular layer showed cell depletion with noticeable vacuolation. The molecular layer showed enlarged neurons and glial cells (Fig. 7).
Figure 7.
Photomicrograph of haematoxylin and eosin-stained sections from hippocampus of obese male rat (a–c) and obese female rat (d–f), where; (a) showing areas of small pyramidal neurons loss; some have pyknotic (P) and others have karyorrhectic (*) nuclei with vacuolation (V); (b) disorganization and extensive damage with apoptosis of most large pyramidal neurons (↑) with vacuolation (V); (c) granular cell layers (|) showed cell loss with marked vacuolations. Molecular layer (ML) shows marked enlargement of pyramidal (↕) and glial cells (wavy arrow); (d) showing areas of small pyramidal cells loss; some have pyknotic (P) and others have karyorrhectic (*) nuclei with vacuolation (V); (e) disorganization and extensive damage with apoptosis of many large pyramidal cells (↑) with few normal cells (right pointing triangle); (f) granular cell layers (|) showed cell loss with less vacuolation compared to males. Molecular layer (ML) shows marked enlargement of pyramidal (↕) and glial cells (wavy arrow) (H & E, ×400).
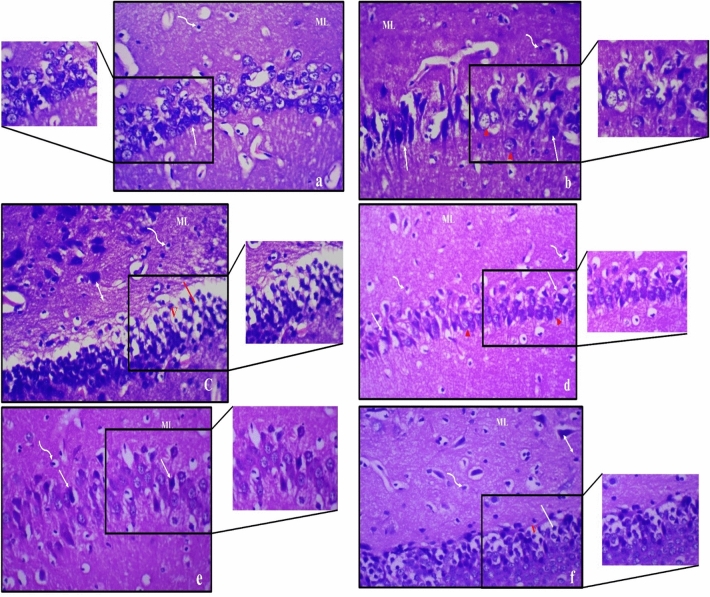
Treatment with 15 mg of Zn showed partial improvement in the hippocampus histologic structure as preservation of small pyramidal neuron with numerous pyknotic nuclei was noticed, Fig. (8). However, large pyramidal neurons in male rats exhibited marked apoptosis when compared to female rats. Treatment with 30 mg of Zn showed significant recovery of both small and large pyramidal neurons and preservation of granular cells and molecular layer of female compared to male rats, Fig. (9).
Figure 8.
Photomicrograph of haematoxylin and eosin-stained sections from hippocampus of obese male rat (a–c) and obese female rats (d–f) treated with 15 mg of zinc showing partial improvement, where; (a) preservation of small pyramidal neurons with many apoptotic cells (↑); (b) marked apoptosis of large pyramidal neurons (↑) with few normal cells (right pointing triangle) and (c) decreased population of granular cells (|) with marked disorganization and vacuolation (V). Molecular layer (ML) mostly shows marked enlargement of neurons (↕) and many glial cells (wavy arrow); (d) preservation of small pyramidal cells (right pointing triangle) with many apoptotic cells (↑); (e) marked apoptosis of some large pyramidal cells (↑) and (f) decreased population of granular cells (|) with marked disorganization with less vacuolation (V). Molecular layer (ML) mostly shows marked enlargement of many neurons (↕) and many glial cells (wavy arrow) (H & E, ×400).
Figure 9.
Photomicrograph of haematoxylin and eosin-stained sections from hippocampus of obese male rat (a–c) and obese female rat (d–f) treated with 30 mg of zinc showing dramatic improvement, where: (a) preservation of small pyramidal neurons with few apoptotic cells (↑); (b) some large pyramidal neurons with pyknotic nuclei (↑) and (c) preservation of granular cells with mild disorganization and vacuolation (V). Molecular layer (ML) mostly shows some enlarged neurons (↕) and many glial cells (wavy arrow); (d) preservation of small pyramidal cells (right pointing triangle) with few apoptotic cells (↑); (e) large pyramidal cells show few karyorrhectic nuclei (*) and (f) preservation of granular cells (|) and the molecular layer (ML) mostly shows few enlarged neurons (↕) and many glial cells (wavy arrow) (H & E, ×400).
Discussion
Dietary Zn deficiency is increasingly associated with metabolic diseases including obesity22–24 and cognitive impairments6. Hence, our study investigated the potential effect of Zn supplementation on the cognitive biomarkers and leptin signaling pathway in high fat diet (HFD)-induced obesity rat model.
In advance, the present results revealed that HFD led to a significant increase in the body weight and induced hyperglycemia, dyslipidemia and hyperleptinemia in male as well as female rats, without altering Zn levels. Normal Zn levels might be attributed to its dynamic nature and the different factors regulating plasma or serum Zn levels such as stress, catabolism, hormones and food intake25.
Following low- and high-dose Zn intake (15 and 30 mg/kg ZnSO4⋅7H2O) for 4 weeks, the body weight and the serum levels of TG, glucose and leptin were significantly decreased in obese rats of both sexes compared to untreated ones. Similarly, Thoen et al.12 demonstrated that low-dose Zn supplementation (6 mg/kg) lowered adiposity, enhanced insulin sensitivity, and reduced leptin levels in obese animals. Qi et al.26 also reported that high-dose Zn supplementation (90 mg/Kg) decreased lipid accumulation, hyperglycemia and hepatic glucose production caused by HFD feeding, implying that Zn is beneficial to obese people.
It has been proposed that Zn is essential for controlling appetite and preventing obesity through its interaction with leptin hormone27. In obese mice, Liu et al.9 found a negative association between Zn and leptin levels, indicating that Zn deficiency increases leptin production and aggravates adipose tissue inflammation. Zn also acts as an insulin-mimetic through stimulating phosphorylation of one or more insulin signaling pathway components28,29. Moreover, Zn intake has been shown to reduce hyperglycemia, insulin resistance, beta-cell dysfunction, dyslipidemia and progression to diabetes30.
Recently, Zn has been reported to play a key role in the brain synaptic activity, neuronal plasticity, functions including learning and memory6. Previously, Zn deficient mice showed cognitive deficits, whereas sufficient Zn consumption in patients with Alzheimer’s disease decreased the rates of cognitive decline31. In the current research, HFD feeding led to a significant increase in acetylcholinesterase (AChE) levels and a significant reduction in brain-derived neurotrophic factor (BDNF) levels in hippocampus of male and female rats, which were reversed by both doses of Zn treatment. These findings indicate that Zn supplementation might be beneficial in improving the cognitive impairments associated with obesity.
In agreement with the present results, de Oliveira et al.32 showed that low-dose Zn treatment for 4 weeks reduced neuroinflammation and memory deficit caused by obesity. Nam et al.20 reported that administration of low Zn increased hippocampal neurogenic and synaptic marker proteins by decreasing lipid peroxidation and upregulating BDNF expression in obese mice. Moreover, higher dietary Zn intake (30 p.p.m.) was found to prevent cognitive impairments in transgenic mouse model of Alzheimer’s disease through upregulating BDNF and alleviating amyloid beta and mitochondrial dysfunction33.
Zn is a crucial factor in regulating the expression of hippocampal BDNF gene34. Zn chelators have been found to impede the processing of pro-BDNF, thereby decreasing active BDNF, impairing synapse formation and cognitive performance35. Zn treatment prevented neurotoxicity in rats through downregulation of AChE activity in cerebrum and AChE inhibitors can regulate Zn homeostasis, leading to an improvement of cognitive function36,37.
In previous studies, researchers studied the effect of excessive Zn and showed that 60 ppm of Zn aggravated obesity-induced deficits in hippocampal synaptic plasticity and neurogenesis by decreasing synaptic markers and BDNF levels20. So, further investigations are still required to determine the optimal dose and duration of supplemented Zn.
The adipokine leptin has been identified as an important regulator of hippocampal synaptic plasticity and memory4. Leptin receptors (LepRs) are expressed in the hippocampus's CA1, CA3, and dentate gyrus regions. They can activate JAK2, which phosphorylates STAT3, increasing its ability to increase transcription of genes controlling cognitive functions38.
Our findings revealed a significant downregulation of LepR expression in HFD-fed rats, but this downregulation was not significant. Meanwhile, low and high doses of Zn supplementation increased LepR expression in obese rats, suggesting that both doses of Zn treatment can modulate LepR expression in hippocampus and effectively ameliorate cognitive impairments. Surprisingly, we demonstrated that HFD-induced obesity resulted in a significant increase in hippocampal p-STAT3 levels, which was reversed by Zn treatment. Since p-STAT3 is not unique to leptin signaling, it is possible that other signaling cascades cause STAT3 to be phosphorylated. However, this requires further investigations.
In recent years, many studies have investigated the gender differences in cognitive decline. Most researchers suggested that metabolically unhealthy women are at a greater risk for dementia than men39,40. Others found that obesity, hypertension, and high adiposity increased the risk of cognitive impairment in men but not in women41. In our study, the male rats were more susceptible than females to weight gain and metabolic alterations, including increased total lipids, total cholesterol and leptin levels. In addition, we found that HFD feeding led to a greater reduction in BDNF levels and elevation in AChE activity in the hippocampus of male rats compared to females, suggesting that obese males are at a greater risk for cognitive decline. This gender disparity could be explained by estrogen's effects, which shield female rats from the HFD impact and cause less change in learning and hippocampal synaptic plasticity42.
Moreover, our findings revealed that female obese rats were more responsive to Zn treatment than males. This was manifested by the prominent increase in BDNF levels and decrease in AChE, total lipids, TC and leptin levels in obese female rats received either low or high doses of Zn.
The present results were confirmed by histopathological investigation of the hippocampal tissue. In obese male rats, extensive damage of most pyramidal neurons, cell loss of granular layers with vacuolations, and marked enlargement of pyramidal and glial cells in molecular layer were observed, indicating that deterioration of hippocampus in obese males was more severe than females. Zn treatment in obese male rats showed partial improvement in hippocampus histological structure, while Zn treatment in obese female rats resulted in a significant recovery of small and large pyramidal neurons concomitant with preservation of granular cells and the molecular layers, indicating that females were responsive to Zn treatment than males.
In conclusion, the present study provides the first evidence that low and high doses of supplemented Zn attenuate obesity-related central leptin resistance and cognitive decline. Additionally, female obese rats were more responsive to Zn treatment than male obese rats. We would recommend building up on the basis of this study findings and further exploring the ameliorative impact of Zn treatment on cognitive impairment associated with obesity. Furthermore, using silencing approach model to highlight the role of leptin signaling pathway as a mediator should be considered in future studies.
Author contributions
L.M.H. participated in formulating research topic and experimental design, performed biochemical analysis, carried out the statistical analysis of data, and revised the paper. H.M.A. suggested the research topic, participated in the experimental design, performed ELISA techniques, carried out the statistical analysis of data and data interpretation, wrote and revised the paper. N.A.M. performed histopathological analysis, wrote and revised the paper. A.S.E. participated in the experimental design, performed biochemical analysis, carried out the statistical analysis of data. A.M.N. performed data interpretation, methodology, revision. S.A.E. performed data interpretation, methodology, revision. H.M.N. performed data interpretation, methodology, revision. F.A.R.I. performed molecular experiments, participated in the experimental design, carried out the statistical analysis of data and data interpretation, wrote and revised the paper. All authors have read and approved the final paper.
Funding
Open access funding provided by The Science, Technology & Innovation Funding Authority (STDF) in cooperation with The Egyptian Knowledge Bank (EKB). This research did not receive any specific grant from funding agencies in the public, commercial, or not-for-profit sectors.
Data availability
The datasets used and/or analyzed are available from the corresponding author on reasonable request.
Competing interests
The authors declare no competing interests.
Footnotes
Publisher's note
Springer Nature remains neutral with regard to jurisdictional claims in published maps and institutional affiliations.
References
- 1.World Health Organization (WHO). Obesity and overweight https://www.who.int/news-room/fact-sheets/detail/obesity-and-overweight (WHO, 2020).
- 2.Forny-Germano L, De Felice FG, Vieira MNDN. The role of leptin and adiponectin in obesity-associated cognitive decline and Alzheimer's disease. Front. Neurosci. 2019;12:1027. doi: 10.3389/fnins.2018.01027. [DOI] [PMC free article] [PubMed] [Google Scholar]
- 3.Hamilton K, Harvey J. The neuronal actions of leptin and the implications for treating Alzheimer's disease. Pharmaceuticals. 2021;14(1):52. doi: 10.3390/ph14010052. [DOI] [PMC free article] [PubMed] [Google Scholar]
- 4.McGregor G, Harvey J. Regulation of hippocampal synaptic function by the metabolic hormone, leptin: Implications for health and neurodegenerative disease. Front. Cell. Neurosci. 2018;12:340. doi: 10.3389/fncel.2018.00340. [DOI] [PMC free article] [PubMed] [Google Scholar]
- 5.Banks WA, et al. Triglycerides cross the blood–brain barrier and induce central leptin and insulin receptor resistance. Int. J. Obes. 2018;42(3):391–397. doi: 10.1038/ijo.2017.231. [DOI] [PMC free article] [PubMed] [Google Scholar]
- 6.Choi S, Hong DK, Choi BY, Suh SW. Zinc in the brain: Friend or foe? Int. J. Mol. Sci. 2020;21(23):8941. doi: 10.3390/ijms21238941. [DOI] [PMC free article] [PubMed] [Google Scholar]
- 7.McAllister BB, Dyck RH. Zinc transporter 3 (ZnT3) and vesicular zinc in central nervous system function. Neurosci. Biobehav. Rev. 2017;80:329–350. doi: 10.1016/j.neubiorev.2017.06.006. [DOI] [PubMed] [Google Scholar]
- 8.Krall RF, Tzounopoulos T, Aizenman E. The function and regulation of zinc in the brain. Neuroscience. 2021;457:235–258. doi: 10.1016/j.neuroscience.2021.01.010. [DOI] [PMC free article] [PubMed] [Google Scholar]
- 9.Liu MJ, et al. Zinc deficiency augments leptin production and exacerbates macrophage infiltration into adipose tissue in mice fed a high-fat diet. J. Nutr. 2013;143(7):1036–1045. doi: 10.3945/jn.113.175158. [DOI] [PMC free article] [PubMed] [Google Scholar]
- 10.Fung EB, Gildengorin G, Talwar S, Hagar L, Lal A. Zinc status affects glucose homeostasis and insulin secretion in patients with thalassemia. Nutrients. 2015;7(6):4296–4307. doi: 10.3390/nu7064296. [DOI] [PMC free article] [PubMed] [Google Scholar]
- 11.Gu K, Xiang W, Zhang Y, Sun K, Jiang X. The association between serum zinc level and overweight/obesity: A meta-analysis. Eur. J. Nutr. 2019;58(8):2971–2982. doi: 10.1007/s00394-018-1876-x. [DOI] [PubMed] [Google Scholar]
- 12.Thoen RU, et al. Zinc supplementation reduces diet-induced obesity and improves insulin sensitivity in rats. Appl. Physiol. Nutr. Metab. 2019;44(6):580–586. doi: 10.1139/apnm-2018-0519. [DOI] [PubMed] [Google Scholar]
- 13.Qizilbash N, et al. BMI and risk of dementia in two million people over two decades: A retrospective cohort study. Lancet. Diabetes. Endocrinol. 2015;3(6):431–436. doi: 10.1016/S2213-8587(15)00033-9. [DOI] [PubMed] [Google Scholar]
- 14.Liu W, et al. Sex differences in the prevalence of and risk factors for nonvascular cognitive function in rural, low-income elderly in Tianjin, China. Neuroepidemiology. 2018;51(3–4):138–148. doi: 10.1159/000490496. [DOI] [PubMed] [Google Scholar]
- 15.Zhang L, et al. Relationship between adiposity parameters and cognition: The "fat and jolly" hypothesis in middle-aged and elderly people in China. Medicine. 2019;98(10):e14747. doi: 10.1097/MD.0000000000014747. [DOI] [PMC free article] [PubMed] [Google Scholar]
- 16.Guo D, et al. Sex differences in the association between obesity and cognitive impairment in a low-income elderly population in rural China: A population-based cross-sectional study. Front. Neurol. 2021;12:669174. doi: 10.3389/fneur.2021.669174. [DOI] [PMC free article] [PubMed] [Google Scholar]
- 17.The Council for International Organizations of Medical Sciences International guiding principles for biomedical research involving animals issued by CIOMS. Vet Q. 1986;8:350–352. doi: 10.1080/01652176.1986.9694068. [DOI] [PubMed] [Google Scholar]
- 18.McGrath JC, Drummond GB, McLachlan EM, Kilkenny C, Wainwright CL. Guidelines for reporting experiments involving animals: The ARRIVE guidelines. Br. J. Pharmacol. 2010;160:1573–1576. doi: 10.1111/j.1476-5381.2010.00873.x. [DOI] [PMC free article] [PubMed] [Google Scholar]
- 19.Liu CY, et al. Metabolic damage presents differently in young and early-aged C57BL/6 mice fed a high-fat diet. Int. J. Gerontol. 2016;10:105–111. doi: 10.1016/j.ijge.2015.10.004. [DOI] [Google Scholar]
- 20.Nam SM, et al. Differential effects of low- and high-dose zinc supplementation on synaptic plasticity and neurogenesis in the hippocampus of control and high-fat diet-fed mice. Neurochem. Res. 2017;42:3149–3159. doi: 10.1007/s11064-017-2353-2. [DOI] [PubMed] [Google Scholar]
- 21.Tomova R, Asenova S, Atanasova B, Tzoneva K, Slavova M. Flame atomic absorption determination of serum copper and zinc in disordered bone metabolism. Bul. Chem. Commun. 2020;52(1):76–80. [Google Scholar]
- 22.Farsani GM, Targhi FZ, Pishgahroudsari M, Mokhber S, Pazouki A. High prevalence of zinc deficiency in Iranian morbid obese patients undergoing bariatric surgery. J. Minim. Invasive. Surg. Sci. 2015;4:e33347. [Google Scholar]
- 23.Gu K, Xiang W, Zhang Y, Sun K, Jiang X. The association between serum zinc level and overweight/obesity: A meta-analysis. Eur. J. Nutr. 2019;58:2971–2982. doi: 10.1007/s00394-018-1876-x. [DOI] [PubMed] [Google Scholar]
- 24.Rios-Lugo MJ, Madrigal-Arellano C, Gaytán-Hernández D, Hernández-Mendoza H, Romero-Guzmán ET. Association of serum zinc levels in overweight and obesity. Biol. Trace. Elem. Res. 2020;198(1):51–57. doi: 10.1007/s12011-020-02060-8. [DOI] [PubMed] [Google Scholar]
- 25.Zaky DSE, et al. Zinc level and obesity. Egypt. J. Intern. Med. 2013;25:209–212. doi: 10.4103/1110-7782.124985. [DOI] [Google Scholar]
- 26.Qi Y, et al. Zinc supplementation alleviates lipid and glucose metabolic disorders induced by a high-fat diet. J. Agric. Food. Chem. 2020;68(18):5189–5200. doi: 10.1021/acs.jafc.0c01103. [DOI] [PubMed] [Google Scholar]
- 27.Miao X, Sun W, Fu Y, Miao L, Cai L. Zinc homeostasis in the metabolic syndrome and diabetes. Front. Med. 2013;7(1):31–52. doi: 10.1007/s11684-013-0251-9. [DOI] [PubMed] [Google Scholar]
- 28.Maret W. Zinc in pancreatic islet biology, insulin sensitivity, and diabetes. Prev. Nutr. Food. Sci. 2017;22(1):1–8. doi: 10.3746/pnf.2017.22.1.1. [DOI] [PMC free article] [PubMed] [Google Scholar]
- 29.Fukunaka A, Fujitani Y. Role of zinc homeostasis in the pathogenesis of diabetes and obesity. Int. J. Mol. Sci. 2018;19(2):476. doi: 10.3390/ijms19020476. [DOI] [PMC free article] [PubMed] [Google Scholar]
- 30.Ranasinghe P, et al. Zinc supplementation in prediabetes: A randomized double-blind placebo-controlled clinical trial. J. Diabetes. 2018;10(5):386–397. doi: 10.1111/1753-0407.12621. [DOI] [PubMed] [Google Scholar]
- 31.Rivers-Auty J, et al. Zinc status alters Alzheimer's disease progression through NLRP3-dependent inflammation. J. Neurosci. 2021;41(13):3025–3038. doi: 10.1523/JNEUROSCI.1980-20.2020. [DOI] [PMC free article] [PubMed] [Google Scholar]
- 32.de Oliveira S, et al. Zinc supplementation decreases obesity-related neuroinflammation and improves metabolic function and memory in rats. Obesity. 2021;29(1):116–124. doi: 10.1002/oby.23024. [DOI] [PubMed] [Google Scholar]
- 33.Corona C, et al. Dietary zinc supplementation of 3xTg-AD mice increases BDNF levels and prevents cognitive deficits as well as mitochondrial dysfunction. Cell. Death. Dis. 2010;1:e91. doi: 10.1038/cddis.2010.73. [DOI] [PMC free article] [PubMed] [Google Scholar]
- 34.Hu YD, Pang W, He CC, Lu H, Liu W, Wang ZY. The cognitive impairment induced by zinc deficiency in rats aged 0 approximately 2 months related to BDNF DNA methylation changes in the hippocampus. Nutr. Neurosci. 2017;20(9):519–525. doi: 10.1080/1028415X.2016.1194554. [DOI] [PubMed] [Google Scholar]
- 35.Frazzini V, et al. The pharmacological perturbation of brain zinc impairs BDNF related signaling and the cognitive performances of young mice. Sci. Rep. 2018;8:9768. doi: 10.1038/s41598-018-28083-9. [DOI] [PMC free article] [PubMed] [Google Scholar]
- 36.Lu H, et al. Optimal dose of zinc supplementation for preventing aluminum-induced neurotoxicity in rats. Neural. Regen. Res. 2013;8(29):2754–2762. doi: 10.3969/j.issn.1673-5374.2013.29.007. [DOI] [PMC free article] [PubMed] [Google Scholar]
- 37.Giacconi R, et al. Acetylcholinesterase inhibitors in Alzheimer's disease influence zinc and copper homeostasis. J. Trace Elem. Med Biol. 2019;55:58–63. doi: 10.1016/j.jtemb.2019.06.001. [DOI] [PubMed] [Google Scholar]
- 38.Sharma M, Hölscher C. The neurophysiological and neuroprotective effects of leptin. JSM. Alzheimers. Dis. Relat. Dement. 2014;1:1009. [Google Scholar]
- 39.Chatterjee S, et al. Type 2 diabetes as a risk factor for dementia in women compared with men: A pooled analysis of 2.3 million people comprising more than 100,000 cases of dementia. Diabetes Care. 2016;39:300–307. doi: 10.2337/dc15-1588. [DOI] [PMC free article] [PubMed] [Google Scholar]
- 40.Gannon OJ, Robison LS, Custozzo AJ, Zuloaga KL. Sex differences in risk factors for vascular contributions to cognitive impairment & dementia. Neurochem. Int. 2019;127:38–55. doi: 10.1016/j.neuint.2018.11.014. [DOI] [PubMed] [Google Scholar]
- 41.Kanaya AM, et al. Total and regional adiposity and cognitive change in older adults: The Health, Aging and Body Composition (ABC) study. Arch. Neurol. 2009;66(3):329–335. doi: 10.1001/archneurol.2008.570. [DOI] [PMC free article] [PubMed] [Google Scholar]
- 42.Hwang LL, et al. Sex differences in high-fat diet-induced obesity, metabolic alterations and learning, and synaptic plasticity deficits in mice. Obesity. 2010;18:463–469. doi: 10.1038/oby.2009.273. [DOI] [PubMed] [Google Scholar]
Associated Data
This section collects any data citations, data availability statements, or supplementary materials included in this article.
Data Availability Statement
The datasets used and/or analyzed are available from the corresponding author on reasonable request.


