Abstract
Despite diagnostic and therapeutic methods, cancer is a major cause of death worldwide. Since anticancer drugs affect both normal and cancer cells, targeted drug delivery systems can play a key role in reducing the destructive effects of anticancer drugs on normal cells. In this regard, the use of stimulus-sensitive polymers has increased in recent years. This study has attempted to investigate interaction of the anticancer drug cytarabine with a stimuli-sensitive polymer, human serum albumin (HSA), one of the most abundant protein in blood plasma, via computational methods at both body temperature and tumor temperature. For this purpose, molecular docking was performed using Molegro virtual Docker software to select the best ligand in terms of binding energy to simulate molecular dynamics. Then, molecular dynamics simulation was performed on human serum albumin with code (1Ao6) and cytarabine with code (AR3), using Gromacs software and the results were presented in the graphs. The simulations were performed at 310 K (normal cell temperature) and 313 K (cancer cell temperature) in 100 ns. Results showed drug release occurred at a temperature of 313 K. These findings demonstrated the sensitivity of human serum albumin to temperature.
Keywords: Human serum albumin, Cytarabine, Targeted drug delivery, Molecular dynamics simulation, Molecular docking
Introduction
Cancer is caused by a defect in oncogenes and tumor suppressor genes that can affect abnormal cell growth and increase cell division [1–4]. Diagnosis and treatment of cancer are possible by stabilizing cell growth and correcting the damaging mechanisms of genes, cutting off blood supply to cells or destroying them [5, 6]. Common methods of cancer diagnosis are performed by X-ray, CT scan, or cell biopsy, which is not very sensitive [7]. Because the cancer diagnosis in the early stages is very important in cancer treatment, these methods are not effective [8]. Therefore, the use of nanotechnology in the diagnosis and treatment of cancer has increased greatly in recent decades. Nanostructures, like quantum dots, are nanoscale devices that have the ability to enter multimicron cells and access DNA molecules for identification of genetic defense in high sensitivity [9]. Nanotechnology can target specific cells and deliver drugs to destroy them by producing therapeutic tools. Therefore, the two main advances in nanotechnology in chemotherapy are the detection of cancer cells and the ability of nanoparticles to reach the tumor site [10, 11]. At the nanoscale, particles act so that the properties of materials change and show special optical, electronic, and structural properties [12, 13]. In modern drug delivery, using these features, nanoparticles are engineered to deliver high doses of the drug to the tumor site without damaging normal cells [14].
In recent years, there has been significant growth in the development of delivery systems based on stimulus-responsive polymers [15]. These polymers can convert the effect of a stimulus into a response. Some of these polymers can respond to several stimuli [16–18]. In addition, their structural properties, such as their flexibility and resemblance to the body’s natural tissues, and the presence of numerous functional groups have made them very important carriers [19–21]. Albumin is also a stimulus-responsive protein that has been used as a carrier in this study. Human serum albumin (HSA) is a transport protein and the most abundant protein in the blood serum, which has received much attention since the early twentieth century [15, 22–24]. HSA consists of a 585-amino acid polypeptide sequence of distinct sequence, of which 17 pairs of disulfide bridges are free cysteine and tryptophan. It consists of three identical alpha spiral subdomains (I, II, and III). In addition, a domain has two subdomains marked with A and B [25–28]. It has ~ 67 kDa weight and its average half-life under normal conditions is 19 days [29]. This half-life converts albumin into an attractive carrier to enhance and improve the pharmacokinetic properties of cancer agents [30–35]. In addition to being the most important transporter of fatty acids and drugs, this protein also acts as a catalyst in the hydrolysis of esters and hopes and phosphates [36, 37]. In addition, albumin itself has a therapeutic role and is used in various formulations to carry pharmacological and diagnostic agents [38]. Furthermore, there are other benefits, including [23, 39, 40]: (i) it is the most important protein of blood plasma, so it has special physiological importance and many functions; (ii) because there are large amounts of it in the body, therefore, if a significant amount of it is injected into the body, it will not cause any side effects; (iii) albumin is extracted from the blood of blood donors, so its source is easy to access; and (iv) albumin is nontoxic and biocompatible. When broken down in the body, its building blocks, the amino acids, are used by the surrounding tissues to make protein. (v) Due to different functional groups, it is possible to bind to significant amounts of the drug; (vi) it is an acidic, highly soluble, desirable surface modification characteristics, stable protein, and it is very flexible. This feature is an important advantage in the physiological environment and outside the body.
The drug examined in this study is cytarabine (cytosine arabinoside, Ara-C,1–3-D arabinofuranosylcytosine) which was synthesized in 1959 [41]. The structure of cytarabine is shown in Fig. 1. Cytarabine with the molecular formula C9H13N3O5, is an anticancer drug that is mostly used in treating leukemia [42, 43]. It is a modified analog of the cytidine metabolite with a modified sugar moiety (arabinose instead of ribose) [44]. Cytarabine is converted to intracellular triphosphate and competes with cytidine to combine with DNA [45]. Because arabinose sugar three dimensionally prevents the molecule from circulating inside DNA, DNA replication stops, especially in the S phase of the cell cycle. As a result, it reduces DNA replication and repair [44–49].
Fig. 1.
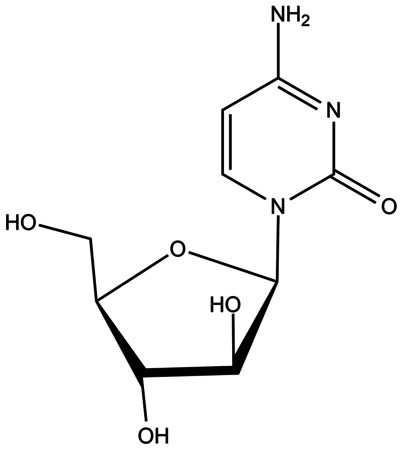
The molecular structure of cytarabine
In this study, we investigate the interaction of the anticancer drug cytarabine using computational methods at both body temperature and tumor temperature. The computational techniques used in this work are molecular docking and molecular dynamics simulation. In recent years, these methods were also applied to discover the interaction of drug with proteins of coronavirus-2 (SARS CoV-2). [50–54].
Theoretical section
We have determined the pharmacokinetic characteristic (ADMET) for cytarabine including absorption, distribution, metabolism, excretion, and toxicity via the pkCSM (predicting small-molecule pharmacokinetic properties via graph-based signatures) website [55]. These data are given in Table 1.
Table 1.
The properties of ADMET for cytarabine
| Properties | Units | |
|---|---|---|
| Absorption | ||
| Water solubility | − 1.689 | Numeric (log mol/L) |
| Caco2 permeability | 0.025 | Numeric (log Papp in 10–6 cm/s) |
| Intestinal absorption (human) | 43.155 | Numeric (% absorbed) |
| Skin Permeability | − 2.745 | Numeric (log Kp) |
| P-glycoprotein substrate | No | Categorical (yes/no) |
| P-glycoprotein I inhibitor | No | Categorical (yes/no) |
| P-glycoprotein II inhibitor | No | Categorical (yes/no) |
| Distribution | ||
| VDss (human) | − 0.025 | Numeric (log L/kg) |
| Fraction unbound (human) | 0.765 | Numeric (Fu) |
| BBB permeability | − 0.97 | Numeric (log BB) |
| CNS permeability | -4.023 | Numeric (log PS) |
| Metabolism | ||
| CYP2D6 substrate | No | Categorical (yes/no) |
| CYP3A4 substrate | No | Categorical (yes/no) |
| CYP1A2 inhibitor | No | Categorical (yes/no) |
| CYP2C19 inhibitor | No | Categorical (yes/no) |
| CYP2C9 inhibitor | No | Categorical (yes/no) |
| CYP2D6 inhibitor | No | Categorical (yes/no) |
| CYP3A4 inhibitor | No | Categorical (yes/no) |
| Excretion | ||
| Total clearance | 0.562 | Numeric (log mL/min/kg) |
| Renal OCT2 substrate | No | Categorical (yes/no) |
| Toxicity | ||
| AMES toxicity | No | Categorical (yes/no) |
| Max. tolerated dose (human) | 1.108 | Numeric (log mg/kg/day) |
| hERG I inhibitor | No | Categorical (Yes/No) |
| hERG II inhibitor | No | Categorical (Yes/No) |
| Oral rat acute toxicity (LD50) | 2.196 | Numeric (mol/kg) |
| Oral rat chronic toxicity (LOAEL) | 2.85 | Numeric (log mg/kg_bw/day) |
| Hepatotoxicity | No | Categorical (yes/no) |
| Skin sensitization | No | Categorical (yes/no) |
| T. pyriformis toxicity | 0.284 | Numeric (log µg/L) |
| Minnow toxicity | 3.675 | Numeric (log mM) |
The structure of human serum albumin protein (HSA) with code (1AO6) was obtained from the Protein Data Bank (http://www.rcsb.org/pdb). In addition, the drug structure under study was also received from the Drug Bank database with the code (AR3). Crystalline water molecules were removed from the protein structure, and protein and drug files were given to the Molegro Virtual Docker software for molecular docking. Using molecular docking, cases such as the binding energy and the important residues of the protein involved in the binding and the interaction modes between a ligand and protein can be investigated [56].
After the docking calculation, the generated files are displayed in the poses all sections. Among them, the conformation with the lowest binding energy (negative energy) was selected as the input to simulate molecular dynamics. In this study, the Gromacs 19.1 package (www.gromacs.org) was used throughout the simulation. Amber03 force field was selected, and the drug topology was received from the ACPYPE server (http://webapps.ccpn.ac.uk/acpype). The simulation box was designed as a cuboid of 13.879 × 13.879 × 13.879 nm3. The protein has been placed at the center of the box; the box was filled with water molecules. Minimizing energy is an important step in improving molecular structures before molecular dynamics simulation. Equilibration was performed in canonical (NVT) and isothermal–isobaric (NPT) ensembles with a step number of 500,000 for 1 ns. Then, the production step was performed with step number 50,000,000 for 100 ns. Finally, the leap-frog algorithm was used to solve the equations of motion. All stages were examined at two different temperatures 310 K and 313 K, with a Brendsen thermostat.
Results and discussions
Molecular docking
Molecular docking of human serum albumin code 1Ao6 with anticancer drug cytarabine code AR3 was performed after selecting 5 holes of protein and minimizing the system.At the end of the docking tab, the poses all sections of the results were reported in Table 2.
Table 2.
Results of molecular docking
| S. no | Mol Dock score (GRID) (kJ mol−1) |
Mol Dock score (kJ mol−1) |
Rerank score (kJ mol−1) |
|---|---|---|---|
| 1 | − 67.0796 | − 63.2161 | − 57.6600 |
| 2 | − 62.9607 | − 59.1377 | − 51.7849 |
| 3 | − 62.9465 | − 53.6164 | − 42.1171 |
| 4 | − 62.8334 | − 60.0685 | − 54.4448 |
| 5 | − 61.8851 | − 52.3829 | − 50.3197 |
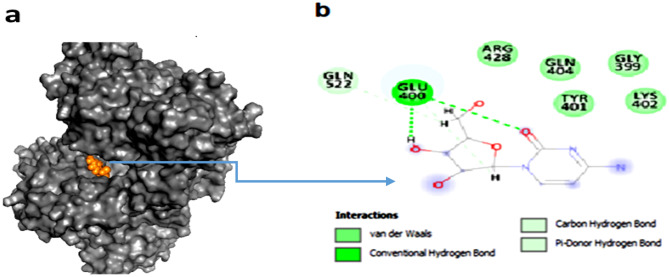
According to these results, the ligand named [00] c_1 [A].mol2 has shown a docking score of − 63.2161 kJ mol−1 (Table 2) and has the lowest binding energy and is located in part IIIA of the protein. So, this ligand was used for simulation. Figure 2 shows the complex created after docking. The ligand is located in the most suitable protein cavity with the lowest binding energy. Figure 2b indicates that GLU 400, LEU 398, GLN 404, ARG 428, LYS 402, TYR 401, GLY 399, GLN 526, and GLN 522 of the HSA protein take part in hydrogen and van der Waals bonds with the cytarabine atoms.
Fig. 2.
a Complex created after molecular docking. b Hydrogen and van der Waals bonds that formed between ligand and protein after docking of two molecules
Molecular dynamics simulation
At first, in order to evaluate the stability of HSA protein structures at 310 K and HSA–cytarabine complex at 310 K and 313 K in simulation media, the mean squared deviation analysis (RMSD) was calculated (Fig. 3). This calculation is the most reliable method of molecular dynamics simulation analysis and a criterion for the measure of the structural system's stability [57]. Figure 3 shows the RMSD diagram for protein at 310 K and the cytarabine protein complex at 310 K and 313 K. The slope of the diagram indicates the stability of the system during the simulation. An increase in the slope of the RMSD diagram from zero shows that the simulated model is unstable.
Fig. 3.
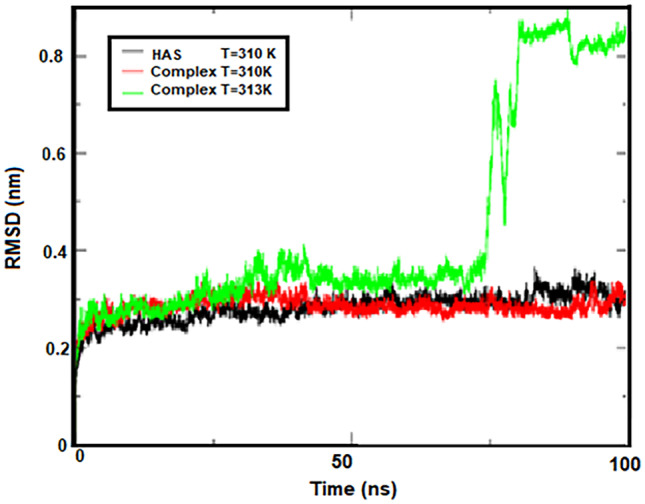
RMSD for protein at 310 K and complex protein at 310 K and 313 K
Most of the RMSD diagram changes during simulation for the HSA–cytarabine complex are at 313 K, which is in the range between 1.5 and 9 Å.
For HSA protein systems and the HSA-cytarabine complex at 310 K, these changes have been observed in the range of 1.5 to 3.5 Å. As can be seen from Fig. 3, the HSA protein and the HSA–cytarabine complex reached to equilibrium at 310 K at 5 ns at the beginning of the simulation. The RMSD diagram of the HSA–cytarabine complex increases at 313 K over time and undergoes abrupt changes at 75 ns, indicating that the complex is unstable at temperatures close to the temperature of the tumor and that cytarabine is isolated from the protein.
The motions of the HSA protein and HSA–cytarabine complex at 310 K and 313 K were analyzed using mean square root (RMSF) (Fig. 4). As shown in Fig. 4, the overall motions of the HSA protein and the complex at 310 K are very similar. Fluctuations for these two structures are observed in the range of 0.08 to 0.4 nm. The results clearly show that subdomains IIB and IIIB of the HSA protein have the most fluctuations, while subdomains IIA and IIIA have the least fluctuations. These results indicate that at the junction of cytarabine (IIIA) with human serum albumin at body temperature (310 K), a good interaction occurred and the drug remained in place during rigid simulation. Fluctuations related to the HSA–cytarabine complex at abnormal cell temperature (313 K) have occurred in the range of 0.08 to 0.5 nm. This indicates the instability of the HSA-cytarabine complex at 313 K and confirms the results of the RMSD analysis.
Fig. 4.
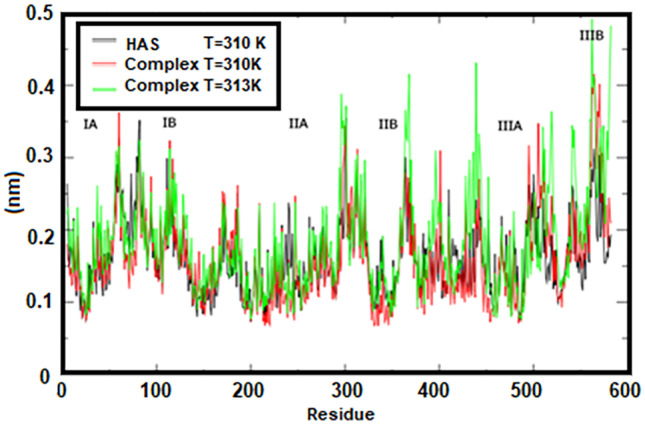
RMSF for protein at 310 K and complex protein at 310 K and 313 K by number of amino acids
Gyrus radius (Rg) is one of the useful analyses obtained from the results of molecular dynamics simulations and has been selected as the first criterion to study the three-dimensional structure of the studied systems, because it can be directly compared to laboratory results. Furthermore, for large molecules such as proteins, the Rg is a good measure of the opening or closing branches. For example, the Rg value for HSA protein, which was experimentally measured in an aqueous solution, was reported to be 27.4 ± 0.34 Å [48].
In the present study, the Rg value for HSA protein was calculated to be 26.8 Å. This good agreement between theory and experiment indicates the accuracy of this work (MD) compared to the laboratory work. The evolution of the Rg diagrams during the simulation steps is shown in Fig. 5. Also, the Rg diagrams of the HSA protein and the complex at 310 K is in the agreement with the RMSD results and the stability of the systems. The results of these two graphs indicate the ineffectiveness of cytarabine on the structural change in HSA protein. According to the Fig. 5, it can be seen that the HSA–cytarabine complex at 313 K in 75 ns has a significant increase in the Rg, which indicates the separation of cytarabine from the HSA protein.
Fig. 5.
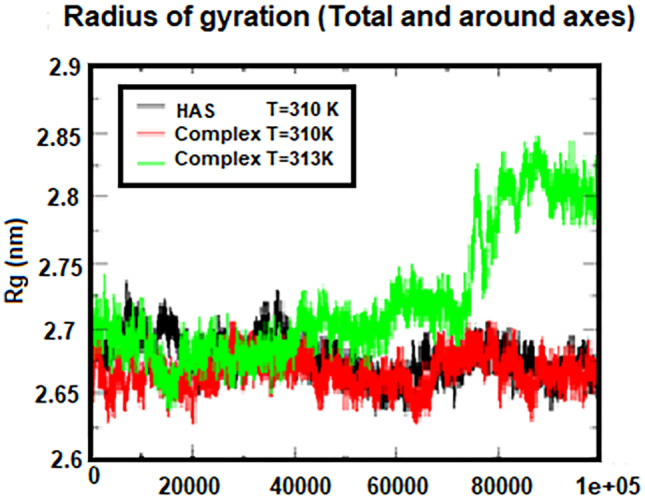
The Rg corresponds to protein at 310 K and a complex at two temperatures of 310 K and 313 K
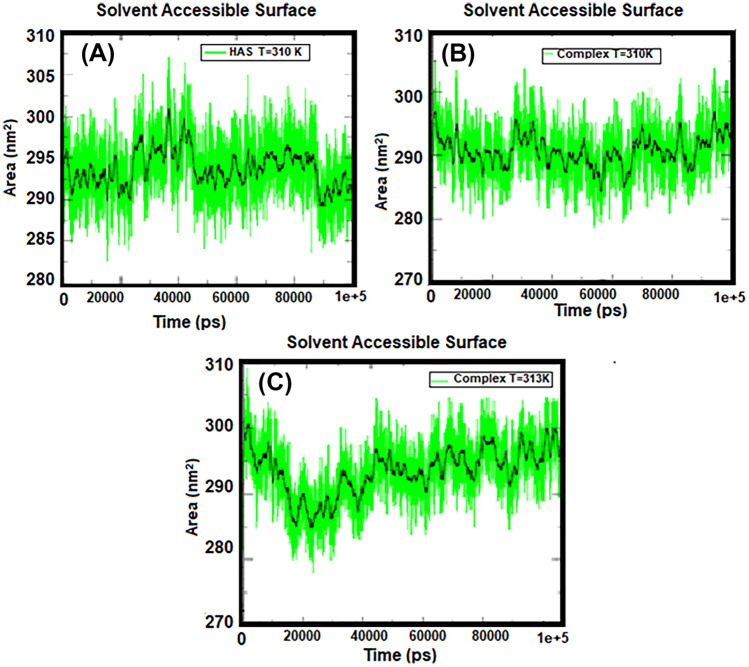
Solvent-achievable level specifies the level of a group that is accessible to the solvent. To quantify the effect of cytarabine on HSA protein during the MD simulation process, the available surface solubility (SASA) changes over time. Figure 6 shows the amount of SASA for protein at body temperature and complex at both body temperature and tumor temperature. According to Fig. 6, the amount of SASA in the HSA protein is higher than that of the HSA-cytarabine complex at 310 K, meaning that the HSA protein is gradually exposed to the solvent in the presence of cytarabine, but the access of HSA to the solvent is increased at 313 K, indicating that cytarabine is separated from albumin.
Fig. 6.
Diagram of solvent availability level for A HSA protein at 310 K, B complex at 310 K, and C complex at 313 K
The number of hydrogen bonds and the distance between two centers of mass in protein and drug are shown in Figs. 7 and 8. According to these figures, the number of hydrogen bonds was almost constant during the simulation, but fluctuations were observed in the two regions related to the temperature of 313 K. Figure 7 shows with an increasing simulation time from 45 to 65 ns, the number of hydrogen bonds increased, and between 75 and 80 ns, the number of bonds reached zero, indicating that the protein was moving away from the drug. According to the distance diagram in Fig. 8, a long peak is observed in the time interval of 75 to 80 ns, which indicates that the protein and the drug are separated. But at other times, the distance between the protein and the drug is a constant value, about 0.2 nm. These results are in good agreement with the results of the number of hydrogen bonds in Fig. 7. According to these two charts, cytarabine as a drug is properly bound to human serum albumin at body temperature, creating a stable complex. However, at 313 K, albumin separates from cytarabine at intervals, which means that the drug is released into the cancer cell at the temperature of the tumor.
Fig. 7.
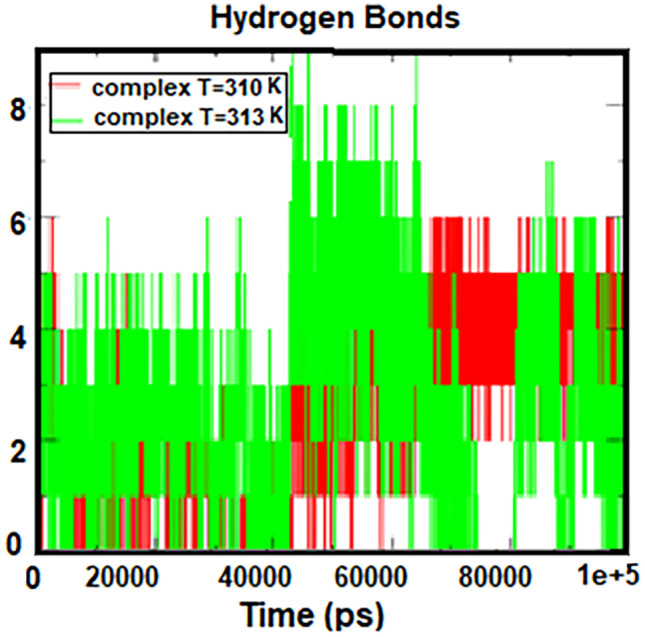
Number of hydrogen bonds formed between HSA and cytarabine at 310 K and 313 K
Fig. 8.
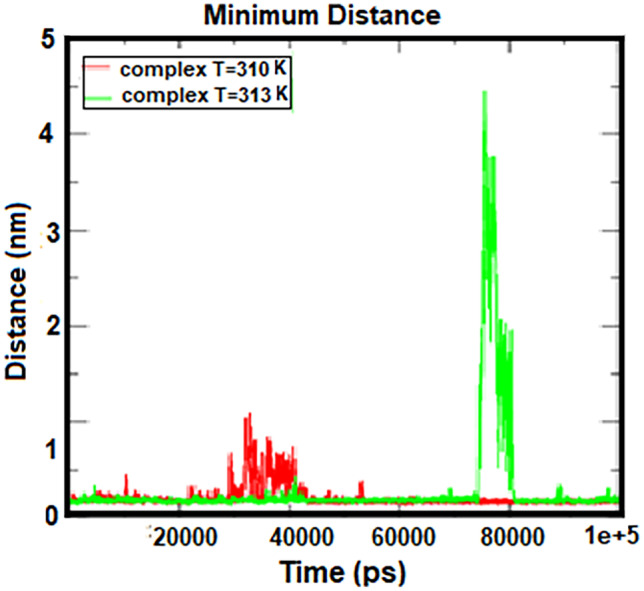
Distance between two centers of mass in HSA and cytarabine at 310 K and 313 K
The relative binding free energies calculated for the HSA–cytarabine system at temperatures of 310 K and 313 K are estimated by the molecular mechanics Poisson–Boltzmann surface area (MMPBSA)(https://valdes-tresanco-ms.githud.io/gmx_MMPBSA/installation/hth!) method at the final 25 ns of the simulation. This method (MMPBSA) is widely used to calculate the binding free energy between small ligands and biomacromolecules. The various component of this energy is reported in Table 3. Table 3 shows the relative energy conditions for the system. Free energy in general in the connection of the HSA–cytarabine system with a temperature of 310 K, 35.6 kJ mol−1 is found to be due to electrostatics and van der Waals. According to the calculated results, the share of van der Waals force in the binding energy is low and electrostatic interactions are the main driving force in the process of binding cytarabine to HSA. The overall change in the energy of the system is negative and indicates the stability of the set. The electrostatic and van der Waals energies are significantly reduced at 313 K compared to 310 K, and the total energy of the HSA–cytarabine system is positive at 313 K, indicating the release of the drug at tumor temperature.
Table 3.
Calculation of the binding free energies by the MMPBSA method
| Temperature (K) | Vdw. energy (kJ mol−1) | Elec. energy (kJ mol−1) | Total energy (kJ mol−1) |
|---|---|---|---|
| 310 | − 9.24 | − 26.4 | − 35.6 |
| 313 | − 7.06×10⁻³ | 0.0954 | 0.0953 |
Occupancy analysis was performed for the success of the results of the mentioned graphs and tables. Tables 4 and 5 show the occupancy of amino acids by ligand atoms at 310 K and 313 K, respectively. The first column shows the amino acids of albumin that bonded to the ligand atoms.
Table 4.
Occupancy analysis for HSA–cytarabine complex at 310 K
| Donor–acceptor | Atom number | Occupancy (%) |
|---|---|---|
| LIG-396GLU | 18,282–6181 | 15.2 |
| LIG-400GLU | 18,259–6237 | 22.6 |
| LIG-400GLU | 18,259–6236 | 24.4 |
| LIG-396GLU | 18,271–6179 | 23.6 |
| LIG-396GLU | 18,271–6178 | 29.1 |
| LIG-395PHE | 18,271–6166 | 47.7 |
| LIG-400GLU | 6226–18,247 | 49.2 |
| LIG-400GLU | 6226–18,245 | 29.5 |
Table 5.
Occupancy analysis for HSA–cytarabine complex at 313 K
| Donor–acceptor | Atom number | Occupancy (%) |
|---|---|---|
| LIG-549ASP | 8642–18,271 | 10.9 |
| LIG-549ASP | 8641–18,271 | 10.8 |
| LIG-540THR | 8492 –18,258 | 12.3 |
| LIG-540THR | 8482–18,261 | 17.7 |
| LIG-413LYS | 6474–18,254 | 12.4 |
| LIG-413LYS | 6474–18,247 | 11.2 |
| LIG-410ARG | 6418–18,245 | 11.0 |
| LIG-410ARG | 6412–18,247 | 15.2 |
| LIG-410ARG | 6412–18,245 | 11.6 |
The software has a default set number for each of these atoms, shown in the second column. The third column shows the percentage of amino acids occupied by the ligand atoms. Comparing the percentage of occupancy at 313 K and 310 K, it is concluded that amino acids are less occupied by ligand atoms at tumor temperature, indicating that the ligand is separated from the protein at this temperature.
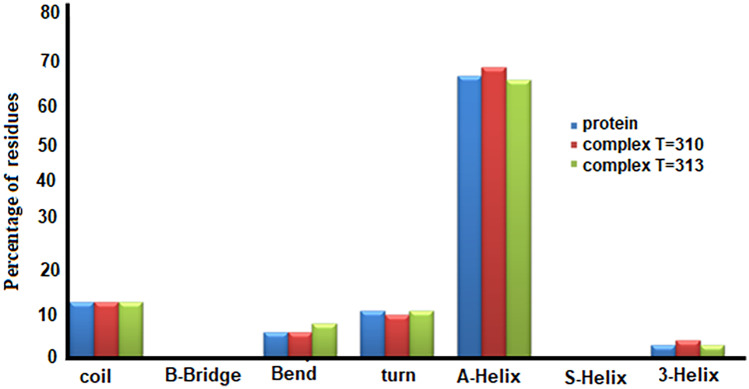
Figure 9 shows the probability of formation of different protein structures in albumin and albumin–cytarabine complexes at temperatures of 310 K and 313 K. The horizontal axis shows the content of various possible protein structures, including Coil, β-sheet, and Bridge-β. As can be seen from Fig. 9, the formation of 5-Helix and Bridge-β is not possible in all three cases, and the structure of α-helix, which is a very important component in the secondary structure of the protein, can be changed in the presence of cytarabine and at different temperatures has no observations.
Fig. 9.
Percentage of formation of different protein structures in albumin and albumin–cytarabine complexes at two temperatures of 310 K and 313 K
Conclusion
Examination of the simulation results shows that the ligand and protein form a stable and acceptable complex by creating hydrogen bonds and a suitable distance from each other, and the stability of the complex is maintained until the end of the simulation time at body temperature (310 K). In this work, a human serum albumin is a viable option for transporting cytarabine to cancer cells. Because the HSA–cytarabine complex becomes unstable at a temperature of 313 K, the opening of the protein and the reduction of hydrogen bonds occur, resulting in the distance between the drug and the protein. Therefore, it can be concluded that the drug was released at the temperature associated with the cancerous tumor (313 K). Furthermore, we showed human serum albumin is a temperature-sensitive polymer.
Author contribution
M. Amirinasab: conceptualization, software, methodology, formal analysis, analysis and interpretation of data, and drafting the article. M. Dehestani: investigation, validation, visualization, and writing—review and editing. All authors have given approval to the revised final version of the manuscript.
Availability of data and materials
The datasets generated during and/or analyzed during the current study are available within the article.
Code availability
This is not applicable.
Declarations
Competing interests
The authors declare no competing interests.
Footnotes
Publisher's Note
Springer Nature remains neutral with regard to jurisdictional claims in published maps and institutional affiliations.
Contributor Information
Maryam Amirinasab, Email: ma.amiri.r@gmail.com.
Maryam Dehestani, Email: dehestani@uk.ac.ir.
References
- 1.Bray F, Ferlay J, Soerjomataram I, Siegel RL, Torre LA, Jemal A. CA Cancer J Clin. 2018;68:394–424. doi: 10.3322/caac.21492. [DOI] [PubMed] [Google Scholar]
- 2.Nguyen KT. J Nanomed Nanotech. 2011;2:103e. doi: 10.4172/2157-7439.1000103e. [DOI] [Google Scholar]
- 3.Bharali DJ, Mousa SA. Pharm Ther. 2010;128:324–335. doi: 10.1016/j.pharmthera.2010.07.007. [DOI] [PubMed] [Google Scholar]
- 4.Senapati S, Mahanta AK, Kumar S, Maiti P. Signal Transduct Target Ther. 2018;3:1–19. doi: 10.1038/s41392-017-0004-3. [DOI] [PMC free article] [PubMed] [Google Scholar]
- 5.Das SK, Menezes ME, Bhatia S, Wang XY, Emdad L, Sarkar D, Fisher PB. J Cell Physiol. 2015;230:259–271. doi: 10.1002/jcp.24791. [DOI] [PMC free article] [PubMed] [Google Scholar]
- 6.Mousa SA, Bharali DJ. Cancers. 2011;3:2888–2903. doi: 10.3390/cancers3032888. [DOI] [PMC free article] [PubMed] [Google Scholar]
- 7.Frangioni JV. J Clin Oncol. 2008;26:4012–4021. doi: 10.1200/JCO.2007.14.3065. [DOI] [PMC free article] [PubMed] [Google Scholar]
- 8.Zaimy MA, Saffarzadeh N, Mohammadi A, Pourghadamyari H, Izadi P, Sarli A, Moghaddam LK, Paschepari SR, Azizi H, Torkamandi S, Tavakkoly-Bazzaz J. Cancer Gene Ther. 2017;24:233–243. doi: 10.1038/cgt.2017.16. [DOI] [PubMed] [Google Scholar]
- 9.Khan I, Saeed K, Khan I. Arab J Chem. 2019;12:908–931. doi: 10.1016/j.arabjc.2017.05.0. [DOI] [Google Scholar]
- 10.Rajabi M, Srinivasan M, Mousa SA (2016) Nanobiomaterials in drug delivery, Elsevier Inc, pp. 1–37
- 11.Peer D, Karp JM, Hong S, Farokhzad OC, Margalit R, Langer R. Nat Nanotech. 2007;2:751–760. doi: 10.1038/nnano.2007.387. [DOI] [PubMed] [Google Scholar]
- 12.Praetorius NP, Mandal TK. Recent Pat Drug Deliv Formul. 2007;1:37–51. doi: 10.2174/187221107779814104. [DOI] [PubMed] [Google Scholar]
- 13.Park K. J Control Release. 2007;120:1–3. doi: 10.1016/j.jconrel.2007.05.003. [DOI] [PMC free article] [PubMed] [Google Scholar]
- 14.Yih TC, Al-Fandi M. J Cell Biochem. 2006;97:1184–1190. doi: 10.1002/jcb.20796. [DOI] [PubMed] [Google Scholar]
- 15.Chatterjee S, Hui PC. Molecules. 2019;24:2547–2554. doi: 10.3390/molecules24142547. [DOI] [PMC free article] [PubMed] [Google Scholar]
- 16.Schattling P, Jochum FD, Theato P. Polym Chem. 2014;5:25–36. doi: 10.1039/C3PY00880K. [DOI] [Google Scholar]
- 17.Alsuraifi A, Curtis A, Lamprou DA, Hoskins C. Pharmaceutics. 2018;10:136–217. doi: 10.3390/pharmaceutics10030136. [DOI] [PMC free article] [PubMed] [Google Scholar]
- 18.Ding C, Tong L, Feng J, Fu J. Molecules. 2016;21:1715. doi: 10.3390/molecules21121715. [DOI] [PMC free article] [PubMed] [Google Scholar]
- 19.MacEwan SR, Callahan DJ, Chilkoti A. Nanomedicine. 2010;5:793–806. doi: 10.2217/nnm.10.50. [DOI] [PMC free article] [PubMed] [Google Scholar]
- 20.Kost J, Langer R. Adv Drug Deliv Rev. 2001;46:125–148. doi: 10.1016/S0169-409X(00)00136-8. [DOI] [PubMed] [Google Scholar]
- 21.Torchilin VP. Nat Rev Drug Discov. 2014;13:813–827. doi: 10.1038/nrd4333. [DOI] [PMC free article] [PubMed] [Google Scholar]
- 22.Klouda L, Mikos AG. Eur J Pharm Biopharm. 2008;68:34–45. doi: 10.1016/j.ejpb.2007.02.025. [DOI] [PMC free article] [PubMed] [Google Scholar]
- 23.Langer K, Balthasar S, Vogel V, Dinauer N, von Briesen H, Schubert D. Int J Pharm. 2003;257:169–180. doi: 10.1016/s0378-5173(03)00134-0. [DOI] [PubMed] [Google Scholar]
- 24.N' soukpoe-Kossi CN St-Louis C, Beauregard M, Subirade M, Carpentier R, Hotchandani S, Tajmir-Riahi HA. J Biomol Struct Dyn. 2006;24:277–283. doi: 10.1080/07391102.2006.10507120. [DOI] [PubMed] [Google Scholar]
- 25.Jahanban-Esfahlan A, Dastmalchi S, Davaran S. Int J Biol Macromol. 2016;91:703–709. doi: 10.1016/j.ijbiomac.2016.05.032. [DOI] [PubMed] [Google Scholar]
- 26.Roy A, Seal P, Sikdar J, Banerjee S, Haldar R. J Biomol Struct Dyn. 2018;36:387–397. doi: 10.1080/07391102.2017.1278721. [DOI] [PubMed] [Google Scholar]
- 27.Salci A, Toprak M. J Biomol Struct Dyn. 2017;35:8–16. doi: 10.1080/07391102.2015.1128357. [DOI] [PubMed] [Google Scholar]
- 28.Silva D, Cortez CM, Cunha-Bastos J, Louro SRW. Toxicol Lett. 2004;147:53–61. doi: 10.1016/j.toxlet.2003.10.014. [DOI] [PubMed] [Google Scholar]
- 29.Kratz F. J Control Release. 2008;132:171–183. doi: 10.1016/j.jconrel.2008.05.010. [DOI] [PubMed] [Google Scholar]
- 30.Xu L, Hu YX, Li J, Liu YF, Zhang L, Ai HX, Liu HS. J Photochem Photobiol B. 2017;173:187–195. doi: 10.1016/j.jphotobiol.2017.05.039. [DOI] [PubMed] [Google Scholar]
- 31.Rahnama E, Mahmoodian-Moghaddam M, Khorsand-Ahmadi S, Saberi MR, Chamani J. J Biomole Struct Dyn. 2015;33:513–533. doi: 10.1080/07391102.2014.893540. [DOI] [PubMed] [Google Scholar]
- 32.Sleep D. Expert Opin Drug Deliv. 2015;12:793–812. doi: 10.1517/17425247.2015.993313. [DOI] [PubMed] [Google Scholar]
- 33.Peters JrT (1995) All about albumin: biochemistry, genetics, and medical applications, 1st edition, Academic Press; 1st edition
- 34.Neumann E, Frei E, Funk D, Becker MD, Schrenk H-H, Muller-Ladner U, Fiehn C. Expert Opin Drug Deliv. 2010;7:915–925. doi: 10.1517/17425247.2010.498474. [DOI] [PubMed] [Google Scholar]
- 35.Hoogenboezem EN, Duvall CL. Adv Drug Deliv Rev. 2018;130:73–89. doi: 10.1016/j.addr.2018.07.011. [DOI] [PMC free article] [PubMed] [Google Scholar]
- 36.Charbon V, Latour I, Lambert DM, Buc-Calderon P, Neuvens L, De Keyser JL. Pharm Res. 1996;13:27–31. doi: 10.1023/a:1016012913664. [DOI] [PubMed] [Google Scholar]
- 37.Wolfrum C, Shi S, Jayaprakash KN, Jayaraman M, Wang G, Pandey RK, Rajeev KG, Nakayama T, Charrise K, Ndungo EM, Zimmermann T, Koteliansky V, Manoharan M, Stoffel M. Nat Biotechnol. 2007;25:1149–1157. doi: 10.1038/nbt1339. [DOI] [PubMed] [Google Scholar]
- 38.Karimi M, Bahrami S, Baghaee Ravari S, Sahandi Zangabad P, Mirshekari H, Bozorgomid M, Shahreza S, Sori M, Hamblin MR. Expert Opin Drug Deliv. 2016;13:1609–1623. doi: 10.1080/17425247.2016.1193149. [DOI] [PMC free article] [PubMed] [Google Scholar]
- 39.Peters T., Jr Adv Protein Chem. 1985;37:161–245. doi: 10.1016/S0065-3233(08)60065-0. [DOI] [PubMed] [Google Scholar]
- 40.Yokoyama M, Okano T. Adv Drug Deliv Rev. 1996;21:77–80. doi: 10.1016/S0169-409X(96)00439-5. [DOI] [Google Scholar]
- 41.Walwick ER, Dekker CA, Roberts WK. Proc Chem Soc Lond. 1959;3:84. doi: 10.1039/PS9590000073. [DOI] [Google Scholar]
- 42.Adamson PC. CA Cancer J Clin. 2015;65:212–220. doi: 10.3322/caac.21273. [DOI] [PMC free article] [PubMed] [Google Scholar]
- 43.Malani D, Murumägi A, Yadav B, Kontro M, Eldfors S, Kumar A, Karjalainen R, Majumder MM, Ojamies P, Pemovska T. Leukemia. 2017;31:1187–1195. doi: 10.1038/leu.2016.314. [DOI] [PMC free article] [PubMed] [Google Scholar]
- 44.Purich DL. The inhibitor index: a desk reference on enzyme inhibitors, receptor antagonists, drugs, toxins, poisons, biologics, and therapeutic leads. CRC Press: Taylor & Francis; 2018. [Google Scholar]
- 45.Kojima H, Iida M, Miyazaki H, Koga T, Moriyama H, Manome Y. Arch. Otolaryngol Head Neck Surg. 2002;128:708–713. doi: 10.1001/archotol.128.6.708. [DOI] [PubMed] [Google Scholar]
- 46.Zaboli M, Raissi H, Rahmani Moghaddam N, Farzad F (2020) J Mol Liq 301:112458. 10.1016/j.molliq.2020.112458
- 47.Deepa G, Sivakumar KC, Sajeevan TP (2018) 3 Biotech. 8:493. 10.1007/s13205-018-1510-x [DOI] [PMC free article] [PubMed]
- 48.Baker WJ, Royer GL, Jr, Weiss RB. J Clin Oncol. 1991;9:679–693. doi: 10.1200/JCO.1991.9.4.679. [DOI] [PubMed] [Google Scholar]
- 49.Ho DHW, Frei E. Clin Pharmacol Ther. 1971;12:944–954. doi: 10.1002/cpt1971126944. [DOI] [PubMed] [Google Scholar]
- 50.Yadav MK, Ahmad S, Raza K, Kumar S, Eswaran M, KM MP(2023) J Biomol Struct Dyn 41: 1527–1539. 10.1080/07391102.2021.2021993 [DOI] [PubMed]
- 51.Karwasra R, Ahmad S, Bano N, Qazi S, Raza K, Singh S, Varma S. Molecules. 2022;27:6034. doi: 10.3390/molecules27186034. [DOI] [PMC free article] [PubMed] [Google Scholar]
- 52.Ahmad S. KM MP, Raza K, Rafeeq MM, Habib AH, Eswaran M, Yadav MK. J Biomol Struct Dyn. 2022;22:1–11. doi: 10.1080/07391102.2022.2060308. [DOI] [PubMed] [Google Scholar]
- 53.Alturki NA, Mashraqi M, Alzamami A, Alghamdi YS, Alharthi AA, Asiri S, Ahmad S, Alshamrani S. Molecules. 2022;27:6034. doi: 10.3390/molecules27144391. [DOI] [PMC free article] [PubMed] [Google Scholar]
- 54.Ahmad S, Bano N, Qazi S, Yadav MK, Ahmad N, Raza K, (2022) Nat Prod Commun, 1934578X221115499 10.1177/1934578X221115499
- 55.Pires DEV, Blundell TL, Ascher DB (2015) J Med Chem, 2015; 58(9):4066–72. 10.1021/acs. Jmedchem.5b00104 [DOI] [PMC free article] [PubMed]
- 56.Jafari F, Samadi S, Nowroozi A, Sadrjavadi K, Moradi S, Ashrafi-Kooshk MR, Shahlaei M. J Biomol Struct Dyn. 2018;36:1490–1510. doi: 10.1080/07391102.2017.1329096. [DOI] [PubMed] [Google Scholar]
- 57.Doss CGP, Chakraborty C, Chen L, Zhu H (2014) BioMed Res Int 895831–14. 10.1155/2014/895831 [DOI] [PMC free article] [PubMed]
Associated Data
This section collects any data citations, data availability statements, or supplementary materials included in this article.
Data Availability Statement
The datasets generated during and/or analyzed during the current study are available within the article.
This is not applicable.


