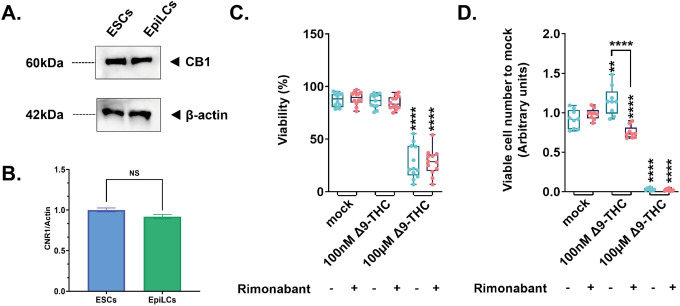
Figure 2: Implication of the CB1 receptor in the proliferative phenotype.
(A) Western blot analysis of transmembrane protein extracts of ESCs or EpiLCs. Antibodies raised against CB1 or β-actin serving as a loading control were used for immunoblotting. (B) Quantification of the gel presented in (A) was done using Image Studio (version 5.2). (C) Whisker boxplot indicating the median cellular viability of stem cells exposed to the different Δ9-THC and rimonabant doses indicated and their associated errors. (D) The median numbers of viable cells exposed to the different Δ9-THC and rimonabant doses indicated were normalized to their own control (+/− rimonabant). Median and associated errors were plotted in whisker boxplots. At least three independent biological repeats with three technical replicates (N=3, n=3). Statistical significance: **(p<0.01), ****(p<0.0001).

