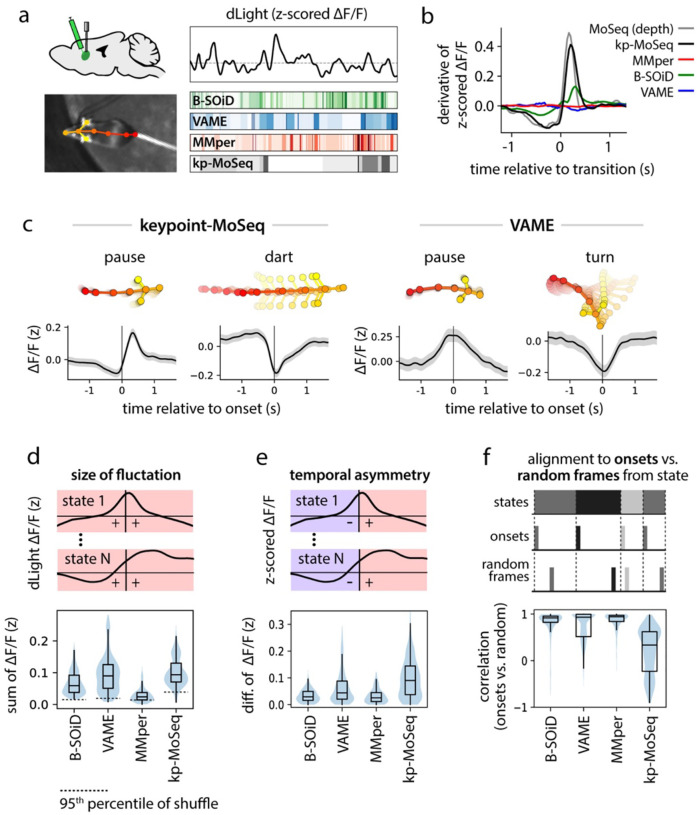
Figure 5: Keypoint-MoSeq syllable transitions align with fluctuations in striatal dopamine.
a) Illustration depicting simultaneous recordings of dopamine fluctuations in dorsolateral striatum (DLS) obtained from fiber photometry (top) and unsupervised behavioral segmentation of 2D keypoint data (bottom). b) Derivative of the dopamine signal aligned to state transitions from each method. c) Average dopamine signal (z-scored ΔF/F) aligned to the onset of example states identified by keypoint-MoSeq and VAME. Shading marks the 95% confidence interval around the mean. d) Distributions capturing the magnitude of state-associated dopamine fluctuations across states from each method, where magnitude is defined as mean total absolute value in a one-second window centered on state onset. e) Distributions capturing the temporal asymmetry of state-associated dopamine fluctuations, where asymmetry is defined as the difference in mean dopamine signal during 500ms after versus 500ms before state onset. f) Temporal randomization affects keypoint-MoSeq identified neuro-behavioral correlations, but not those identified by other methods. Top: schematic of randomization. The dopamine signal was either aligned to the onsets of each state, as in (c), or to random frames throughout the execution of each state. Bottom: distributions capturing the correlation of state-associated dopamine fluctuations before vs. after randomization.

