

Abstract
Predicting the interplay between infectious disease and behavior has been an intractable problem because behavioral response is so varied. We introduce a general framework for feedback between incidence and behavior for an infectious disease. By identifying stable equilibria, we provide policy end-states that are self-managing and self-maintaining. We prove mathematically the existence of two new endemic equilibria depending on the vaccination rate: one in the presence of low vaccination but with reduced societal activity (the “new normal”), and one with return to normal activity but with vaccination rate below that required for disease elimination. This framework allows us to anticipate the long-term consequence of an emerging disease and design a vaccination response that optimizes public health and limits societal consequences.
Keywords: Epidemic, Endemic, Behavior, Stability, Equilibria
To understand and control epidemics, models have been developed that reflect the fundamental properties of infectious disease transmission (1). To embody biological understanding and develop effective policy these models rely on abstractions of complicated phenomena: mortality, reinfection, vaccination, loss of immunity and spatial networks (2). Nevertheless, a substantial barrier to progress has been that transmission depends on human behavior, which is impossible to model in detail. To meet this challenge, we must consider all possible responses with minimal assumptions about the behavioral response to disease.
A hallmark of classical models for emergent epidemic dynamics is a large initial outbreak with final size larger than the critical herd immunity threshold (3). The initial emergent epidemic is followed by a period of low prevalence and then outbreaks of much smaller magnitude. This phenomenon raised concerns about the magnitude of the initial waves of infection of Ebola in 2014 (4), SARS-CoV-2 in 2020 (5, 6), and Mpox in 2022(7, 8), and the potential strain on health systems from such large initial epidemic waves in the absence of behavioral restrictions. However, in all three settings, the initial epidemic wave was curtailed by behavioral change that resulted from a combination of individual behavior to limit risk of exposure and top-down restrictions.
For example, as shown in Fig. 1, in the first year of the SARS-CoV-2 pandemic, before the emergence of the first meaningful immune-escape variant (Alpha in November 2020), many local regions saw a second wave of the original wild-type virus that was equal to, or larger than, the magnitude of the initial emergent epidemic. This implies that behavioral changes, whether individual behavioral or legislated closures, may have limited the size of the first wave, which left a sufficiently large susceptible population that a second wave began when behavior and contact patterns returned towards pre-SARS-CoV-2 levels. The collective experience of these recent global emergence events suggests that disease modeling frameworks that do not account for behavioral change are insufficient to predict the dynamics of the emergence of pathogens exhibiting sufficient morbidity and mortality that will drive behavioral change.
Fig. 1. SARS-CoV-2 deaths exhibited multiple increasing waves in some US states prior to documented immune escape.

Left: SARS-CoV-2 deaths for 54 US states and territories over the period from Feb. 1, 2020 to Oct. 1, 2020 smoothed with a 56-day moving average and normalized by the peak deaths. Note the large gap in peaks between June and July; the traces cluster into two groups: Peak before June (yellow) and peak after July (purple). Right: Aggregating these two clusters (solid line is the cluster mean and shaded area shows one standard deviation), we see that the yellow cluster exhibits a large initial peak with either no second wave or a smaller second wave (during this time period), whereas the purple cluster exhibits two increasing waves. The dynamic exhibited by the purple cluster cannot be captured with a simple compartmental model and is difficult to explain with spatial dynamics, motivating us to introduce a framework for modeling behavior as a possible explanation. Analysis based on the JHU CSSE COVID-19 Data (15) available at https://github.com/CSSEGISandData/COVID-19.
Behavioral modeling can take many forms depending on whether the behavior patterns of interest are exogenous or endogenous to the disease. Exogenous effects on spread of disease include seasonality or long-established societal patterns of behavior. These are distinguished by a lack of dependence on the state of the disease (number of susceptible, infected, or recovered people) and can be modeled as external covariates; e.g. transmission rate as a function of relative humidity (9) or contact rates as a function of time of year (10). In contrast, endogenous effects (i.e. feedbacks) are dependent on the state of the system (e.g. incidence), including individual choices to modify behavior or policy changes that influence behavior in response to incidence or mortality. Traditional compartmental models omit such feedbacks and are unable to reproduce the breadth of phenomena illustrated in Fig. 1.
Exogenous variables have been used retrospectively to account for observed behavioral phenomena coincident with epidemic dynamics. For example, modern technology such as cell phone based mobility data has enabled exogenous modeling of behavior (11–13). Modeling behavior as a function of exogenous variables permits only retrospective evaluation of the interaction between behavior and transmission. Policy decisions need to anticipate future changes in behavior and thus require a framework that can account for future behavioral change.
In this article we show that the addition of a population level behavioral feedback (between incidence and transmission rate) to the classical SIR model, under a surprisingly weak set of assumptions, implies the existence of three possible equilibrium states: (1) for high vaccination rates, disease eradication, (2) for a medium range of vaccination, an endemic equilibrium with return to normal activity, (3) for low vaccination rates, a “new normal” equilibrium with reduced societal activity. We will also show that the SIR model with activity term can have a wider range of stereotypical behavior, which includes qualitative dynamics during emergence consistent with those shown in Fig. 1.
We show how a wide range of possible endogenous behavioral responses (e.g. distancing, masking, hygiene) can be introduced in a compartmental modeling framework (eg. susceptible, infectious, and recovered, or SIR (14)) in a completely general way. Rather than specify a particular model of behavioral response, we choose reasonable and intuitive properties as assumptions to constrain the form of the behavioral response.
There has been significant work analyzing models with feedback between incidence and vaccination behavior (willingness or hesitancy) (16, 17). Bauch and Earn (16) showed the existence of stable equilibrium vaccination demand that can explain the challenge of attaining universal coverage. There has comparatively little work modeling feedback between incidence and activity (18, 19) as applied to behavioral interventions to limit transmission. Current methods typically rely on choosing a particular model for the feedback (20–27). The key advance here is that we avoid the problematic issue of model specification, so the conclusions we reach are widely applicable, including novel emergence scenarios in unknown behavioral contexts.
Consider a standard disease modeling framework (1, 14) for a single well-mixed population that includes vaccination and loss of immunity. We reflect the endogenous/exogenous dichotomy by decomposing the transmission rate, , into a product of exogenous and endogenous components. The endogenous response is represented with a single variable, , (the instantaneous activity of individuals averaged over the population) that quantifies the instantaneous rate of effective behavioral interactions. Rather than specify an exact model for the activity dynamics, we assume that the rate of change of activity is determined by an unspecified reactivity function. Without specifying the reactivity function, we base our results on the following three assumptions:
A1. Reactivity: Change of activity depends on the current level of activity and incidence of infection.
A2. Resilience: When incidence of infection is zero, activity will return to a baseline level.
A3. Boundedness: Activity does not exceed the baseline level.
Reactivity reflects the assumption that the population chooses its aggregate activity level based on information available; specifically the currently observed activity level and knowledge of disease incidence. This means that the reactivity function, , is a function of activity, , and disease incidence, , or , and does not depend on other variables. Thus, reactivity does not reflect exogenous influences.
We define a baseline activity level as the level of activity that the population would go to if the disease were removed and the activity was allowed to stabilize.
Resilience is here defined as the ability of the activity to spring back to the previous condition when distorting forces are removed. In this case, new infections are a distorting force, so resilience is the assumption that when disease incidence is zero the activity averaged over the population will return towards the baseline level. We also assume that, when there is no incidence, the baseline activity level is stationary.
Boundedness asserts that the baseline activity level of the population that exists in the absence of infection is also the maximum activity level. We assign this maximum level to be 1 in arbitrary units, so that the activity level is always between 0 and 1.
Using only these assumptions, we show that the disease equilibria and stability are determined almost entirely by the vaccination rate, , regardless of the behavioral model. We illustrate that accounting for an endogenous behavioral feedback gives rise to a novel equilibrium en route to the classical vaccine-based elimination threshold. The existence of this novel equilibrium can be used as a way-point to guide policy to achieve a return to normal behavior coincident with disease control.
1. Results
Starting from the reactivity assumption (A1), we first developed a framework for incorporating any reactive behavioral dynamics into the compartmental disease modeling paradigm (see Methods). The state of the modeled disease at any given time can be characterized by three variables (Fig 2): the percentage of the population that is susceptible, , the percentage infected, , and the activity relative to the baseline, . The novelty here is that the reactivity function, , which determines the feedback between activity and infection rate, is left completely unspecified. This means our results will apply very broadly to any behavioral response that satisfies our basic assumptions.
Fig. 2. Universal equilibria of resilient behavioral responses with high (left) and low (right) vaccination.
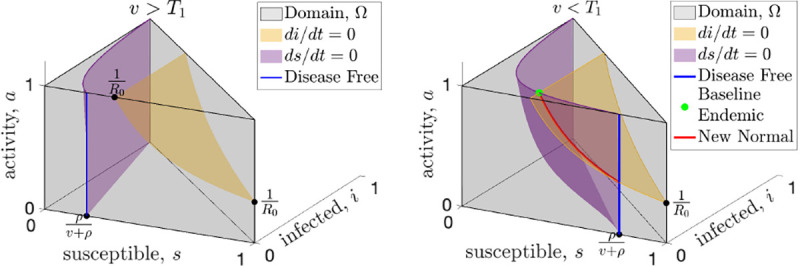
The state space (gray shading) of the SIR model with endogenous behavioral feedback plotted on the susceptible , infected , and activity (, where represents the baseline activity level) axes. The susceptible and infected population sizes are instantaneously constant along the purple and yellow surfaces, respectively. An equilibrium must occur along the blue line that shows the intersection of the purple surface with the front of the domain (the plane) or along the red curve that shows the intersection of these surfaces. When vaccine rates, , are greater than the critical threshold, (see left panel), the only equilibrium is disease-free (blue) and resilience will drive the activity to baseline which is the top of the blue line. When vaccination rates drop below the (right panel), the baseline endemic equilibrium (green dot) is created, along with at least one new normal endemic equilibrium which can be anywhere along the red curve.
First, for any model with reactivity (Assumption A1), we find a universal vaccination threshold, , that is independent of the feedback between activity and incidence. When the vaccination rate is above this threshold any equilibrium must be disease-free. Fig. 2 illustrates the surfaces where the infected population (yellow) and the susceptible population (purple) are not changing; an equilibrium can only happen at the intersection of these two surfaces, or where the purple surface intersects the plane (disease-free). When the vaccination rate is greater than the only equilibrium is disease-free (Fig. 2a, and Supporting Information figure Fig. S.1a).
Second, by assuming resilience (Assumption A2), we prove that when the vaccination rate is above the disease-free equilibrium is stable in the face of baseline activity (Fig. S.1a). Resilience assumes that when incidence is zero (disease-free) and activity is below baseline, then activity will increase. While this seems intuitive it does not imply stability by itself. Stability requires that even if we perturb the disease-free equilibrium by introducing a small number of infections, the system must return to the disease-free equilibrium. In Theorem 3 (Supporting Information), we prove that the disease-free equilibrium is in fact stable, as long as the vaccination rate is above .
Assuming both reactivity () and resilience (), when the vaccination rate drops below the universal threshold , the disease-free equilibrium becomes unstable, and endemic equilibria become possible (Fig. 2b). One novel equilibrium, which we call the baseline endemic equilibrium, is stable even when activity is at baseline . For a baseline endemic equilibrium to exist, we only require that normal activity be stationary for this incidence level, meaning that . Not every reactivity function, , will have a baseline endemic equilibrium, and we give several examples in Section 2 of reactivity functions that show the range of possibilities. If the baseline endemic equilibrium does exist, the infection rate at equilibrium depends on the vaccination rate, but is independent of the behavioral model.
While not as desirable as a disease-free equilibrium, an endemic equilibrium with baseline activity may still be preferred to permanently modifying behavior, so it is important to determine its stability. Recall that a bounded behavioral response limits the average activity, , to be at most the baseline level, , by imposing . In Theorem 4 (Supporting Information), we show that for any bounded behavioral response, there will be a second vaccination threshold, , which determines the stability of the baseline endemic equilibrium. The threshold is given by (Supporting Information),
| [1] |
where is a constant that depends on the properties of the reactivity function, , near the baseline endemic equilibrium, is the average number of infections after contact in a fully susceptible population or basic reproduction number, and and are rates (see Supporting Information). The constant will often be positive, and in these cases the vaccination threshold will be lower than the threshold. In these cases, when the vaccination rate is higher than but less than , the baseline endemic endemic will be stable. For some reactivity functions, the constant can be negative or zero, and for these reactivity functions the baseline endemic equilibrium will not be stable for any vaccination rate. Once the reactivity function, , is specified, can be computed explicitly and we show how to compute along with several examples in the Supporting Information. This shows that even when the classical threshold for effective vaccination cannot be achieved, there can still be a substantial benefit at a lower vaccination rate. As long as the vaccination rate exceeds the new threshold, the baseline activity level will be stable (see examples Fig. 3).
Fig. 3. Vaccination may increase or decrease infection rate depending on the form of the behavioral response.
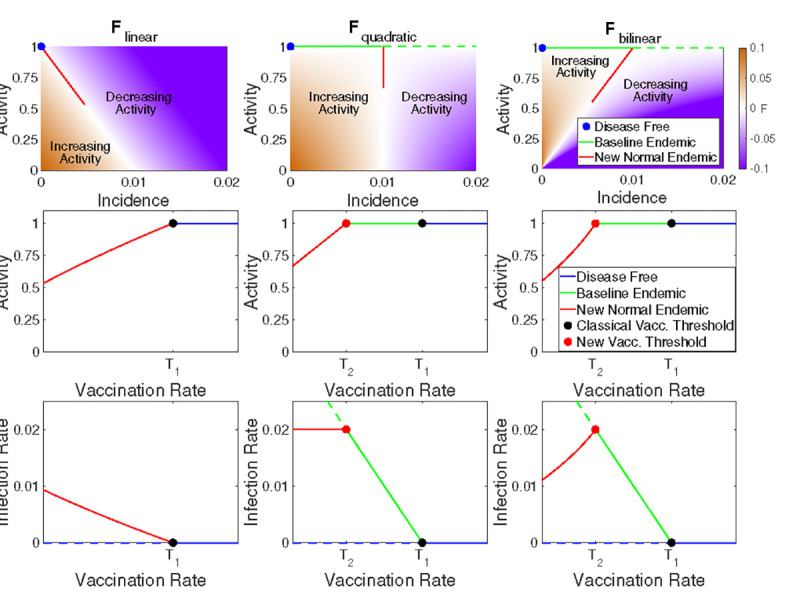
Relationship between activity, incidence, and vaccination rate for three example reactivity functions (columns). In the top row we illustrate zones of increasing (brown) and decreasing (purple) activity as a function of incidence; white indicates regions where activity is stationary (at least instantaneously). In the middle row the equilibrium activity is shown as a function of vaccination rate with colors indicating the disease-free, baseline endemic, and new normal regimes. The bottom row indicates the equilibrium incidence as a function of vaccination; stable equilibria are shown as solid lines and unstable equilibria as dashed lines. Note that when vaccination is less than (the new normal), increased vaccination may lead to either higher (bottom right) or lower (bottom left) infection rates depending on the reactivity function.
When the vaccination rate is below both the and thresholds (e.g. early stages of a novel disease before a vaccination, ) both the disease-free equilibrium and the baseline endemic are unstable and there is no stable equilibrium with baseline activity. In Theorem 6 (Supporting Information) we prove that there is at least one new equilibrium (Fig. 2b), which we term a “new normal” endemic equilibrium. Unlike the disease-free and baseline endemic equilibrium, the incidence rate at the new normal endemic equilibrium depends on the form of the behavioral feedback and implies long-term behavioral changes with activity level below baseline. When vaccination is below both thresholds, the stability of the new normal endemic cannot be determined universally, and it may have a complicated dependence on the details of the behavioral feedback and exhibit periodic cycles or chaos.
2. Examples
We emphasize that our results apply to any reactivity function, , that satisfies A1 - A3. To illustrate our results we introduce three basic examples of reactivity functions.
| [2] |
| [3] |
| [4] |
These functions all satisfy resilience and boundedness for any and we illustrate them in the top row of Fig. 3 for and . The first two functions (2, 3) are important because they are the leading order approximation of any reactivity function. Note that the function is quadratic in since and similarly is bilinear in and . In the Supporting Information we show that the simplest model, , does not have a baseline endemic equilibrium because . Both and have , so for vaccination rates between these thresholds the baseline endemic is stable.
The primary difference between the three example reactivity functions is how quickly the equilibrium level of activity falls off as vaccination rate decreases (Fig. 3). For the activity versus vaccination curve is concave down, and this moderate response results in a new normal infection rate that increases rapidly as vaccination rate decreases (Fig. 3). For equilibrium activity increases linearly with vaccination rate. This model has the interesting feature that a decrease in vaccination rate leads to a decrease in activity that maintains a constant level of infection in the new normal endemic. Finally, has the most robust behavioral response, with a concave up increase in activity as vaccination rate increases. This response results in infection rate increasing as vaccination rates increase. Thus, when initially introducing a vaccination to a population the infection rate may initially increase until the critical vaccination rate threshold is reached and the baseline endemic is stabilized. This will especially be the case for a new vaccination that is being gradually rolled out, since a slow change in the vaccination rate can help keep the system near equilibrium as the new normal shifts.
Finally, we note a fascinating feature of . If we consider the fraction of the population that remains susceptible to infection as approximately constant and set as ‘distancing’, then we recover a form equivalent to the Lotka-Volterra predator-prey model where infections, , play the role of prey and distancing, , plays the role of the predator (Supporting Information equation Eq. (12)). Oscillations are present at the beginning of the epidemic, when the susceptible population is large and almost constant. The oscillations are not damped, but they have a very slow decay due to the slow decrease in the susceptibles. Finally, the model exhibits a phase transition when the the susceptible population drops below , at which point the predator-prey oscillations cease and the system reverts to a more typical epidemic trajectory allowing the system to come to equilibrium. These oscillations depend on the vaccination rate (Fig. 4, Fig. S.3). This illustrates how behavioral feedback can lead to a wide range of epidemic dynamics including oscillations that are independent of any external (e.g. seasonal) forcing.
Fig. 4. Introducing resilient activity accounts for a wide range of epidemic dynamics.

Examples of the dynamics of the reactivity function with high vaccination (top left, ), moderate vaccination (top right, between and ), and low vaccination (bottom left, ). Finally (bottom right) we simulate 300 days without any vaccination followed by a linear ramp up in vaccination between days 300 and 600 to a fixed moderate vaccination rate after day 600. Susceptible population, (solid blue), activity level, (dotted blue), and the phase transition level (dashed black) are scaled to the left axis while the infected population, (solid red) is scaled to the right axis. (See equation Eq. (17) in the Supporting Information for details and Fig. S.3 for more examples.)
3. Discussion
The collective experience of recent global emergence events suggests that the conventional disease modeling framework is insufficient to predict the dynamics of the emergence of pathogens with severity or mortality that will drive behavioralchange. Notably, the standard SIR-model overestimates the expected magnitude of an initial outbreak (in the absence of knowledge about future individual or legislated behavioral change) and consequently underestimates the expected time to and magnitude of subsequent waves. Here we describe the dynamics and equilibria of a novel SIR-type model with a general formulation of behavioral feedbacks.
In the first year of the SARS-CoV-2 pandemic, before the emergence of the first meaningful immune-escape variant (Alpha in November 2020), many places (see Fig. 1) saw a second wave of the original wild-type virus that was equal to, or larger than, the magnitude of the initial emergent epidemic. Behavioral change in response to the initial wave may have left a sufficiently large susceptible population to permit a second, larger wave when behavior and contact patterns returned towards pre-SARS-CoV-2 levels. We find that behavioral feedbacks that reduce contact rates in response to increasing infection incidence can produce these novel dynamics in the transient period of emergence. These behavioral feedbacks also generate novel endemic equilibria characterized by either persistent behavior restriction or a return to pre-emergence behavior levels if vaccination is introduced and sufficiently high.
We have shown that for a broad range of behavioral feedbacks between the incidence of infection and activity that contributes to transmission (e.g. contact rates or hygiene) there exist two novel equilibria in addition to the classic vaccine-based herd immunity threshold. While coordinated behavioral interventions may be sufficient to drive incidence to 0, e.g. as was seen for SARS-CoV-1 in 2004 (28), and Ebola outbreaks (29) prior to the incorporation of vaccination in outbreak response (30), such interventions alone cannot stabilize the disease-free equilibrium if behavior exhibits resilience. In the absence of vaccination there are no stable equilibria that have a return to normal activity. SARS-CoV-1 is the rare example of a pathogen that emerged and was eradicated in the absence of a vaccine; however, reintroduction from an animal reservoir remains possible (31) and the relaxation of the behavioral interventions (28) render the current disease-free state unstable (32).
The newly identified regime with vaccination between and has substantial policy implications for emerging infections and eradication. In the absence of vaccines, non-pharmaceutical interventions remain an important part of pandemic response for emerging infections and can be onerous. The SARS-CoV-2 pandemic led to dramatic economic (33) and educational (34, 35) consequences. Planning for a safe return to pre-emergence activity can minimize these off-target effects. While eradication may still be a goal, vaccination at a level lower than the classic herd immunity threshold permits a return to pre-emergence activity while maintaining a stable, non-zero incidence. Furthermore, attaining may be challenging, particularly in the face of vaccine hesitancy, vaccine administration logistics, or uncertainty about the rate of loss of immunity. The existence of suggests a midpoint goal for vaccination rate that can be used to motivate vaccination efforts.
The existence of the vaccination regime between and may further be useful in policies for endemic infections. The only benefits to vaccination in the standard SIR modeling framework without behavioral feedbacks are reductions in morbidity and mortality. This new model implies additional societal change, in the form of the increased activity, that may be stabilized at or above a lower vaccination threshold . Whether this represents a societal benefit or not will be highly epidemic specific. For example, vaccination rates above may allow for relaxation of pre-screening requirements and the costs inherent in such programs. Alternatively, one could imagine an increase in risky behaviors, e.g. decreased mask usage as vaccination increases. The positive correlation between vaccination rate and equilibrium incidence under the function could lead to population level assessment of vaccine failure driven by the behavioral response. Any specific predictions of such phenomena is speculative without a mechanistic understanding of the explicit nature of the feedbacks. For example Funk et al. (26) considered that information, and thus behavioral response, may only be available locally rather than globally and Weitz et al. (20) considered that behavioral response may react to the incidence of mortality rather than infection. The general extension of the standard modeling framework for infectious diseases that we have proposed offers a pathway to guide more specific mechanistic investigations.
The description of these new equilibria represents a novel advance for infectious disease and vaccination policy development. A stable equilibrium provides a policy target where the system is self-managing and self-maintaining. The existence of such a stable target allows optimal policy strategies to be formulated to reach that point. Policy formulation without such an explicit goal requires iterative trial-and-error which may incur economic or societal costs that can undermine support for the process. Such adaptive control strategies built upon iterative learning have a long history (36–38) and are useful tools complemented by our results showing that there are multiple advantageous stable equilibria (disease-free or endemic) allowing a return to normal behavior. In the face of uncertainty about the feasibility of elimination, the endemic state with return to normal behavior provides a valuable new policy target to motivate action and guide policy development.
Materials and Methods
We will demonstrate the power of of our approach on the most basic infectious disease model. Thus, we start with the Susceptible, , Infected, , Recovered, , (SIR) model for a well-mixed population given by,
| [5] |
with transmission rate , average duration of illness , and a conserved population . The parameter, , represents the vaccination rate, which moves population from susceptible, , to recovered, . Conversely, the parameter, , represents loss of immunity, which moves population from recovered, , back to susceptible, . Note that this model for vaccination implicitly includes booster immunizations, since loss of immunity will eventually move the previously vaccinated population back into the susceptible class and the model assumes that they may eventually be re-vaccinated or “boosted”. The specific interpretations of the terms and parameters in Eq. (5) is provided only for aiding in intuition. For example, instead of reinfection the source of new susceptible population may be births (on a longer time scale), or there may be other methods of removing people from the susceptible population besides vaccination. The model and analysis presented here may be adaptable to such interpretations since our focus will be on the interaction of behavior and transmission.
The key to a frequency-based transmission model such as Eq. (5) is the nonlinear ( multiplies ) term for case incidence,
which quantifies the incidence rate of the disease. Following (39), we can break down the transmission rate, , into a product of the rate of effective contact, , and the probability of transmission given an effective contact, , so that,
| [6] |
The activity rate, , represents an effective rate that can include changes in behavior such as distancing or masking. To see this, it is worthwhile to note the formal descriptions of and from (39): represents the rate of contacts that are of an appropriate type for transmission to be possible if one of the hosts is infectious, and represents the probability that contact between an infectious and a susceptible host does in fact lead to transmission. Using these definitions, this framework allows for activity change that both reduces the rate of all contacts (e.g. distancing) or the rate of effective contacts (e.g. masking).
Substituting Eq. (6) into the formula for case incidence, , we define,
| [7] |
In this product is the susceptible population who are having effective interactions with people at rate . The probability of each interaction happening with an infected person is , and is the conditional probability that such an interaction with an infected person gives rise to infection. By separating into its component factors, we see that it is much more reasonable to assume that is constant (or at least that it changes on a longer time scale), whereas a behavioral response could be quite rapid and makes it likely that the rate of effective contact, , could change on fast time scales. Notice that when we have so we refer to as the baseline level of activity.
We are now ready to quantify the various assumptions (A1–A3) that we will consider for the behavioral dynamics. First, Reactivity (Assumption A1) says that the rate of change of the activity parameter is a continuous function, , that only depends on the current activity, , and case incidence rate, , which is the rate of new infections, (here is raw incidence and is the incidence as a percentage of the total population). In other words, reactivity allows any behavioral dynamics of the form,
| [8] |
and we call the reactivity function. The fact that there cannot be a ‘negative’ infection incidence implies that . When the rate of change of activity cannot be negative. Thus, in addition to the form Eq. (8), reactivity also includes the assumption that .
We can now quantify Resilience (Assumption A2), which states that when incidence is zero activity will increase. Here we come to one of the significant advantages of not specifying a model for activity. Recall that the baseline activity level is defined to be the level of activity that would be reached if the disease were removed and a long time were allowed for the activity to stabilize. Since the reactivity function, , is not specified, we can always choose units for such that the baseline activity level is by incorporating the change of units into the definition of the reactivity function. When , transmissibility during contacts reflects the baseline contagiousness of the disease. All we are assuming here is that there is some baseline value for activity, and then choosing units which re-scale that value to one. Thus, without loss of generality, resilience can be quantified as,
| [9] |
which implies that when activity is below baseline activity and incidence is zero activity will increase . We also need to assume that to insure that baseline activity is stationary when there is no incidence. The condition Eq. (9) is all that is required when we are also assuming boundedness (A3), but for technical reasons when the behavior is not bounded we will also assume when . Note that we have assumed we are working in units where corresponds to baseline activity, so means any level of activity that is below baseline and means activity is above baseline. Moreover, means that, when there is no incidence, the rate of change of activity is positive, so activity is increasing, and this captures the assumption of resilience. Resilience also includes the assumption that baseline activity is stationary when there is zero incidence ; this assumption is captured by the equation in Eq. (9).
Lastly, Boundedness (Assumption A3) says that the baseline activity level (averaged over the whole population) is the highest level possible, meaning that . This means that when we must have
| [10] |
otherwise the activity would increase beyond the boundedness limit of .
Thus, we consider the following infection model that incorporates vaccination, loss of immunity, and arbitrary behavioral dynamics,
| [11] |
In order to remove the algebraic equation we rewrite the model in terms of population fractions. Setting , and we have and . Moreover, we can remove the equation for the recovered population fraction, , by setting in the remaining equations. Thus, the following equations govern the fractions of the population,
| [12] |
In these units, the basic reproduction number is , which defines the expected number of secondary infections due to the initial infection in a completely naive population.
Supplementary Material
Significance Statement.
The experience of the COVID-19 pandemic has revealed that behavior can change dramatically in response to the spread of a disease. This behavioral response impacts disease transmission. Predicting future outcomes requires accounting for the feedback between behavior and transmission. We show that accounting for these feedbacks generates long-term predictions about disease burden and behavior that can guide policy.
ACKNOWLEDGMENTS.
Supported by US NIH Director’s Transformative Award 1R01AI145057.
References
- 1.Kermack WO, McKendrick AG, A contribution to the mathematical theory of epidemics. Proc. royal society london. Ser. A, Containing papers a mathematical physical character 115, 700–721 (1927). [Google Scholar]
- 2.Anderson RM, May RM, Infectious diseases of humans: dynamics and control. (Oxford university press; ), (1992) [Google Scholar]
- 3.Miller JC, A note on the derivation of epidemic final sizes. Bull. mathematical biology 74, 2125–2141 (2012) [DOI] [PMC free article] [PubMed] [Google Scholar]
- 4.Meltzer MI, Modeling in real time during the ebola response. MMWR supplements 65 (2016). [DOI] [PubMed] [Google Scholar]
- 5.Ferguson N, et al. , Report 9: Impact of non-pharmaceutical interventions (npis) to reduce covid-19 mortality and healthcare demand. Publ. Online, Imp. Coll. Lond. COVID-19 Sch. Public Heal. (2020). [DOI] [PMC free article] [PubMed] [Google Scholar]
- 6.CDC, Covid-19 pandemic planning scenarios (2021).
- 7.Bleichrodt A, et al. , Real-time forecasting the trajectory of monkeypox outbreaks at the national and global levels, july–october 2022. BMC medicine 21, 1–20 (2023). [DOI] [PMC free article] [PubMed] [Google Scholar]
- 8.A Endo, et al. , Heavy-tailed sexual contact networks and monkeypox epidemiology in the global outbreak, 2022. Science 378, 90–94 (2022). [DOI] [PubMed] [Google Scholar]
- 9.Lowen AC, Steel J, Roles of humidity and temperature in shaping influenza seasonality. J. virology 88, 7692–7695 (2014). [DOI] [PMC free article] [PubMed] [Google Scholar]
- 10.Fine PE, Clarkson JA, Measles in england and wales—i: an analysis of factors underlying seasonal patterns. Int. journal epidemiology 11, 5–14 (1982). [DOI] [PubMed] [Google Scholar]
- 11.Buckee CO, et al. , Aggregated mobility data could help fight covid-19. Science 368 145–146(2020) [DOI] [PubMed] [Google Scholar]
- 12.Bonaccorsi G, et al. , Economic and social consequences of human mobility restrictions under covid-19. Proc. Natl. Acad. Sci. 117, 15530–15535 (2020). [DOI] [PMC free article] [PubMed] [Google Scholar]
- 13.Lau MS, et al. , Characterizing superspreading events and age-specific infectiousness of sars-cov-2 transmission in georgia, usa. Proc. Natl. Acad. Sci. 117, 22430–22435 (2020). [DOI] [PMC free article] [PubMed] [Google Scholar]
- 14.Keeling MJ, Rohani P, Modeling Infectious Diseases in Humans and Animals. (Princeton University Press; ), (2008). [Google Scholar]
- 15.Dong E, Du H, Gardner L, An interactive web-based dashboard to track covid-19 in real time. The Lancet infectious diseases 20, 533–534 (2020). [DOI] [PMC free article] [PubMed] [Google Scholar]
- 16.Bauch CT, Earn DJ, Vaccination and the theory of games. Proc. Natl. Acad. Sci. 101 13391–13394 (2004) [DOI] [PMC free article] [PubMed] [Google Scholar]
- 17.Buonomo B, d’Onofrio A, Lacitignola D, Global stability of an sir epidemic model with information dependent vaccination. Math. biosciences 216, 9–16 (2008). [DOI] [PubMed] [Google Scholar]
- 18.Reluga TC, Game theory of social distancing in response to an epidemic. PLOS computational biology 6, e1000793 (2010). [DOI] [PMC free article] [PubMed] [Google Scholar]
- 19.Ash T, Bento AM, Kaffine D, Rao A, Bento Al, Disease-economy trade-offs under alternative epidemic control strategies. Nat. Commun. 13, 1–14 (2022). [DOI] [PMC free article] [PubMed] [Google Scholar]
- 20.Weitz JS, Park SW, Eksin C, Dushoff J, Awareness-driven behavior changes can shift the shape of epidemics away from peaks and toward plateaus, shoulders, and oscillations. Proc. Natl. Acad. Sci. 117, 32764–32771 (2020). [DOI] [PMC free article] [PubMed] [Google Scholar]
- 21.Tkachenko AV, et al. , Stochastic social behavior coupled to covid-19 dynamics leads to waves, plateaus, and an endemic state. Elife 10, e68341 (2021). [DOI] [PMC free article] [PubMed] [Google Scholar]
- 22.Bauch C, d’Onofrio A, Manfredi P, Behavioral epidemiology of infectious diseases: an overview. Model. interplay between human behavior spread infectious diseases pp. 1–19 (2013). [Google Scholar]
- 23.Fenichel EP, et al. , Adaptive human behavior in epidemiological models. Proc. Natl. Acad. Sci. 108, 6306–6311 (2011). [DOI] [PMC free article] [PubMed] [Google Scholar]
- 24.Rizzo A, Frasca M, Porfiri M, Effect of individual behavior on epidemic spreading in activity-driven networks. Phys. Rev. E 90, 042801 (2014). [DOI] [PubMed] [Google Scholar]
- 25.Epstein JM, Parker J, Cummings D, Hammond RA, Coupled contagion dynamics of fear and disease: mathematical and computational explorations. PloS one 3, e3955 (2008). [DOI] [PMC free article] [PubMed] [Google Scholar]
- 26.Funk S, Gilad E, Watkins C, Jansen VA, The spread of awareness and its impact on epidemic outbreaks. Proc. Natl. Acad. Sci. 106, 6872–6877 (2009). [DOI] [PMC free article] [PubMed] [Google Scholar]
- 27.Arthur RF, Jones JH, Bonds MH, Ram Y, Feldman MW, Adaptive social contact rates induce complex dynamics during epidemics. PLoS computational biology 17, e1008639 (2021). [DOI] [PMC free article] [PubMed] [Google Scholar]
- 28.Bell DM,, et al. , Public health interventions and sars spread, 2003. Emerg. infectious diseases 10, 1900 (2004). [DOI] [PMC free article] [PubMed] [Google Scholar]
- 29.Kirsch TD, et al. , Impact of interventions and the incidence of ebola virus disease in liberia-implications for future epidemics. Heal. Policy Plan. 32, 205–214 (2016). [DOI] [PMC free article] [PubMed] [Google Scholar]
- 30.Walldorf JA, et al. , Considerations for use of ebola vaccine during an emergency response. Vaccine 37, 7190–7200 (2019). [DOI] [PMC free article] [PubMed] [Google Scholar]
- 31.Morens DM, Fauci AS, Emerging pandemic diseases: how we got to covid-19. Cell 182 1077–1092 (2020) [DOI] [PMC free article] [PubMed] [Google Scholar]
- 32.Monaghan K, SARS: Down but still a threat. (National Intelligence Council; ) Vol. 3, (2003). [Google Scholar]
- 33.Chen J, et al. , Epidemiological and economic impact of covid-19 in the us. Sci. reports 11, 1–12 (2021). [DOI] [PMC free article] [PubMed] [Google Scholar]
- 34.Hammerstein S, König C, Dreisörner T, Frey A, Effects of covid-19-related school closures on student achievement-a systematic review. Front. psychology 12, 746289 (2021). [DOI] [PMC free article] [PubMed] [Google Scholar]
- 35.Hoofman J, Secord E, The effect of covid-19 on education. Pediatr. Clin. 68, 1071–1079 (2021). [DOI] [PMC free article] [PubMed] [Google Scholar]
- 36.Shea K, Tildesley MJ, Runge MC, Fonnesbeck CJ, Ferrari MJ, Adaptive management and the value of information: learning via intervention in epidemiology. PLoS biology 12, e1001970 (2014). [DOI] [PMC free article] [PubMed] [Google Scholar]
- 37.Keith DA, Martin TG, McDonald-Madden E, Walters, Uncertainty and adaptive management for biodiversity conservation (2011). [Google Scholar]
- 38.Williams BK, Adaptive management of natural resources—framework and issues. J. environmental management 92, 1346–1353 (2011). [DOI] [PubMed] [Google Scholar]
- 39.Begon M, et al. , A clarification of transmission terms in host-microparasite models: numbers, densities and areas. Epidemiol. & Infect. 129, 147–153 (2002). [DOI] [PMC free article] [PubMed] [Google Scholar]
- 40.Ferrari MJ, et al. , The dynamics of measles in sub-saharan africa. Nature 451,679–684 (2008). [DOI] [PubMed] [Google Scholar]
Associated Data
This section collects any data citations, data availability statements, or supplementary materials included in this article.