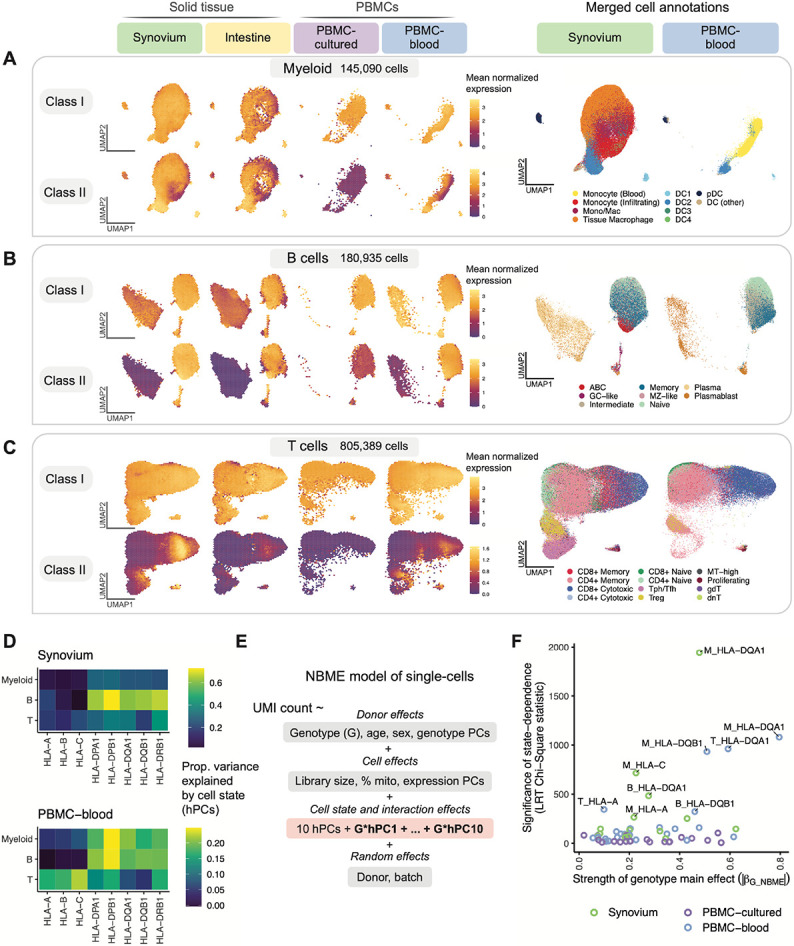
Fig. 4. Identifying dynamic eQTLs by modeling single-cells in shared cell state embedding.

(A-C) UMAP of cells generated using tissue-defined embedding (top 10 hPCs from Synovium and Intestine), with PBMC datasets projected into the same space. The plot is divided into three sections: (A) myeloid cells, (B) B, and (C) T cells. Left: class I and II HLA expression across cells across datasets. Cells are binned into hexagons to avoid overplotting (50 bins per horizontal and vertical UMAP directions) and colored by mean log(CP10k+1)-normalized expression of class I/II genes per bin (e.g., for class I, mean of HLA-A, -B, and -C). Right: cell state annotations (color) for a representative PBMC (PBMC-blood) and solid tissue (Synovium) dataset from merging annotations from each dataset to a shared set of labels. (D) Estimated proportion of variance in UMI counts explained by cell state hPCs (color) across HLA genes and cell types. (E) NBME model of single cells used to identify cell-state-dependent regulatory effects. Pink box highlights terms for cell state (10 hPCs per cell type) and their interaction with genotype. (F) Testing lead eQTLs identified in multi-cohort pseudobulk analysis for cell-state dependence using the NBME model in each dataset (color) in myeloid (“M”), B, and T cells. Magnitude of genotype main effect (x-axis) versus the significance of cell-state interaction (y-axis), measured using Chi-Square (χ2) statistic from LRT comparing full model (E) to null model without GxhPC interaction terms. Abbreviations: UMAP, uniform manifold approximation and projection; NBME, negative binomial mixed effects; LRT, likelihood ratio test; hPC, Harmonized PC.
