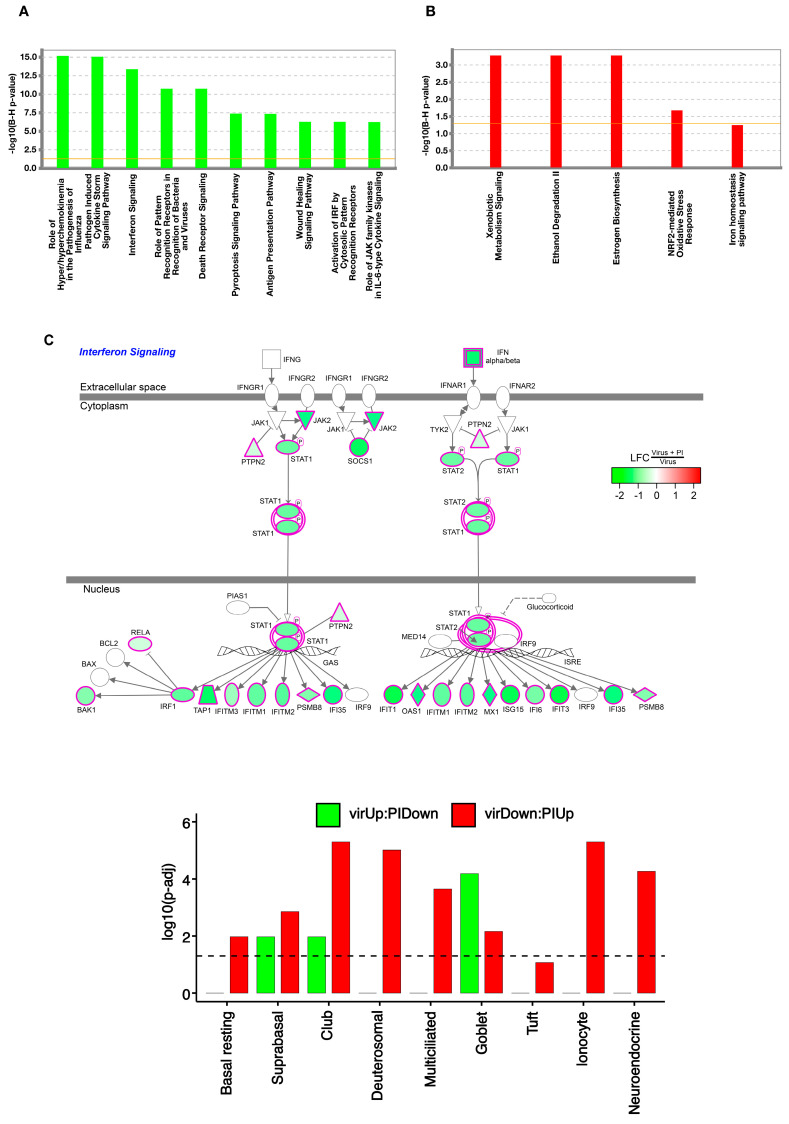
Figure 7.
Pathway and cell–type enrichment analyses of RV–A16 response genes whose viral effect is opposed by PI. Barplots of enrichment scores of select IPA canonical pathways enriched for genes in the VirUp:PIDown (viral upregulated genes whose effect is opposed by PI) gene set (A) and VirDown:PIUp (viral downregulated genes whose effect is opposed by PI) gene set (B). Enrichment scores are represented as -log10 of Benjamini–Hochberg (BH) adjusted p-values obtained from IPA. (C). Cell diagram of the IPA interferon signaling pathway, with node colors representing the logFC in gene expression between RV-A16 + PI and RV-A16 cultures. (D). Barplot of enrichment scores for airway epithelial cell-type gene signatures within VirUp:PIDown (green) and VirDown:PiUp (red) gene sets. Enrichment scores were represented as –log10 of BH–adjusted p-values obtained from the hypergeometric test.

