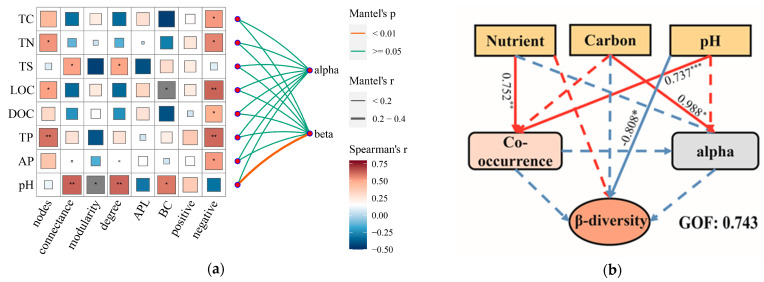
Figure 6.
Mantel test analysis and PLS paths showing the relationships of sediment environmental variables to network features, α- and β-diversity. (a) Mantel test analysis. Spearman correlation was used between environmental variables and network features. APL: average path length; BC: betweenness centralization. (b) PLS paths analysis. Red and blue lines represent positive and negative path coefficients, respectively. The path coefficients represented the “strength and direction” of the relationships between the response and the predictors. Dotted lines indicated the path coefficients without statistical significance. Ellipses and rectangles represent latent variables and observed variables. Significant differences were indicated by * p < 0.05, ** p < 0.01, *** p < 0.001. GOF: goodness of fit. XXLR: the inlet of the river upstream of XXL, XXLD, and XLD: near the dam of XXL and XL.

