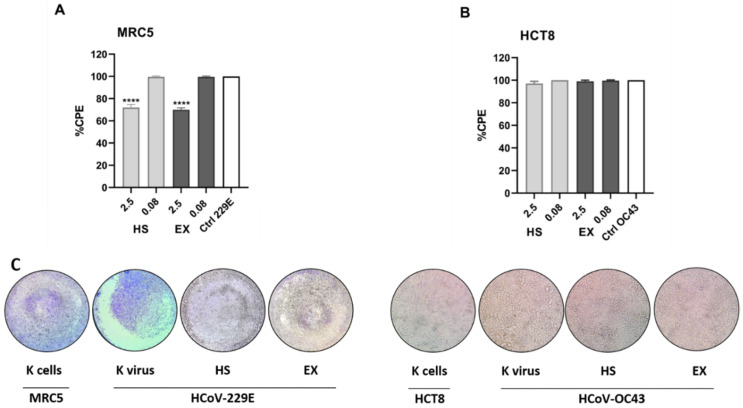
Figure 4.
(A) Percentage of the CPE calculated by MTT assay of HCoV-229E strain on MRC5 cells after exposure to HS and EX substances. The graph shows the highest and lowest concentrations tested, respectively. The 2.5 mg/mL concentration contributed to a 30% reduction in CPE. In contrast, the concentration equal to 0.08 mg/mL had no antiviral activity showing a cytopathic effect equal to the K virus. (B) Percentage of the CPE calculated by MTT assay of HCoV-OC43 strain on HCT-8 cells after exposure to HS and EX substances. The graph shows the highest and lowest concentrations tested, respectively. None of the tested doses showed antiviral activity showing a cytopathic effect equal to the K virus. (C) Morphological change and CPE due to HCoV-229E (left) and HCoV-OC43 strains (right) read-out 72 h post administration (2.5 mg/mL) by ALI exposure. MOI 0.01; All data were calculated as the percentage of the CPE with respect to the negative control (K cells). The data represent the mean ± standard deviation (SD) of three independent experiments; **** p < 0.001.

