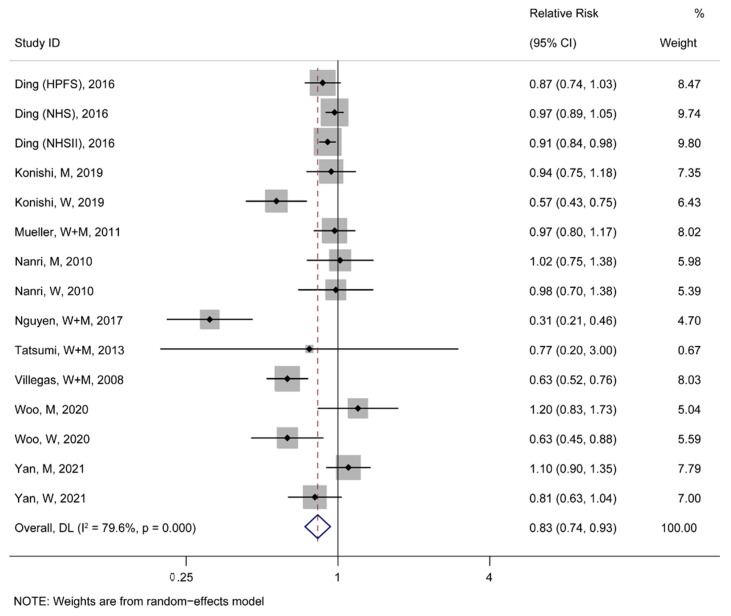
Figure 2.
The pooled risk association of T2D with soy consumption [30,31,32,33,34,35,36,37,38]. In the forest plot, the black point represents the point estimate of the effect size of each study, the gray square means the weight of each study, the line length represents the 95% confidence interval (CI) of the effect size of each study, the diamond represents the meta-analysis synthesizes the summary results of each study, the diamond center represents the point estimate of the effect size of the summary results, and the diamond width represents the 95% CI of the effect size of the summary results.

