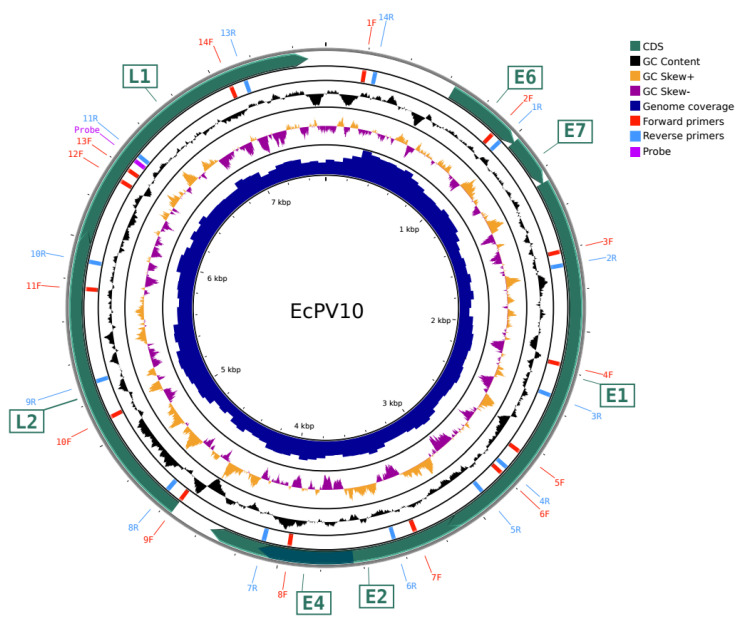
Figure 1.
Genomic multi-plot showing the newly assembled EcPV10 genome. The genomic multi-plot was obtained with CGview REF. Concentric circles, from outermost to innermost, show the following: the backbone of the EcPV10 genome; CDS in green arrows; overlapping primers for the genome walking validation method, in forward (red) and reverse orientation (blue); GC content percentage; GC skew, in orange for the forward strand and purple for the reverse strand; Illumina short reads coverage on the assembled sequence.

