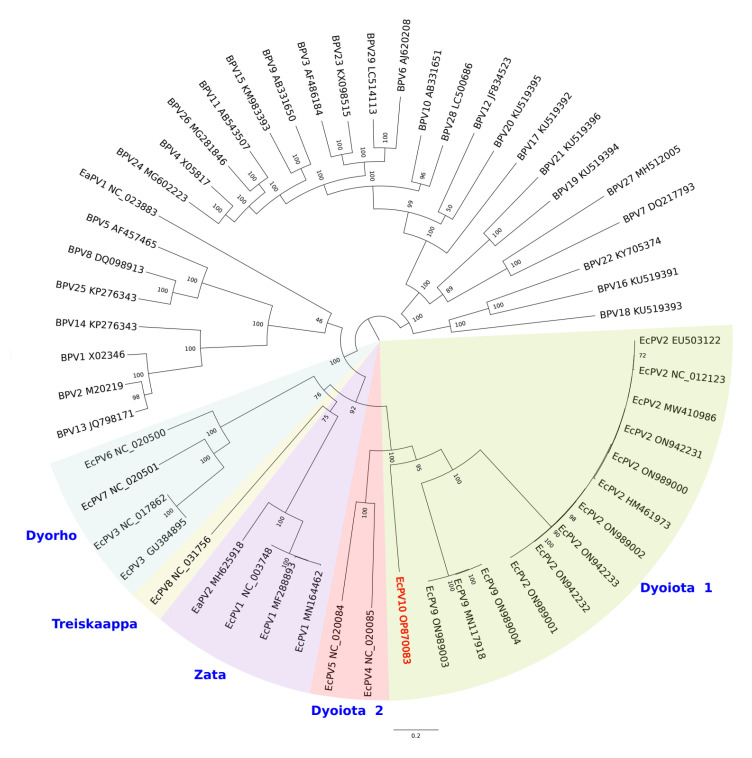
Figure 2.
Maximum Likelihood phylogenetic tree based on the concatenated sequences of E1, E2, L2, and L1 genes. Phylogeny was inferred using RaxM. Boostrap values are indicated as node labels. Background colors separate the different EcPV phylogenetic groups from bovine EcPVs, according to [5]. EcPV groups Dyoiota 1 and 2, Dyorho, Treiskaappa, and Zata are indicated in the figure. Our EcPV10 isolate is indicated in red.

