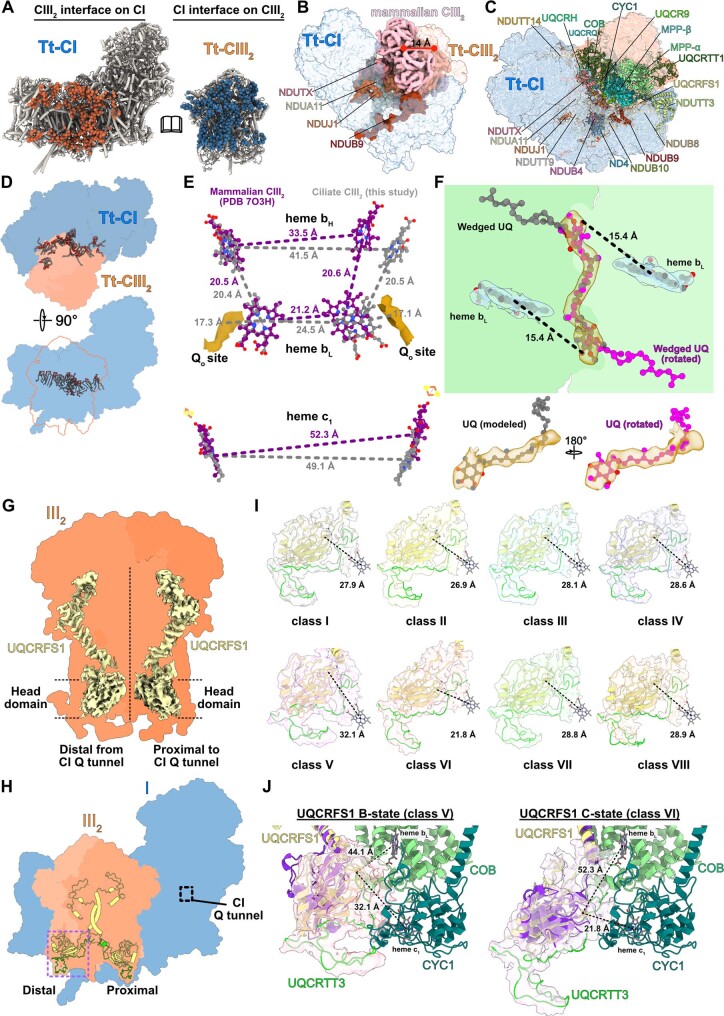
Extended Data Fig. 9. Extensive CI-CIII2 interface involves numerous lipids and accommodates flexible head domain of distal UQCRFS1.
(A) Buried surfaces in the CI-CIII2 interface. CIII2 contacts on CI (orange) and CI contact points on CIII2 (blue; >9,000 Å2 interface). (B) Four Tt-CI subunits would clash with mammalian CIII2 in canonical position, thus Tt-CIII2 is displaced 14 Å from Tt-CI. (C) Tt-CI (light blue) and Tt-CIII2 (light orange) with interface-forming subunits shown in colored ribbons. (D) Orthogonal views of bound native lipids in the I-III2 interface. (E) Distances between ciliate (grey) and mammalian (purple) heme bH, heme bL and heme c1 groups (measuring from Fe atoms) and the ciliate Qo sites. Superposing mammalian CIII2 (PDB 7O3H) shows that ciliate heme bH and heme bL are displaced further away from the symmetry-related hemes, whereas the ciliate heme c1 groups are slightly closer. Furthermore, the distance from Qo sites (dark gold) to heme bL is comparable to bovine CIII2 (17). (F) The CIII2 wedged ubiquinone (UQ, transparent gold density) in COB (green) is almost rotationally symmetric, showing planar head group density equally close to the heme bL molecules (transparent blue). (G) Cryo-EM density carved around the UQCRFS1 proteins in CIII2. Head domains show inherent flexibility. (H) Location of distal and proximal UQCRFS1 subunits (yellow ribbon) with respect to CI quinone tunnel (black box). The purple box highlights region for focused 3D classification. (I) 3D classes I-VIII. UQCRFS1 and UQCRTT3 were fitted to each map and distance measured from Fe2S2 cluster to heme c1. Only classes V and VI display markedly different distances. (J) Comparison of B-state class V (left) and C-state class VI (right). B-state UQCRFS1 superposes well with B-state UQCRFS1 from chicken CIII2 (purple, PDB 3BCC). C-state UQCRFS1 superposes almost perfectly with C-state UQCRFS1 from chicken CIII2 (purple, PDB 1BCC). Measured distances are from UQCRFS1 Fe2S2 to heme c1 and bL.

