

Abstract
Summary
The NCI Transcriptional Pharmacodynamics Workbench (NCI TPW) is an extensive compilation of directly measured transcriptional responses to anti-cancer agents across the well-characterized NCI-60 cancer cell lines. The NCI TPW data are publicly available through a web interface that allows limited user interaction with the data. We developed ‘TPWshiny’ as a standalone, easy to install, R application to facilitate more interactive data exploration.
With no programming skills required, TPWshiny provides an intuitive and comprehensive graphical interface to help researchers understand the response of tumor cell lines to 15 therapeutic agents. The data are presented in interactive scatter plots, heatmaps, time series and Venn diagrams. Data can be queried by drug concentration, time point, gene and tissue type. Researchers can download the data for further analysis.
Availability and implementation
Users can download the ready-to-use, self-extracting package for Windows or macOS, and R source code from the project website (https://brb.nci.nih.gov/TPWshiny/). TPWshiny documentation and additional information can be found on the project website.
1 Introduction
Understanding the gene expression changes in response to anti-cancer agents in cell lines is a key step to study clinical response and resistance to therapies. It can help to inform the development of effective combination regimens.
The NCI-60 cell lines are one tool used in early-stage anti-cancer drug discovery. The NCI-60 panel comprises 60 human tumor cell lines in use since the early 1990s to examine the therapeutic activity of thousands of compounds and natural products (Monks et al., 1991; Shoemaker, 2006). These cell lines have been extensively characterized at the molecular level by researchers all around the world. The data and some analysis tools are accessible through multiple publicly available resources and portals (Barretina et al., 2012; Luna et al., 2016 ; Keenan et al., 2018; Musa et al., 2017; Shankavaram et al., 2009; Subramanian, 2017).
The NCI Transcriptional Pharmacodynamics Workbench (NCI TPW) (Monks et al., 2018) is a recently developed web resource (https://tpwb.nci.nih.gov) that provides a comprehensive dataset of directly measured transcriptional responses of the NCI-60 cancer cell lines to multiple agents. The NCI TPW integrates cell line sensitivity data for 15 clinically relevant anticancer agents with transcriptional changes for more than 12 000 genes across the NCI-60 panel at three time points. While the web portal of the NCI TPW enables query of these data in the context of cellular pathways and receptors, there is currently no convenient interactive interface for researchers seeking to perform more dynamic specialized analyses with this dataset. Here we present an R/Shiny application package providing convenient access to NCI TPW data, with effective visualization tools for interactive use.
2 Implementation
TPWshiny is a powerful interactive interface with advanced visualization tools that empower researchers by providing access to the NCI TPW time-course databases on genome-wide response to treatment with drugs (Monks et al., 2018). NCI-60 cell lines were exposed to 15 anticancer agents for 2, 6 and 24 h at two different concentrations and posttreatment gene expression data were collected in addition to untreated expression data. Sensitivity data (log10[GI50]) for each cell line and each drug were compared with the drug induced gene expression changes using Affymetrix GeneChip HT Human Genome U133A microarrays, as well as basal expression measured in untreated control cultures. More information about the data and the findings for this project can be found in prior publications (Monks et al., 2018).
Users can download the ready-to-use, self-extracting package for Windows or macOS, and R source code from the project website (https://brb.nci.nih.gov/TPWshiny/). TPWshiny is an R/Shiny-based (Chang et al., 2020) user interface that provides direct access to several analysis tools including time-course graphs of gene expression for single genes, heatmap analysis of candidate gene expression, analysis of curated genes lists from cancer pathways and receptors, and correlation of gene expression changes with different variables (i.e. drug sensitivity, cell line multidrug resistance status and cell doubling time). The package also includes a visualization tool to identify potential biomarkers of drug response, following the hypothesis that centralized mechanisms of actions can be identified by examining the correlation between gene expression changes and growth inhibition (Min et al., 2019). The list of the 100 genes with the largest absolute correlation between changes in gene expression and GI50 of drugs of choice can be visualized in an interactive Venn diagram. These lists can be used in subsequent gene set enrichment analysis to generate hypotheses about the common biological mechanisms of resistance or sensitivity to the specific drugs selected by the researcher.
The interactive interfaces allow users to explore available data quickly and without the need to write any computer code or scripts. However, users that develop new hypotheses and want to further analyze the data can download the different datasets using ‘Download dataset’ buttons displayed in multiple parts of the R/Shiny interface.
TPWshiny is compatible with R 3.6 and above on all operating systems (Windows, macOS and Linux). Users can download TPWshiny from the project website (https://brb.nci.nih.gov/TPWshiny/) where documentation, demo video and additional information can also be found.
Example outputs are displayed in Figures 1 and 2. Data analyses and plot generation can be performed on any drug, gene, concentration level and time point of choice, and all options are easily accessible from intuitive dropdown menus and selection lists.
Fig. 1.

Examples of TPWshiny in action. (A) Main interface of TPWshiny shows the available tabs at the top, selection options on the left and the main plot in the center. Shown is LIF gene expression following 24 h of exposure to high-concentration doxorubicin. In this plot, it is easy to see that changes in gene expression level are not affecting all cell lines equally: some display a consistent upregulation (e.g. melanoma) while some others have mixed up–down regulation (e.g. lung). This view may help researchers quickly explore questions regarding the effect of drugs on specific genes in cell lines of interest. (B) Scatter plot of MYBL1 gene expression for a selection of cell lines (CNS, melanoma, prostate and renal). The selection of a subset of cell lines and a gene of interest may help researchers to visually display the relationship between gene expression and a specific drug response data measured as logGI50. Exploring these correlations help identify genetic mechanism of sensitivity and resistance
Fig. 2.
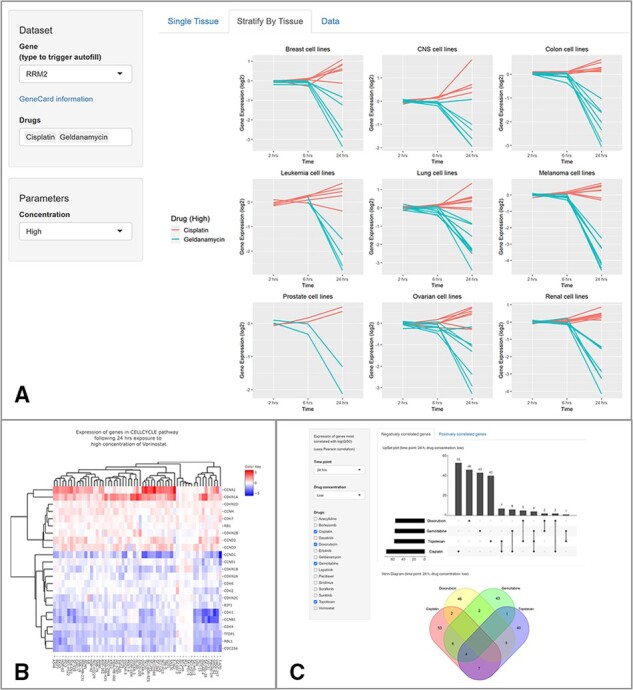
Additional examples of plots available in TPWshiny. (A) Time plots showing RRM2 gene expression changes over the three available time points across nine tissue types for high doses of geldanamycin and cisplatin. The timeseries view of the data helps researchers to see the gene expression change induced by different drugs across multiple cell lines. In the figure it is shown that geldanamcyin is affecting the expression of RRM2 across all cell lines and the effect is stronger at the 24 h time point. (B) Heatmap of genes in the cell cycle pathway and the effect of vorinostat on their expression level. The cell lines (x-axis) and the target genes (y-axis) are both clustered. This view shows that a consistent group of gene is upregulated across cell lines, while another group is consistently downregulated. Depending on the biological question of interest, this view can help researchers unravel the drug mechanism of action or explore additional drug targets. (C) Distribution of the 100 genes with the largest absolute correlation between changes in gene expression and GI50 after low-concentration treatment with cisplatin, doxorubicin, gemcitabine and topotecan for 24 h. Graphical summaries of genes thought to play a role in sensitivity or resistance are displayed through a Venn diagram and an Upset plot (an alternative graphical representation to Venn diagrams that facilitate the visualization of overlapping sets with more than three categories). The list of gene names in each group is displayed below the graphs. This view of the data helps to explore the idea that a correlation between gene expression changes and growth inhibition across multiple drugs may suggest a shared mechanism of action that researchers can further explore like in (Min et al., 2019).
3 Conclusion
TPWshiny provides a resource to help researchers investigate the drug sensitivity and resistance mechanisms, find the novel targets for drug combination treatments and explore the connection between gene expression and response in different cancer cell lines. The R/Shiny interface is designed to allow researchers with minimal computing skills to explore the NCI TPW data. The standalone TPWshiny package complements the online NCI TPW webtools and allow researchers to conduct more powerful analyses of the NCI-60 data with the opportunity to run the interactive data exploration locally, in line with the preference of some companies/organizations not to rely on web solutions for their scientific data analysis.
Acknowledgements
The authors want to thank Dr Lisa McShane and Dr Julia Krushkal Adkins for their critical review of this manuscript; Drs Jianwen Fang, Hari Sankaran, Julia Krushkal Adkins and Cihan Oguz for helping to test the application, and our colleagues in the Biometric Research Program for helpful discussions and suggestions.
Financial Support: none declared.
Conflict of Interest: none declared.
Contributor Information
Peter Zhang, UC Berkeley College of Letters and Science, Berkeley, CA 94720, USA.
Alida Palmisano, Division of Cancer Treatment and Diagnosis, National Cancer Institute, Rockville, MD 20850, USA; General Dynamics Information Technology (GDIT), Falls Church, VA 22042, USA.
Ravindra Kumar, Division of Cancer Treatment and Diagnosis, National Cancer Institute, Rockville, MD 20850, USA.
Ming-Chung Li, Division of Cancer Treatment and Diagnosis, National Cancer Institute, Rockville, MD 20850, USA.
James H Doroshow, Division of Cancer Treatment and Diagnosis, National Cancer Institute, Rockville, MD 20850, USA; Center for Cancer Research, National Cancer Institute, Bethesda, MD 20892, USA.
Yingdong Zhao, Division of Cancer Treatment and Diagnosis, National Cancer Institute, Rockville, MD 20850, USA.
References
- Chang W. et al. (2020) shiny: Web Application Framework for R. R package version 1.5.0.
- Barretina J. et al. (2012) The Cancer Cell Line Encyclopedia enables predictive modelling of anticancer drug sensitivity. Nature, 483, 603–607. [DOI] [PMC free article] [PubMed] [Google Scholar]
- Keenan A.B. et al. (2018) The library of integrated network-based cellular signatures NIH program: system-level cataloging of human cells response to perturbations. Cell Syst., 6, 13–24. [DOI] [PMC free article] [PubMed] [Google Scholar]
- Luna A. et al. (2016) rcellminer: exploring molecular profiles and drug response of the NCI-60 cell lines in R. Bioinformatics, 32, 1272–1274. [DOI] [PMC free article] [PubMed] [Google Scholar]
- Min D.-J. et al. (2019) Identification of pharmacodynamic biomarkers and common molecular mechanisms of response to genotoxic agents in cancer cell lines. Cancer Chemother. Pharmacol., 84, 771–780. [DOI] [PMC free article] [PubMed] [Google Scholar]
- Monks A. et al. (1991) Feasibility of a high-flux anticancer drug screen using a diverse panel of cultured human tumor cell lines. J. Natl. Cancer Inst., 83, 757–766. [DOI] [PubMed] [Google Scholar]
- Monks A. et al. (2018) The NCI transcriptional pharmacodynamics workbench: a tool to examine dynamic expression profiling of therapeutic response in the NCI-60 cell line panel. Cancer Res., 78, 6807–6817. [DOI] [PMC free article] [PubMed] [Google Scholar]
- Musa A. et al. (2017) A review of connectivity map and computational approaches in pharmacogenomics. Brief. Bioinform., 19, 506–523. [DOI] [PMC free article] [PubMed] [Google Scholar]
- Shoemaker R.H. (2006) The NCI60 human tumour cell line anticancer drug screen. Nat. Rev. Cancer, 6, 813–823. [DOI] [PubMed] [Google Scholar]
- Subramanian A. et al. (2017) A next generation connectivity map: l 1000 platform and the first 1,000,000 profiles. Cell, 171, 1437–1452. [DOI] [PMC free article] [PubMed] [Google Scholar]
- Shankavaram U.T. et al. (2009) CellMiner: a relational database and query tool for the NCI-60 cancer cell lines. BMC Genomics, 10, 277. [DOI] [PMC free article] [PubMed] [Google Scholar]