Fig. 4.

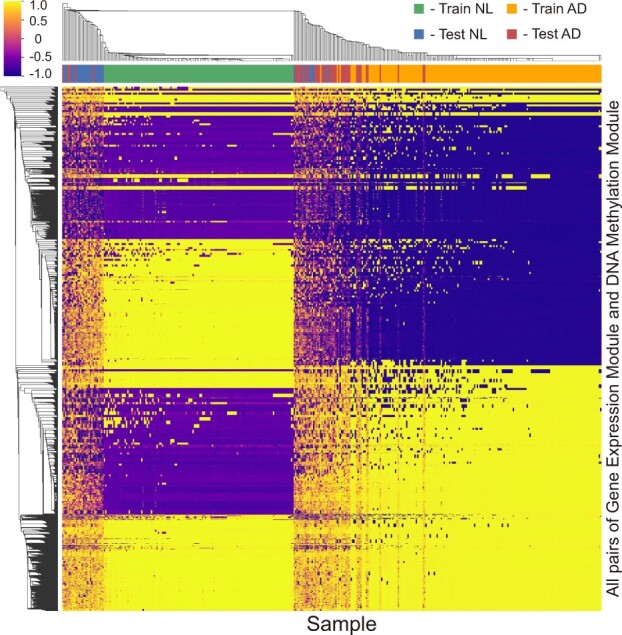
Heatmap of hierarchical clustered cosine similarity scores of the MOMA model in the ROSMAP cohort. Cosine similarity scores between the gene expression and DNA methylation modules of each sample are extracted

Heatmap of hierarchical clustered cosine similarity scores of the MOMA model in the ROSMAP cohort. Cosine similarity scores between the gene expression and DNA methylation modules of each sample are extracted