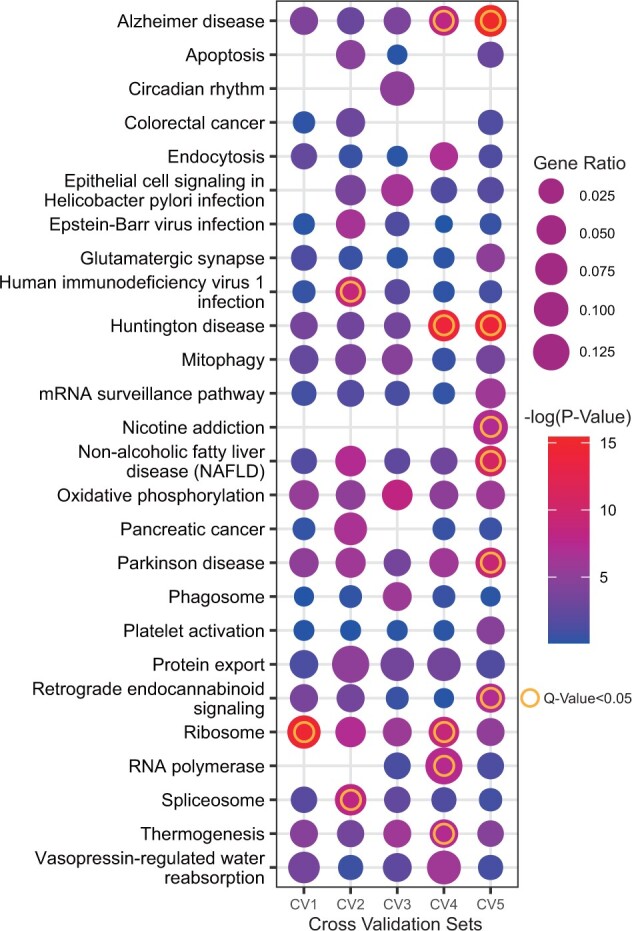
Fig. 5.

The Kyoto Encyclopedia of Genes and Genomes (KEGG) pathway enrichment analysis of each cross-validation (CV) model. The dot size indicates the gene ratio. The dot color indicates the P-value. The ring indicates a significant pathway (q-value < 0.05)
