

Abstract

Cell-imaging methods with functional fluorescent probes are an indispensable technique to evaluate physical parameters in cellular microenvironments. In particular, molecular rotors, which take advantage of the twisted intramolecular charge transfer (TICT) process, have helped evaluate microviscosity. However, the involvement of charge-separated species in the fluorescence process potentially limits the quantitative evaluation of viscosity. Herein, we developed viscosity-responsive fluorescent probes for cell imaging that are not dependent on the TICT process. We synthesized AnP2-H and AnP2-OEG, both of which contain 9,10-di(piperazinyl)anthracene, based on 9,10-bis(N,N-dialkylamino)anthracene that adopts a nonflat geometry at minimum energy conical intersection. AnP2-H and AnP2-OEG exhibited enhanced fluorescence as the viscosity increased, with sensitivities comparable to those of conventional molecular rotors. In living cell systems, AnP2-OEG showed low cytotoxicity and, reflecting its viscosity-responsive property, allowed specific visualization of dense and acidic organelles such as lysosomes, secretory granules, and melanosomes under washout-free conditions. These results provide a new direction for developing functional fluorescent probes targeting dense organelles.
Biological events involve various types of molecules in diverse environments, but these events are generally unobservable unless a combination of spectroscopic and microscopic techniques is used.1,2 Cell-imaging methods with fluorescent molecular probes are indispensable for observing biological molecular behavior and have provided a better understanding of molecular cell biology. Of the various fluorescent probes (e.g., nanoparticles, polymers, and genetically encoded tags) developed to date, fluorescent small organic molecules are particularly attractive in terms of biocompatibility, ease of modification, and reproducibility.3−5 Considerable effort over the past several decades has led to functionalized fluorescent probes being more widely used for the selective visualization of physical parameters in cellular microenvironments.3−7
Microviscosity has attracted considerable attention as a physical parameter in biology because it affects several biologically important phenomena, such as diffusion condensation in the cell and protein folding.8 Microviscosity is most often visualized using so-called “molecular rotors”.9−24 Typically, molecular rotors have two energy local minima in the excited state: the locally excited (LE) state and the twisted intramolecular charge transfer (TICT) state. Since a conformational change is necessary for transition from the LE to the TICT state, higher viscosities, which restrict molecular motions, tend to suppress the transition to TICT, resulting in viscosity-responsive fluorescence.12,25−29 However, since the TICT state inevitably involves a charge-separated species, the fluorescence process can also be affected by other factors such as pH and the concentration of salts,28,30,31 which potentially limits the quantitative evaluation of viscosity in cellular environments.
To avoid such undesired sensitivity to other factors, several approaches have been adopted recently for developing viscosity-responsive fluorescent molecules that are independent of TICT. Saito and co-workers reported viscosity-sensitive flapping molecules (FLAPs) based on an excited-state planarization strategy.32,33 These molecules are remarkably insensitive to polarity, but the large hydrophobic aromatic moiety could make them unsuitable for use in cellular systems. Another approach is the utilization of tetraarylethene derivatives, which are known as aggregation-induced emission luminogens (AIEgens), as viscosity-responsive probes.34,35
In this study, we focused on viscosity-responsive fluorescence caused by restricted access to minimum energy conical intersection (MECI).36−43 If a large conformational change is required to access the MECI in the excited state, fluorescence of the molecules should be responsive to viscosity since high viscosity of the surrounding environment restricts the transition to the MECI. To demonstrate the application of this strategy for developing viscosity-responsive fluorescent probes that can work in cellular systems, we chose 9,10-bis(N,N-dialkylamino)anthracene, reported by Konishi and co-workers.41,43−46 They showed by a theoretical study that this molecule adopts a Dewar-benzene-like nonflat structure at the MECI due to a large structural change from the planar geometry at the Frank–Condon state, together with experimentally confirmed viscosity responsiveness of this molecule.41,47 We expected that its smaller molecular size makes it possible to design highly biocompatible molecules.
Herein, we selected acidic organelles as targets for visualizing the intracellular viscous environment, since the most viscous organelle in the cell is a lysosome,19,34 which is also known as the most acidic.48 Membrane permeability and low cytotoxicity are crucial issues when choosing molecules for the fluorescence imaging of living cells. We previously reported multiblock amphiphilic compounds consisting of aromatic hydrophobic units and hydrophilic oligo(ethylene glycol) chains that have high affinity to lipid bilayer membranes.49 Some of these molecules also work as transmembrane transporters.50 Since oligo(ethylene glycol) units are biocompatible,51 we designed the multiblock molecule AnP2-OEG by combining a diaminoanthracene unit with octa(ethylene glycol) (OEG) chains to allow high membrane permeability while maintaining low cytotoxicity (Figure 1). Indeed, AnP2-OEG showed high water solubility, low cytotoxicity, efficient cellular uptake, and specific visualization of dense and acidic organelles (lysosomes, regulatory secretory granules, and melanosomes) without the need to remove AnP2-OEG from culture medium. Our results provide a new design strategy for reliable viscosity-sensitive fluorescent probes independent of the TICT process.
Figure 1.

(a) Molecular structures of AnP2-H and AnP2-OEG. OEG denotes octa(ethylene glycol). (b) Schematic illustration of the anthracene unit after excitation at low and high viscosities.
Experimental Section
General
Column chromatography was performed using a Chromatorex NH-DM 1020 (100–200 mesh). Proton (1H) and carbon (13C) nuclear magnetic resonance (NMR) spectra were recorded on a Bruker BioSpin Avance III 400 spectrometer (1H: 400 MHz, 13C: 100 MHz). Chemical shifts are given as δ (ppm) relative to tetramethylsilane. Splitting patterns are designated as follows: s (singlet), d (doublet), t (triplet), m (multiplet), and br (broad). High-resolution mass spectrometry (HRMS) spectra were obtained using a Bruker MicrOTOF II spectrometer for electrospray ionization (ESI). Optical spectra were recorded on a Jasco V-650 spectrometer for UV–vis absorption and a Jasco FP-6500 spectrometer for fluorescence using a quartz cell with a 10 mm optical path length. Quantum yields were measured by an absolute method using a Jasco FP-8550 spectrometer equipped with an integrating sphere. An acid–base titration was performed on a Horiba model LAQUA F-72 desktop pH meter equipped with a 9618S-10D micro ToupH electrode.
Materials
All reaction reagents and solvents were obtained from Nacalai Tesque, Fujifilm Wako, Tokyo Chemical Industry, Kanto Chemical, and Aldrich and used without further purification. Workup and purification procedures were carried out with reagent-grade solvents under air. Optical spectra were measured with spectroscopic grade solvents. Deionized water (filtered through a 0.22 μm membrane filter, R > 18.2 MΩ cm) was purified using a Milli-Q system from Millipore.
The reagents for cellular experiments were as follows: phosphate-buffered saline (PBS; TaKaRa), Dulbecco’s modified Eagle medium (DMEM; Nacalai Tesque), FluoroBrite DMEM (Nacalai Tesque), Opti-MEM I Reduced Serum Medium (Gibco), Trypsin-EDTA (Nacalai Tesque), MG132 (Peptide Institute, INC.), bafilomycin A1 (Merck), Lipofectamine 2000 (Invitrogen), MitoTracker Red (Thermo Fisher Scientific), Transferrin-Alexa 594 (Thermo Fisher Scientific), LumiTracker Lyso Red (LysoTracker-Red; Lumiprobe), 35 mm single-well glass-base dishes (Iwaki), and Easy iMatrix-511 for laminin coating (Nippi).
Spectral Measurements
Stock solutions of AnP2-H and AnP2-OEG (10 mM in DMSO) were stored at −20 °C until use. Absorption and fluorescence spectra were typically obtained by adding 1.5 μL of stock solution to 3.0 mL of solvent and stirring well (final concentration of 5.0 μM). When using highly viscous solvents, the solutions were stirred at 70 °C to achieve sufficient mixing.
Computational Methods
DFT and TD-DFT calculations were carried out using the Gaussian 16, Revision B.01 program package52 with the 6-31+G(d,p) basis set.53−56 Geometries in the ground state and the first singlet excited state were optimized by (TD-)DFT calculations with the ωB97XD57 functional and integral equation formalism polarizable continuum model (IEF-PCM)58 method for the solvation effect. The MECI was optimized at the CASSCF59/def2-SVP60 level of theory along with the def2/J auxiliary basis set,61 as implemented in the ORCA program package.62 For further details, see the Supporting Information.
Cell Culture
HeLa, B16-F1, and AtT-20 cells were grown in DMEM supplemented with 10% fetal bovine serum (FBS), 2 mL of l-glutamine, 100 units/mL penicillin, and 0.1 mg/mL streptomycin at 37 °C and 5% CO2. Cytotoxicity was measured using Cell Counting Reagent SF (Nacalai Tesque).
Plasmid Construction
We constructed plasmids for the expression of N-terminal mCherry-tagged ubiquitin (mCherry-ubiquitin) and C-terminal mCherry-tagged Phogrin and Tyrp1 (Phogrin-mCherry and Tyrp1-mCherry). Mouse Phogrin and Tyrp1 cDNAs were amplified using reverse transcription-polymerase chain reaction (RT-PCR) from mRNAs prepared from AtT-20 cells and brain tissues. These cDNAs and mCherry cDNA were subcloned into the pCMV vector.
Plasmid Transfection
Transfections were performed using Lipofectamine 2000 according to the standard protocol. Cells were incubated for 24 h before microscopic observation.
Preparation of Lysate
HeLa cells were lysed with lysis buffer (150 mM Tris-HCl (pH 7.4), 150 mM NaCl, 1 mM EDTA, 1 mM EGTA, and protease inhibitor cocktail (Sigma, P8340)). The lysate was homogenized with a Dounce-type homogenizer and centrifuged at 13,500 rpm for 10 min at 4 °C. The supernatant was restored. The protein concentration was determined as 21 mg/mL by the Bradford method. It was diluted by Tris buffer for fluorescence measurements. BSA was purchased from Wako Chemical. The fluorescence intensity was measured using microplate readers (Varioskan LUX, Thermo Fisher Scientific, λex = 396 nm, λfl = 510 nm).
Microscopic Observation
Cells were cultured in DMEM on a 35 mm glass-base dish (surface-treated with laminin for AtT-20) at 37 °C with 5% CO2 for 1 day. The medium was changed to FluoroBrite before microscopic observation.
Images were obtained with an inverted microscope Ti-E (Nikon) with a phase-contrast system using built-in software (NIS-elements, version 3.22, Nikon). The system comprised a PlanApo 100× VC oil immersion objective lens (NA 1.40) equipped with an EM-CCD (iXon+, gain: 5.1×, readout speed: 3 MHz, Andor) with filter sets (FF01-390/20, FF409-Di03, and FF01-525/45 for AnP2-OEG; FF01-561/14, Di02-R561, and FF01-609/54 for mCherry or Alexa549; Semrock). A xenon lamp was used as a light source.
Staining Using the Fluorescent Probes
AnP2-OEG was dispensed as a 4 μL aliquot of a 5 mM solution in sterile water and stored at −30 °C until use. The AnP2-OEG solution was diluted with culture medium and added to cells on the glass dishes. Unless otherwise noted, the cells were then incubated at 37 °C with 5% CO2 for 30 or 60 min with AnP2-OEG. Commercially available probes were used in the same way with optimized concentrations. The acquired images were analyzed using ImageJ (NIH)63 or NIS-elements AR (ver. 5.30, Nikon).
Results and Discussion
Synthesis of AnP2-H and AnP2-OEG
Figure 1a shows the structure of AnP2-H and AnP2-OEG used in this work. First, we synthesized bispiperazine-substituted anthracene AnP2-H by Buchwald–Hartwig amination64 of 9,10-dibromoanthracene in the presence of an excess amount of piperazine. We anticipated that AnP2-H could be converted into various derivatives due to the free secondary amino groups, which can be easily functionalized without loss of fluorescence properties. AnP2-H was treated with mono-tosylated octa(ethylene glycol) in CH3CN in the presence of K2CO3, yielding AnP2-OEG.65 For details of the synthesis and characterization of AnP2-H and AnP2-OEG, see the Supporting Information.
Photophysical Properties of AnP2-OEG
Prior to using AnP2-OEG in living cell systems, we studied its photophysical properties in aqueous solutions of different pHs to explore the effect of protonation of the amino groups on the compound’s fluorescence properties. Acid–base titration (Figure S5) of AnP2-OEG showed only one equivalence point at pH = 10.1, indicating that this molecule is weakly basic. It was reported that the second protonation of 1-methyl-4-phenylpiperazine occurs only in the concentrated acid solution (estimated as pKa ≈ 0.7).69 Since the titration curve shown in Figure S5 shows good agreement with this report, we considered that the protonation occurs only at the outside (OEG-substituted) amino group in the cellular environment.
The absorption spectra of AnP2-OEG at pH = 7.4 and pH = 10.6 (Figure S6), corresponding to the protonated and deprotonated states, respectively, showed similar spectral profiles regardless of protonation/deprotonation. On the other hand, fluorescence showed a bathochromic shift with deprotonation.
Deprotonation of the amino group reportedly allows for photoinduced electron transfer (PET) and turns off the fluorescence of the adjacent chromophore in some pH-responsive fluorescent probes.17,19,29,70,71 However, no turnoff of fluorescence was observed for the deprotonated state of AnP2-OEG, indicating that PET does not occur in the excited state. The large Stokes shift (ca. 5450 cm–1 in the protonated state, Table S1) of AnP2-OEG compared with general molecular motors is an attractive property of this molecule for application in microscopic observation. While AnP2-OEG showed some difference in fluorescence profiles between pH = 7.4 and pH = 10.6, where protonation/deprotonation of the amino groups takes place, the fluorescence spectra were mostly unchanged within lysosomal pH from 4.5 to 5.5 (Figure S6).48,72,73
To investigate the viscosity dependence of the fluorescence of AnP2-H and AnP2-OEG, fluorescence spectra were recorded using solvent systems with different viscosities (Figure 2a). The fluorescence intensity increased as the viscosity of the solvent increased. The relationship between fluorescence intensity and viscosity has been reported to follow the power-law relationship (the Förster–Hoffmann equation; for details, see the Supporting Information)28,29,74,75
where I is the fluorescence intensity (or quantum yield), x is a dye-dependent constant used as an indicator of the sensitivity of the molecule to viscosity, η is the solvent viscosity, and C is a constant. The plots showed good linear relationships (Figures 2b and S8). The slope of the linear region was x = 0.62 (0.5–523 cP, R2 = 0.982) for AnP2-H and x = 0.65 (0.5–219 cP, R2 = 0.988) for AnP2-OEG, both of which are comparable to the values for TICT-based molecules (e.g., x = 0.79 for thioflavin-T,76x = 0.56 for boron dipyrromethene (BODIPY)-based rotors,25 and x = 0.51 for julolidine-based rotors)74 and tetraphenylethylene-based AIEgen (x = 0.32).35 Also, the slope of both AnP2-H and AnP2-OEG is similar to those reported in Konishi’s previous study,41 indicating that the substitution on the side chain of diaminoanthracene does not likely affect the fluorescent properties.73
Figure 2.

(a) Fluorescence spectra of AnP2-OEG in different solvent systems (5.0 μM at 293 K, λex = 396 nm). (b) Relationship between the photoluminescence maximum of each spectrum and solvent viscosity. 95, 90, 85, 80, 75, and 60 w% glycerol in water, 2-propanol, and methanol, with viscosities of 523, 219, 109, 60.1, 35.3, 10.8,66 2.43,67 and 0.568 cP,68 respectively, were used as the solvent. PL denotes photoluminescence.
Cytotoxicity of AnP2-H and AnP2-OEG
Having confirmed that the photophysical properties of AnP2-H and AnP2-OEG are suitable for biosensing (i.e., large Stokes shift and high sensitivity for viscosity), the cytotoxicity of both molecules was evaluated in cervical cancer HeLa cells using the 2-(2-methoxy-4-nitrophenyl)-3-(4-nitrophenyl)-5-(2,4-disulfophenyl)-2H-tetrazolium monosodium salt (WST-8) assay (Figure 3). AnP2-H was highly cytotoxic at 100 μM and above, whereas more than 80% of cells was viable after 24 h treatment with AnP2-OEG even at 300 μM. This result clearly demonstrates the importance of OEG chains for biocompatibility, and thus we chose AnP2-OEG as a fluorescent probe for exploring its application to cell imaging.
Figure 3.

Cytotoxicity of AnP2-H and AnP2-OEG. HeLa cells were incubated in the presence of AnP2-H and AnP2-OEG for 24 h. Cell viability was evaluated by the WST-8 assay. Error bars represent standard deviations (n = 5).
Subcellular Localization of AnP2-OEG
Next, we examined the cellular uptake and localization of AnP2-OEG in HeLa cells. We treated HeLa cells with 10 μM AnP2-OEG and performed time-lapse imaging using phase-contrast fluorescence microscopy (Figure S12). Just after the addition of AnP2-OEG, the background intensity remained very low and a fluorescence signal was detected in the cells. The fluorescence intensity reached a steady state within 30 min, with specific spots stained in the cytoplasm. Clear fluorescence imaging required a final concentration of about 10 μM AnP2-OEG, while 1 μM was not sufficient. Washout of AnP2-OEG from the culture medium decreased the fluorescence brightness, but the fluorescent spots remained at a detectable intensity (Figure S13). This result suggested that AnP2-OEG tended to diffuse around the cell, but some was trapped in cellular compartments to some extent. A series of data collected over time demonstrate clear visualization of the cellular compartment using AnP2-OEG in washout-free conditions.
To identify the AnP2-OEG-enriched compartments, cells were costained with typical organelle markers (i.e., lysosomes, mitochondria, early endosomes, and aggresomes) (Figures 4 and S14–S16). The colocalization analysis of fluorescence signals (Figure S18) clearly showed that AnP2-OEG fluorescence was colocalized with LysoTracker (Pearson’s correlation R = 0.878 ± 0.029), indicating its specific visualization at lysosomes. In addition, spots with AnP2-OEG and LysoTracker fluorescence were often identified as dark structures (i.e., dense structures with a high refractive index) in phase-contrast images (shown by the arrows in Figure 4 and S12). Thus, AnP2-OEG can detect lysosomes, a highly dense organelle,77 with low background fluorescence even in probe-containing medium. Here, we also found that the fluorescence intensity of AnP2-OEG in lysosomes reversibly changed depending on the osmolality of the medium (Figure S19). Under a hypotonic condition, the fluorescence intensity of AnP2-OEG, but not LysoTracker, became weaker. When the medium was replaced with a normal medium with physiological osmolality, AnP2-OEG fluorescence was restored to its original level. As lysosomes rapidly enlarge under hypotonic conditions and the density of internal biomolecules seems to decrease,78 these results indicate that fluorescence of AnP2-OEG is viscosity-responsive. In addition, the fluorescence intensity of AnP2-OEG was not significantly enhanced by the presence of proteins (Figure S20), suggesting that AnP2-OEG respond to the viscosity of the surrounding environment, enabling organelle-specific visualization.
Figure 4.

Representative microscopic images showing lysosomal staining of HeLa cells in the presence of AnP2-OEG. (a) Phase-contrast and fluorescence images of AnP2-OEG (10 μM) and LysoTracker-Red (50 nM) are shown with their merged images. Zoomed images of the boxed area are shown on the right. Arrows indicate the regions where the dark structures in the phase-contrast images coincide with fluorescence signals from both AnP2-OEG and LysoTracker. Scale bar: 20 μm. (b) Intensity profile of AnP2-OEG and LysoTracker along the dashed line.
We then examined the mechanism of cellular uptake of AnP2-OEG. Small molecules generally enter living cells through two main pathways: membrane permeation and endocytosis.79 Endocytosis is inhibited at 4 °C.80 Incubation of HeLa cells with AnP2-OEG at 4 °C caused a notable decrease in the overall fluorescence signal (Figure 5a,b), indicating that its uptake occurs partly through endocytosis. However, there remained detectable punctate spots at 4 °C, indicating that AnP2-OEG can also enter cells via the membrane permeation mechanism. This was consistent with our molecular design, which introduced OEG chains on the nitrogen of the piperazine units.
Figure 5.

Investigation of mechanisms of cellular uptake and lysosomal localization of AnP2-OEG. Phase-contrast (left) and fluorescence (right) microscopic images of HeLa cells treated with AnP2-OEG (10 μM) at (a) 37 °C and (b) 4 °C for 30 min and (c) pretreated with bafilomycin A1 (200 nM, 37 °C, 1 h) and then treated with AnP2-OEG (10 μM, 37 °C, 30 min). Scale bar: 10 μm. Pseudo-color, lookup table (LUT): fire.
We thus next examined the mechanism underlying lysosomal visualization due to the fluorescence signal of AnP2-OEG. Lysosomes are highly acidic compartments (pH ≈ 4.5),48 and bafilomycin A1 (a strong inhibitor of the lysosomal proton pump V-ATPase) decreases the lysosomal acidity.81 Pretreatment of cells with bafilomycin A1 decreased the fluorescence of AnP2-OEG (Figure 5c), suggesting that the acidity of lysosomes is important for AnP2-OEG accumulation. This result is consistent with the general trend that molecules having weakly basic moieties tend to be distributed in lysosomes.7,8,82 Based on the above results, we propose the following mechanism for the visualization of lysosomes by AnP2-OEG: (1) AnP2-OEG in the cell culture medium is taken up by cells through membrane permeation and endocytosis; (2) the molecules diffuse within the cell; (3) the acidic lysosomes trap AnP2-OEG within ca. 30 min; and (4) viscosity-sensitive AnP2-OEG exhibits fluorescence due to the dense environment of lysosomes, resulting in clear visualization of the lysosomes in washout-free conditions.
Visualization of Cell-Specific Organelles by AnP2-OEG
Based on the above-described mechanism, AnP2-OEG was expected to visualize not only lysosomes but also other cell-specific organelles that provide acidic and dense environments.83 Organelles on the regulated secretory pathway in endocrine cells gradually become more acidic and denser during maturation48,84,85 as secretory granules localizing near the plasma membrane. When we treated AtT-20 pituitary cells with AnP2-OEG, the fluorescence signal of AnP2-OEG was colocalized with that of mCherry-tagged Phogrin (a secretory granule marker) and the intensity profiles showed good colocalization (Figure 6). The Pearson’s correlation R value (R = 0.662 ± 0.225, Figure S18) is relatively lower than that for lysosomes in HeLa cells. Some of the AnP2-OEG signals in the perinuclear region were Phogrin-negative, suggesting that the fluorescence may also have originated from lysosomes. This result indicates that AnP2-OEG can visualize secretory granules due to their acidity and high density.
Figure 6.
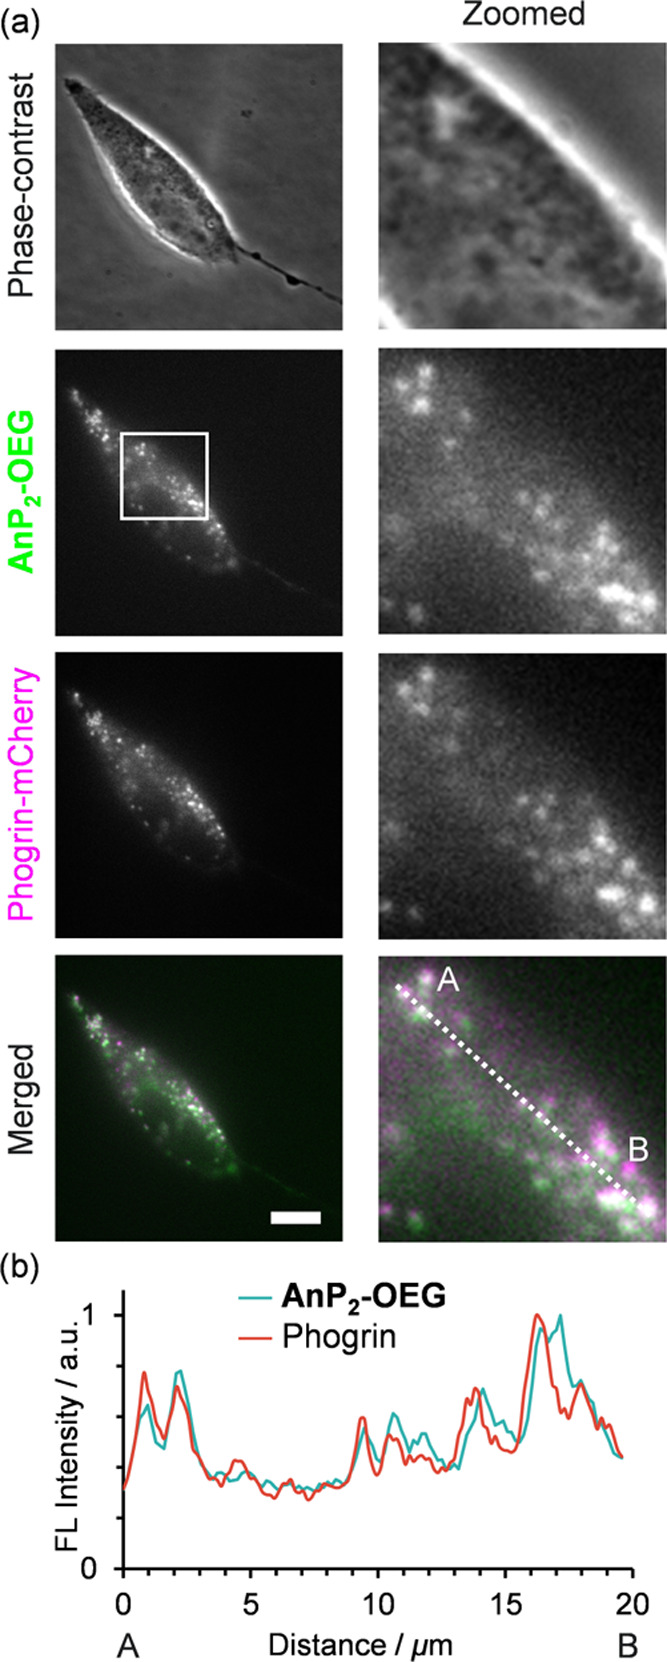
Costaining images of AtT-20 cells by AnP2-OEG and Phogrin-mCherry. (a) Phase-contrast and fluorescence images of AnP2-OEG (10 μM) and Phogrin-mCherry (expressed by transfection) are shown with merged images of AnP2-OEG and Phogrin-mCherry. Zoomed images of the boxed area are shown on the right. Scale bar: 10 μm. (b) Intensity profile of ROIs along the dashed line.
We next investigated melanosomes in melanin-producing cells. Melanosomes are transiently acidic86−88 and are among the densest organelles in a cell.77 Melanosomes are classified into four stages (stage I–IV) based on maturity.89 During maturation, their pH changes from acidic to neutral and their location changes from perinuclear to the cell peripheral region.89,90 When B16-F1 melanoma cells were treated with AnP2-OEG, fluorescence signals from AnP2-OEG were detected in the cytoplasm as some bright spots and along with the cell peripheral regions (Figure S17), and most of these signals were colocalized with mCherry-tagged Tyrp1, a marker mainly for stage III–IV melanosomes89,90 (R = 0.765 ± 0.073, Figure S18). Some spots, which were AnP2-OEG-positive but Tyrp1-negative, were likely lysosomes. We then compared the staining patterns of AnP2-OEG and LysoTracker. LysoTracker reportedly can stain melanosomes,91 but it is unclear at which stage of maturity melanosomes can be stained.92 We found that some AnP2-OEG-positive spots/areas in the cell peripheral region were rarely stained by LysoTracker (Figure 7, green-colored spots/areas indicated by arrows). Since LysoTracker requires an acidic environment for localization,93 it would not efficiently label mature melanosomes due to their low acidity.91 In contrast, the brighter fluorescence signal of AnP2-OEG at the cell periphery strongly suggests an advantage of AnP2-OEG: it does not require a highly acidic environment for organelle targeting and emits fluorescence in a viscosity-dependent manner.
Figure 7.

Costaining images of B16-F1 cells by AnP2-OEG and LysoTracker-Red. Phase-contrast and fluorescence images of AnP2-OEG (10 μM) and LysoTracker-Red (50 nM) are shown with merged images of AnP2-OEG and LysoTracker. Zoomed images of the boxed area are shown on the bottom. Arrows indicate the AnP2-OEG-positive regions that LysoTracker rarely stained. Scale bar: 20 μm.
Conclusions
AnP2-OEG was designed as a viscosity-responsive fluorescent probe independent of the TICT process for living cells and showed viscosity-responsive fluorescence around 0.5–500 cP, efficient cellular uptake, and low cytotoxicity. Cell imaging in the presence of AnP2-OEG resulted in background-free visualization of dense and acidic organelles such as lysosomes, secretory granules, and melanosomes. Our results suggest that the viscosity-dependent fluorescence enhancement of AnP2-OEG plays an important role in this specific visualization and that weak basic moieties enhance localization at acidic organelles. To carry out the quantitative evaluation of viscosity, observation of these organelles using fluorescence lifetime imaging microscopy (FLIM), which is essentially unaffected by molecular concentration, is currently ongoing.12,14,16,17,28,94 We anticipate that the properties of AnP2-OEG (a small chromophore, viscosity responsiveness, efficient cellular uptake, low cytotoxicity, and independence from the TICT process) will provide a new design strategy for developing functional fluorescent probes for biological applications.
Acknowledgments
The authors thank Suzukakedai Materials Analysis Division, Open Facility, Tokyo Institute of Technology, for ESI-TOF mass spectrometry measurements. DFT calculations were carried out using the TSUBAME3.0 supercomputer at Tokyo Institute of Technology. This work was supported by a Grant-in-Aid for JSPS Fellows (JP22J14247 to J.A.), JST SPRING (JPMJSP2106 to J.A.), Grant-in-Aid for Scientific Research on Innovative Areas “Molecular Engine” (JP18H05418 and JP18H05419 to K.K.), Grant-in-Aid for Scientific Research B (JP19H02831 to K.K.), Grant-in-Aid for Research Activity Start-up (JP21K20622 to H.S.), Grant-in-Aid for Early-Career Scientists (JP21K14670 to K.Sato), Grant-in-Aid for Transformative Research Areas “Molecular Cybernetics” (JP21H05872 to K.Sato), and Grant-in-Aid for Scientific Research on Innovative Areas “Chromatin Potential” (JP18H05527 to H.K.). K.Sato also thanks the Foundation for the Promotion of Ion Engineering, Toyota Physical and Chemical Research Institute, and Tokyo Institute of Technology (Challenging Research Award) for financial support.
Supporting Information Available
The Supporting Information is available free of charge at https://pubs.acs.org/doi/10.1021/acs.analchem.2c04133.
Details of synthesis, characterization, acid–base titration, fluorescence studies, and microscopic studies (PDF)
Author Present Address
⊥ Living Systems Materialogy (LiSM) Research Group, International Research Frontiers Initiative (IRFI), Tokyo Institute of Technology, 4259, Nagatsuta-cho, Midori-ku, Yokohama, Kanagawa 226-8501, Japan
Author Contributions
J.A., H.O., T.F., H.K., H.S., K.Sato, and K.K. conceived the experiments. J.A. synthesized and characterized the molecules and measured optical spectra. J.A. and R.H. performed computational studies. J.A., H.O., and T.F. performed cellular experiments. J.A., H.O., T.F., and H.K. obtained microscopic images. B.L. evaluated cytotoxicity. T.F., H.K., K.Shiraki, and K.K. directed the project. J.A. wrote the manuscript with feedback from all of the authors.
The authors declare no competing financial interest.
Notes
An earlier version of this manuscript was submitted to the preprint server ChemRxiv: https://chemrxiv.org/engage/chemrxiv/article-details/63df6a4e45d4b84aae9e688c.
Supplementary Material
References
- Pittet M. J.; Weissleder R. Intravital Imaging. Cell 2011, 147, 983–991. 10.1016/j.cell.2011.11.004. [DOI] [PMC free article] [PubMed] [Google Scholar]
- Germain R. N.; Robey E. A.; Cahalan M. D. A Decade of Imaging Cellular Motility and Interaction Dynamics in the Immune System. Science 2012, 336, 1676–1681. 10.1126/science.1221063. [DOI] [PMC free article] [PubMed] [Google Scholar]
- Xiao H.; Li P.; Tang B. Small Molecular Fluorescent Probes for Imaging of Viscosity in Living Biosystems. Chem.–Eur. J. 2021, 27, 6880–6898. 10.1002/chem.202004888. [DOI] [PubMed] [Google Scholar]
- Kowada T.; Maeda H.; Kikuchi K. BODIPY-Based Probes for the Fluorescence Imaging of Biomolecules in Living Cells. Chem. Soc. Rev. 2015, 44, 4953–4972. 10.1039/C5CS00030K. [DOI] [PubMed] [Google Scholar]
- Zhu C.; Kwok R. T. K.; Lam J. W. Y.; Tang B. Z. Aggregation-Induced Emission: A Trailblazing Journey to the Field of Biomedicine. ACS Appl. Bio Mater. 2018, 1, 1768–1786. 10.1021/acsabm.8b00600. [DOI] [PubMed] [Google Scholar]
- Xu W.; Zeng Z.; Jiang J.-H.; Chang Y.-T.; Yuan L. Discerning the Chemistry in Individual Organelles with Small-Molecule Fluorescent Probes. Angew. Chem., Int. Ed. 2016, 55, 13658–13699. 10.1002/anie.201510721. [DOI] [PubMed] [Google Scholar]
- Gao P.; Pan W.; Li N.; Tang B. Fluorescent Probes for Organelle-Targeted Bioactive Species Imaging. Chem. Sci. 2019, 10, 6035–6071. 10.1039/C9SC01652J. [DOI] [PMC free article] [PubMed] [Google Scholar]
- Frauenfelder H.; Fenimore P. W.; Chen G.; McMahon B. H. Protein folding is slaved to solvent motions. Proc. Natl. Acad. Sci. U.S.A. 2006, 103, 15469–15472. 10.1073/pnas.0607168103. [DOI] [PMC free article] [PubMed] [Google Scholar]
- Kuimova M. K.; Yahioglu G.; Levitt J. A.; Suhling K. Molecular Rotor Measures Viscosity of Live Cells via Fluorescence Lifetime Imaging. J. Am. Chem. Soc. 2008, 130, 6672–6673. 10.1021/ja800570d. [DOI] [PubMed] [Google Scholar]
- Ma C.; Sun W.; Xu L.; Qian Y.; Dai J.; Zhong G.; Hou Y.; Liu J.; Shen B. A Minireview of Viscosity-Sensitive Fluorescent Probes: Design and Biological Applications. J. Mater. Chem. B 2020, 8, 9642–9651. 10.1039/D0TB01146K. [DOI] [PubMed] [Google Scholar]
- Chambers J. E.; Kubánková M.; Huber R. G.; López-Duarte I.; Avezov E.; Bond P. J.; Marciniak S. J.; Kuimova M. K. An Optical Technique for Mapping Microviscosity Dynamics in Cellular Organelles. ACS Nano 2018, 12, 4398–4407. 10.1021/acsnano.8b00177. [DOI] [PubMed] [Google Scholar]
- Kuimova M. K. Mapping Viscosity in Cells using Molecular Rotors. Phys. Chem. Chem. Phys. 2012, 14, 12671–12686. 10.1039/c2cp41674c. [DOI] [PubMed] [Google Scholar]
- Lee S.-C.; Heo J.; Woo H. C.; Lee J.-A.; Seo Y. H.; Lee C.-L.; Kim S.; Kwon O.-P. Fluorescent Molecular Rotors for Viscosity Sensors. Chem.–Eur. J. 2018, 24, 13706–13718. 10.1002/chem.201801389. [DOI] [PubMed] [Google Scholar]
- Kashirina A. S.; Löpez-Duarte I.; Kubánková M.; Gulin A. A.; Dudenkova V. V.; Rodimova S. A.; Torgomyan H. G.; et al. Monitoring Membrane Viscosity in Differentiating Stem Cells Using BODIPY-Based Molecular Rotors and FLIM. Sci. Rep. 2020, 10, 14063 10.1038/s41598-020-70972-5. [DOI] [PMC free article] [PubMed] [Google Scholar]
- Song Y.; Zhang H.; Wang X.; Geng X.; Sun Y.; Liu J.; Li Z. One Stone, Three Birds: pH Triggered Transformation of Aminopyronine and Iminopyronine Based Lysosome Targeting Viscosity Probe for Cancer Visualization. Anal. Chem. 2021, 93, 1786–1791. 10.1021/acs.analchem.0c04644. [DOI] [PubMed] [Google Scholar]
- Loison P.; Hosny N. A.; Gervais P.; Champion D.; Kuimova M. K.; Perrier-Cornet J.-M. Direct Investigation of Viscosity of an Atypical Inner Membrane of Bacillus Spores: A Molecular Rotor/FLIM Study. Biochim. Biophys. Acta Biomembr. 2013, 1828, 2436–2443. 10.1016/j.bbamem.2013.06.028. [DOI] [PubMed] [Google Scholar]
- Wang L.; Xiao Y.; Tian W.; Deng L. Activatable Rotor for Quantifying Lysosomal Viscosity in Living Cells. J. Am. Chem. Soc. 2013, 135, 2903–2906. 10.1021/ja311688g. [DOI] [PubMed] [Google Scholar]
- Liu C.; Zhao T.; He S.; Zhao L.; Zeng X. A Lysosome-Targeting Viscosity-Sensitive Fluorescent Probe Based on a Novel Functionalised near-Infrared Xanthene-Indolium Dye and Its Application in Living Cells. J. Mater. Chem. B 2020, 8, 8838–8844. 10.1039/D0TB01329C. [DOI] [PubMed] [Google Scholar]
- Liu T.; Liu X.; Spring D. R.; Qian X.; Cui J.; Xu Z. Quantitatively Mapping Cellular Viscosity with Detailed Organelle Information via a Designed PET Fluorescent Probe. Sci. Rep. 2014, 4, 5418 10.1038/srep05418. [DOI] [PMC free article] [PubMed] [Google Scholar]
- Li L.-L.; Li K.; Li M.-Y.; Shi L.; Liu Y.-H.; Zhang H.; Pan S.-L.; Wang N.; Zhou Q.; Yu X.-Q. BODIPY-Based Two-Photon Fluorescent Probe for Real-Time Monitoring of Lysosomal Viscosity with Fluorescence Lifetime Imaging Microscopy. Anal. Chem. 2018, 90, 5873–5878. 10.1021/acs.analchem.8b00590. [DOI] [PubMed] [Google Scholar]
- Yang Z.; He Y.; Lee J.-H.; Park N.; Suh M.; Chae W.-S.; Cao J.; Peng X.; Jung H.; Kang C.; Kim J. S. A Self-Calibrating Bipartite Viscosity Sensor for Mitochondria. J. Am. Chem. Soc. 2013, 135, 9181–9185. 10.1021/ja403851p. [DOI] [PubMed] [Google Scholar]
- Song X.; Li N.; Wang C.; Xiao Y. Targetable and Fixable Rotor for Quantifying Mitochondrial Viscosity of Living Cells by Fluorescence Lifetime Imaging. J. Mater. Chem. B 2017, 5, 360–368. 10.1039/C6TB02524B. [DOI] [PubMed] [Google Scholar]
- Chao X.; Qi Y.; Zhang Y. Highly Photostable Fluorescent Tracker with pH-Insensitivity for Long-Term Imaging of Lysosomal Dynamics in Live Cells. ACS Sens. 2021, 6, 786–796. 10.1021/acssensors.0c01588. [DOI] [PubMed] [Google Scholar]
- Chao X.-J.; Pan Z.-Y.; Sun L.-L.; Tang M.; Wang K.-N.; Mao Z.-W. A pH-insensitive near-infrared fluorescent probe for wash-free lysosome-specific tracking with long time during physiological and pathological processes. Sens. Actuators, B 2019, 285, 156–163. 10.1016/j.snb.2019.01.045. [DOI] [Google Scholar]
- Liu X.; Chi W.; Qiao Q.; Kokate S. V.; Cabrera E. P.; Xu Z.; Liu X.; Chang Y.-T. Molecular Mechanism of Viscosity Sensitivity in BODIPY Rotors and Application to Motion-Based Fluorescent Sensors. ACS Sens. 2020, 5, 731–739. 10.1021/acssensors.9b01951. [DOI] [PubMed] [Google Scholar]
- Prlj A.; Vannay L.; Corminboeuf C. Fluorescence Quenching in BODIPY Dyes: The Role of Intramolecular Interactions and Charge Transfer. Helv. Chim. Acta 2017, 100, e1700093 10.1002/hlca.201700093. [DOI] [Google Scholar]
- Kee H. L.; Kirmaiery C.; Yu L.; Thamyongkit P.; Youngblood W. J.; Calder M. E.; Ramos L.; Noll B. C.; Bocian D. F.; Scheldt W. R.; Birge R. R.; Lindsey J. S.; Holten D. Structural Control of the Photodynamics of Boron-Dipyrrin Complexes. J. Phys. Chem. B 2005, 109, 20433–20443. 10.1021/jp0525078. [DOI] [PMC free article] [PubMed] [Google Scholar]
- Haidekker M. A.; Theodorakis E. A. Environment-Sensitive Behavior of Fluorescent Molecular Rotors. J. Biol. Eng. 2010, 4, 11. 10.1186/1754-1611-4-11. [DOI] [PMC free article] [PubMed] [Google Scholar]
- Wang C.; Chi W.; Qiao Q.; Tan D.; Xu Z.; Liu X. Twisted Intramolecular Charge Transfer (TICT) and Twists beyond TICT: From Mechanisms to Rational Designs of Bright and Sensitive Fluorophores. Chem. Soc. Rev. 2021, 50, 12656–12678. 10.1039/D1CS00239B. [DOI] [PubMed] [Google Scholar]
- Haidekker M. A.; Brady T. P.; Lichlyter D.; Theodorakis E. A. Effects of Solvent Polarity and Solvent Viscosity on the Fluorescent Properties of Molecular Rotors and Related Probes. Bioorg. Chem. 2005, 33, 415–425. 10.1016/j.bioorg.2005.07.005. [DOI] [PubMed] [Google Scholar]
- Vyšniauskas A.; López-Duarte I.; Duchemin N.; Vu T. T.; Wu Y.; Budynina E. M.; Volkova Y. A.; Peña Cabrera E.; Ramírez-Ornelas D. E.; Kuimova M. K. Exploring Viscosity, Polarity and Temperature Sensitivity of BODIPY-Based Molecular Rotors. Phys. Chem. Chem. Phys. 2017, 19, 25252–25259. 10.1039/C7CP03571C. [DOI] [PubMed] [Google Scholar]
- Kotani R.; Sotome H.; Okajima H.; Yokoyama S.; Nakaike Y.; Kashiwagi A.; Mori C.; Nakada Y.; Yamaguchi S.; Osuka A.; Sakamoto A.; Miyasaka H.; Saito S. Flapping viscosity probe that shows polarity-independent ratiometric fluorescence. J. Mater. Chem. C 2017, 5, 5248–5256. 10.1039/C7TC01533J. [DOI] [Google Scholar]
- Kimura R.; Kitakado H.; Osuka A.; Saito S. Flapping Peryleneimide as a Fluorescent Viscosity Probe: Comparison with BODIPY and DCVJ Molecular Rotors. Bull. Chem. Soc. Jpn. 2020, 93, 1102–1106. 10.1246/bcsj.20200117. [DOI] [Google Scholar]
- Cai Y.; Gui C.; Samedov K.; Su H.; Gu X.; Li S.; Luo W.; Sung H. H. Y.; Lam J. W. Y.; Kwok R. T. K.; Williams I. D.; Qin A.; Tang B. Z. An acidic pH independent piperazine–TPE AIEgen as a unique bioprobe for lysosome tracing. Chem. Sci. 2017, 8, 7593–7603. 10.1039/C7SC03515B. [DOI] [PMC free article] [PubMed] [Google Scholar]
- Chen W.; Gao C.; Liu X.; Liu F.; Wang F.; Tang L. J.; Jiang J. H. Engineering Organelle-Specific Molecular Viscosimeters Using Aggregation-Induced Emission Luminogens for Live Cell Imaging. Anal. Chem. 2018, 90, 8736–8741. 10.1021/acs.analchem.8b02940. [DOI] [PubMed] [Google Scholar]
- Peng Q.; Shuai Z. Molecular Mechanism of Aggregation-induced Emission. Aggregate 2021, 2, e91 10.1002/agt2.91. [DOI] [Google Scholar]
- Guan J.; Shen C.; Peng J.; Zheng J. What Leads to Aggregation-Induced Emission?. J. Phys. Chem. Lett. 2021, 12, 4218–4226. 10.1021/acs.jpclett.0c03861. [DOI] [PubMed] [Google Scholar]
- Inoue R.; Naota T.; Ehara M. Origin of the Aggregation-Induced Phosphorescence of Platinum(II) Complexes: The Role of Metal–Metal Interactions on Emission Decay in the Crystalline State. Chem. Asian J. 2021, 16, 3129–3140. 10.1002/asia.202100887. [DOI] [PubMed] [Google Scholar]
- Nanbu S.; Ishida T.; Nakamura H. Future Perspectives of Nonadiabatic Chemical Dynamics. Chem. Sci. 2010, 1, 663–674. 10.1039/c0sc00274g. [DOI] [Google Scholar]
- Li Q.; Blancafort L. A Conical Intersection Model to Explain Aggregation Induced Emission in Diphenyl Dibenzofulvene. Chem. Commun. 2013, 49, 5966–5968. 10.1039/c3cc41730a. [DOI] [PubMed] [Google Scholar]
- Sasaki S.; Suzuki S.; Sameera W. M. C.; Igawa K.; Morokuma K.; Konishi G.-i. Highly Twisted N,N-Dialkylamines as a Design Strategy to Tune Simple Aromatic Hydrocarbons as Steric Environment-Sensitive Fluorophores. J. Am. Chem. Soc. 2016, 138, 8194–8206. 10.1021/jacs.6b03749. [DOI] [PubMed] [Google Scholar]
- Crespo-Otero R.; Li Q.; Blancafort L. Exploring Potential Energy Surfaces for Aggregation-Induced Emission—From Solution to Crystal. Chem. Asian J. 2019, 14, 700–714. 10.1002/asia.201801649. [DOI] [PubMed] [Google Scholar]
- Ikemoto K.; Tokuhira T.; Uetani A.; Harabuchi Y.; Sato S.; Maeda S.; Isobe H. Fluorescence Enhancement of Aromatic Macrocycles by Lowering Excited Singlet State Energies. J. Org. Chem. 2020, 85, 150–157. 10.1021/acs.joc.9b02379. [DOI] [PubMed] [Google Scholar]
- Sasaki S.; Igawa K.; Konishi G.-i. The Effect of Regioisomerism on the Solid-State Fluorescence of Bis(Piperidyl)Anthracenes: Structurally Simple but Bright AIE Luminogens. J. Mater. Chem. C 2015, 3, 5940–5950. 10.1039/C5TC00946D. [DOI] [Google Scholar]
- Sairi A. S.; Kuwahara K.; Sasaki S.; Suzuki S.; Igawa K.; Tokita M.; Ando S.; Morokuma K.; Suenobu T.; Konishi G.-i. Synthesis of Fluorescent Polycarbonates with Highly Twisted: N,N-Bis(Dialkylamino)Anthracene AIE Luminogens in the Main Chain. RSC Adv. 2019, 9, 21733–21740. 10.1039/C9RA03701B. [DOI] [PMC free article] [PubMed] [Google Scholar]
- Sharidan Sairi A.; Konishi G.-i. Synthesis and Luminescence Properties of Diamine Monomers and Polyamides with Highly Twisted N,N-Bis(Dialkylamino)Arene AIE Luminogens. Asian J. Org. Chem. 2019, 8, 404–410. 10.1002/ajoc.201900056. [DOI] [Google Scholar]
- Yin P.-A.; Ou Q.; Peng Q.; Shuai Z. Substituent-controlled aggregate luminescence: Computational unraveling of S1/S0 surface crossing. Aggregate 2022, e291. 10.1002/agt2.291. [DOI] [Google Scholar]
- Casey J. R.; Grinstein S.; Orlowski J. Sensors and Regulators of Intracellular pH. Nat. Rev. Mol. Cell Biol. 2010, 11, 50–61. 10.1038/nrm2820. [DOI] [PubMed] [Google Scholar]
- Sato K.; Muraoka T.; Kinbara K. Supramolecular Transmembrane Ion Channels Formed by Multiblock Amphiphiles. Acc. Chem. Res. 2021, 54, 3700–3709. 10.1021/acs.accounts.1c00397. [DOI] [PubMed] [Google Scholar]
- Mori M.; Sato K.; Ekimoto T.; Okumura S.; Ikeguchi M.; Tabata K. V.; Noji H.; Kinbara K. Imidazolinium-based Multiblock Amphiphile as Transmembrane Anion Transporter. Chem. Asian J. 2021, 16, 147–157. 10.1002/asia.202001106. [DOI] [PubMed] [Google Scholar]
- Simón-Gracia L.; Pulido D.; Sevrin C.; Grandfils C.; Albericio F.; Royo M. Biocompatible, multifunctional, and well-defined OEG-based dendritic platforms for biomedical applications. Org. Biomol. Chem. 2013, 11, 4109–4121. 10.1039/c3ob40492g. [DOI] [PubMed] [Google Scholar]
- Frisch M. J.; Trucks G. W.; Schlegel H. B.; Scuseria G. E.; Robb M. A.; Cheeseman J. R.; Scalmani G.; Barone V.; Petersson G. A.; Nakatsuji H.; Li X.; Caricato M.; Marenich A. V.; Bloino J.; Janesko B. G.; Gomperts R.; Mennucci B.; Hratchian H. P.; Ortiz J. V.; Izmaylov A. F.; Sonnenberg J. L.; Williams-Young D.; Ding F.; Lipparini F.; Egidi F.; Goings J.; Peng B.; Petrone A.; Henderson T.; Ranasinghe D.; Zakrzewski V. G.; Gao J.; Rega N.; Zheng G.; Liang W.; Hada M.; Ehara M.; Toyota K.; Fukuda R.; Hasegawa J.; Ishida M.; Nakajima T.; Honda Y.; Kitao O.; Nakai H.; Vreven T.; Throssell K.; Montgomery J. A. Jr.; Peralta J. E.; Ogliaro F.; Bearpark M. J.; Heyd J. J.; Brothers E. N.; Kudin K. N.; Staroverov V. N.; Keith T. A.; Kobayashi R.; Normand J.; Raghavachari K.; Rendell A. P.; Burant J. C.; Iyengar S. S.; Tomasi J.; Cossi M.; Millam J. M.; Klene M.; Adamo C.; Cammi R.; Ochterski J. W.; Martin R. L.; Morokuma K.; Farkas O.; Foresman J. B.; Fox D. J.. Gaussian 16, revision B.01Gaussian, Inc.: Wallingford, CT, 2016.
- Hariharan P. C.; Pople J. A. The influence of polarization functions on molecular orbital hydrogenation energies. Theor. Chim. Acta 1973, 28, 213–222. 10.1007/BF00533485. [DOI] [Google Scholar]
- Francl M. M.; Pietro W. J.; Hehre W. J.; Binkley J. S.; Gordon M. S.; DeFrees D. J.; Pople J. A. Self-consistent molecular orbital methods. XXIII. A polarization-type basis set for second-row elements. J. Chem. Phys. 1982, 77, 3654–3665. 10.1063/1.444267. [DOI] [Google Scholar]
- Clark T.; Chandrasekhar J.; Spitznagel G. W.; Schleyer P. v. R. Efficient diffuse function-augmented basis sets for anion calculations. III. The 3-21+G basis set for first-row elements, Li–F. J. Comput. Chem. 1983, 4, 294–301. 10.1002/jcc.540040303. [DOI] [Google Scholar]
- Miehlich B.; Savin A.; Stoll H.; Preuss H. Results obtained with the correlation energy density functionals of becke and Lee, Yang and Parr. Chem. Phys. Lett. 1989, 157, 200–206. 10.1016/0009-2614(89)87234-3. [DOI] [Google Scholar]
- Chai J.-D.; Head-Gordon M. Long-range corrected hybrid density functionals with damped atom–atom dispersion corrections. Phys. Chem. Phys. Chem. 2008, 10, 6615–6629. 10.1039/b810189b. [DOI] [PubMed] [Google Scholar]
- Cancès E.; Mennucci B.; Tomasi J. A new integral equation formalism for the polarizable continuum model: Theoretical background and applications to isotropic and anisotropic dielectrics. J. Chem. Phys. 1997, 107, 3032–3041. 10.1063/1.474659. [DOI] [Google Scholar]
- Hegarty D.; Robb M. A. Application of unitary group methods to configuration interaction calculations. Mol. Phys. 1979, 38, 1795–1812. 10.1080/00268977900102871. [DOI] [Google Scholar]
- Weigend F.; Ahlrichs R. Balanced Basis Sets of Split Valence, Triple Zeta Valence and Quadruple Zeta Valence Quality for H to Rn: Design and Assessment of Accuracy. Phys. Chem. Chem. Phys. 2005, 7, 3297–3305. 10.1039/b508541a. [DOI] [PubMed] [Google Scholar]
- Weigend F. Accurate Coulomb-fitting basis sets for H to Rn. Phys. Chem. Chem. Phys. 2006, 8, 1057–1065. 10.1039/b515623h. [DOI] [PubMed] [Google Scholar]
- Neese F. The ORCA program system. WIREs Comput. Mol. Sci. 2012, 2, 73–78. 10.1002/wcms.81. [DOI] [Google Scholar]
- Abramoff M. D.; Magelhaes P. J.; Ram S. J. Image Processing with ImageJ. Biophotonics Int. 2004, 11, 36–42. [Google Scholar]
- Dorel R.; Grugel C. P.; Haydl A. M. The Buchwald–Hartwig Amination After 25 Years. Angew. Chem., Int. Ed. 2019, 58, 17118–17129. 10.1002/anie.201904795. [DOI] [PubMed] [Google Scholar]
- By introducing hydrophilic ethylene glycol chains, AnP2-OEG became soluble in pure water to more than 20 mM, while AnP2-H was only on the order of 10 μM.
- Segur J. B.; Oderstar H. E. Viscosity of Glycerol and Its Aqueous Solutions. Ind. Eng. Chem. 1951, 43, 2117–2120. 10.1021/ie50501a040. [DOI] [Google Scholar]
- Shirazi S. G.; Kermanpour F. Density and Viscosity of 2-Butanol+(1-Propanol, 2-Propanol, or 3-Amino-1-Propanol) Mixtures at Temperatures of (293.15 to 323.15) K: Application of the ERAS Model. J. Chem. Eng. Data 2019, 64, 2292–2302. 10.1021/acs.jced.8b01097. [DOI] [Google Scholar]
- Gong Y.-H.; Shen C.; Lu Y.-z.; Meng H.; Li C.-x. Viscosity and Density Measurements for Six Binary Mixtures of Water (Methanol or Ethanol) with an Ionic Liquid ([BMIM][DMP] or [EMIM][DMP]) at Atmospheric Pressure in the Temperature Range of (293.15 to 333.15) K. J. Chem. Eng. Data 2012, 57, 33–39. 10.1021/je200600p. [DOI] [Google Scholar]
- Ladinig M.; Leupin W.; Meuwly M.; Respondek M.; Wirz J.; Zoete V. Protonation Equilibria of Hoechst 33258 in Aqueous Solution. Helv. Chim. Acta 2005, 88, 53–67. 10.1002/hlca.200490296. [DOI] [Google Scholar]
- Fu Y.; Zhang J.; Wang H.; Chen J.-L.; Zhao P.; Chen G.-R.; He X.-P. Intracellular pH Sensing and Targeted Imaging of Lysosome by a Galactosyl Naphthalimide-Piperazine Probe. Dye Pigment. 2016, 133, 372–379. 10.1016/j.dyepig.2016.06.022. [DOI] [Google Scholar]
- Zhang J.; Yang M.; Li C.; Dorh N.; Xie F.; Luo F. T.; Tiwari A.; Liu H. Near-Infrared Fluorescent Probes Based on Piperazine-Functionalized BODIPY Dyes for Sensitive Detection of Lysosomal pH. J. Mater. Chem. B 2015, 3, 2173–2184. 10.1039/C4TB01878H. [DOI] [PubMed] [Google Scholar]
- Li S.-S.; Zhang M.; Wang J.-H.; Yang F.; Kang B.; Xu J.-J.; Chen H.-Y. Monitoring the Changes of pH in Lysosomes during Autophagy and Apoptosis by Plasmon Enhanced Raman Imaging. Anal. Chem. 2019, 91, 8398–8405. 10.1021/acs.analchem.9b01250. [DOI] [PubMed] [Google Scholar]
- The computational study was performed to discuss the optical properties of AnP2-OEG. For the details, see Supporting Information.
- Loutfy R. O.; Arnold B. A. Effect of Viscosity and Temperature on Torsional Relaxation of Molecular Rotors. J. Phys. Chem. A 1982, 86, 4205–4211. 10.1021/j100218a023. [DOI] [Google Scholar]
- Förster T.; Hoffmann G. Die Viskositätsabhängigkeit Der Fluoreszenzquantenausbeuten Einiger Farbstoffsysteme. Z. Phys. Chem. 1971, 75, 63–76. 10.1524/zpch.1971.75.1_2.063. [DOI] [Google Scholar]
- Ye S.; Zhang H.; Fei J.; Wolstenholme C. H.; Zhang X. A General Strategy to Control Viscosity Sensitivity of Molecular Rotor-Based Fluorophores. Angew. Chem., Int. Ed. 2021, 60, 1339–1346. 10.1002/anie.202011108. [DOI] [PMC free article] [PubMed] [Google Scholar]
- Gul B.; Ashraf S.; Khan S.; Nisar H.; Ahmad I. Cell Refractive Index: Models, Insights, Applications and Future Perspectives. Photodiagn. Photodyn. Ther. 2021, 33, 102096 10.1016/j.pdpdt.2020.102096. [DOI] [PubMed] [Google Scholar]
- Li P.; Hu M.; Wang C.; Feng X.; Zhao Z.; Yang Y.; Sahoo N.; Gu M.; Yang Y.; Xiao S.; Sah R.; Cover T. L.; Chou J.; Geha R.; Benavides F.; Hume R. I.; Xu H. LRRC8 family proteins within lysosomes regulate cellular osmoregulation and enhance cell survival to multiple physiological stresses. Proc. Natl. Acad. Sci. U.S.A. 2020, 117, 29155–29165. 10.1073/pnas.2016539117. [DOI] [PMC free article] [PubMed] [Google Scholar]
- Mosquera J.; García I.; Liz-Marzán L. M. Cellular Uptake of Nanoparticles versus Small Molecules: A Matter of Size. Acc. Chem. Res. 2018, 51, 2305–2313. 10.1021/acs.accounts.8b00292. [DOI] [PubMed] [Google Scholar]
- Steinman R. M.; Mellman I. S.; Muller W. A.; Cohn Z. A. Endocytosis and the Recycling of Plasma Membrane. J. Cell Biol. 1983, 96, 1–27. 10.1083/jcb.96.1.1. [DOI] [PMC free article] [PubMed] [Google Scholar]
- Yoshimori T.; Yamamoto A.; Moriyama Y.; Futai M.; Tashiro Y. Bafilomycin A1, a Specific Inhibitor of Vacuolar-Type H+-ATPase, Inhibits Acidification and Protein Degradation in Lysosomes of Cultured Cells. J. Biol. Chem. 1991, 266, 17707–17712. 10.1016/S0021-9258(19)47429-2. [DOI] [PubMed] [Google Scholar]
- Zhu J. L.; Xu Z.; Yang Y.; Xu L. Small-Molecule Fluorescent Probes for Specific Detection and Imaging of Chemical Species inside Lysosomes. Chem. Commun. 2019, 55, 6629–6671. 10.1039/C9CC03299A. [DOI] [PubMed] [Google Scholar]
- Mukherjee N.; Gaur R.; Shahabuddin S.; Chandra P. Recent Progress in Lysosome-Targetable Fluorescent BODIPY Probes for Bioimaging Applications. Mater. Today Proc. 2022, 62, 7082–7087. 10.1016/j.matpr.2022.01.220. [DOI] [Google Scholar]
- Paroutis P.; Touret N.; Grinstein S. The pH of the Secretory Pathway: Measurement, Determinants, and Regulation. Physiology 2004, 19, 207–215. 10.1152/physiol.00005.2004. [DOI] [PubMed] [Google Scholar]
- Meldolesi J.; Chieregatti E.; Malosio M. L. Requirements for the identification of dense-core granules. Trends Cell Biol. 2004, 14, 13–19. 10.1016/j.tcb.2003.11.006. [DOI] [PubMed] [Google Scholar]
- Ancans J.; Tobin D. J.; Hoogduijn M. J.; Smit N. P.; Wakamatsu K.; Thody A. J. Melanosomal pH Controls Rate of Melanogenesis, Eumelanin/Phaeomelanin Ratio and Melanosome Maturation in Melanocytes and Melanoma Cells. Exp. Cell Res. 2001, 268, 26–35. 10.1006/excr.2001.5251. [DOI] [PubMed] [Google Scholar]
- Aktary Z.; Conde-Perez A.; Rambow F.; Di Marco M.; Amblard F.; Hurbain I.; Raposo G.; Delevoye C.; Coscoy S.; Larue L. A Role for Dynlt3 in Melanosome Movement, Distribution, Acidity and Transfer. Commun. Biol. 2021, 4, 423. 10.1038/s42003-021-01917-5. [DOI] [PMC free article] [PubMed] [Google Scholar]
- Ambrosio A. L.; Boyle J. A.; Aradi A. E.; Christian K. A.; Di Pietro S. M. TPC2 Controls Pigmentation by Regulating Melanosome pH and Size. Proc. Natl. Acad. Sci. U.S.A. 2016, 113, 5622–5627. 10.1073/pnas.1600108113. [DOI] [PMC free article] [PubMed] [Google Scholar]
- Raposo G.; Marks M. S. Melanosomes-Dark Organelles Enlighten Endosomal Membrane Transport. Nat. Rev. Mol. Cell Biol. 2007, 8, 786–797. 10.1038/nrm2258. [DOI] [PMC free article] [PubMed] [Google Scholar]
- Raposo G.; Tenza D.; Murphy D. M.; Berson J. F.; Marks M. S. Distinct Protein Sorting and Localization to Premelanosomes, Melanosomes, and Lysosomes in Pigmented Melanocytic Cells. J. Cell Biol. 2001, 152, 809–823. 10.1083/jcb.152.4.809. [DOI] [PMC free article] [PubMed] [Google Scholar]
- Mroz P.; Huang Y.-Y.; Szokalska A.; Zhiyentayev T.; Janjua S.; Nifli A.-P.; Sherwood M. E.; Ruzié C.; Borbas K. E.; Fan D.; Krayer M.; Balasubramanian T.; Yang E.; Kee H. L.; Kirmaier C.; Diers J. R.; Bocian D. F.; Holten D.; Lindsey J. S.; Hamblin M. R. Stable synthetic bacteriochlorins overcome the resistance of melanoma to photodynamic therapy. FASEB J. 2010, 24, 3160–3170. 10.1096/fj.09-152587. [DOI] [PMC free article] [PubMed] [Google Scholar]
- Le L.; Escobar I. E.; Ho T.; Lefkovith A. J.; Latteri E.; Haltaufderhyde K. D.; Dennis M. K.; Plowright L.; Sviderskaya E. V.; Bennett D. C.; Oancea E.; Marks M. S. SLC45A2 protein stability and regulation of melanosome pH determine melanocyte pigmentation. Mol. Biol. Cell 2020, 31, 2687–2702. 10.1091/mbc.E20-03-0200. [DOI] [PMC free article] [PubMed] [Google Scholar]
- Pierzyńska-Mach A.; Janowski P. A.; Dobrucki J. W. Evaluation of Acridine Orange, LysoTracker Red, and Quinacrine as Fluorescent Probes for Long-Term Tracking of Acidic Vesicles. Cytometry Part A 2014, 85, 729–737. 10.1002/cyto.a.22495. [DOI] [PubMed] [Google Scholar]
- Berezin M. Y.; Achilefu S. Fluorescence Lifetime Measurements and Biological Imaging. Chem. Rev. 2010, 110, 2641–2684. 10.1021/cr900343z. [DOI] [PMC free article] [PubMed] [Google Scholar]
Associated Data
This section collects any data citations, data availability statements, or supplementary materials included in this article.