Abstract
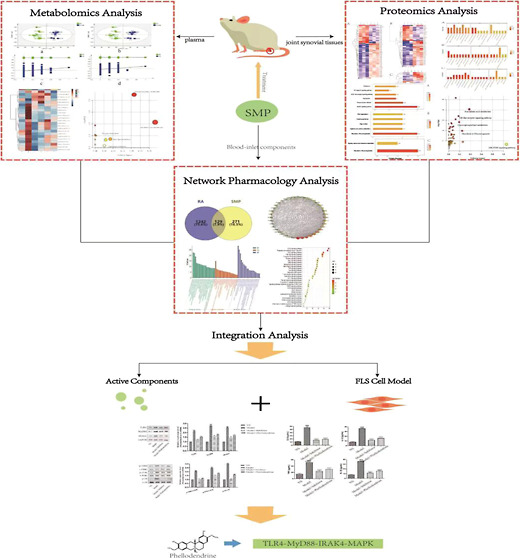
The Simiao pill (SMP) is a classic prescription that has shown anti-inflammatory, analgesic, and immunomodulatory effects and is clinically used to treat inflammatory diseases, such as rheumatoid arthritis (RA) and gouty arthritis, for which the effects and mechanism of action remain largely unknown. In this study, serum samples from RA rats were analyzed using ultra-high performance liquid chromatography-quadrupole time-of-flight mass spectrometry based metabolomics technology and liquid chromatography with tandem mass spectrometry proteomics technology together with network pharmacology to explore the pharmacodynamic substances of SMP. To further verify the above results, we constructed a fibroblast-like synoviocyte (FLS) cell model and administered phellodendrine for the test. All these clues suggested that SMP can significantly reduce the level of interleukin-1β (IL-1β), interleukin-6 (IL-6), and tumor necrosis factor-α (TNF-α) in complete Freund’s adjuvant rat serum and improve the degree of foot swelling; combined with metabolomics, proteomics, and network pharmacological technology, it is determined that SMP plays a therapeutic role through the inflammatory pathway, and phellodendrine is found to be one of the pharmacodynamic substances. By constructing an FLS model, it is further determined that phellodendrine could effectively inhibit the activity of synovial cells and reduce the expression level of inflammatory factors by downregulating the expression level of related proteins in the TLR4-MyD88-IRAK4-MAPK signal pathway to alleviate joint inflammation and cartilage injury. Overall, these findings suggested that phellodendrine is an effective component of SMP in the treatment of RA.
1. Introduction
Rheumatoid arthritis (RA) is a chronic progressive autoimmune disease that manifests mainly as chronic symmetrical progressive polyarthritis with chronic inflammation of the synovial membrane, proliferation forming vascular opacities, and invasion of the articular cartilage, leading to joint destruction, deformity, and loss of function.1,2 RA is a worldwide public health problem with a prevalence of 1% abroad and is one of the leading causes of disability and incapacity.3 In China, the prevalence is approximately 0.37%.4 Patients with RA may experience extra-articular signs and symptoms such as joint swelling, pain, pressure, deformity, stiffness and swelling, rheumatoid nodules, vasculitis, and damage to various systems,5 which often cause great physical and psychological damage to patients due to its long course and easy recurrence. Currently, nonsteroidal anti-inflammatory drugs, glucocorticoids, or biologics are commonly used to treat RA. These can alleviate the disease but have significant side effects with long-term use, so it is still of great clinical value to find other suitable drugs for the treatment of RA. Botanical drugs are widely used in clinical research because of their synergistic effects and the ability to treat both symptoms and root causes and to reduce toxicity. The Simiao pill (SMP), which is derived from the book “Cheng Fang Bian Du”, consists of four botanical drugs, namely, Phellodendri ChinensisCortex (Huang Bai), Atractylodis Rhizoma (Cang Zhu), Achyranthis BidentataeRadix (Niu Xi), and Coicis Semen (Yiyi Ren). SMP has anti-inflammatory, analgesic, and immunomodulatory effects and is used mainly to treat redness, swelling, and heat pain in the foot and knee, which are typical symptoms of RA.6−8 The therapeutic mechanism of SMP lies in its good anti-inflammatory and antioxidant effects, which can inhibit the secretion of inflammatory factors, such as tumor necrosis factor (TNF), rheumatoid factor (RF), and prostaglandins (PGEs), as well as upregulate the expression of cellular antioxidant regulators. It has been found that SMP has a beneficial effect on RA by inhibiting the secretion of various inflammatory factors in the serum of rats,9,10 as well as the expression of autotaxin (ATX) and lipoprotein-a (LPA) proteins. The anti-rheumatic effects of SMP were suggested to be related to the regulation of ATX-LPA and mitogen-activated protein kinase (MAPK) pathways and the production and inhibition of pro-inflammatory cytokines.
The traditional Chinese medicine (TCM) system, as a composite system, has complex ingredients and complex targets. It is difficult to comprehensively evaluate this complex multicomponent and multitarget mechanism by traditional analytical methods, and a single research method cannot clarify its complex mechanism or, even more, cannot explore the full process of its changes. Omics technologies have strongly promoted modern scientific research on TCM, which is not coincident with the holistic view and the dialectical nature of TCM research and is an important research method for the modernization process of TCM. In this study, the mechanism of action of SMP in the treatment of RA was investigated by a combination of network pharmacology, metabolomics, proteomics, and the biological pathways with the highest degree of correlation to the intervention effects of SMP was analyzed and preliminarily verified to provide a basis for the clinical application of SMP.
2. Results
2.1. RA Symptom Assessment
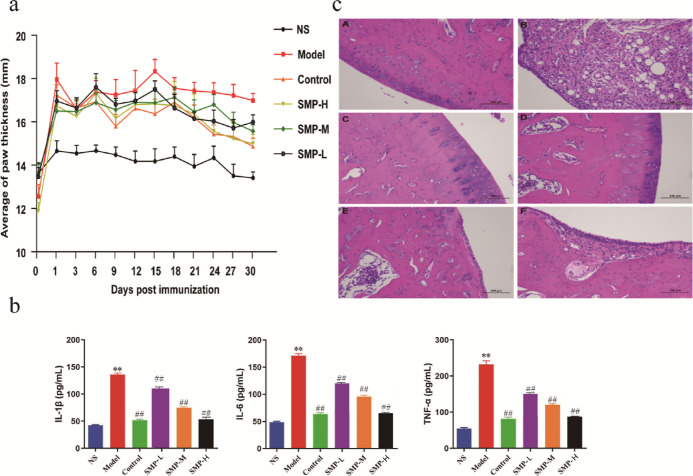
Rats in the model group developed redness and swelling of the extremities beginning around 2 weeks after immunization, evident as bilateral hind ankle joints, thickened plantar pads, decreased mobility, decreased appetite, and multiple small ulcers on the skin at the injection site, as indicated by the fact that the width of the toe reached its peak after 15 days of modeling, as shown by the model group in Figure 1a; Figure 1b showed the amounts of 1L-1β, IL-6, and TNF-α in the serum of the model group. A highly significant elevation was observed (p < 0.01), indicating successful modeling. The levels of TNF-α, IL-6, and 1L-1β can be used as indicative components for the evaluation of RA disease. The contents of 1L-1β, IL-6, and TNF-α in several treatment groups were also significantly decreased in the tripterygium glycoside tablet (TGT) group and SMP-treated group compared with the model group (p < 0.01).
Figure 1.
Therapeutic effects of treatments on RA rats. (a) Width of the toe and (b) serum levels of 1L-1β, IL-6, and TNF - α in rats; data are expressed as mean ± SEM, n = 10 statistical significance: ** p < 0.01, compared with the control group, ##p < 0.01, compared with the TGT group. (c) Synovial pathology slides of joints (A: control group; B: model group; C: TGT group; D: SMP-H group; E: SMP-M dose group; F: SMP-L group).
The pathological sections of rat ankle synovium (Figure 1c) showed that in the RA model group (B), locally articular cartilage had an uneven surface, more connective tissue proliferation could be seen in the cartilage layer, the joint synovial connective tissue was severely proliferated, accompanied by more lymphocyte infiltration, and more capsule structure could be seen. The joint cartilage of rats in the control group (A) versus the TGT group (C) was smoother; the morphology and structure of chondrocytes was positive, the joint synovium was normal, no inflammatory cell hyperplasia was seen, and a few cells could be seen in the articular cavity; the articular cartilage of rats in the SMP high-dose (SMP-H) group (D) was smoother, and the morphological structure of chondrocytes was normal and uniformly stained; the synovial connective tissue in one joint was heavily proliferated, which was accompanied by more lymphocyte infiltration, and more capsule structures were visible; the surface of local articular cartilage was uneven in rats in the SMP medium-dose (SMP-M) group (E), a little connective tissue proliferation was observed in the cartilage tissue of one side and one joint synovial connective tissue proliferation, accompanied by more lymphocyte and macrophage infiltration; in SMP low-dose (SMP-L) group (F) rats, local articular cartilage surface inequality and connective tissue proliferation in the cartilage layer could be seen; one joint synovial connective tissue proliferation, accompanied by more lymphocyte infiltration, and more cystic cavity structures were visible. Stained pathological sections of the TGT group and the SMP-H, SMP-M, and SMP-L groups showed that the damage of synovium was reduced and mild hyperplasia of joint synovium and many infiltrations of lymphocyte and macrophage were seen. Cell immunity then achieved the effect of anti-infection. These results indicated that SMP could effectively inhibit RA based on behavioral and biochemical parameters as well as histopathological aspects in RA rats.
2.2. Network Pharmacology
2.2.1. Prediction of Potential Targets of SMP and RA and Analysis of Network Interactions
The collection of the targets of blood-inlet components in SMP was performed through the TCMSP website. .Sdfformat files of blood-inlet components were downloaded from PubChem utilizing the Swiss TargetPrediction website to obtain information on the action targets of individual incorporated blood-inlet components, including phellodendrine, dauricine, magnoflorine, lotusine, berberubine, berberine, palmatine, beta-eudesmol, and atractylodin (Table S1). A total of 400 targets of the incorporated blood components were obtained after combined deidentification.
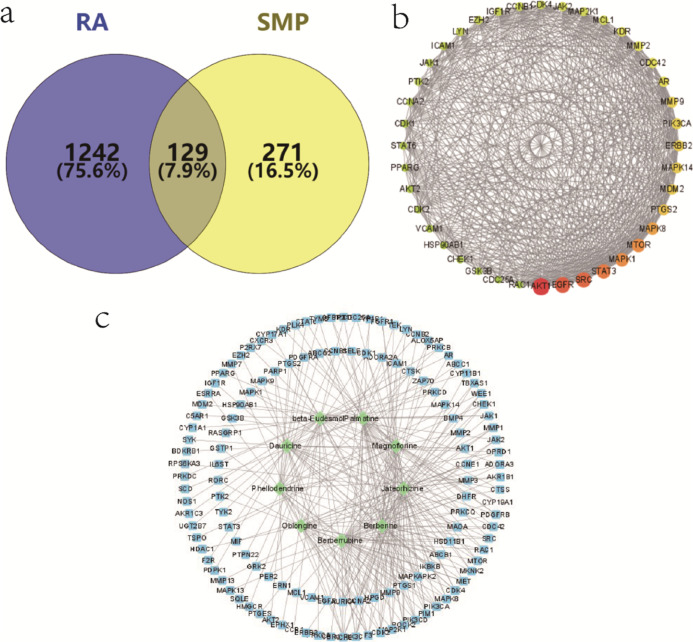
There were 1371 RA-associated targets retrieved by the GeneCards database and the OMIM database. Comparison with the 400 predicted targets corresponding to the SMP-incorporated blood components identified 129 common targets, the targets of the SMP acting on RA, as shown in Figure 2a. The 129 drug–disease intersection gene targets were analyzed using a protein–protein interaction (PPI) network constructed using the STRING database. The PPI diagram contains 129 nodes, 1452 edges, and p-value <1.0 × 10⁻¹⁶. The top 40 of PPI results of STRING analysis were imported into Cytoscape 3.8.2 software. The network analysis plug-in was used to count the nodes in the network graph and analyze their connectivity according to the node degree; the greater the node degree, the more biological functions the node has in the network. The network was constructed as shown in Figure 2b. The ten most-connected targets were AKT serine/threonine kinase 1 (AKT1), epidermal growth factor receptor (EGFR), proto-oncogene tyrosine-protein kinase Src (SRC), signal transducer and activator of transcription 3 (STAT3), and MAPK 1, indicating their significance in the network. For network construction data of SMP-RA targets, active ingredients were imported into the Cytoscape 3.8.2 software. After being polished, the network was obtained as shown in Figure 2c.
Figure 2.
Network pharmacological results. (a) Venn diagram of SMP-incorporated blood component targets and RA targets; (b) top 40 of PPI diagram of common targets; and (c) active ingredients of SMP-common target network diagram.
2.2.2. Gene Ontology Analysis and Pathway Enrichment Analysis
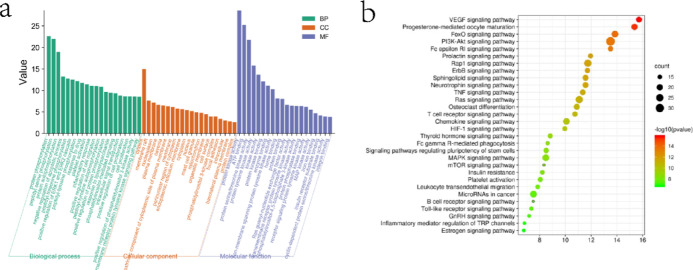
To further discover the mechanism of action of SMP in treating RA, the DAVID database was applied for GO (gene enrichment) analysis and KEGG (Kyoto Encyclopedia of Genes and Genomes) pathway analysis of the above 129 common targets. A total of 443 enrichment results were obtained for biological processes (BPs), involving mainly protein phosphorylation, positive regulation of cell migration, inflammatory response, positive regulation of gene expression, etc., and 59 enrichment results were obtained for cellular composition (CC), including mainly cytoplasm, membrane rafts, nucleoplasm, and plasma membrane, etc., with 93 enrichment results obtained for molecular functions (MFs), mainly involving proteins, kinase activity, ATP binding, protein serine/threonine kinase activity, and protein tyrosine kinase activity ranked at the top, as shown in Figure 3a. The enriched results were ranked by p-values, and the top 20 analysis results of these three parts were visualized separately. Pathway enrichment analysis of relevant targets was performed by KEGG gene annotation function analysis, and a total of 90 pathways were enriched. Among them, 57 pathways with p < 0.05 included mainly the vascular endothelial factor signaling pathway, pathways in cancer, PI3K-Akt signaling pathway, MAPK signaling pathway, toll-like receptor pathway, and T-cell receptor signaling pathway, as shown in Figure 3b.
Figure 3.
Network enrichment analysis. (a) GO functional enrichment analysis of targets for SMP treatment of RA; (b) KEGG pathway enrichment analysis of targets in SMP treatment of RA.
2.3. Metabolomic Analysis
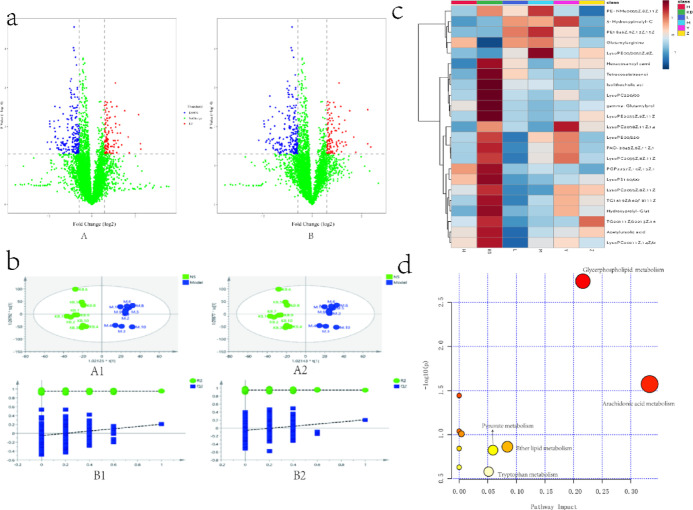
Metabolomic analysis of rat serum by ultra-high performance liquid chromatography-quadrupole time-of-flight mass spectrometry (UPLC-Q-TOF/MS) showed that the relative standard deviation (RSD) of the peak area was less than 15% and the RSD of the retention time was less than 3%, which proved that the instrument precision and the method precision were good and that the samples were stable during continuous injection. Data acquisition for the analytical samples was performed after the methodological inspections were qualified, and the base peak intensity (BPI) plots of the plasma QC samples in positive and negative ion modes are shown in the Supporting Information (Figure S1). As shown in Figure 4b, in the established orthogonal projections to latent structures-discriminant analysis (OPLS-DA) model and volcano plot (Figure 4a), the two groups exhibit obvious taxonomic clustering, and the samples of the two groups were known to be distributed in different areas, and the model validation results showed that R2Y = 0.949, R2X = 0.239, Q2 = 0.206 in the positive ion mode and R2Y = 0.949, R2X = 0.238, Q2 = 0.205 in the negative ion mode, indicating that the metabolic patterns of the model group and the control group differed significantly and had a high predictive power.
Figure 4.
Multivariate statistical analysis of metabolites of rat samples. (a) Volcano plot analysis between the control group and model group (A: positive; B: negative); (b) multivariate statistical analysis of metabolomic data (A1: OPLS-DA score plot (positive); A2: OPLS-DA score plot (negative); B1: cross validation (positive); B2: cross validation (negative)); (c) cluster analysis of RA markers; and (d) metabolic pathway analysis of common markers.
In the present study, we detected a total of 44 potential biomarkers of RA (23 in the positive ion mode and 21 in the negative ion mode), listed in Table 1 which were finally identified by standard mass spectrometry analysis and database alignment. Compared with control group rats, 7 markers were upregulated and 37 markers were downregulated in the model group; compared with the model group, after administration of TGT to RA rats, 38 markers developed callbacks, indicating a positive drug treatment effect; in each administration group of SMP, 22 marker callbacks in the SMP-L group and 26 marker callbacks in the SMP-M and SMP-H groups were observed, indicating that the treatment effect of SMPs was better in the SMP-M and SMP-H groups. Heatmap plots (Figure 4c) showed that most of the markers in the model group showed a decreasing trend compared with the control group and presented different degrees of metabolic differences in different dose groups after administration. The metabolism of the TGT group tended to be closer to that of the control group, while the SMP-H group tended to be closer to the control group, which was consistent with the pullback trend of the markers and indicated that a high dose of SMP had a better therapeutic effect on RA. Pathway analysis (Figure 4d) found that the main pathways of these markers involved in body metabolism were related metabolic pathways, including arachidonic acid metabolism, glycerophospholipid metabolism, tryptophan metabolism, pyruvate metabolism, and ether lipid metabolism, indicating that dysfunction of multiple metabolic pathways was involved in the development of RA. Among them, arachidonic acid metabolism had the highest impact. Arachidonic acid is one of the fatty acid classes of lipid components, which also suggests a great association between lipid metabolism disorders and RA pathogenesis. Meanwhile, the amino acid metabolism pathway represented by tryptophan metabolism should be considered.
Table 1. RA Biomarker Information.
| no | name | molecular formula | measured value | theoretical value | ppm | parent ion |
|---|---|---|---|---|---|---|
| 1 | TG (12:0/15:0/22:0) | C52H100O6 | 821.7552 | 821.7598 | –5.6 | M + H |
| 2 | LysoPC (20:1/0:0) | C28H56NO7P | 572.365 | 572.3692 | –7.34 | M + Na |
| 3 | LysoSM (d18:0) | C23H51N2O5P | 505.3174 | 505.3173 | 0.2 | M + K |
| 4 | PC (18:1e/2:0) | C28H56NO7P | 550.3887 | 550.3873 | 2.54 | M + H |
| 5 | LysoPE (0:0/20:3) | C25H46NO7P | 504.3141 | 504.309 | 10.1 | M + H |
| 6 | LysoPA (22:1/0:0) | C25H49O7P | 515.3182 | 515.3114 | 13.2 | M + Na |
| 7 | PC (14:1/18:4) | C40H70NO8P | 762.4469 | 762.4476 | –0.92 | M + K |
| 8 | LysoPE (20:5/0:0) | C25H42NO7P | 500.2838 | 500.2777 | 12.2 | M + H |
| 9 | LysoPC (17:0/0:0) | C25H52NO7P | 510.3641 | 510.356 | 15.8 | M + H |
| 10 | Tyrosyl-leucine | C15H22N2O4 | 295.1624 | 295.1658 | –11.5 | M + H |
| 11 | LysoPE (20:0/0:0) | C25H52NO7P | 532.3425 | 532.3379 | 8.64 | M + Na |
| 12 | lactosylceramide (d18:1/18:1) | C48H89NO13 | 888.6315 | 888.6412 | –10.9 | M + H |
| 13 | 5a-tetrahydrocorticosterone | C21H34O4 | 389.208 | 389.2094 | –3.6 | M + K |
| 14 | leukotriene F4 | C28H44N2O8S | 607.2416 | 607.2455 | –6.42 | M + K |
| 15 | LysoPE (20:1(11Z)/0:0) | C25H50NO7P | 530.3216 | 530.3223 | –1.32 | M + Na |
| 16 | tetracosatetraenoyl carnitine | C31H53NO4 | 542.3668 | 542.3612 | 10.3 | M + K |
| 17 | palmitoleoylethanolamide | C18H35NO2 | 336.2259 | 336.2305 | –13.7 | M + K |
| 18 | LysoPE (0:0/18:1) | C23H46NO7P | 480.3109 | 480.309 | 3.96 | M + H |
| 19 | S-lactoylglutathione | C13H21N3O8S | 402.0921 | 402.0947 | –6.47 | M + Na |
| 20 | LysoPC (20:0/0:0) | C28H58NO7P | 552.4038 | 552.4029 | 1.63 | M + H |
| 21 | LysoPA (20:4/0:0) | C23H39O7P | 497.2059 | 497.2070 | –2.21 | M + K |
| 22 | LysoPC (22:1/0:0) | C30H60NO7P | 578.4128 | 578.4186 | –10.1 | M + H |
| 23 | arachidonic acid | C20H32O2 | 343.2006 | 343.2039 | –9.62 | M + K |
| 24 | 3-hydroxypimelyl-CoA | C28H46N7O20P3S | 924.1615 | 924.1653 | –4.11 | M – H |
| 25 | LysoPE (0:0/22:0) | C27H56NO7P | 536.3751 | 536.3716 | 6.53 | M – H |
| 26 | PA(O-20:4/2:0) | C25H43O7P | 485.2737 | 485.2668 | 14.2 | M – H |
| 27 | tetracosatetraenoic acid-(24:4n-6) | C24H40O2 | 359.2927 | 359.2950 | –6.4 | M – H |
| 28 | hexacosanoyl carnitine | C33H65NO4 | 538.4867 | 538.4835 | 5.94 | M – H |
| 29 | glutamylarginine | C11H21N5O5 | 302.1476 | 302.1464 | 3.97 | M – H |
| 30 | LysoPC (20:5/0:0) | C28H48NO7P | 540.3191 | 540.309 | 15.6 | M – H |
| 31 | gamma-glutamylproline | C10H16N2O5 | 243.0986 | 243.0981 | 2.06 | M – H |
| 32 | TG (20:1/20:2n6) | C65H116O6 | 991.8505 | 991.8694 | –16.0 | M – H |
| 33 | PE (18:4/18:4) | C41H66NO8P | 730.4518 | 730.4448 | 9.58 | M – H |
| 34 | PGP (22:5/16:1) | C44H76O13P2 | 873.4777 | 873.4683 | 10.7 | M – H |
| 35 | LysoPC (20:3/0:0) | C28H52NO7P | 544.3403 | 544.3403 | 0 | M – H |
| 36 | LysoPC (20:3/0:0) | C28H52NO7P | 544.34 | 544.3403 | –0.55 | M – H |
| 37 | LysoPS (16:0/0:0) | C22H44NO9P | 496.263 | 496.2675 | –9.07 | M – H |
| 38 | TG (16:1/16:0/18:1) | C53H98O6 | 829.743 | 829.7285 | 17.4 | M – H |
| 39 | acetylursolic acid | C32H50O4 | 497.3554 | 497.3631 | –15.4 | M – H |
| 40 | LysoPC (20:2/0:0) | C28H54NO7P | 546.3497 | 546.356 | –11.5 | M – H |
| 41 | hydroxyprolyl-glutamine | C10H17N3O5 | 258.1103 | 258.1090 | 5.04 | M – H |
| 42 | LysoPE (0:0/20:3) | C25H46NO7P | 502.2894 | 502.2934 | –7.96 | M – H |
| 43 | LysoPE (20:3/0:0) | C25H46NO7P | 502.3025 | 502.2934 | 18.1 | M – H |
| 44 | isolithocholic acid | C24H40O3 | 375.2879 | 375.2899 | –5.33 | M – H |
2.4. Proteomics Analysis
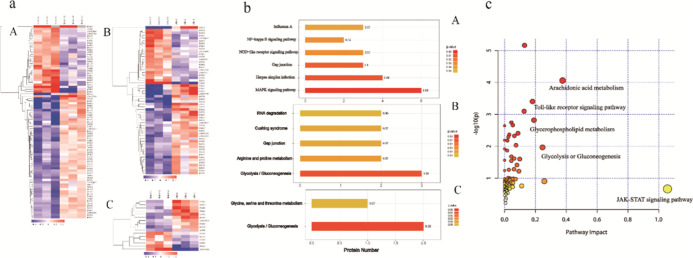
As displayed in the Supporting Information (Figure S2), there were mass deviations of all identified peptides and the scores of the profiles, indicating that the identified results were reliable. In this study, we analyzed rat joint synovial tissues by quantitative proteomics with tandem mass tag (TMT) and identified a total of 4822 proteins. The differentially expressed proteins were screened by fold change of relative quantitative value and significance test using fold change of expression over 1.2-fold (>1.2-fold upregulation or <0.83-fold downregulation) and p-value <0.05 as the standard. Compared with the control group, there were 54 upregulated differentially expressed proteins and 29 downregulated differentially expressed proteins in the model group. Compared with the control group, there were 35 upregulated differentially expressed proteins and 21 downregulated differentially expressed proteins in the SMP administration group. Compared with the model group, there were 10 upregulated differentially expressed proteins and 6 downregulated differentially expressed proteins after SMP administration. The heatmap showed (Figure 5a) differential proteins with different expression across groups, effectively separating the groups. The results of GO analysis as well as KEGG analysis (Figure 5b) showed that after modeling, the biological functions of NF-κB phosphorylation, regulation of smoothed signaling pathway, regulation of response to cytokine stimulation, regulation of chemokine production, NIK/NF—κ B signaling, TNF receptor binding, SAGA complex, IRE1-TRAF2-ASK1 complex, and other localized proteins changed significantly, which indicated that after modeling, the rat joint synovial tissues underwent changes in inflammation-related pathways, which were manifested in the MAPK signaling pathway, node-like receptor signaling pathway, NF-κB signaling pathway, and other closely related pathways. After administration of SMP, biological processes, including glycolysis/gluconeogenesis, glycine, serine, and threonine metabolism, ATP pathway of ADP generation, and pyruvate biosynthesis, were altered, which may provide clues and a basis for subsequent pharmacodynamic mechanism elucidation.
Figure 5.
Protein analysis results. (a) Cluster analysis plot of differentially expressed proteins (A: model group/control group; B: SMP group/control group; C: SMP group/model group); (b) KEGG pathway enrichment analysis plot (A: model group/control group; B: SMP group/control group; C: SMP group/model group); and (c) integrated metabolomics and proteomics analysis pathway maps.
2.5. Integrated Analysis of Metabolomics and Proteomics
Network pharmacology analyzes the targets of action of all possible active ingredients in drugs from a holistic perspective and comprehensively predicts the mechanism of drug action; after treatment with SMP, the metabolic markers from the untargeted metabolomics screen combined with the differential proteins from the proteomics screen further identify the relevant pathways and molecular interaction networks, which can more accurately and comprehensively explain the physiology of drug treatment and the physical mechanism; so, this experiment integrated the omics data with network pharmacology. Network pharmacology results showed that the TNF signaling pathway, Toll-like receptor signaling pathway, and T-cell receptor signaling pathway played key roles in the development of pharmacodynamic effects. After the integration analysis of differential metabolites and differential proteins after actual administration, the enrichment analysis pathways revealed that the involved pathways included mainly arachidonic acid metabolism, Toll-like receptor signaling pathway, glycolysis, glycerophospholipid metabolism, and other pathways (Figure 5c).
2.6. Phellodendrine Modulates LPS-Induced Inflammatory Response and TLR4/MyD88/IRAK4/MAPK Signaling Pathway in RA-FLS Cells
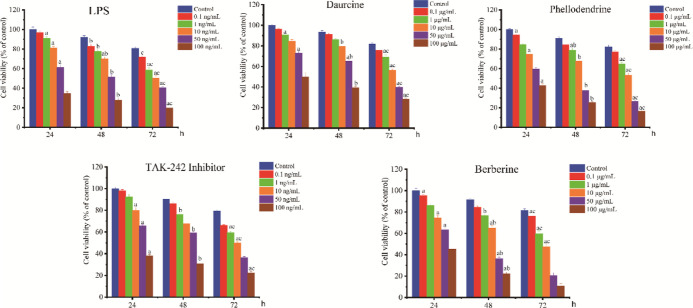
To further determine the pharmacodynamic ingredients in SMP, the blood ingredients with a high number of network nodes in the results of network pharmacology were selected, and an 80% cell survival rate was used as the screening criterion (no obvious promoting or inhibiting effect on cell growth), as shown in Figure 6. The optimal drug concentration and time of LPS were 10 ng/mL and 24 h, respectively, and the optimal efficacy and aging of daurcine was 10 μg/mL for 48 h; phellodendrine and berberine were added at 1 μg/mL for 48 h, and the TAK-242 inhibitor was added at 10 ng/mL for 24 h.
Figure 6.
Inhibitory activity of different drugs on synoviocytes [the alphabet “a” indicates the statistical significance compared to the control group at 24 h, alphabet “b” indicates significance compared with the control group at 48 h, and alphabet “c” indicates significance compared with the control group at 72 h (p < 0.05)].
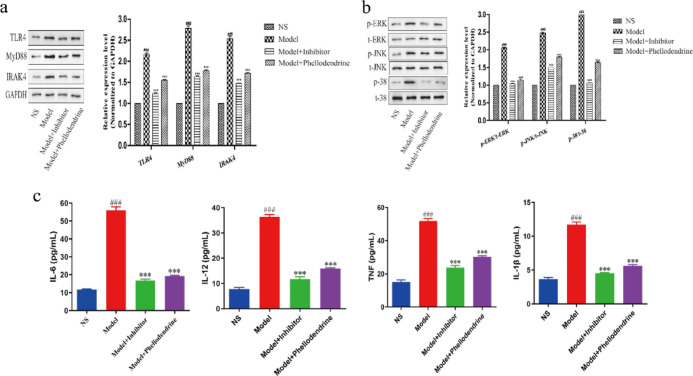
To investigate the regulation of related proteins in the TLR4-MyD88-IRAK4-MAPK signal pathway in LPS-induced fibroblast-like synoviocytes (FLS) by phellodendrine in SMP, we measured the levels of related proteins in the cells (Figure 7a). Western blot results showed significantly increased protein expression of TLR4 (p < 0.001), MyD88 (p < 0.01), and IRAK4 (p < 0.001) in the model group compared to that in the control group. On the contrary, SMP treatment remarkably reversed these effects by decreasing the protein expression of TLR4 (p < 0.001), MyD88 (p < 0.05), and IRAK4 (p < 0.001).
Figure 7.
(a,b) Results of protein expression levels were determined by Western blotting (n = 3); (c) IL-1β, IL-6, IL-12, and TNF-α in the cells, (###p < 0.001, model group vs control group; ***p < 0.001, phellodendrine group compared with the model group).
Key kinases in the MAPK signaling pathway (JNK, P38, and ERK) are known to regulate cell proliferation. Many active substances of TCM are also involved in the regulation of the MAPK pathway, and the activation of JNK is related to the enhancement of motor ability of many types of cells, such as its role in the regulation of proliferation, migration, and invasion of synovial cells in RA.11 To evaluate whether phellodendrine influences the MAPK pathway, we explored the expression of MAPK and its downstream protein. As shown in Figure 7b, the levels of p-ERK and p-JNK phosphorylation in the model group (with LPS) were significantly increased compared with the levels in the normal group (without LPS) and were significantly different between the two groups (p < 0.001), indicating that LPS can induce the phosphorylation process of p-ERK and p-JNK. In the treatment group, the phosphorylation process was inhibited compared with the process in the normal group after the addition of 1 μg/mL phellodendrine (p < 0.05).
Inflammatory cytokine production by FLS was induced by LPS, and 48 h after treatment with inhibitors and phellodendrine, the levels of IL-6, IL-12, IL-1β, and TNF-α in the cells of each group were measured by ELISA. The results showed that, compared with the control group (no LPS, inhibitor, or phellodendrine), the expression levels of IL-6, IL-12, IL-1β, and TNF-α in the model group (containing LPS, no inhibitor or phellodendrine) were significantly higher and significantly different between the two groups (p < 0.001), indicating that LPS can successfully induce inflammatory responses in FLS. After the addition of inhibitor and phellodendrine, the expression of cytokines was significantly suppressed and significantly different compared with the model group (p < 0.001), thus indicating that phellodendrine may suppress inflammation in FLS (Figure 7c).
3. Discussion
In this study, an RA model was prepared by subcutaneous injection of complete Freund’s adjuvant (CFA) into the rat toe, and the effects of TGT administered as well as different doses of SMP on RA rats were investigated to determine the exact therapeutic effect of SMP on RA rats. To explore the material basis and cellular pathway of SMP in treating RA, this study employed metabolomics and proteomics techniques combined with network pharmacology to further explore the mechanism of SMP in treating RA. In this study, the three techniques were integrated to correlate biomarkers with differential proteins with the help of the integrated functions of the KEGG pathway and MetaboAnalyst, combined with the analysis of literature research, to construct and validate the key action pathways of SMP in the treatment of RA.
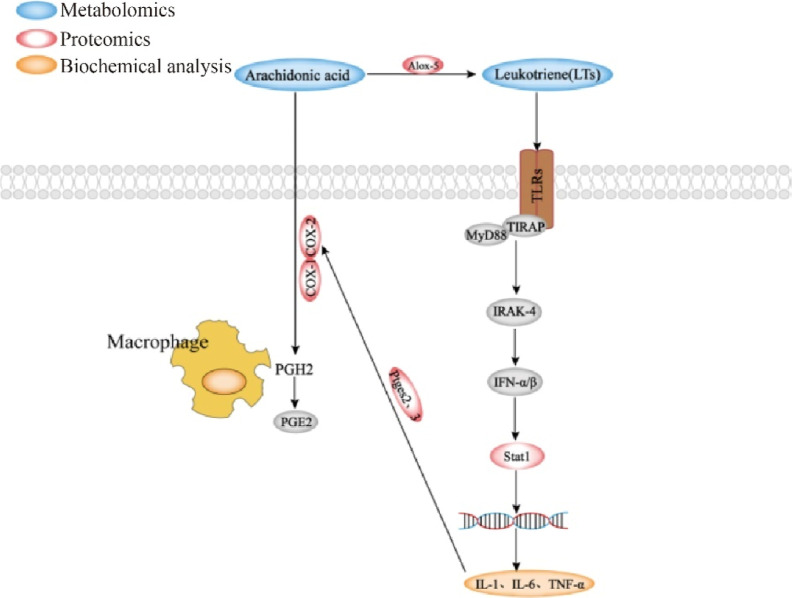
RA is a chronic autoimmune disease with arthritis as the main clinical manifestation. Inflammation is a normal part of the immune response, and combined analysis of metabolomic and proteomic results identified significant modulation of arachidonic acid metabolism and its impact on receptor signaling pathways in RA. Arachidonic acid is a polyunsaturated fatty acid that is a component of biological cell membranes, and current studies demonstrate that PGE and leukotrienes (LTS) produced from arachidonic acid are associated with inflammation. PGE2 and LTS are potent eicosanoid lipid mediators derived from arachidonic acid released by phospholipases, which are involved in many homeostatic biological functions and inflammation.12 Cyclooxygenase-2 (COX2) is the main metabolic enzyme that catalyzes the production of PGE2.13 Then, 5-lipoxygenase (ALOX5) in turn catalyzes the production of LTS from arachidonic acid.14 LTS, however, are closely related to the Toll-like receptor 2 (TLR2),15 which can affect the downstream factor MyD88 through the JAK-STAT signaling pathway, which in turn affects STAT1, leading to inflammation.16 Studies have shown that TLR2-dependent interferon (IFN)-I signaling is dependent on MyD88, and TLR2-stimulated monocytes produce modest levels of IFN-α/β, leading to the production of downstream signaling (Figures 8 and S3 and S4).
Figure 8.
Critical pathways involved in the treatment of RA by SMP.
4. Conclusions
Combined with metabolomics and proteomics techniques, joint network pharmacology was used to explore the onset substances and cellular pathways; we have concentrated the active substance of SMP in the treatment of RA to phellodendrine and verified it by cellular experiments. The results showed that phellodendrine effectively inhibited synoviocyte activity and alleviated joint inflammation and cartilage damage by downregulating the expression levels of related proteins in the TLR4-MyD88-IRAK4-MAPK signaling pathway and downregulating the expression levels of inflammatory factors. However, further investigation on the effect of arachidonic acid metabolism and its impact on receptor signaling pathways would also be needed. Therefore, these findings on the potential underlying SMP mechanism provide a theoretical basis for RA clinical application.
5. Materials and Methods
5.1. Chemicals and Reagents
Salt-fried Phellodendri Chinensis Cortex was provided by Anguo Yikang Pharmaceutical Co., Ltd. (Hebei, China). Atractylodis Rhizome was supplied by Beijing Shengshilong Pharmaceutical Co., Ltd. (Beijing, China). Achyranthis Bidentatae Radix was purchased from Anguo Meijin Chinese Herbal Medicine Co., Ltd. (Hebei, China). Coicis Semen was purchased from Anhui Xiehecheng Pharmaceutical Co., Ltd. (Anhui, China). All TCM was authenticated by Prof. Tianxiang Li from Tianjin University of TCM. TGTs were purchased from Zhejiang Dnd Pharmaceutical Co., Ltd. (Zhejiang, China). CFA, Tris, and trifluoroacetic acid were provided by Sigma, USA. Formic acid was purchased from Roe Corp., USA and Fluka. Acetonitrile was purchased from Oceanpak, Sweden, and Merck. Formaldehyde and heparin Na were provided by Beijing Solarbio Technology Co., Ltd. (Beijing, China). ELISA kits for IL-1, IL-6, and TNF-α were purchased from Wuhan Bioswamp Biotechnology Co., Ltd. (Wuhan, China). BCA kits were purchased from Beyotime Biotechnology (Shanghai, China). TMT Labeling Kits were purchased from Thermo (USA). Trypsin was purchased from Promega (Shanghai, China).
The instruments and systems were as follows. Waters Acquity UPLC liquid chromatograph (Waters, USA), Waters Xevo G2 Q-TOF mass spectrometer (Waters, USA), ACQUITY UPLC BEH C18 column (2.1 mm × 100 mm × 1.7 μm) (Waters, USA), toe volume measuring instrument (Anhui Zhenghua Biological Instrument Equipment Co., Ltd. Anhui, China), ultrasound cleaning machine (Ningbo Xinyi Biotechnology Co., Ltd. Zhejiang, China), and Vortex (Haimen Qilin Bell Instrument Manufacturing Co., Ltd. Jiangsu, China).
5.2. Preparation of SMP Decoction
According to the recipe of SMP recommended by the State Pharmacopoeia of People’s Republic of China, the four botanical drugs were mixed in a 1:1:2:2 ratio, and the specimens were soaked in a 10-fold volume of water for 40 min and decocted for 1 h on the first occasion and decocted with an 8-fold volume of water for 45 min on the second occasion. Finally, the filtrates were combined, QC, and concentrated as viscous infusions (to a concentration of 1 μg/mL in terms of crude drugs), and the samples were stored frozen in a freezer at −20 °C for further use. For chemical identification of the SMP decoction, UPLC-Q-TOF/MS analysis was conducted. The UPLC-Q-TOF/MS analysis procedure and characteristic chromatogram of the SMP decoction are shown in Supporting Information (Figures S5, S6).
5.3. Animal Experiments
5.3.1. Animals
A total of 60 specific pathogen-free Wistar rats weighing 160–200 g (male, License: SCXK(Jing)2016-0006) were purchased from Beijing Weitong Lihua Company and raised at the Institute of Radiology, Chinese Academy of Medical Sciences. The rats were housed in a 12 h/12 h light/dark cycle with an ambient temperature of 22 ± 2 °C and an environmental humidity of 50 ± 10% under controlled environmental conditions. The experimental protocols were approved by the Animal Care and Use Committee of Tianjin University of TCM in accordance with the 1964 Helsinki declaration and its later amendments or comparable ethical standards. After 1 week of feeding, animal experiments were carried out.
5.3.2. Establishment of RA Rat Models and Grouping
The rats were randomly divided into 6 groups of 10 rats each, including the control group (NS), model group, TGT group, SMP-H, SMP-M, and SMP-L groups. Except for the control group, the rats were subcutaneously injected with 0.1 mL of CFA at the base of the toes for primary immunization, and the day of modeling was marked as experimental day 1. The second immunization was performed on the 8th day by injecting 0.05 mL of CFA in the same position on the toes of the rats. The rats in the control group were injected with the same amount of normal saline solution.
In this study, the rats in the TGT group (16.83 mg/kg), SMP-H group (4.48 g/kg), SMP-M group (2.24 g/kg), and SMP-L group (1.12 g/kg) were intragastrically administered the doses for 30 days. The control group and model group were administered the same volume of purified water as the control for 30 days. The toe widths of the rats were measured every 3 days.
5.3.3. Collection and Processing of Plasma and Serum
After 30 days of administration, rats in each group were subjected to a 24 h fast without water, and the following day, sample collection was performed. All of the rats were given pentobarbital for intraperitoneal anesthesia and were bled through the abdominal aorta. A portion of samples were stored in anticoagulant tubes and pretreated within 30 min. After centrifugation at 3000 rpm and 4 °C for 15 min, the supernatant was removed and centrifuged at 3500 rpm and 4 °C for 8 min, after which the supernatant was removed. The supernatant was sealed with parafilm and stored in a −80 °C freezer for further use; for the remaining whole blood samples, the samples were centrifuged twice at 4 °C and 3500 rpm for 10 min, and the supernatant was aspirated into a centrifuge tube. The cryovial containing the serum samples was stored in a −80 °C freezer and used for the detection of biochemical indexes of the serum.
5.3.4. Synovial Collection and Processing
After blood collection, the body hair at the knee joint was removed, and the skin and subcutaneous tissue of the rat knee joint were incised until the knee joint was fully exposed. The surrounding soft tissue was separated longitudinally until the knee joint cavity was opened, and the synovial tissue was located at the inferior border of the patella and was pale yellow. The synovium is located upward from the synovial tissue with a layer of smooth and bright tissue. The synovium was completely peeled off, washed repeatedly with saline, and stored in liquid nitrogen for further use.
5.3.5. Serum Biochemistry and Joint Pathomorphometry
The hind leg knee joints were removed from the bodies of the rats and fixed with 10% buffered formalin, after which the joints were decalcified in 10% ethylenediaminetetraacetic acid. The decalcified samples were embedded in paraffin and sectioned, and hematoxylin—eosin staining was performed using a standard protocol.17 The sections were observed and described under a light microscope, with photographs corresponding to the main described sites.18
The levels of IL-1, IL-6, and TNF-α in rat sera were measured with a Quantikine ELISA kit. The optical density at a wavelength of 450 nm in each well was recorded after 5 min using a multipurpose microplate reader (Synergy, BioTek, USA).
5.4. Network Pharmacology
5.4.1. Blood-Inlet Components Targets Collection in SMP
Based on a previous study of the serum medicinal effects of SMP,19 the blood-inlet components with prototypes were determined to be phellodendrine, dauricine, magnoflorine, lotusine, berberubine, berberine, palmatine, beta-eudesmol, and atractylodin. Two-dimensional structures of blood-inlet components were downloaded from the PubChem database and imported to the Swiss target prediction database (http://www.swisstargetprediction.ch/) for prediction of the targets of the above blood-inlet components. The UniProt database was applied after pooling the above results (https://www.UniProt.org/), converting the collected target protein names to standard gene names and dereplicated.20
5.4.2. RA-Related Targets Collection
Through the CTD database (https://ctdbase.com/),21 TTD database (http://db.idrblab.net/ttd/),22 and Drugbank database (https://www.drugbank.ca/) with OMIM (https://omim.org/) database search for “rheumatoid arthritis (RA)” pathogenesis-related targets,23,24 individual database targets were merged and dereplicated. Targets from RA and related targets from SMP were imported into the Venny 2.1 online mapping platform (https://bioinfogp.cnb.csic.es/tools/venny/) to obtain the common target, which is the key target of the active ingredients in SMP for the treatment of RA.
5.4.3. Protein–Protein Interaction
To link the screened active ingredients of SMP with common targets, the common target information was uploaded to the String 10.5 database (https://string-db.org),25 where the study species was selected to be human, a minimum required contact score between targets of 0.4 was set, and targets not linked to other targets were hidden to obtain a target contact network diagram. The map was further imported into Cytoscape 3.8.2 software for topology analysis and construction of the PPI network.26
5.4.4. Gene Ontology Enrichment and KEGG Pathway Analysis
Using the David database (https://david.ncifcrf.gov/),27 gene functional enrichment analysis (GO analysis) and biological pathway enrichment analysis (KEGG analysis) were performed on the common targets, and pathways with p ≤ 0.05 were selected. Using the microson letter platform (http://www.bioinformatics.com.cn/), visual bar graphs and KEGG advanced bubble plots were drawn for biological processes (BP), cellular components (CC), and molecular functions (MF).
5.5. Plasma Metabolomics Studies
5.5.1. Sample Preparation
After the samples were completely dissolved, 50 μL of plasma sample was measured in a centrifuge tube, and 200 μL of acetonitrile was added. The mixture was sonicated in an ice water bath for 10 min, vortexed and mixed for 1 min, and centrifuged at 13000 rpm at 4 °C for 15 min, after which the supernatant was pipetted into an injection vial to be analyzed by UPLC-Q-TOF/MS.
Each sample (10 μL) was pipetted into a centrifuge tube, mixed and vortexed for 1 min to obtain 50 μL of blood samples; 200 μL of acetonitrile (v/v, 1:4) was added, and the sample was sonicated in an ice water bath for 10 min, vortexed and mixed for 1 min, centrifuged at 13000 rpm at 4 °C for 15 min, and pipetted into a 200 μL injection vial of the supernatant to be analyzed by UPLC-Q-TOF/MS. Quality control samples, which contain biological information on all samples that reflects the overall sample situation, were used for the methodological inspections.28
5.5.2. Data Processing
Raw data were exported by markerlynx 4.1 (Waters, USA) software, and the data included retention time, m/z value, and peak area of each observation. Then, the data were imported into SIMCA 14.1 statistical software (umetrics, Sweden) for multivariate statistical analysis. SPSS 26.0 was subsequently used to perform statistical tests, and appropriate tests, including independent samples t-test and approximate t-test and Mann–Whitney U test in nonparametric tests, were selected to determine whether metabolites changed significantly in statistical analysis (p < 0.05). Finally, the possible substances were searched in the database according to the mass number (m/z value) of the marker, and the candidate biomarkers were confirmed according to tandem mass spectrometry (MS/MS) analysis, metabolite database29 information matching, identification of standards, and literature reports.
5.6. Proteomics Analysis
5.6.1. Protein Extraction and Quantification
The synovial tissues of rat joints from the three groups treated as control, model, and SMP (middle dose) were obtained in three biological replicates for each group. Appropriate amounts of SDT lysis solution (4% (w/v) SDS, 100 mm Tris/HCl (pH 7.6), 0.1 M dithiothreitol) were added after tissues from each group were minced, transferred to centrifuge tubes, and homogenized by quartz sand box ceramic beads on ice followed by ultrasonic lysis in an ice water bath. After centrifugation at 14000g at 4 °C for 40 min, the supernatant was collected and filtered through a 0.22 μm Millipore filter membrane. The extracted proteins were quantified using a BCA Quantitation Kit, the absorbance at 570 nm was measured with a microplate reader, and the concentration of protein in the sample was calculated according to the standard curve method.
5.6.2. SDS-PAGE Electrophoresis
After the extraction of quantitative protein, 20 μg of protein was taken for each sample amount, appropriate loading buffer was added, and the sample was heated in a boiling water bath for 5 min for denaturation. The sample was loaded for electrophoresis, and 3 μL of marker and 20 μL of protein samples of each group were loaded sequentially. Electrophoresis was performed for 90 min at a constant current of 14 MA in 12.5% SDS-PAGE and stopped after the bromophenol blue indicator band ran to the base of the gel. After removing the glue, the sample was stained for 2 h at a low speed in coomassie brilliant blue stain, then destaining solution was added, the background was washed to colorless, and the bands were cleared.
5.6.3. Peptidolysis and TMT Labeling
For digestion, after DTT was added to the protein solution, the final concentration was adjusted to 100 mm, and the boiling water bath was heated for 5 min and cooled to room temperature (25 °C). Subsequently, 200 μL of UA buffer was added, the solution was transferred to a 10 kD centrifuge tube and centrifuged at 14 000g for 15 min at 4 °C. The supernatant was discarded, and the above procedure was repeated one more time. An additional 100 μL of IAA buffer was added, incubated in the dark at room temperature for 30 min, and centrifuged for another 15 min (14000×g at 4 °C). This step was repeated two more times by centrifugation after adding 100 μL of UA buffer. Again, this step was repeated twice by centrifugation after adding 100 μL of 100 mm TEAB buffer. Then, 40 μL of trypsin buffer was added, and the digestion was continued for 16–18 h. The sample was dissolved using 40 μL of 25 mm TEAB buffer. Labeling was performed using the TMT kit, and the control group was labeled as 126, 127 n, and 127 C in turn, the model group was labeled as 128 N, 128 C, and 129 N in sequence, and the SMP administration group was labeled as 129 C, 130 N, and 130 C in sequence.
The peptides, after labeling in each group, were mixed in equal amounts, freeze-dried, and fractionated with a high-pH reversed-phase peptide fractionation kit. After equilibration with an acetonitrile and trifluoroacetic acid column, loading analysis, and after desalting by centrifugation, gradient elution with high-concentration acetonitrile was performed. After vacuum drying and reconstitution in 12 μL of 0.1% FA, the concentration of peptide was determined at OD280.
5.6.4. LC–MS/MS Analysis
After sample fractionation, an Easy nLC HPLC liquid system at a nanoliter flow rate was employed for chromatographic separation. Separation was performed on an easy C18-A2 column (Thermo Scientific, USA, 10 cm × 75 μm, 3 μm) using an Acclaim PepMap100 nano Viper C18 loading column (Thermo Scientific, USA, 100 μm × 2 cm) with mobile phase A of 0.1% formic acid in water and phase B of 0.1% formic acid in acetonitrile at a flow rate of 300 nL/min. The elution gradients were 0–80 min, 0%–55% B; 80–85 min, 55%–100% B; and 85–90 min, 100% B.
Samples were chromatographed and analyzed on a Q-Exactive mass spectrometer. Analysis was performed in the positive ion mode with a scan range of 300–1800 m/z. The primary MS spectra were acquired at a resolution of 70000, a maximum of 50 ms, an AGC target of 1 × 10⁶, a dynamic exclusion time of 60.0 s, and full scan acquisition of 20 fragmentation spectra, while the secondary MS spectra were acquired at 17500 resolution, MS2 activation type of HCD, an isolation window of 2 m/z, a normalized collagen energy of 30 EV, and an underfill of 0.1%.
5.6.5. Data Processing and Bioinformatic Analysis
After mass spectrometry raw data export, identification and quantitative analysis were performed in the software mascot 2.2 and proteome discoverer 1.4. The mode of digestion was set to trypsin, the number of missed sites was set to 2, the database mode was decoy, the mass error tolerance for secondary fragment ions was 0.01 Da, the primary parent ion mass error tolerance was set to 20 ppm, and the database used by the library was Rattus norvegicus, Rnor_6.0.pep.all FASTA, carbamidomethyl was set as a fixed modification and oxidation as variable modification. FDR was set to 1%.
In addition, the GO database, the KEGG database, the string (http://string-db.org/) database, and cluster analysis were used to describe the gene information of differential proteins and classify their functions, describe their biological functions, and further search for intergenic interactions.
5.7. MTT Assay to Analyze the Effect of Different Components on the Viability of FLS
5.7.1. Pharmacological Intervention of FLS Cells
MTT assay was used to detect the effect of intervention drugs on the viability of RA-FLS cells. The drugs of intervention were LPS, daurcine, berberine, phellodendrine, and TAK-242 inhibitor, and the specific concentrations of each drug intervention were 0, 0.1, 1, 10, 50, and 100 ng/mL.
5.7.2. Cell Viability Assay
Synoviocytes in the logarithmic growth phase were seeded in 96-well plates at 5000 cells/well. The experiments were divided into three groups: the blank group, i.e., only culture solution added, without any cells; the control group, i.e., added cells and culture solution, without drug intervention; and the test group, i.e., added cells, culture solution, and given drug intervention. The following day, the cells were treated according to their drug concentrations in the above experiments, and cell viability was assessed by MTT assay after 24, 48, and 72 h.
5.7.3. Determination of Protein Expression Levels by Western Blot
Combining the results of MTT and the network pharmacological screening, we selected phellodendrine for validation. Cells were divided into four groups (control, model, model + inhibitor, and model + phellodendrine) according to the following conditions: no LPS was added to induce the expression of proinflammatory cytokines in each experiment, samples were extracted after treatment with 10 ng/mL LPS followed by 1 μg/mL phellodendrine and 10 ng/mL TAK-242 for 48 h. The protein level expression profiles of different groups as well as the expression levels of inflammatory factors of LPS-induced synoviocytes were determined..
Acknowledgments
This project was supported by the National Natural Science Foundation of China (no. 81903938) and Tianjin Talent Development Special Support Project for High Level Innovation and Entrepreneurship.
Supporting Information Available
The Supporting Information is available free of charge at https://pubs.acs.org/doi/10.1021/acsomega.2c07959.
Information on blood-inlet components in SMP; BPI diagram of plasma QC samples; proteomics analysis; protein expression levels of ALOX-5, COX-2, and COX-1 genes; protein expression levels of P-STAT1 genes; base peak chromatograms obtained by HPLC-Q-TOF/MS in the positive mode of SMP; and base peak chromatograms obtained by HPLC-Q-TOF/MS in the negative mode of SMP (PDF)
Author Contributions
† Y.W., F.Z., and X.L. contributed equally to this work.
The authors declare no competing financial interest.
Notes
The mass spectrometry proteomics data have been deposited to the Proteome Xchange Consortium via the PRIDE partner repository with the dataset identifier PXD028812.30 Additional experimental details, materials, including photographs of experimental result are included in the article/Supporting Information.
Supplementary Material
References
- Lee D. M.; Weinblatt M. E. Rheumatoid arthritis. Lancet 2001, 358, 903–911. 10.1016/s0140-6736(01)06075-5. [DOI] [PubMed] [Google Scholar]
- Semb A. G.; Ikdahl E.; Wibetoe G.; Crowson C.; Rollefstad S. Atherosclerotic cardiovascular disease prevention in rheumatoid arthritis. Nat Rev Rheumatol 2020, 16, 361–379. 10.1038/s41584-020-0428-y. [DOI] [PubMed] [Google Scholar]
- Williams R. O. What Have We Learned about the Pathogenesis of Rheumatoid Arthritis from TNF-Targeted Therapy?. ISRN Immunol. 2012, 2012, 1–15. 10.5402/2012/652739. [DOI] [Google Scholar]
- Xiang Y. J.; Dai S. M. Prevalence of rheumatic diseases and disability in China. Rheumatol. Int. 2009, 29, 481–490. 10.1007/s00296-008-0809-z. [DOI] [PubMed] [Google Scholar]
- Liu L.; Wang D.; Liu M. Y.; et al. The development from hyperuricemia to gout: key mechanisms and natural products for treatment. Acupuncture and Herbal Medicine; Wolters Kluwer Health/LWW, 2022; Vol. 2, pp 25–32. [Google Scholar]
- Zhao J.; Zha Q.; Jiang M.; Cao H.; Lu A. Expert consensus on the treatment of rheumatoid arthritis with Chinese patent medicines. J. Altern. Complement. Med. 2013, 19, 111–118. 10.1089/acm.2011.0370. [DOI] [PubMed] [Google Scholar]
- Qiu R.; Shen R.; Lin D.; Chen Y.; Ye H. Treatment of 60 Cases of Gouty Arthritis with Modified Simiao Tang. J. Tradit. Chin. Med. 2008, 28, 94–7. 10.1016/s0254-6272(08)60023-0. [DOI] [PubMed] [Google Scholar]
- Liu Y. F.; Tu S. H.; Chen Z.; Wang Y.; Hu Y. H.; Dong H. Effects of Modified Simiao Decoction on IL-1β and TNF-α Secretion in Monocytic THP-1 Cells with Monosodium Urate Crystals-Induced Inflammation. J. Evidence-Based Complementary Altern. Med. 2014, 2014, 406816. 10.1155/2014/406816. [DOI] [PMC free article] [PubMed] [Google Scholar]
- Chen H.; Pang X. F.; Li Y. L.; Wu Y. H.; Huang Z. Z.; Lin J.; Chen L.. On the Mechanism of Simiao Wan in the Treatment of Rheumetoid Arthritis Based on Network Pharmacology. Rheunatism and Arthritis, 2019; Vo. 8, pp 30–35. [Google Scholar]
- Shen P.; Tu S.; Wang H.; Qin K.; Chen Z. Simiao pill attenuates collagen-induced arthritis in rats through suppressing the atx-lpa and mapk signalling pathways. Evidence-Based Complementary Altern. Med. 2019, 2019, 7498527. 10.1155/2019/7498527. [DOI] [PMC free article] [PubMed] [Google Scholar]
- Ma R. H.; Ni Z. J.; Thakur K.; Cespedes-Acuña C. L.; Zhang J. G.; Wei Z. J. Transcriptome and proteomics conjoint analysis reveal metastasis inhibitory effect of 6-shogaol as ferroptosis activator through the PI3K/AKT pathway in human endometrial carcinoma in vitro and in vivo. Food Chem. Toxicol. 2022, 170, 113499. 10.1016/j.fct.2022.113499. [DOI] [PubMed] [Google Scholar]
- Franceschini A.; Szklarczyk D.; Frankild S.; Kuhn M.; Simonovic M.; et al. STRING v9.1: protein-protein interaction networks, with increased coverage and integration. Nucleic Acids Res. 2013, 41, D808–15. 10.1093/nar/gks1094. [DOI] [PMC free article] [PubMed] [Google Scholar]
- Kohl M.; Wiese S.; Warscheid B. Cytoscape: Software for Visualization and Analysis of Biological Networks. Methods Mol. Biol. 2011, 696, 291–303. 10.1007/978-1-60761-987-1_18. [DOI] [PubMed] [Google Scholar]
- Huang D. W.; Sherman B. T.; Tan Q.; Kir J.; Liu D.; et al. DAVID Bioinformatics Resources: expanded annotation database and novel algorithms to better extract biology from large gene lists. Nucleic Acids Res. 2007, 35, W169–W175. 10.1093/nar/gkm415. [DOI] [PMC free article] [PubMed] [Google Scholar]
- Ashburner M.; Ball C. A.; Blake J. A.; Botstein D.; Butler H.; et al. Gene Ontology: tool for the unification of biology. Nat. Genet. 2000, 25, 25–29. 10.1038/75556. [DOI] [PMC free article] [PubMed] [Google Scholar]
- Li X. L.; Zhang X. X.; Ma R. H.; Ni Z. J.; Thakur K.; Cespedes-Acuña C. L.; Zhang J. G.; Wei Z. J. Integrated miRNA and mRNA omics reveal dioscin suppresses migration and invasion via MEK/ERK and JNK signaling pathways in human endometrial carcinoma in vivo and in vitro. J. Ethnopharmacol. 2023, 303, 116027. 10.1016/j.jep.2022.116027. [DOI] [PubMed] [Google Scholar]
- Sarri B.; Poizat F.; Heuke S.; Wojak J.; Franchi F.; et al. Stimulated Raman histology: one to one comparison with standard hematoxylin and eosin staining. Biomed. Opt. Express. 2019, 10, 5378. 10.1364/boe.10.005378. [DOI] [PMC free article] [PubMed] [Google Scholar]
- Choi J. K.; Kim S. W.; Kim D. S.; Lee J. Y.; Lee S.; et al. Oleanolic acid acetate inhibits rheumatoid arthritis by modulating T cell immune responses and matrix-degrading enzymes. Toxicol. Appl. Pharmacol. 2016, 290, 1–9. 10.1016/j.taap.2015.11.005. [DOI] [PubMed] [Google Scholar]
- Fan Y.; Li Y. M.; Wu Y. Y.; Li L.; Wang Y.; et al. Identification of the Chemical Constituents in Simiao Wan and Rat Plasma after Oral Administration by GC-MS and LC-MS. Evidence-Based Complementary Altern. Med. 2017, 2017, 6781593. 10.1155/2017/6781593. [DOI] [PMC free article] [PubMed] [Google Scholar]
- Consortium U. Activities at the Universal Protein Resource (UniProt). Nucleic Acids Res. 2014, 42, D191–8. 10.1093/nar/gkt1140. [DOI] [PMC free article] [PubMed] [Google Scholar]
- Davis A. P.; Murphy C. G.; Johnson R.; Lay J. M.; Lennon-Hopkins K.; et al. The Comparative Toxicogenomics Database: update 2013. Nucleic Acids Res. 2013, 41, D1104. 10.1093/nar/gks994. [DOI] [PMC free article] [PubMed] [Google Scholar]
- Wang Y.; Zhang S.; Li F.; Zhou Y.; Zhang Y.; et al. Therapeutic target database 2020: enriched resource for facilitating research and early development of targeted therapeutics. Nucleic Acids Res. 2020, 48, D1031–D1041. 10.1093/nar/gkz981. [DOI] [PMC free article] [PubMed] [Google Scholar]
- Wishart D. S.; Yannick D. F.; An C. G.; E J. Lo.; Michael W. DrugBank 5.0: a major update to the Drug Bank database for 2018. Nucleic Acids Res. 2018, 46, D1074–D1082. 10.1093/nar/gkx1037. [DOI] [PMC free article] [PubMed] [Google Scholar]
- Hamosh A.; Scott A. F.; Amberger J. S.; Bocchini B.; McKusick V.; et al. Online Mendelian Inheritance in Man (OMIM), a knowledgebase of human genes and genetic disorders. Nucleic Acids Res. 2005, 33, D514–7. 10.1093/nar/gki033. [DOI] [PMC free article] [PubMed] [Google Scholar]
- Wang S. J.; Khullar K.; Kim S.; Yegya-Raman N.; Malhotra J.; et al. Effect of cyclo-oxygenase inhibitor use during checkpoint blockade immunotherapy in patients with metastatic melanoma and non-small cell lung cancer. J. Immunother. Cancer 2020, 8, e000889 10.1136/jitc-2020-000889. [DOI] [PMC free article] [PubMed] [Google Scholar]
- Ramalho T.; Filgueiras L.; Silva-Jr I. A.; Pessoa A. F. M.; Jancar S. Impaired wound healing in type 1 diabetes is dependent on 5-lipoxygenase products. Sci. Rep. 2018, 8, 14164. 10.1038/s41598-018-32589-7. [DOI] [PMC free article] [PubMed] [Google Scholar]
- Oosenbrug T.; van de Graaff; Haks M. J.; van Kasteren M. C.; Ressing S.; Ressing M. E. An alternative model for type I interferon induction downstream of human TLR2. J. Biol. Chem. 2020, 295, 14325–14342. 10.1074/jbc.ra120.015283. [DOI] [PMC free article] [PubMed] [Google Scholar]
- Szklarczyk D.; Gable A. L.; Lyon D.; Junge A.; Wyder S.; et al. STRING v11: protein-protein association networks with increased coverage, supporting functional discovery in genome-wide experimental datasets. Nucleic Acids Res. 2019, 47, D607–D613. 10.1093/nar/gky1131. [DOI] [PMC free article] [PubMed] [Google Scholar]
- Wishart D. S.; Feunang Y. D.; Guo A. C.; Lo E. J.; Marcu A.; Grant J. R.; Sajed T.; Johnson D.; Li C.; Sayeeda Z.; et al. DrugBank 5.0: a major update to the DrugBank database for 2018. Nucleic Acids Res. 2018, 46, D1074. 10.1093/nar/gkx1037. [DOI] [PMC free article] [PubMed] [Google Scholar]
- Perez-Riverol Y.; Csordas A.; Bai J.; Bernal-Llinares M.; Hewapathirana S.; et al. The PRIDE database and related tools and resources in 2019: improving support for quantification data. Nucleic Acids Res. 2019, 47, D442–D450. 10.1093/nar/gky1106. [DOI] [PMC free article] [PubMed] [Google Scholar]
Associated Data
This section collects any data citations, data availability statements, or supplementary materials included in this article.


