

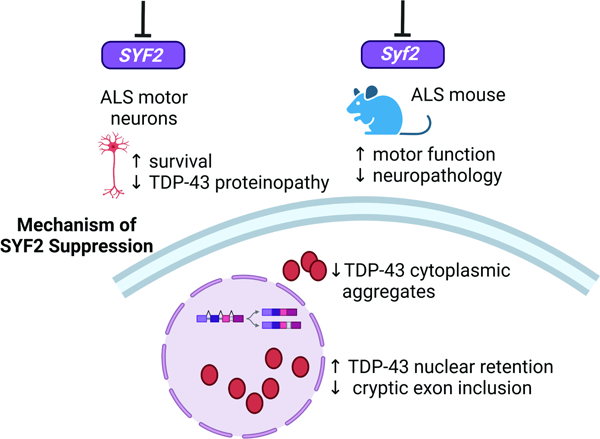
Graphical Abstract
Keywords: amyotrophic lateral sclerosis, induced pluripotent stem cells, SYF2, SYF1, TDP-43, Nineteen complex, spliceosome, Connectivity Map, drug screen, norgestrel, androgens
Summary
Amyotrophic lateral sclerosis (ALS) is a fatal neurodegenerative disease caused by many diverse genetic etiologies. Although therapeutics that specifically target causal mutations may rescue individual types of ALS, such approaches cannot treat most patients since they have unknown genetic etiology. Thus, there is a critical need for therapeutic strategies that rescue multiple forms of ALS. Here, we combine phenotypic chemical screening on a diverse cohort of ALS patient-derived neurons with bioinformatic analysis of large chemical and genetic perturbational datasets to identify broadly-effective genetic targets for ALS. We show that suppressing the gene encoding the spliceosome-associated factor SYF2 alleviates TDP-43 aggregation and mislocalization, improves TDP-43 activity, and rescues C9ORF72 and sporadic ALS neuron survival. Moreover, Syf2 suppression ameliorates neurodegeneration, neuromuscular junction loss, and motor dysfunction in TDP-43 mice. Thus, suppression of spliceosome-associated factors such as SYF2 may be a broadly-effective therapeutic approach for ALS.
Introduction
ALS is a rapidly-progressing neurodegenerative disease that leads to motor neuron degeneration, paralysis, and death usually within 2–5 years of onset 1. Like other prominent neurodegenerative diseases such as Alzheimer’s disease and frontotemporal dementia (FTD), ALS has many diverse genetic etiologies 2. Since each genetic form is relatively rare and the etiology is unknown for most patients, a key goal in treating ALS is the identification of pathways that can rescue multiple forms of ALS.
To this end, we reasoned that developing a phenotypic screening platform comprising motor neurons derived from ALS patients with diverse etiologies might identify broadly-effective therapeutic targets. This type of platform would be more amenable to small molecule probes as opposed to CRISPR-Cas9-based screening, which would require genetic modification of many induced pluripotent stem cell (iPSC) lines. However, small molecule targets are restricted to the druggable genome, which is a limitation given that antisense oligonucleotide (ASO) technology enables perturbation of RNA targets beyond the standard druggable genome in the clinic 3,4. We hypothesized we could overcome this limitation and extend the target landscape if we leveraged public datasets to identify genetic perturbations known to yield similar transcriptional changes to those induced by our top chemical hits.
Using this approach, we found that suppressing the pre-mRNA splicing factor-encoding gene SYF2 or a gene encoding one of SYF2’s interactors in the spliceosome-associated NineTeen Complex mitigates the degeneration of neurons derived from multiple C9ORF72 and sporadic ALS patients. SYF2 suppression slowed TDP-43 aggregation in the neuronal cytoplasm, increased the nuclear:cytoplasmic TDP-43 ratio, and reduced cryptic exon inclusion in the TDP-43 substrate STMN2. Importantly, Syf2 suppression ameliorated neurodegeneration, neuromuscular junction loss, and motor dysfunction in TDP-43-overexpressing mice. Thus, suppression of spliceosome-associated factors such as SYF2 may be a broadly-effective therapeutic approach for ALS.
Results
C9ORF72 and sporadic ALS iMNs display neurodegenerative disease processes
Since spinal motor neuron degeneration is a hallmark of ALS, we established a screening platform based on this phenotype. We previously showed that induced motor neurons (iMNs) generated from ALS patient iPSCs by transcription factor reprogramming degenerated faster than controls when stressed by excess glutamate addition or neurotrophic factor withdrawal (Fig. 1A)5,6. Since the C9ORF72 repeat expansion is the most common known cause of ALS and FTD, included C9ORF72 ALS/FTD iMNs in the screening panel7,8. We also included iMNs from multiple sporadic ALS patients (Table S1-2). We previously generated iPSCs from these C9ORF72 ALS/FTD and sporadic ALS patients and showed that their iMNs displayed increased neurodegeneration and ALS pathology compared to controls5,6. All iPSC lines were karyotypically normal and sporadic ALS lines did not contain known ALS-causing mutations (Tables S1-2).
Figure 1. C9ORF72 and sporadic ALS iMNs display neurodegenerative disease processes.
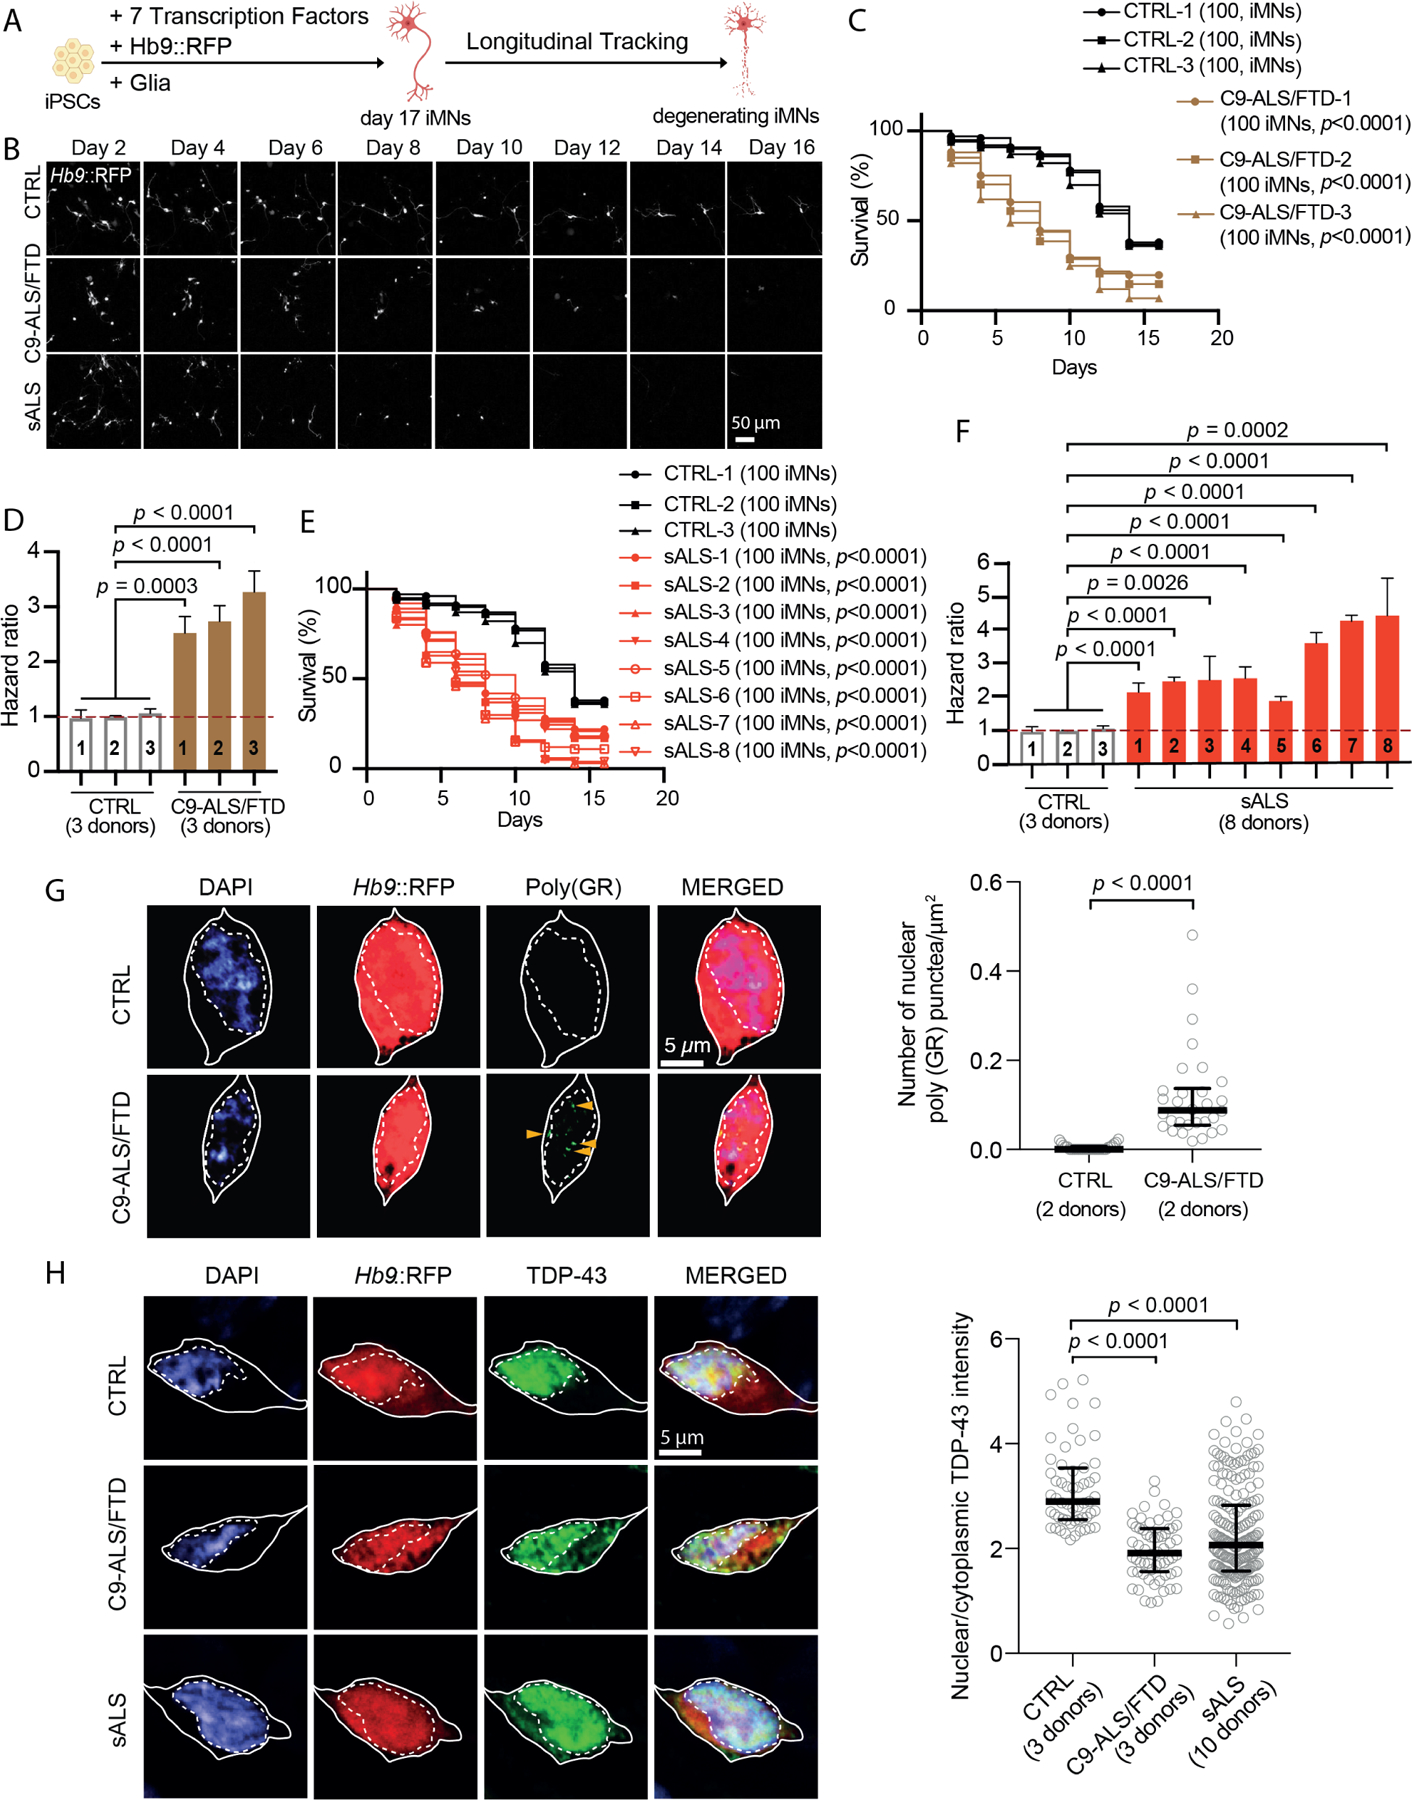
(A) Overview of iMN survival assay.
(B) Survival assay of control (CTRL), C9ORF72 ALS/FTD patient (C9-ALS/FTD) and sporadic ALS patient (sALS) iMNs.
(C) Survival of CTRL (three lines)/C9-ALS/FTD (three lines) iMNs. Log-rank test.
(D) Hazard ratios for (C). Mean of independent iMN conversions ± SEM One-way ANOVA.
(E) Survival of CTRL (three lines) and sALS (eight lines) iMNs. Log-rank test.
(F) Hazard ratios for (E). Mean of independent iMN conversions ± SEM. One-way ANOVA.
(G) Immunostaining/quantification of poly(GR)+ punctae in CTRL/C9-ALS/FTD iMNs. Gray circles = the number of nuclear poly(GR)+ punctae/μm2 in one iMN. Mann-Whitney test. Median ± interquartile range. Solid/dotted lines outline the cell body/nucleus.
(H) Immunostaining/quantification of total TDP-43 in CTRL, C9-ALS/FTD, and sALS iMNs. Gray circles = the average nuclear:cytoplasmic TDP-43 ratio in one iMN. Kruskal-Wallis test. Median ± interquartile range. Solid/dotted lines outline the cell body/nucleus.
To determine if C9ORF72 and sporadic ALS iMNs degenerated faster than controls, we expressed Ngn2, Isl1, Lhx3, Ascl1, Brn2, Myt1l, NeuroD1, and a lentiviral Hb9::RFP reporter to convert 3 control, 3 C9ORF72 ALS/FTD, and 8 sporadic ALS iPSC lines into Hb9::RFP+ iMNs (Fig. 1A, B and S1A-E)5,6. In control and patient cultures, a large percentage of MAP2+ cells possessed high levels of HB9 and ISL1, suggesting they were spinal motor neurons (Fig. S1B, C). Control and patient lines generated iMNs with similar efficiency, averaging about 300 iMNs per well of a 96-well plate (Fig. S1D). After the addition of mouse glia to promote neuronal maturation, iMNs constituted 20–30% of all cells (Fig. S1E). At day 17 of differentiation, iMNs respond appropriately to neurotransmitters, fire repetitive action potentials, and form functional neuromuscular junctions (NMJs)6. In addition, most iMNs formed before day 17, enabling facile identification and exclusion of iMNs born after day 17 during longitudinal tracking (Fig. S1F). Therefore, we used day 17 iMNs for experiments (Fig. 1A).
Longitudinal single neuron tracking demonstrated that when stressed by neurotrophic factor withdrawal, C9ORF72 ALS/FTD and sporadic iMNs degenerated faster than controls and therefore displayed a higher hazard rate (Fig. 1B-F; Fig. S1G). This resulted in a hazard ratio, or hazard rate of ALS iMNs relative to the control group, in this case control iMNs) >1 for ALS lines (Fig. 1D, F; Fig. S1G). C9ORF72 ALS/FTD iMNs displayed prominent poly(glycine-arginine (GR))+ and poly(proline-arginine (PR))+ dipeptide repeat protein (DPR) punctae when probed with knockout- or previously-validated antibodies (Fig. 1G; Fig. S1H)5,9,10. Similar to motor neurons in ALS postmortem tissue, C9ORF72 and sporadic ALS iMNs displayed pronounced TDP-43 mislocalization into the cytoplasm (Fig. 1H)11,12. Thus, ALS iMNs exhibit key disease features including rapid neurodegeneration and DPR and/or TDP-43 pathology.
A phenotypic screen identifies androgens as broadly-effective rescuers of ALS iMN survival
To identify targets that rescue ALS iMN degeneration, we screened a small molecule library of 1926 approved drugs and target-annotated tool compounds for the ability to increase ALS iMN survival (Fig. 2A, B; Table S3). We first screened C9ORF72 ALS/FTD iMNs, and longitudinal iMN tracking identified 67 compounds that significantly increased iMN survival in one C9ORF72 ALS/FTD line (Fig. 2B; Table S3). Validation on iMNs from two additional C9ORF72 ALS/FTD lines resulted in 50 compounds that significantly improved iMN survival for at least two out of three C9ORF72 ALS/FTD lines and did not increase control iMN survival (Fig. 2B-D; Table S4). Reassuringly, these 50 compounds included the PIKFYVE kinase inhibitor apilimod, which we had previously shown to be capable of improving C9ORF72 ALS/FTD iMN survival, as well as riluzole and edaravone, two drugs approved by the United States Food and Drug Administration (FDA) for ALS (Fig. 2C; Fig. S2A, B)6.
Figure 2. A phenotypic screen identifies androgens as broadly-effective rescuers of ALS iMN survival.
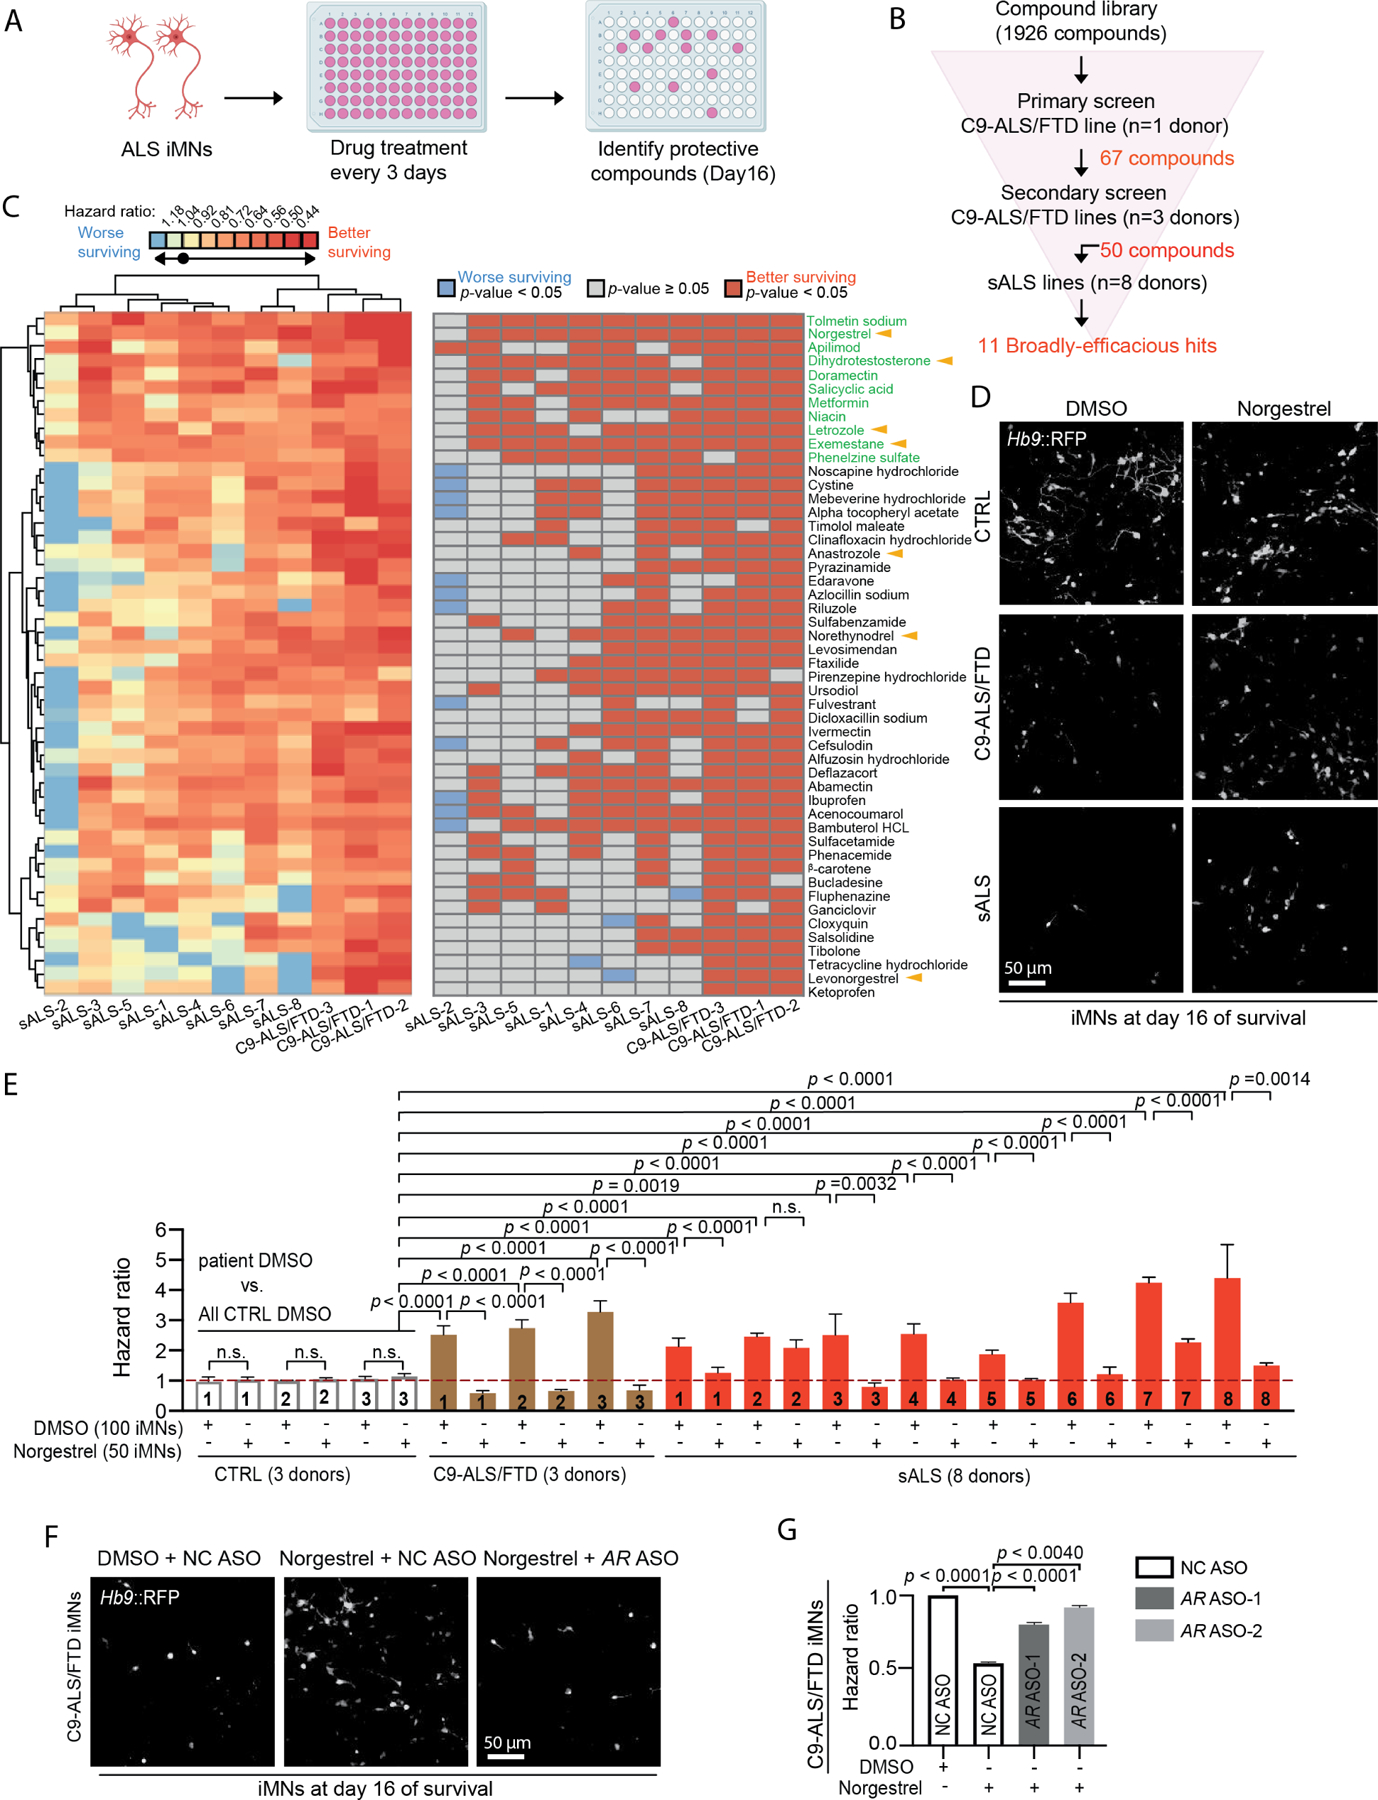
(A) Overview of the iMN survival screen.
(B) Screening funnel used to identify small molecules.
(C) Heat maps of the hazard ratios (left) and the statistical significance (right) of the 50 hits when administered to iMNs from each ALS line. Log-rank test. Black circle in the heat map key = hazard ratio = 1.
(D) Day 16 survival images of CTRL/C9-ALS/FTD/sALS iMNs treated with DMSO/norgestrel.
(E) Hazard ratios of CTRL (three lines in aggregate)/C9-ALS/FTD/sALS iMNs treated with DMSO/norgestrel. Mean of independent iMN conversions ± SEM One-way ANOVA.
(F) Day 16 survival images of C9-ALS/FTD iMNs treated with DMSO/norgestrel and negative control (NC) ASO/AR ASOs.
(G) Hazard ratios of C9-ALS/FTD iMNs treated with DMSO/norgestrel and NC/AR ASOs. Mean of independent iMN conversions ± SEM. One-way ANOVA.
To determine the efficacy of these 50 compounds more broadly, we screened them on iMNs from the 8 sporadic ALS lines (Fig. 2B, C). Unsupervised hierarchical clustering of the iMN survival data for all 50 compounds across the C9ORF72 and sporadic ALS lines grouped all C9ORF72 ALS/FTD lines together and away from the sporadic ALS lines (Fig. 2C, left heat map). Although all compounds increased C9ORF72 ALS/FTD iMN survival, most showed limited efficacy on over half the sporadic ALS lines (Fig. 2C, left/right heat maps). Riluzole and edaravone trended towards increasing iMN survival for most lines, but their effects were modest and did not reach statistical significance for most sporadic ALS lines (Fig. 2C, left/right heat maps; Fig. S2A, B). Thus, most compounds showed highly variable efficacy across ALS patient lines.
The heterogeneous drug responses exhibited by different ALS iMN lines underscored the importance of identifying broadly-effective targets for ALS. Unsupervised hierarchical clustering based on the hazard ratio of each compound/iMN line combination revealed a group of 11 compounds at the top of the heat maps that improved iMN survival for most ALS lines (Fig. 2C). 4 of these 11 compounds, dihydrotestosterone (DHT), norgestrel, exemestane, and letrozole, are known to increase androgen receptor signaling (Fig. 2C-E; Fig. S2C, D)13–15. Dihydrotestosterone significantly improved iMN survival for 6/8 sporadic ALS lines and is a potent and selective androgen receptor agonist, showing 50–100-fold selectivity for the androgen receptor over the progesterone receptor (Fig. 2C; Fig. S2C)14. Norgestrel also activates the androgen receptor, although it has a several-fold preference for activating the progesterone receptor14. Norgestrel treatment did not affect control iMN viability but improved iMN survival for 7/8 sporadic ALS lines and showed modest activity on the 8th sporadic ALS line that only reached significance in the hazard ratio analysis (Fig. 2C-E; Fig. S2D). In addition, norgestrel increased ALS iMN survival in a dose-dependent manner, supporting the validity of its neuroprotective effect (Fig. S2D). Astrocytes are known to produce testosterone, and exemestane and letrozole are aromatase inhibitors that prevent the conversion of androgens to estrogens16,17. Exemestane and letrozole also improved iMN survival for most sporadic ALS lines (Fig. 2C). Another aromatase inhibitor, anastrozole, as well as levonorgestrel, the active enantiomer within the racemic mixture comprising norgestrel, both improved ALS iMN survival, although for fewer lines (Fig. 2C)15,16. Finally, norethynodrel, a progesterone and androgen receptor agonist increased iMN survival for C9ORF72 ALS/FTD and several sporadic ALS lines (Fig. 2C)18. In total, 7/50 validated hits were compounds known to increase androgen receptor signaling.
Since dihydrotestosterone exhibits strong selectivity for the androgen receptor over the progesterone receptor and aromatase inhibitors increase androgen levels, we hypothesized that these hit compounds increased ALS iMN survival by stimulating androgen receptor signaling14,16. Consistent with this, antisense oligonucleotides (ASOs) that suppressed androgen receptor, but not progesterone receptor expression, reduced the ability of norgestrel to extend C9ORF72 ALS/FTD iMN survival (Fig. 2F, G; Fig. S2E, F; STAR Methods). Since levonorgestrel, a more potent progesterone receptor agonist than androgen receptor agonist, is the active enantiomer of the racemic mixture comprising norgestrel and yet improved iMN survival for fewer ALS lines than norgestrel, this suggested that a high level of progesterone receptor agonism may counteract the protective effect of androgen receptor stimulation for some ALS lines (Fig. 2C)15.
Since the primary mixed glial cells in our cultures were derived from mice and the ASOs were not predicted to suppress the murine androgen receptor gene due to a lack of sequence homology, we surmised that norgestrel acted directly on neurons to exert its therapeutic effect. To test this, we adapted our 2D iMN cultures to a 3D spheroid format to enable multi-week culturing without primary glial cells, which our 2D cultures required to prevent clumping of neurons and their detachment from the dish (Fig. S2G). Immunofluorescence analysis verified that the iMN spheroids did not contain any GFAP+ glial cells and survival tracking showed that sporadic ALS iMNs degenerated faster than controls in this culture format (Fig. S2H, I). Importantly, norgestrel treatment increased sporadic ALS iMN survival to a level similar to controls, supporting the notion that norgestrel can act directly on iMNs to provide neuroprotection (Fig. S2I). These results suggest that androgen activity improves iMN survival broadly across ALS lines with diverse etiologies.
Suppression of spliceosome-associated genes mimics the broad-efficacy observed with androgens
Recently, ASO treatment showed clinical efficacy against spinal muscular atrophy by targeting SMN2 transcripts through Watson-Crick base-pairing3. Thus, RNA targets are a viable option for treating neurodegenerative diseases. Due to the unknown safety of chronic androgen treatment, particularly in women, we wondered whether querying large chemical and genetic perturbational datasets with our small molecule screening data could identify broadly-active genetic targets beyond the druggable genome19,20. To this end, we used the Connectivity Map database to identify genes whose suppression leads to gene expression profiles similar to those induced by the androgens and aromatase inhibitors found in our screen (Fig. 3A). This yielded a list of candidate genes headed by SYF2 (Fig. 3A). SYF2 is a pre-mRNA splicing factor belonging to the NineTeen Complex, a collection of proteins that are recruited to the spliceosome to regulate conformational changes required for the two steps of splicing21–24. Immunohistochemical analysis of postmortem tissue detected SYF2 protein in both lower and upper motor neurons in control and sporadic ALS patient samples, confirming that SYF2 is present in relevant cell types in vivo (Fig. S3A-C).
Figure 3. Suppression of spliceosome-associated genes mimics the broad-efficacy observed with androgens.
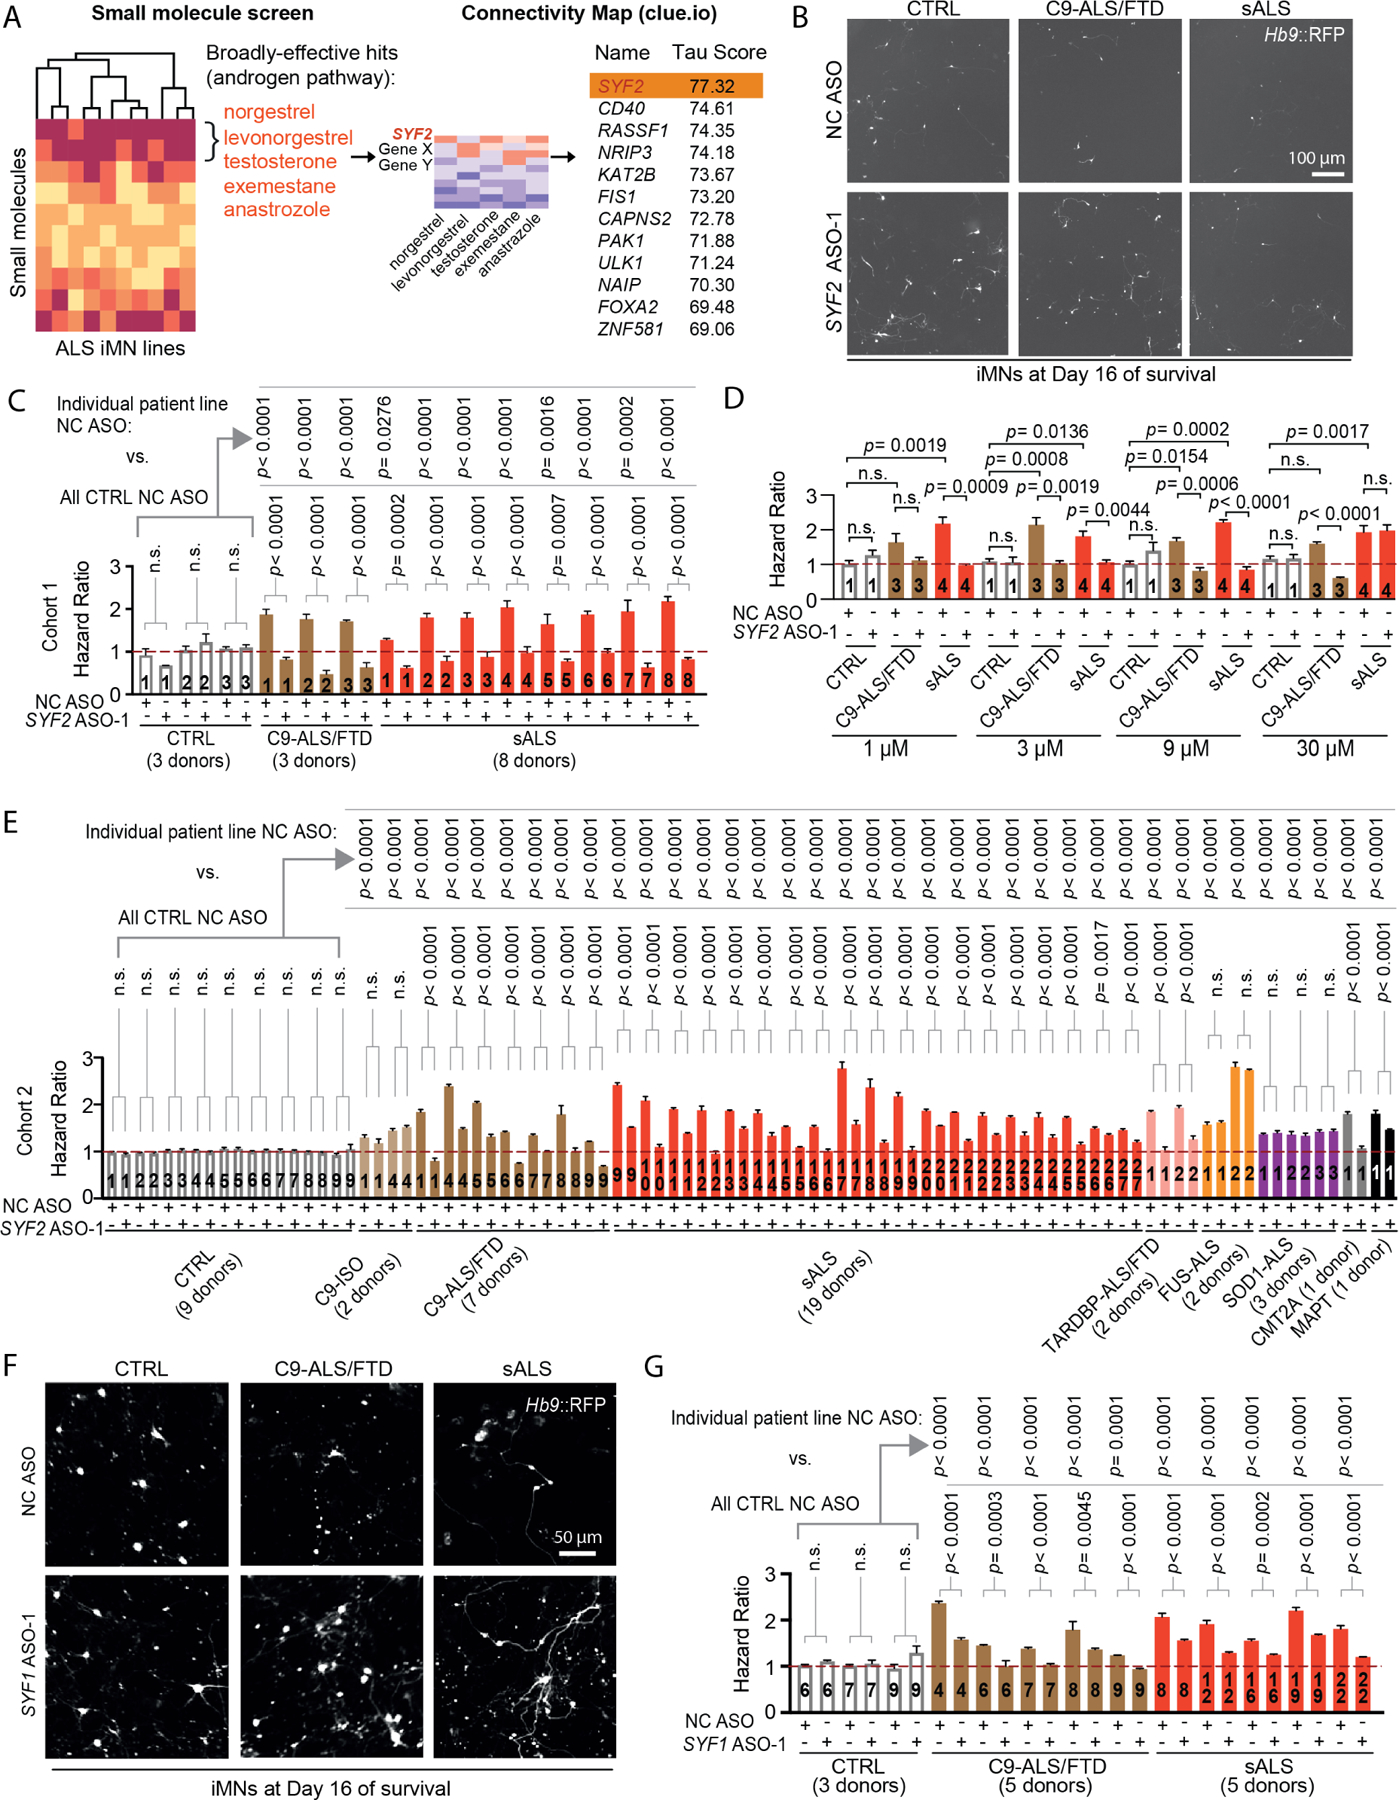
(A) Connectivity Map analysis of the androgenic hit compounds found in the ALS iMN screen.
(B) Day 16 survival images of CTRL/C9-ALS/FTD/sALS iMNs treated with NC/SYF2 ASOs.
(C) Hazard ratios of cohort 1 iMNs treated with NC/SYF2 ASOs. Mean of independent iMN conversions ± SEM. One-way ANOVA.
(D) Hazard ratios of iMNs from CTRL/C9-ALS/FTD/sALS lines treated with NC/ SYF2 ASO. Mean of independent iMN conversions ± SEM. One-way ANOVA.
(E) Hazard ratios of cohort 2 iMNs treated with NC/SYF2 ASO. C9-ISO=C9ORF72 isogenic control. CMT2A = Charcot-Marie-Tooth 2A. MAPT = MAPT FTD. Mean of independent iMN conversions ± SEM. One-way ANOVA.
(F) Day 16 survival images of CTRL/C9-ALS/FTD/sALS iMNs treated with NC/SYF1 ASOs.
(G) Hazard ratios of CTRL (three lines in aggregate)/C9-ALS/FTD/sALS iMNs treated with NC/SYF1 ASOs. Mean of independent iMN conversions ± SEM. One-way ANOVA.
Multiple SYF2 ASOs improved C9ORF72 and sporadic ALS iMN survival in a dose-dependent manner, with increasing doses up to 9 μM inducing more significant differences between the SYF2 and negative control ASOs (Fig. 3B-D; Fig. S3D-G, STAR Methods). For multiple lines, the survival of ALS iMNs with SYF2 ASO treatment approached the level of controls, suggesting that SYF2 suppression improves iMN survival broadly across ALS lines with diverse etiologies (Fig. 3B-D; Fig. S3F, G).
Since we had performed the original small molecule screen in this same collection of C9ORF72 and sporadic ALS lines, it was possible that these results were specific to this limited set of iMNs. To examine the range of efficacy of SYF2 suppression among a larger set of ALS patient lines, we assembled a new collection of ALS lines that we named cohort 2, which included 5 additional C9ORF72 and 19 additional sporadic ALS lines (Fig. 3E; Table S1). The average age at sampling for the C9ORF72 and sporadic ALS donors in cohorts 1 and 2 combined were 53 and 54.6 years old, respectively, and we included 6 new control lines that brought the average age at sampling for controls to 53.4 years old, which was similar to the ALS groups (Fig. 3E; Table S1). The percentage of male donors among ALS patients in cohorts 1 and 2 combined was 55% and 48%, respectively, which was comparable to the 55% male lines in the control group (Table S1). Moreover, we included isogenic controls for one of the new C9ORF72 lines and a C9ORF72 line from cohort 1, both of which were generated using CRISPR/Cas9 editing (Fig. 3E; Table S1). To enable testing on other forms of ALS, we included lines from patients harboring mutations in TARDBP, FUS, and SOD1 (Fig. 3E; Table S1)25. We also added iPSC lines from a CMT2A patient and an FTD patient harboring a mutation in MAPT as non-ALS disease controls (Fig. 3E; Table S1). iMNs from all ALS patient lines in cohort 2 displayed significantly shorter survival than controls upon neurotrophic factor withdrawal (Fig. 3E). Although a previous study had observed neurodegenerative phenotypes in motor neurons from a majority, but not all sporadic ALS lines, it is possible that our approach of longitudinally tracking iMN survival increased our sensitivity in detecting differences in iMN viability (Fig. 3E)26.
3 SYF2 ASOs increased the survival of iMNs from all C9ORF72, sporadic, and TARDBP ALS lines (Fig. 3E and S3I, J). In contrast, SYF2 suppression did not increase the survival of iMNs from control, FUS ALS, or SOD1 ALS lines, suggesting that its mechanism of action might be specific for iMNs harboring C9ORF72 and/or TDP-43 disease processes (Fig. 3E; Fig. S3I, J). While SYF2 suppression did not affect the survival of CMT2A iMNs, it did decrease the hazard ratio values for MAPT FTD neurons, suggesting a potential connection between SYF2 and mutant tau disease processes (Fig. 3E; Fig. S3I, J; ; Data S1). Thus, SYF2 suppression mitigates the degeneration of iMNs from C9ORF72, TARDBP, and sporadic ALS patients.
SYF2 suppression can mitigate astrocyte activation induced by lipopolysaccharide - induced neuroinflammation, raising the possibility that glial cells partially mediated the neuroprotective effects of SYF2 suppression in our cultures27. However, since the primary mixed glial cells in our cultures were derived from mice and the SYF2 ASOs did not suppress Syf2 in these cells, we hypothesized that SYF2 suppression acted directly in iMNs to exert its therapeutic effect (Fig. S3K). Consistent with this, SYF2 suppression increased sporadic ALS iMN survival in 3D spheroids without glial cells (Fig. S3L).
To determine if SYF2 modulates ALS iMN survival through its activity within the NineTeen Complex, we assessed the effects of suppressing another NineTeen Complex member and SYF2 interactor on ALS iMN survival using representative lines from cohorts 1 and 2 with survival phenotypes ranging from mild to severe (Fig. 3F, G; Fig. S3M; STAR Methods). Similarly to SYF2, suppression of NineTeen Complex gene SYF1 increased the survival of iMNs from all C9ORF72 and sporadic ALS lines tested, but not controls (Fig. 3F, G; Fig. S3M; STAR Methods). Thus, lowering the expression of the NineTeen Complex genes SYF1 or SYF2 ameliorates the degeneration of iMNs with diverse ALS etiologies.
SYF2 suppression ameliorates TDP-43 pathology and dysfunction in ALS iMNs
At autopsy, ~97% of ALS patients harbor neuronal TDP-43 pathology in affected regions characterized by nuclear depletion of TDP-43, increased cytoplasmic pTDP-43, and cytoplasmic inclusions comprised largely of pTDP-4312,28. Accumulation of cytoplasmic pTDP-43 is neurotoxic and accelerates loss of nuclear TDP-43, possibly through local diffusive capture, which further reduces neuronal viability and function29–32. Since TDP-43 pathology is a common disease feature of C9ORF72 and sporadic ALS cases, TDP-43 is an RNA-binding protein whose RNA splicing substrates can modulate its aggregation propensity, and SYF2 and SYF1 participate in RNA splicing, we investigated whether suppression of SYF2 improved ALS iMN survival by mitigating TDP-43 dysfunction33. Although iMN survival experiments included neurotrophic factor withdrawal in order to exacerbate the survival difference between control and patient iMNS, it was not necessary for the subsequent mechanistic experiments.
SYF2 suppression restored the normal nuclear:cytoplasmic TDP-43 ratio in C9ORF72 and sporadic ALS iMNs by 11 days after ASO treatment (Fig. 4A, B). To determine if SYF2 suppression restored the normal nuclear:cytoplasmic ratio of TDP-43 by slowing the nuclear export of TDP-43 and preventing its aggregation in the cytoplasm, we quantified endogenous TDP-43 using immunostaining and focused on nuclear export by using digitonin to selectively permeabilize the plasma membrane and largely eliminate cytoplasmic TDP-4334–38. Since siRNA treatment suppressed SYF2 with similar potency and was more economical than ASO administration due to the low amount of siRNA required for activity, we used siRNA-mediated suppression for these additional mechanistic experiments (Fig. S4A). SYF2 suppression in C9ORF72 and sporadic ALS iMNs slowed TDP-43 export from the nucleus (Fig. 4C, D; Fig. S4B, C; STAR Methods). 5-Ethynyl Uridine (EU) incorporation into nascent RNA transcripts did not reveal significant differences in nuclear RNA levels in iMNs with or without SYF2 suppression, suggesting that SYF2 suppression did not slow nuclear TDP-43 export by increasing total nuclear RNA levels (Fig. S4D, E). However, it is possible that SYF2 suppression increases the abundance of certain RNA substrates of TDP-43 in the nucleus.
Figure 4. SYF2 suppression ameliorates TDP-43 pathology and dysfunction in ALS iMNs.
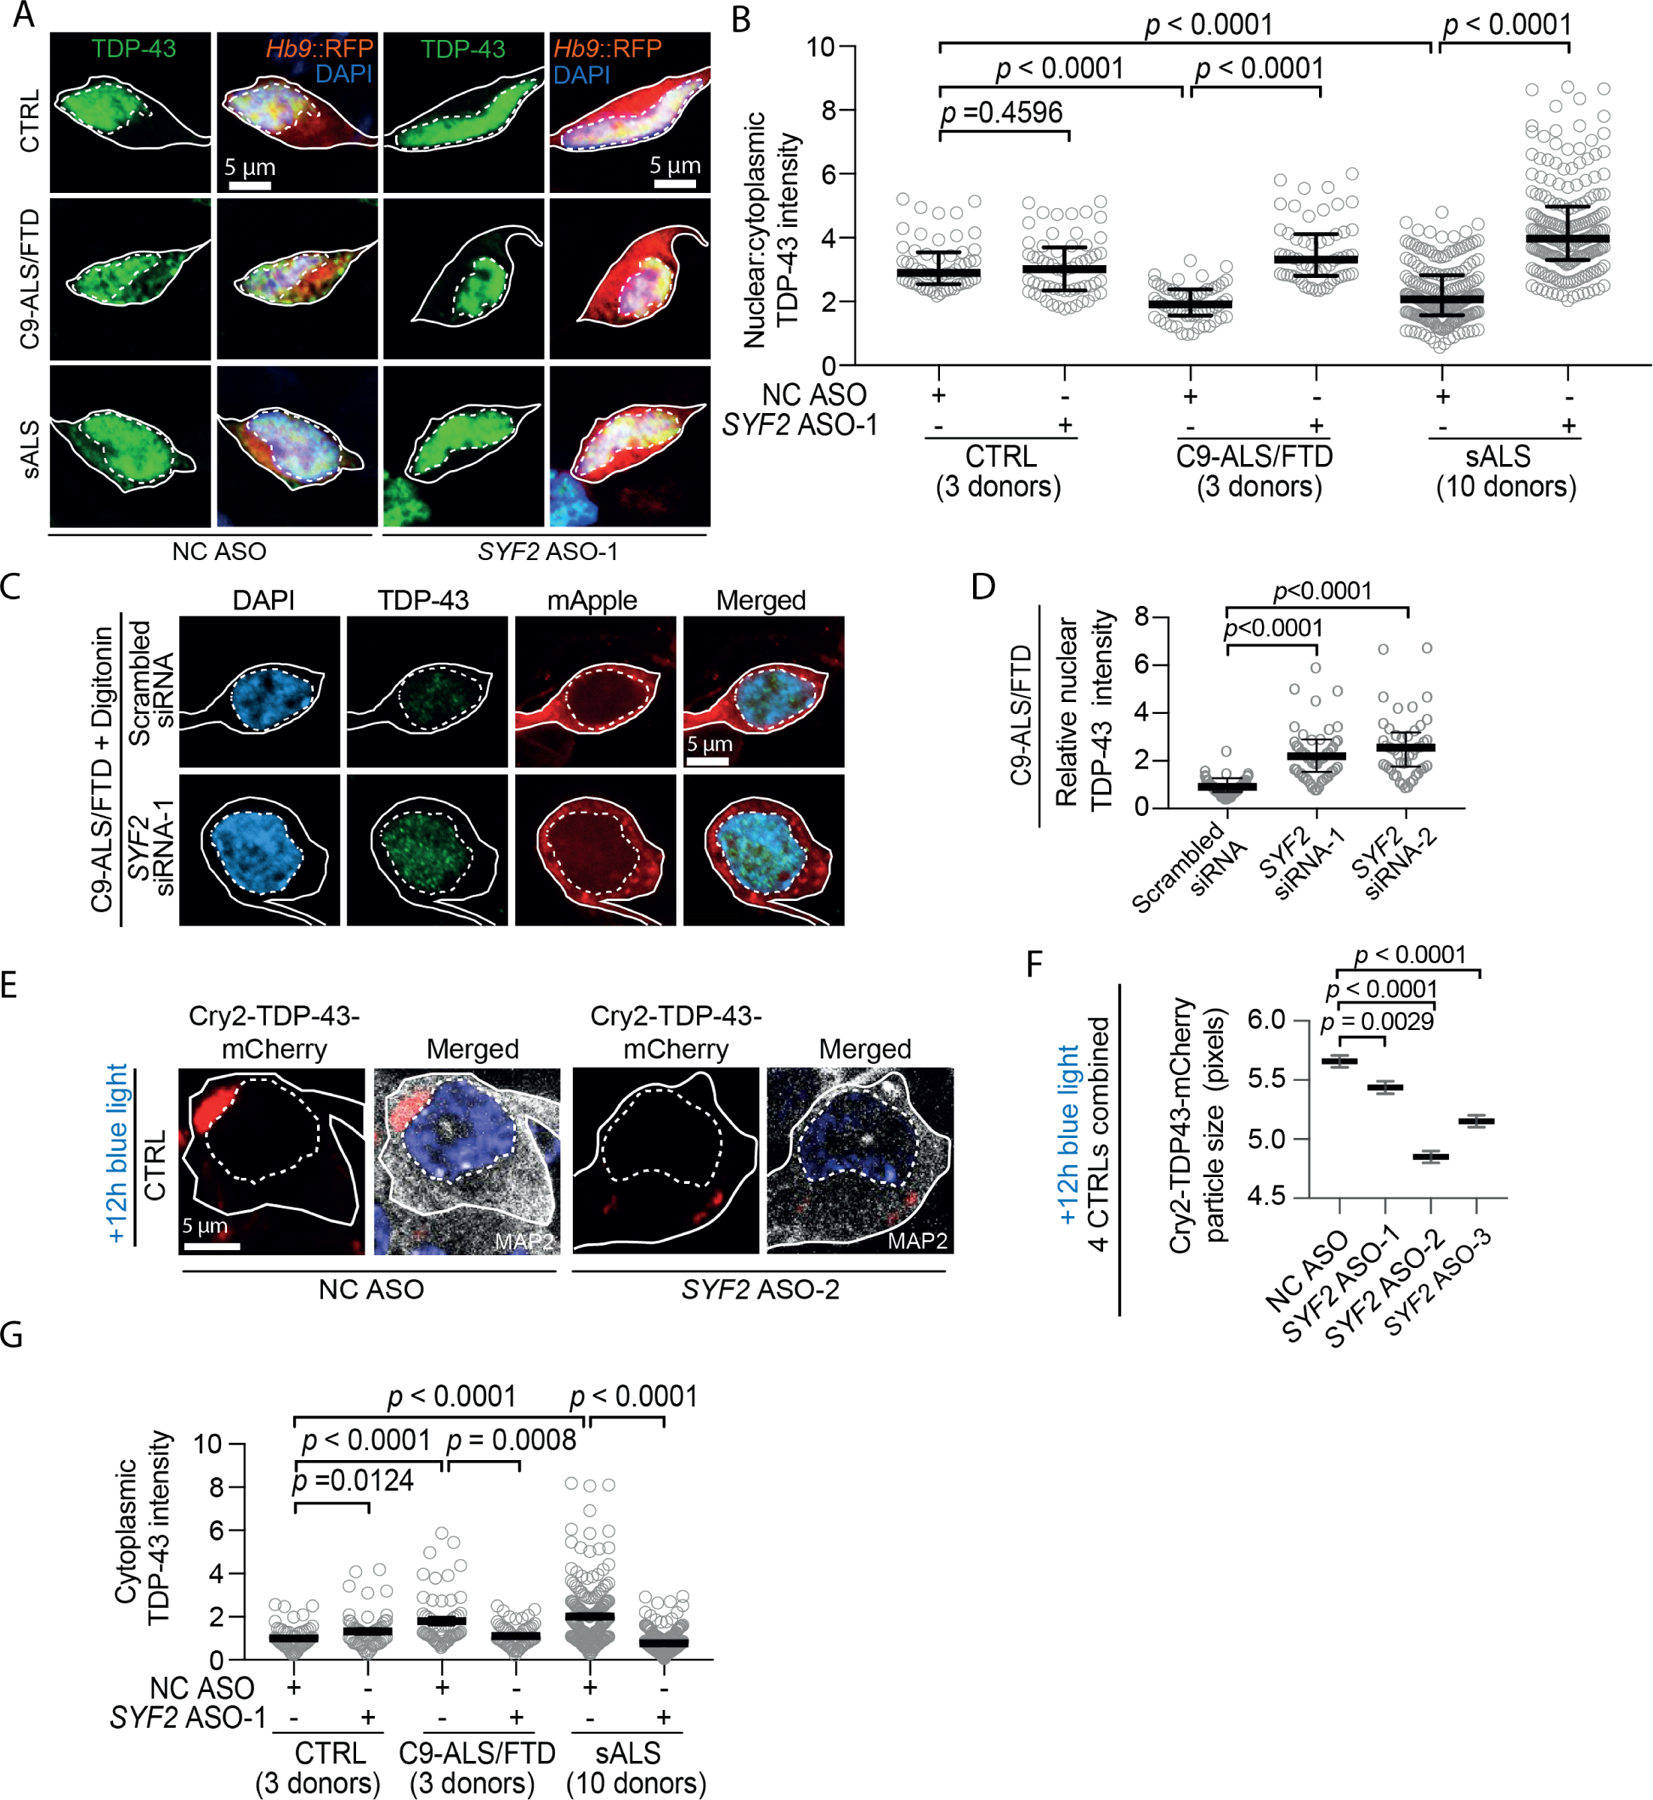
(A, B) Immunostaining/quantification of total TDP-43 in CTRL/C9-ALS/FTD/sALS iMNs treated with NC/SYF2 ASOs. Gray circles = the average nuclear:cytoplasmic TDP-43 ratio in one iMN. Kruskal-Wallis test. Median ± interquartile range. Solid/ dotted lines outline the cell body/nucleus.
(C, D) Immunostaining/quantification of total nuclear TDP-43 remaining one hour after digitonin treatment in C9-ALS/FTD iMNs pretreated with scrambled siRNA/SYF2 siRNAs. Kruskal-Wallis test. Median ± interquartile range.
(E, F) Immunostaining/quantification of the size of cytoplasmic Cry2olig-TDP-43-mCherry (Cry2-TDP-43-mCherry) punctae in control iMNs treated with NC/SYF2 ASOs. One-way ANOVA. Mean ± SEM. Solid/dotted lines outline the cell body/nucleus.
(G) Quantification of immunostaining of cytoplasmic TDP-43 in CTRL/C9-ALS/FTD/sALS iMNs treated with NC/SYF2 ASOs. Gray circles = average cytoplasmic TDP-43 intensity in one iMN. One-way ANOVA. Mean ± SEM.
To determine if SYF2 suppression also slowed TDP-43 aggregation in the cytoplasm, we utilized an optogenetic TDP-43 construct called Cry2olig-TDP-43-mCherry in which full-length TDP-43 is fused to the Cry2olig protein33. Cry2olig is derived from the photolyase-homologous region of the cryptochrome 2 protein from Arabidopsis thalania and homo-oligomerizes in response to blue light33. Consistent with a prior study, photo-oligomerization of Cry2olig-TDP-43-mCherry in neurons lead to the accumulation of cytoplasmic inclusions reminiscent of the TDP-43 pathology in ALS neurons (Fig. S4F, G)33. SYF2 ASO treatment significantly reduced the size of Cry2olig-TDP-43-mCherry inclusions in the cytoplasm induced by blue light exposure (Fig. 4E, F). SYF2 ASO treatment also reduced endogenous cytoplasmic TDP-43 levels in 2D cultures of C9ORF72 and sporadic ALS iMNs and in TARDBP-mutant iMN spheroids (Fig. 4G, H; Fig. S4H, I). Thus, SYF2 suppression slows nuclear export of TDP-43, reduces the rate of TDP-43 aggregation in the cytoplasm, and restores the normal nuclear:cytoplasmic TDP-43 ratio in ALS iMNs.
One important function of TDP-43 is to reduce the incorporation of cryptic exons that result in non-productive RNA transcripts39. Consequently, loss of nuclear TDP-43 in motor neurons reduces mRNA levels for hundreds of genes, including STMN230,31. STMN2 is a microtubule-binding protein and its loss compromises neurite outgrowth in motor neurons30,31. Consistent with previous reports and the TDP-43 pathology we observed in ALS iMNs, C9ORF72 and sporadic ALS iMNs exhibited increased incorporation of the cryptic polyadenylation site in intron 1 of the STMN2 pre-mRNA, resulting in reduced full-length STMN2 RNA levels (Fig. 5A; Fig. S5A, B). Suppression of TARDBP by siRNAs produced similar effects in control iMNs, confirming the validity of our qRT-PCR assays (Fig. 5B; Fig. S5C, D). Importantly, SYF2 suppression lowered the incorporation of the cryptic polyadenylation site in STMN2 mRNA and increased full-length STMN2 RNA and protein in C9ORF72 and sporadic ALS iMNs (Fig. 5C-F; Fig. S5E, F). SYF2 siRNA treatment did not increase TARDBP transcript levels, indicating that the improved TDP-43 activity was not due to increased transcription of TARDBP (Fig. S5G, H).
Figure 5. SYF2 suppression increases STMN2 function in ALS iMNs.
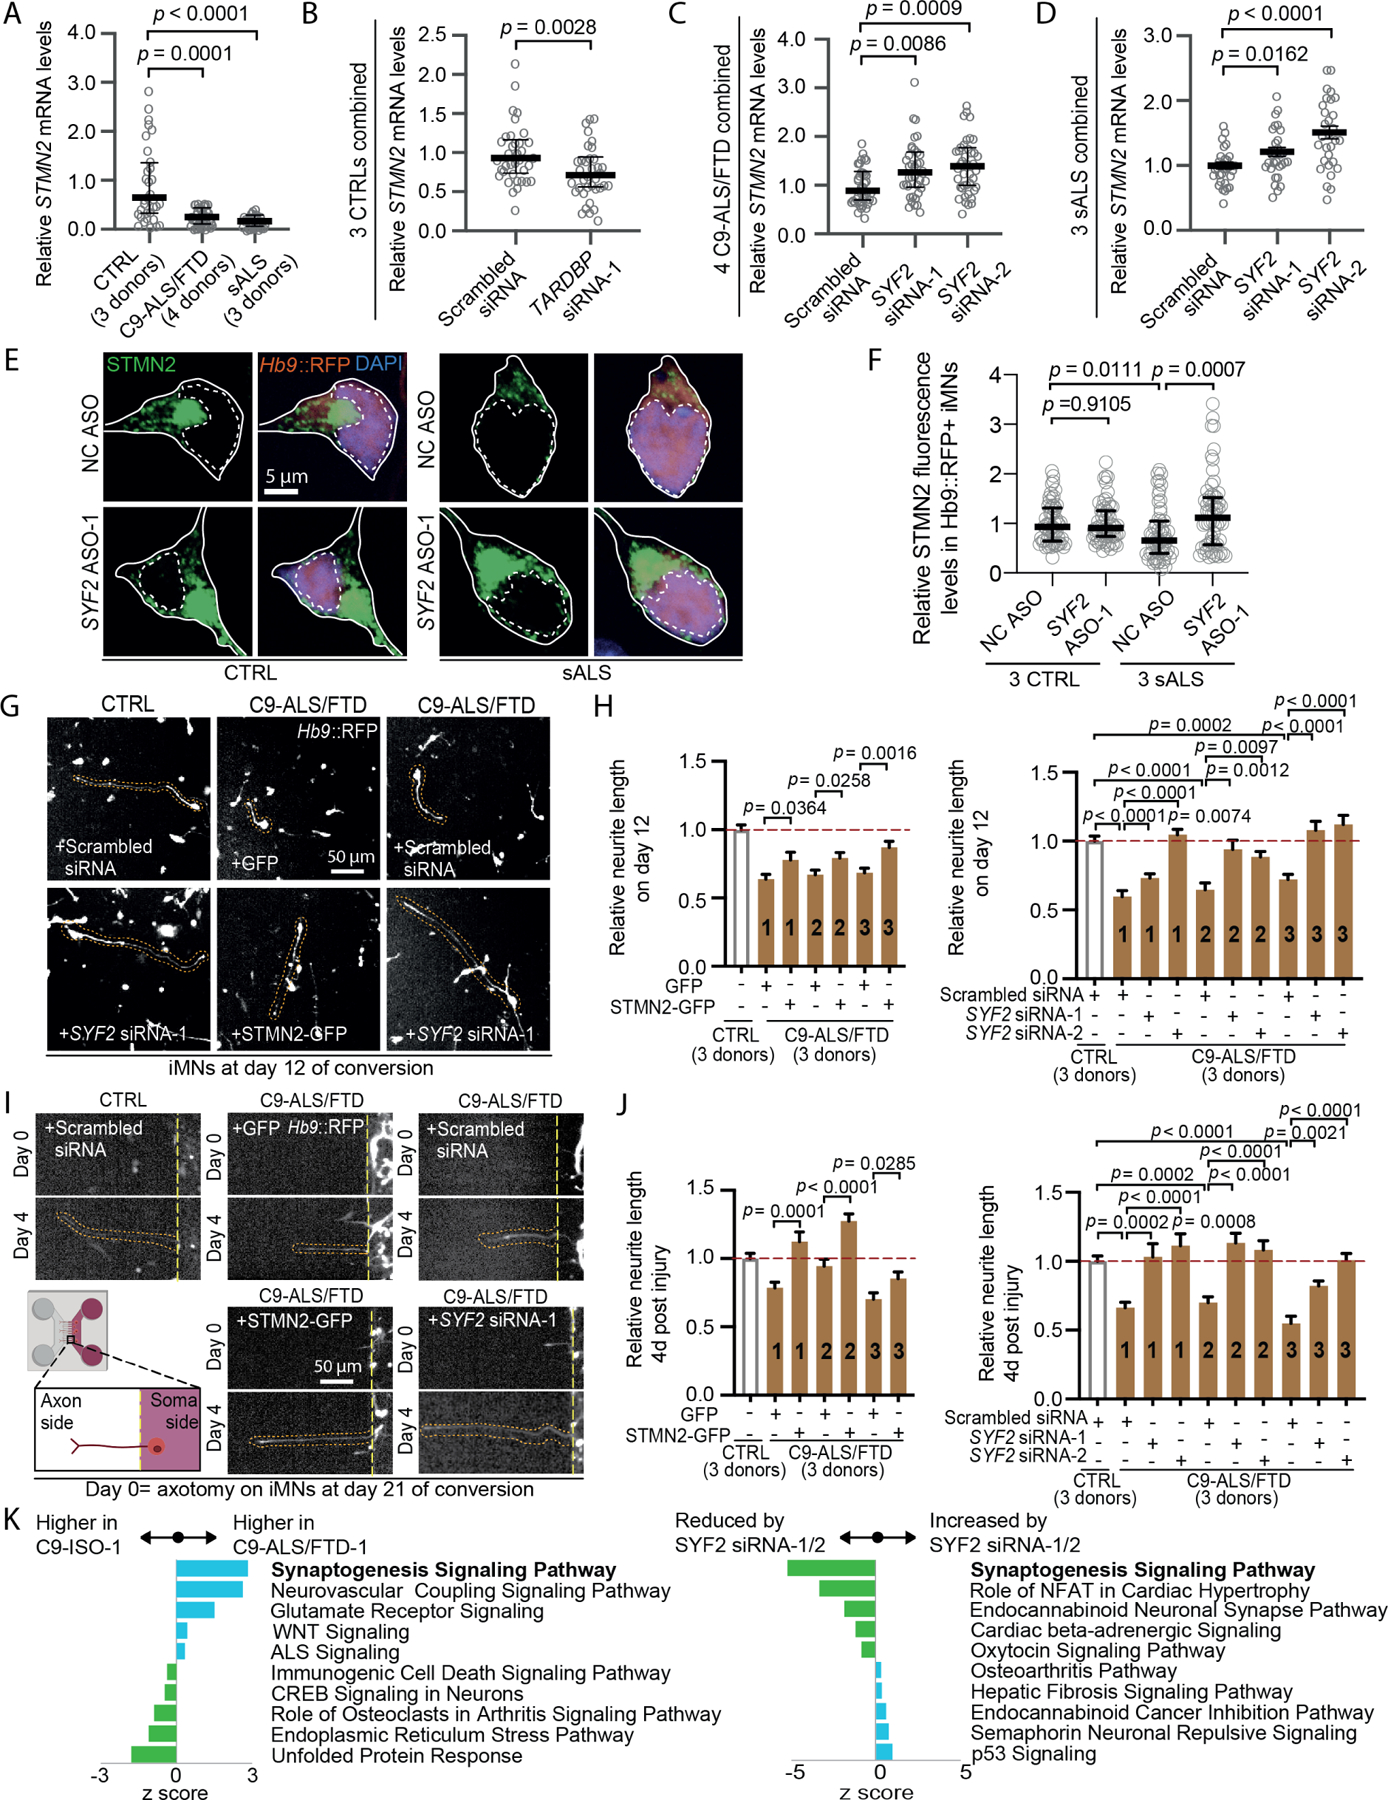
(A) STMN2 mRNA levels (normalized to MAP2 and 18s) in CTRL/C9-ALS/FTD/sALS iMNs. Gray circles = independent iMN cultures. Kruskal-Wallis test. Median ± interquartile range.
(B) STMN2 mRNA levels (normalized to 18s) in CTRL iMNs treated with scrambled siRNA/TARDBP siRNA-1. Gray circles= independent iMN cultures. Mann-Whitney test. Median ± interquartile range.
(C) STMN2 mRNA levels (normalized to 18s) in C9-ALS/FTD iMNs treated with scrambled siRNA/SYF2 siRNAs. Gray circles=independent iMN cultures. Kruskal-Wallis test. Median ± interquartile range.
(D) STMN2 mRNA levels (normalized to 18s) in sALS iMNs treated with scrambled siRNA/SYF2 siRNAs. Gray circles=independent iMN cultures. Unpaired t-test. Mean ± SEM
(E, F) Immunostaining/quantification of total endogenous STMN2 in CTRL/ sALS iMNs treated with NC ASO/SYF2 ASO-1. Gray circles=average STMN2 fluorescence levels in one iMN. Kruskal-Wallis test. Median ± interquartile range. Solid/dotted lines outline the cell body/ nucleus.
(G) Day 12 images of the iMN conversion from CTRL/C9-ALS/FTD iMNs transduced with lentiviruses encoding GFP/STMN2-GFP, or treated with scrambled siRNA/SYF2 siRNAs.
(H) Relative neurite length of day 12 CTRL/C9-ALS/FTD iMNs transduced with lentiviruses encoding GFP/STMN2-GFP or treated with scrambled siRNA/SYF2 siRNAs. Unpaired t-test for GFP vs. STMN2-GFP. One-way ANOVA for scrambled siRNA vs. SYF2 siRNAs. Mean ± SEM
(I) Images of neurite recovery 4 days after axotomy of CTRL/C9-ALS/FTD iMNs transduced with lentiviruses encoding GFP/STMN2-GFP, or treated with scrambled siRNA/SYF2 siRNAs.
(J) Relative neurite length of CTRL/C9-ALS/FTD iMNs 4 days after axotomy transduced with lentiviruses encoding GFP/STMN2-GFP or treated with scrambled siRNA/SYF2 siRNAs. Unpaired t-test for GFP vs. STMN2-GFP. One-way ANOVA for scrambled siRNA vs. SYF2 siRNAs. Mean ± SEM
(K) Pathway analysis of differentially expressed genes in C9-ALS/FTD/C9-ISO iMNs treated with scrambled siRNA/SYF2 siRNAs. Pathways from IPA were ranked by p-values. Z-scores for the top 5 up-regulated (blue bars) and the top 5 down-regulated (green bars) are shown.
Consistent with their reduced STMN2 expression, C9ORF72 ALS/FTD iMNs displayed shorter neurites or slower neurite outgrowth than controls in both injury and non-injury conditions (Fig. 5G-J). In accordance with previous studies, forced STMN2 expression increased neurite length in injured and non-injured C9ORF72 ALS/FTD iMNs, confirming the positive effect of STMN2 on neurite outgrowth in these assays (Fig. 5G-J)30,31. Importantly, SYF2 suppression also increased neurite outgrowth in injured and non-injured C9ORF72 ALS/FTD iMNs, indicating that its effect on STMN2 levels translated to functional changes in iMNs (Fig. 5G-J). Thus, SYF2 suppression reduces TDP-43 mislocalization, slows TDP-43 nuclear export and inclusion formation in the cytoplasm, and increases TDP-43 and STMN2 function in ALS iMNs.
To determine if improving TDP-43 function normalized gene expression more broadly, we performed RNA-seq analysis on C9ORF72 ALS/FTD iMNs treated with scrambled or SYF2 siRNAs. We compared these samples to iMNs derived from an isogenic control line in which the C9ORF72 repeat expansion was removed by CRISPR/Cas9 editing (see methods). Ingenuity Pathway Analysis revealed that the most significant downregulated gene category in C9ORF72 ALS/FTD iMNs was “Synaptogenesis signaling pathway,” consistent with prior reports that detected synaptic dysfunction in C9ORF72 ALS/FTD models (Fig. 5K; Table S5)40–43. SYF2 suppression ameliorated the aberrant “synapse formation” gene expression in C9ORF72 ALS/FTD iMNs, suggesting that it helped to normalize RNA metabolism (Fig. 5K; Table S5). Alternative splicing analysis using ASpli indicated that SYF2 suppression significantly increased levels of TDP-43 target RNAs including UNC13A (Fig. S5L; Table S5)44–46. SYF2 suppression increased UNC13A RNA containing the exon flanking the cryptic exon in this gene, suggesting that lowering SYF2 reduced cryptic exon inclusion, improved proper splicing, and stabilized the UNC13A transcript (Fig. S5L; Table S5).
In addition to the loss- and gain-of-function effects of TDP-43 pathology, C9ORF72 ALS/FTD models exhibit pronounced DNA damage that may also contribute to neurodegeneration47,48. SYF2 plays a role in the DNA damage response, suggesting that reducing SYF2 levels may also affect DNA damage in C9ORF72 ALS/FTD iMNs49. C9ORF72 ALS/FTD iMNs indeed displayed slightly elevated levels of ɣH2AX immunostaining, indicating that they possessed more DNA damage than control or sporadic ALS iMNs (Fig. S5J, K). Interestingly, SYF2 suppression lowered ɣH2AX levels in C9ORF72 ALS/FTD iMNs, suggesting that it ameliorated DNA damage (Fig. S5J, K).
Syf2 suppression ameliorates TDP-43 pathology, neurodegeneration, and motor dysfunction in TDP-43 mice
To determine if Syf2 suppression ameliorates TDP-43 pathology, neurodegeneration, and motor dysfunction in vivo, we tested the efficacy of a Syf2 ASO in TAR4/4 mice, which overexpress human TDP-43 in neurons and develop TDP-43 pathology similar to that observed in ALS patients50,51. TAR4/4 (TDP-43 homozygous) mice displayed gait abnormalities, tremor, and kyphosis starting at day 14 and showed TDP-43 mislocalization, spinal motor neuron degeneration, and loss of NMJs at day 21 (Fig. 6A-L). Administration of a Syf2-targeting ASO at P1 lowered SYF2 mRNA and protein levels in central nervous system tissue and cerebrospinal fluid (Fig. S6A-F). ASO treatment sustained Syf2 suppression until at least day 21 post-treatment and reduced Syf2 expression in key target regions including the cortex and spinal cord (Fig. S6G, H). Importantly, Syf2 ASO treatment mitigated the gait, tremor, and kyphosis phenotypes in TAR4/4 mice (Fig. 6A-D). At day 21, Syf2 suppression lowered levels of cytoplasmic pTDP-43+ punctae in motor neurons in the cortex and spinal cord and limited the pronounced loss of spinal motor neurons (Fig. 6E-J). Closer examination of spinal motor neurons showed that Syf2 ASO treatment increased the TDP-43 nuclear:cytoplasmic ratio in TAR4/4 mice and reduced NMJ denervation (Fig. 6K, L; Fig. S6I). Since SYF2 can regulate glial cell proliferation in response to retinal damage, we examined the effect of Syf2 ASO treatment on gliosis in TAR4/4 mice52. Syf2 suppression did not reduce the number of GFAP+ or IBA1+ cells in the cortex or spinal cord, suggesting it did not significantly affect the proliferation of astrocytes or microglia in TAR4/4 mice (Fig. S6J-M). We did not observe any phenotypic or histological signs of toxicity in control mice treated with the Syf2 ASO (Fig. 6B-L). Thus, Syf2 suppression rescues TDP-43-driven pathology, neurodegeneration, and NMJ loss and improves motor function in vivo.
Figure 6. Syf2 suppression ameliorates TDP-43 pathology, neurodegeneration, and motor dysfunction in TDP-43 mice.
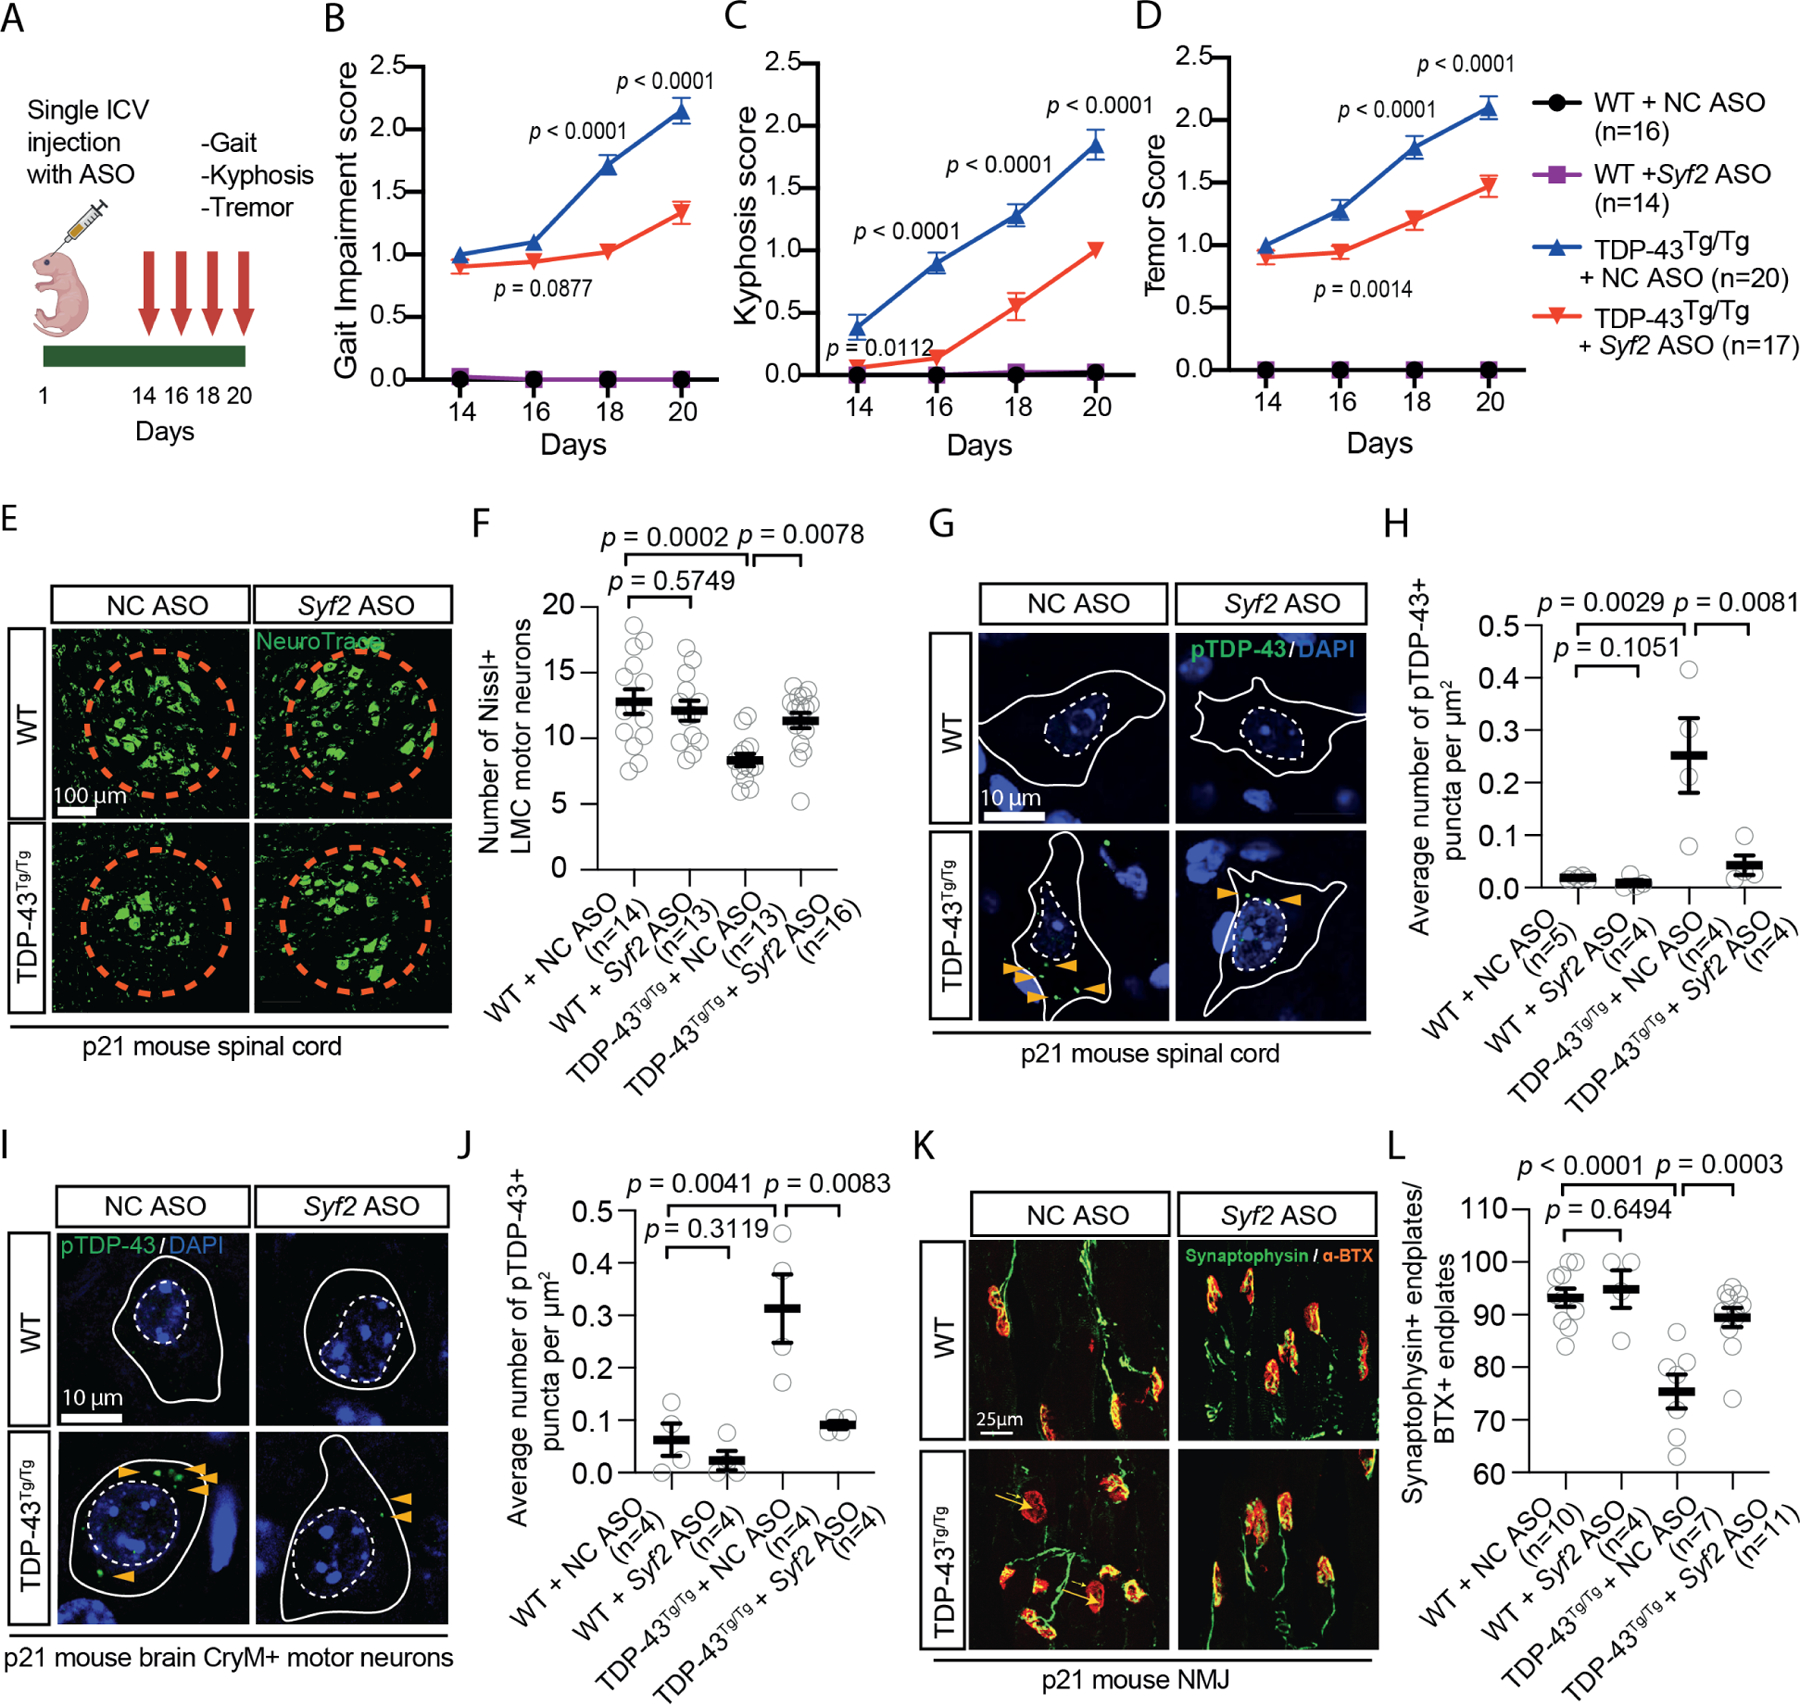
(A) Syf2 ASO efficacy experiment in TAR4/4 (TDP-43Tg/Tg) mice. ICV = intracerebroventricular.
(B-D) Gait impairment/kyphosis/tremor scores of WT/TDP-43Tg/Tg mice treated with NC ASO/Syf2 ASO. Unpaired t-test. Mean ± SEM
(E, F) Immunostaining/quantification of Nissl+ lateral motor column (LMC) motor neurons in the lumbar spinal cord of WT/TDP-43Tg/Tg mice treated with NC ASO/Syf2 ASO. Gray circles= average number of LMC motor neurons/section in one mouse. Kruskal-Wallis test. Median ± interquartile range.
(G, H) Immunostaining/quantification of phosphorylated TDP-43 (pS409/410) in the lumbar spinal cord of WT/TDP-43Tg/Tg mice treated with NC ASO/Syf2 ASO. Gray circles= average number of pTDP-43+ puncta/μm2 in 10–15 neurons from three sections in one mouse. One-way ANOVA. Mean ± SEM White solid/dashed lines mark the cell body/nucleus.
(I, J) Immunostaining/quantification of phosphorylated TDP-43 (pS409/410) in CryM+ neurons in the motor cortex of WT/TDP-43Tg/Tg mice treated with NC ASO/Syf2 ASO. Gray circles= average number of pTDP-43+ puncta/μm2 across 10–15 neurons from three sections in one mouse. One-way ANOVA. Mean ± SEM White solid/dashed lines mark the cell body/nucleus.
(K, L) Immunostaining/quantification of Synaptophysin+ bungarotoxin (BTX)+ neuromuscular junction (NMJ) end plates of WT/TDP-43Tg/Tg mice treated with NC ASO/Syf2 ASO. Gray circles= percentage of innervated end plates across three sections in one mouse. One-way ANOVA. Mean ± SEM
Discussion
Although there is a perception that the complexity of ALS etiology is a critical challenge facing therapeutic development, there is limited experimental evidence supporting this notion. Our data show that even at the level of motor neuron survival, which is only one of many factors contributing to ALS pathogenesis, drug targets show highly variable efficacy across ALS patient lines. In fact, most compounds that robustly improved C9ORF72 ALS/FTD iMN survival were not efficacious across sporadic ALS lines. This underscores the need to identify broadly-acting targets, which our data suggest are quite rare.
A previous study showed that androgen signaling protects against neurodegeneration in an SOD1 ALS mouse model53. In addition, a study of finger length in ALS patients and controls suggested that higher androgen signaling early in life causes subsequent motor neuron desensitization to androgen signaling and increased vulnerability to ALS53,54. However, the safety of chronic androgen treatment is unclear and androgen-induced side effects may be undesirable20. Moreover, mechanistic investigation of X-linked spinal and bulbar muscular atrophy (SBMA) has suggested that in the presence of gain-of-function disease processes caused by the androgen receptor polyglutamine repeat expansion, loss of normal androgen receptor function exacerbates motor neuron degeneration55.
Leveraging the Connectivity Map led to the identification of SYF2 suppression as an alternate target. Our mechanistic analysis showed that SYF2 suppression slowed nuclear export and cytoplasmic oligomerization of TDP-43 and rescued TDP-43 mislocalization in ALS iMNs (Fig. 7A). The amelioration of TDP-43 pathology potentially explains the broad efficacy of SYF2 suppression across ALS lines. One possible mechanism that could explain our findings is that SYF2 suppression increases the concentration of TDP-43 RNA substrates in the nucleus or their ability to be bound by TDP-43, which slows diffusion of TDP-43 out of the nucleus and reduces its contribution to cytoplasmic inclusions. While SYF2 suppression does not appear to increase the concentration of total RNA in the nucleus, it is possible that there is an increase in specific RNA substrates of TDP-43 that help retain TDP-43 in the nucleus. In addition, SYF2 suppression may also reduce TDP-43 pathology by other mechanisms such as increasing nuclear import of TDP-43 or modulating TDP-43 condensate dynamics.
Figure 7. Summary of the potential therapeutic mechanism of SYF2-suppression.
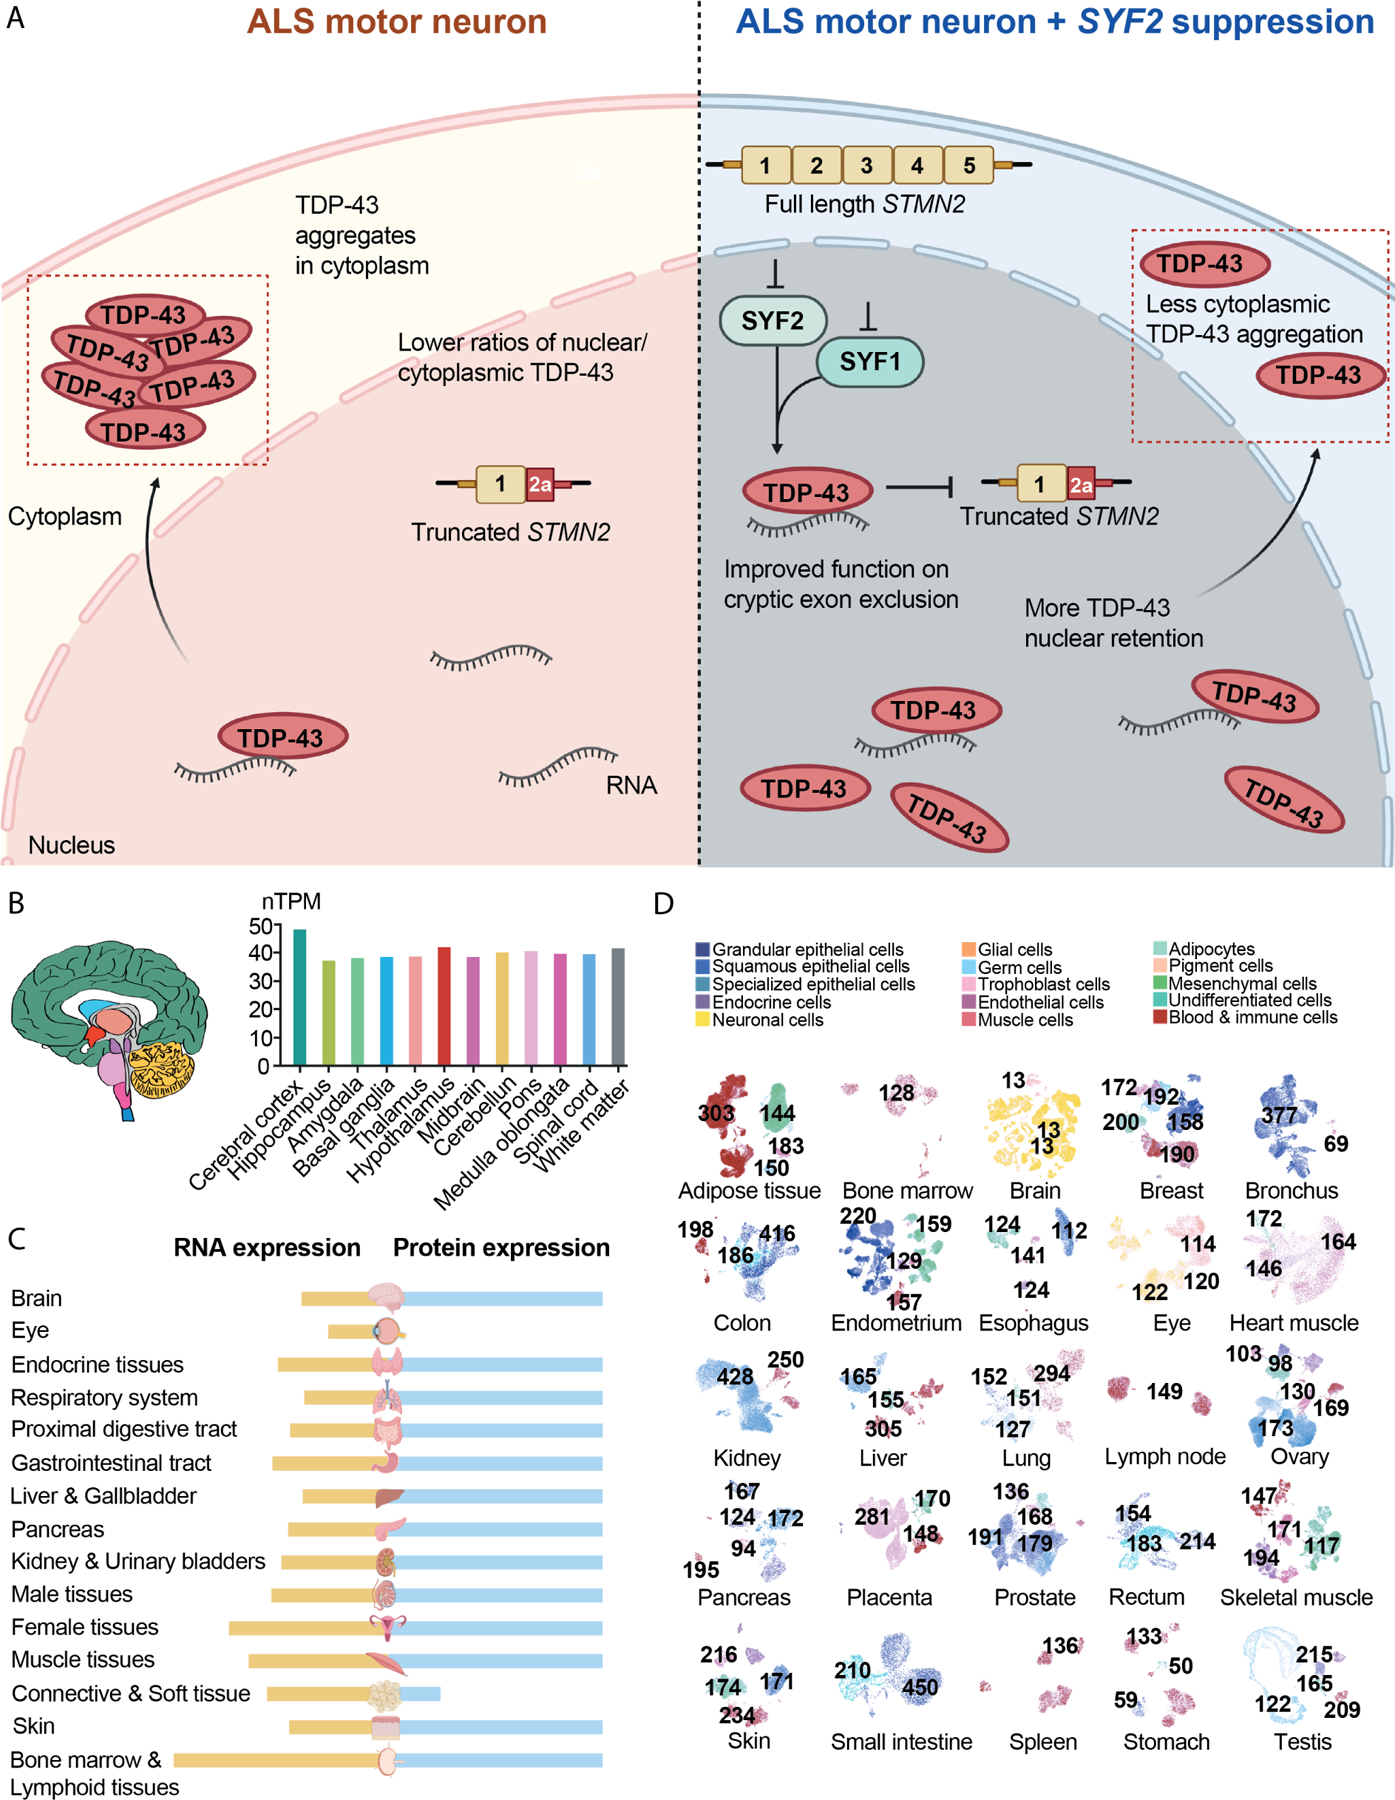
(A) SYF2 suppression slows nuclear export and cytoplasmic oligomerization of TDP-43 and increases the ability of TDP-43 to exclude cryptic exon incorporation into STMN2 transcripts.
(B) SYF2 expression in regions of the human brain.
(C) SYF2 RNA and protein expression levels in human tissues.
(D) Overview of all tissues where single cell type expression of SYF2 has been analyzed. The nTPM value for the cluster within a cell type that has the highest SYF2 level was shown.
Our findings merit further investigation into the therapeutic potential of perturbing SYF2 or other NineTeen Complex members. With regard to safety, our experiments suggest that partial reduction of SYF2 expression is sufficient for efficacy. Although mRNA and protein databases indicate that SYF2 is expressed broadly throughout the central nervous system and different cell types in peripheral tissues, mice with one loss-of-function copy of Syf2 are healthy and humans carrying a loss-of-function SYF2 allele are not known to be affected by pediatric or adult-onset diseases (Fig. 7B-D)56,57. Our ability to observe the reduction of Syf2 mRNA in the cerebrospinal fluid after ASO treatment suggests this might be a viable biomarker for measuring target engagement in the clinic. However, several important questions remain. For example, it will be important to more thoroughly examine how SYF2 suppression affects RNA spliceoforms in neurons and which, if any, aspects of this are critical for efficacy. Although we did not observe large changes in splicing kinetics by qRT-PCR analysis (data not shown), perhaps more sensitive assays or broader analyses are required. Any further mechanistic insights will likely facilitate the evaluation of safety risks and development of clinical biomarkers. Nevertheless, our current findings identify SYF2 and the NineTeen Complex as important modulators of ALS pathology in patient-derived neurons and mice.
Limitations of study
One limitation of our study is that the machine learning tool for quantifying iMN survival in our primary screen may have missed some neuroprotective compounds due to suboptimal imaging or unevenly distributed iMNs in certain wells. Thus, some of the small molecules we screened could potentially be neuroprotective in ALS iMNs even though they did not register as hits in our screen. A second limitation is that other genetic targets predicted by the clue.io analysis may also mitigate neurodegeneration. These targets should be tested in future studies. Finally, while we did not observe deleterious effects of suppressing SYF2 in control iMNs or wild-type mice, it will be important to determine the therapeutic index of this approach in future studies.
STAR METHODS
RESOURCE AVAILABILITY
Lead contact
Further information and requests for resources and reagents should be directed to and will be fulfilled by the lead contact, Justin Ichida (ichida@usc.edu).
Materials availability
Human iPSC lines used in this study are available from the Ichida lab at the University of Southern California (https://ichidalab.usc.edu/).
Data and code availability
Whole exome sequencing data of sporadic ALS patients used in cohort 1 of the study can be found in Sequence Read Archive (SRA) with accession numbers PRJNA552114 and PRJNA903195. Please note that whole genome sequencing data, instead of whole exome sequencing data, were presented for some of the subjects in PRJNA552114. This is due to the involvement of these subjects in other studies that requires whole genome sequencing data and those studies are not related to the current manuscript. For sporadic ALS patients in cohort 2, whole genome sequencing data and results of rare variant analysis are available from their corresponding sources websites (STAR methods). The bulk RNA-sequencing and splicing analysis data generated as part of this study are available at the Gene Expression Omnibus. Accession numbers are listed in the key resources table and the output of the analyses are available upon request.
Original code was not used in this study.
Any additional information required to reanalyze the data reported in this paper is available from the Lead Contact upon request.
Key resources table
| REAGENT or RESOURCE | SOURCE | IDENTIFIER |
|---|---|---|
| Antibodies | ||
| Anti-histone H2A.X (rabbit IgG, 1:1000) | Abcam | Cat# ab5392 |
| Bungarotoxin (BTX, 1:750) (Alexa594-conjugated) | Invitrogen | Cat# B13423 |
| GFAP (chicken IgY, 1:1000) | Aves Labs Inc | GFAP |
| GR repeat (rabbit IgG, 1:50) | Proteintech | Cat# 23978–1-AP |
| Hb9 (mouse IgG1 kappa light chain, 1:10) | DSHB | Cat# 81.5C10 |
| Iba1 (rabbit IgG, 1:100) | GeneTex | Cat# GT101495 |
| Islet 1 (rabbit IgG, 2 μg/ml) | Abcam | Cat# ab20670 |
| MAP2 (chicken IgY, 1:2000) | Abcam | Cat# ab5392 |
| Mu Crystallin (rabbit IgG, 1: 200) (CoraLite®594-conjugated) | Proteintech | Cat# CL594–12495 |
| Phospho TDP43(Ser409/410) (mouse IgG2a,1:100) | ProteinTech | Cat# 22309–1-AP |
| PR repeat (rabbit IgG, 1:50) | Proteintech | Cat# 23979–1-AP |
| STMN2 (rabbit IgG, 1:200) | Novus | Cat# NBP1–49461 |
| SYF2 (rabbit IgG, 1:80) for iMN staining and western blots | MilliporeSigma | Cat# HPA070710 |
| SYF2 (mouse IgG, 1:150) for post-mortem tissue staining | Abcam | Cat# ab236417 |
| Synaptophysin (rabbit IgG, 1:100) | Synaptic systems | Cat# 101002 |
| TDP43 (rabbit IgG, 1:200) | Proteintech | Cat# 10782–2-AP |
| Tuj1 (mouse IgG, 1:1000) | Biolegend | Cat# 801202 |
| DAPI | Thermo Fisher Scientific | Cat# 62248 |
| Donkey Anti-Chicken IgY (IgG) (H+L) Alexa Fluor® 647 | Jackson ImmunoResearch | Cat# 703–605-155 |
| Donkey anti-Mouse, IgG (H+L) Highly Cross-Adsorbed, Alexa Fluor® 488 | Invitrogen | Cat# A21202 |
| Donkey anti-Mouse, IgG (H+L) Highly Cross-Adsorbed, Alexa Fluor® 555 | Invitrogen | Cat# A31570 |
| Donkey anti-Mouse, IgG (H+L) Highly Cross-Adsorbed, Alexa Fluor® 647 | Invitrogen | Cat# A32787 |
| Donkey anti-Rabbit, IgG (H+L) Highly Cross-Adsorbed, Alexa Fluor® 488 | Invitrogen | Cat# A-21206 |
| IRDye® 680RD Donkey anti-Rabbit IgG Secondary Antibody | LI-COR Biosciences | Cat# 926–68073 |
| IRDye® 800CW Donkey anti-Mouse IgG Secondary Antibody | LI-COR Biosciences | Cat# 926–32212 |
| NeuroTrace™ 500/525 Green Fluorescent Nissl Stain (1:50) | Thermo Fisher Scientific | Cat# N21480 |
| Biological samples | ||
| CTRL (1) | Johns Hopkins ALS Postmortem Resource Core | JHU124 |
| CTRL (2) | Johns Hopkins ALS Postmortem Resource Core | JHU129 |
| CTRL (3) | BioChain Institute Inc. | T2234234 |
| sALS (1) | Johns Hopkins ALS Postmortem Resource Core | JHU121 |
| sALS (2) | Johns Hopkins ALS Postmortem Resource Core | JHU122 |
| sALS (3) | Johns Hopkins ALS Postmortem Resource Core | JHU126 |
| sALS (4) | Johns Hopkins ALS Postmortem Resource Core | JHU127 |
| sALS (5) | Johns Hopkins ALS Postmortem Resource Core | JHU128 |
| Chemicals, peptides, and recombinant proteins | ||
| DMEM | Gibco | Cat# 11995–065 |
| Opti-MEM | Gibco | Cat# 31985–070 |
| FBS | GenClone | Cat# 25–514 |
| Trypsin | GenClone | Cat# 25–510 |
| Polybrene (Hexadimethrine bromide) | Millipore Sigma | Cat# H9268–5G |
| DMEM/F12 | Corning | Cat# 10–090-CV |
| Laminin | Invitrogen | Cat#23017015 |
| Glutamax | Gibco | Cat# 35050–061 |
| N2 supplement | Gibco | Cat# 17502048 |
| B27 supplement | Gibco | Cat# 17504044 |
| Non-essential amino acids (NEAA) | Gibco | Cat# 11140050 |
| Human FGF-beta | Peprotech | Cat# 100–18B |
| Repsox | Selleckchem | Cat# S7223 |
| human CNTF | R&D | Cat# 257-NT |
| human BDNF | R&D | Cat# 248BDB |
| human GDNF | R&D | Cat# 212-GD |
| Alt-R® S.p. HiFi Cas9 Nuclease V3, (100 μg) | IDT | Cat# 1081060 |
| Matrigel | Corning | Cat#3 54277 |
| mTeSR | StemCell | Cat# 85851 |
| Accutase | Innovative Cell Technologies | Cat# AT4104 |
| Y-27632 2HCl (ROCK inhibitor) | Selleckchem | Cat# S1049 |
| Lenti-X concentrator | TaKaRa | Cat# 631232 |
| Polybrene (Hexadimethrine bromide) | Millipore Sigma | Cat# H9268–5G |
| Neurobasal-A | Life Technologies | Cat# 10888–022 |
| Apilimod | achemblock | Cat# O33822 |
| SB431542 | Cayman Chemical | Cat# 13031 |
| CHIR99021 | Cayman Chemical | Cat# 13122 |
| Retinoic Acid | Millipore Sigma | Cat# R2625 |
| DMH1 | Selleckchem | Cat# S7146 |
| Purmorphamine | Cayman Chemical | Cat# 10009634 |
| T-PER buffer | Thermofisher | Cat# 78510 |
| Donor Equine Serum | HyClone | Cat# 16777–030 |
| MEM media | Life Technologies | Cat# 10370088 |
| Penicillin-streptomycin 50X | Corning | Cat# 30–001-CI |
| Compound E | Cayman Chemicals | Cat# 15579 |
| Digitonin | Cayman Chemicals | Cat# 14952 |
| 5-Ethynyl uridine | Millipore Sigma | Cat# 909475 |
| Blasticidin S HCl | ThermoFisher | Cat# A1113903 |
| Lipofectamine™ Stem Transfection Reagent | Thermo | Cat# STEM00001 |
| Doxycycline | Clontech | Cat# 631311 |
| BrdU | Millipore Sigma | Cat# B9285 |
| Puromycin | Millipore Sigma | Cat# SBR00017 |
| Spectrum Collection | Microsource Discovery Systems | The Spectrum collection |
| Doramectin | Microsource Spectrum | Cat# 01505902 |
| Avermectin A1a | Microsource Spectrum | Cat# 01502347 |
| Abamectin (avermectin B1a) | Cayman Chemical | Cat# 19201 |
| Moxidectin | Cayman Chemical | Cat# 17165 |
| Selamectin | Cayman Chemical | Cat# 21529 |
| Eprinomectin | Millipore Sigma | Cat# 32526 |
| Ivermectin | Selleckchem | Cat# S1351 |
| Cloxyquin (5 chloro-8-quinolinol) 95% | Millipore Sigma | Cat# C47000 |
| Dicloxacillin sodium | Millipore Sigma | Cat# D9016 |
| Ibuprofen | Millipore Sigma | Cat# I4883 |
| Acetylcholine chloride | Tocris Bioscience | Cat# 2809 |
| Salsolidine | abCam | Cat# ab143546 |
| Alfuzosin hydrochloride | Cayman Chemicals | Cat# 13648 |
| Canrenone | Cayman Chemicals | Cat# 21307 |
| Torsemide | Selleckchem | Cat# S1698 |
| Phenazopyridine hydrochloride | Millipore Sigma | Cat# 34076 |
| Phenelzine sulfate | Millipore Sigma | Cat# P6777 |
| Levonorgestrel | Cayman Chemicals | Cat# 10006318 |
| Dexibuprofen | Cayman Chemicals | Cat# 16793 |
| Amlexanox | Cayman Chemicals | Cat# 14181 |
| Deflazacort | Cayman Chemicals | Cat# 20386 |
| Levetiracetam | Tocris Bioscience | Cat# 2839 |
| Alpha tocopherol | Millipore Sigma | Cat# 258024 |
| Alpha tocopheryl acetate | Cayman Chemicals | Cat# 10007705 |
| Capecitabine | Cayman Chemicals | Cat# 10487 |
| Anastrozole | Millipore Sigma | Cat# A2736 |
| Fulvestrant | Cayman Chemicals | Cat# 10011269 |
| Lomustine | Millipore Sigma | Cat# L5918 |
| Pemetrexed | Cayman Chemicals | Cat# 14269 |
| Acenocoumarol | Cayman Chemicals | Cat# 10010569 |
| Clinafloxacin Hydrochloride | Cayman Chemicals | Cat# 16923 |
| CoEnzyme Q10 (Ubidecarenone) | Selleckchem | Cat# S2398 |
| Pirenzepine hydrochloride | Tocris Bioscience | Cat# 1071 |
| Ketoprofen | Cayman Chemicals | Cat# 10006661 |
| Cefsulodin | Cayman Chemicals | Cat# 16127 |
| Cefoperazone | Cayman Chemicals | Cat# 16113 |
| Cycloheximide | Cayman Chemicals | Cat# 14126 |
| Menadione | Cayman Chemicals | Cat# 15950 |
| β-carotene | Cayman Chemicals | Cat# 16837 |
| Pyrazinamide | Cayman Chemicals | Cat# 23416 |
| Salicyclic Acid | Selleckchem | Cat# S4539 |
| Sulfabenzamide | Selleckchem | Cat# S4576 |
| Sulfacetamide | Cayman Chemicals | Cat# 20377 |
| Tetracycline hydrochloride | Cayman Chemicals | Cat# 14328 |
| Thioguanine | Cayman Chemicals | Cat# 15774 |
| Timolol maleate | Selleckchem | Cat# S4123 |
| Tolmetin sodium | Cayman Chemicals | Cat# 18195 |
| Ursodiol | Selleckchem | Cat# S1643 |
| Azlocillin sodium | Cayman Chemicals | Cat# 18424 |
| Cefaclor | Santa Cruz Biotechnology | Cat# sc-205242 |
| Vidarabine | Cayman Chemicals | Cat# 18149 |
| Arecoline | Cayman Chemicals | Cat# 13662 |
| Mebeverine hydrochloride | Santa Cruz Biotechnology | Cat# sc-235579 |
| Paromomycin sulfate | Cayman Chemicals | Cat# 23634 |
| Cytisine | Selleckchem | Cat# S2287 |
| Ftaxilide | Microsource Spectrum | Cat# 01504523 |
| Bambuterol hydrochloride | Selleckchem | Cat# S4277 |
| Bucladesine | Selleckchem | Cat# S7858 |
| Hexamethonium bromide | Selleckchem | Cat# S4069 |
| Niacin | Selleckchem | Cat# S1744 |
| Nifedipine | Cayman Chemicals | Cat# 11106 |
| Norethynodrel | Microsource Spectrum | Cat# 01500435 |
| Norgestrel | Cayman Chemicals | Cat# 10006319 |
| Noscapine hydrochloride | Cayman Chemicals | Cat# 17255 |
| Phenacemide | Microsource Spectrum | Cat# 01500472 |
| Pheniramine maleate | Selleckchem | Cat# S4045 |
| Phenylbutazone | Cayman Chemicals | Cat# 70400 |
| Levosimendan | Cayman Chemicals | Cat# 16128 |
| Nortriptyline hydrochloride | Cayman Chemicals | Cat# 15904 |
| Oxidopamine hydrochloride | Microsource Spectrum | Cat# 01500450 |
| Tibolone | Cayman Chemicals | Cat# 10006321 |
| Exemestane | Cayman Chemicals | Cat# 15008 |
| Metformin | Selleckchem | Cat# S1950 |
| Ganciclovir | Cayman Chemicals | Cat# 13853 |
| Letrozole | Cayman Chemicals | Cat# 11568 |
| Dihydrotestosterone | Cayman Chemicals | Cat# 15874 |
| Riluzole | Millipore Sigma | Cat# R116 |
| Edaravone | Selleckchem | Cat# S1326 |
| Fluphenazine | Cayman Chemicals | Cat# 23555 |
| Critical commercial assays | ||
| Click-iT RNA Alexa Fluor 594 imaging kit | Thermo Fisher Scientific | Cat# C10330 |
| RNeasy 96 kit | Qiagen | Cat# 74181 |
| RNeasy plus mini kit | Qiagen | Cat# 74136 |
| Pierce™ BCA Protein assay kit | Thermo Fisher Scientific | Cat# 23227 |
| Deposited data | ||
| Sequence Read Archive (SRA) (Whole exome sequencing of sALS patients) | https://www.ncbi.nlm.nih.gov/sra | PRJNA552114 |
| Sequence Read Archive (SRA) (Whole exome sequencing of sALS patients) | https://www.ncbi.nlm.nih.gov/sra | PRJNA903195 |
| Gene Expression Omnibus (Bulk RNA-seq and splicing analysis) | https://www.ncbi.nlm.nih.gov/geo/ | GSE218079 |
| Experimental models: Cell lines | ||
| CTRL-1 | NINDS Biorepository | ND03231 |
| CTRL-2 | NINDS Biorepository | ND03719 |
| CTRL-3 | NINDS Biorepository | ND05280 |
| CTRL-4 | NINDS Biorepository | ND00184 |
| CTRL-5 | NINDS Biorepository | ND41865 |
| CTRL-6 | Cedars Sinai Biomanufacturing Center | CS5MRLiCTR |
| CTRL-7 | Cedars Sinai Biomanufacturing Center | CS2PFYiCTR |
| CTRL-8 | Cedars Sinai Biomanufacturing Center | CS2BVGiCTR |
| CTRL-9 | Cedars Sinai Biomanufacturing Center | CS2GW3iCTR |
| C9-ALS/FTD-1 | NINDS Biorepository | ND06769 |
| C9-ALS/FTD-2 | NINDS Biorepository | ND10689 |
| C9-ALS/FTD-3 | NINDS Biorepository | ND12099 |
| C9-ALS/FTD-4 | Cedars Sinai Biomanufacturing Center | CS29iALS |
| C9-ALS/FTD-5 | Cedars Sinai Biomanufacturing Center | CS2YNLiALS |
| C9-ALS/FTD-6 | NINDS Biorepository | ND08957 |
| C9-ALS/FTD-7 | NINDS Biorepository | ND12100 |
| C9-ALS/FTD-8 | Cedars Sinai Biomanufacturing Center | CS2DDGiALS |
| C9-ALS/FTD-9 | NINDS Biorepository | ND50000 |
| C9-ISO-1 | Ichida Lab | 6769 iso c1 |
| C9-ISO-4 | Cedars Sinai Biomanufacturing Center | 29iALS-ISO |
| sALS-1 | NINDS Biorepository | ND08705 |
| sALS-2 | NINDS Biorepository | ND09292 |
| sALS-3 | NINDS Biorepository | ND09329 |
| sALS-4 | NINDS Biorepository | ND10739 |
| sALS-5 | NINDS Biorepository | ND13454 |
| sALS-6 | NINDS Biorepository | ND14185 |
| sALS-7 | Loma Linda University | #3 |
| sALS-8 | Loma Linda University | #4 |
| sALS-9 | NINDS Biorepository | ND09711 |
| sALS-10 | NINDS Biorepository | ND11813 |
| sALS-11 | NINDS Biorepository | ND50073 |
| sALS-12 | Cedars Sinai Biomanufacturing Center | CS0WD8iALS |
| sALS-13 | Cedars Sinai Biomanufacturing Center | CS0KHAiALS |
| sALS-14 | Ichida Lab | sALS-14 |
| sALS-15 | Cedars Sinai Biomanufacturing Center | CS0GR5iALS |
| sALS-16 | Acurastem Inc | ALS93E |
| sALS-17 | Cedars Sinai Biomanufacturing Center | CS3XLKiALS |
| sALS-18 | Cedars Sinai Biomanufacturing Center | CS2NDDiALS |
| sALS-19 | Cedars Sinai Biomanufacturing Center | CS2WW0iALS |
| sALS-20 | Cedars Sinai Biomanufacturing Center | CS1RUGiALS |
| sALS-21 | Cedars Sinai Biomanufacturing Center | CS2CLNiALS |
| sALS-22 | NINDS Biorepository | ND50082 |
| sALS-23 | Cedars Sinai Biomanufacturing Center | CS2VU4iALS |
| sALS-24 | Cedars Sinai Biomanufacturing Center | CS5HF7iALS |
| sALS-25 | Cedars Sinai Biomanufacturing Center | CS0KBHiALS |
| sALS-26 | Cedars Sinai Biomanufacturing Center | CS3AH9iALS |
| sALS-27 | Cedars Sinai Biomanufacturing Center | CS0JCLiALS |
| TARDBP-ALS/FTD-1 | NINDS Biorepository | ND50007 |
| TARDBP-ALS/FTD-2 | Grupo de Neurociencias de Antioquia - Universidad de Antioquia | 12240 |
| FUS-ALS-1 | NINDS Biorepository | ND35663 |
| FUS-ALS-2 | NINDS Biorepository | ND39034 |
| SOD1-ALS-1 | NINDS Biorepository | ND35658 |
| SOD1-ALS-2 | NINDS Biorepository | ND35659 |
| SOD1-ALS-3 | Kiskinis Lab | 39B |
| CMT2A-1 | New York Stem Cell Foundation | NYCSF-AG0017–01-MR |
| MAPT-1 | Tau consortium | ND32951A.15ᐃ2B09 |
| Experimental models: Organisms/strains | ||
| Mice: Tg(Thy1-TARDBP)4Singh | The Jackson Laboratory | Strain# 012836 |
| Mice: C57BL/6J mice | The Jackson Laboratory | Strain# 000664 |
| Mice: ICR/Ha J mice | The Jackson Laboratory | Strain# 009122 |
| Oligonucleotides | ||
| sgRNA-1 targeting upstream of repeat expansion | This paper | GUAACCUACGGUGUCCCGCU |
| sgRNA-2b targeting downstream of repeat expansion | This paper | ACCCCAAACAGCCACCCGCC |
| Primer 1 for repeat primed PCR | This paper | FAM-tgtaaaacgacggccagtCAAGGAGGGAAACAACCGCAGCC |
| Primer 2 for repeat primed PCR | This paper | caggaaacagctatgaccGGGCCCGCCCCGACCACGCCCCGGCCCCGGCCCCGG |
| Primer 3 for repeat primed PCR | This paper | caggaaacagctatgacc |
| CLYBL crRNA | Synthego | ATGTTGGAAGGATGAGGAAA |
| qPCR primer for HPRT, Forward | This paper | GACTTTGCTTTCCTTGGTCAG |
| qPCR primer for HPRT, Reverse | This paper | GGCTTATATCCAACACTTCGTGGG |
| qPCR primer for SYF1, Forward | This paper | CATTTCGAGAAGGCTCGGGA |
| qPCR primer for SYF1, Reverse | This paper | CAGCTGTCCGTTGTCCTCAT |
| Software and algorithms | ||
| Image J | https://imagej.nih.gov/ij/ | N/A |
| Prism | https://www.graphpad.com/scientific-software/prism/ | N/A |
| Next-generation clustered heat map builder and viewer | https://bioinformatics.mdanderson.org/public-software/ngchm/ | N/A |
| R studio | https://www.rstudio.com/ | N/A |
| Biorender | https://biorender.com/ | N/A |
EXPERIMENTAL MODEL AND SUBJECT DETAILS
Cell lines
Male and female human iPSCs from a wide range of ages were used in the study as described in Table S1. iPSCs were seeded on wells coated with Corning® Matrigel® Matrix (growth factor reduced). Cells were cultured in mTESR1 medium (Stem Cell Technologies) with daily media changes and were maintained at 37°C with 5% CO2. At 70–80% confluency, iPSCs were passed using Accutase (Innovative Cell Technologies) and plated in media containing mTESR and Rock inhibitor. The following day media was replenished with mTESR alone.
Primary cell culture
Primary cortical glia cells were isolated from P2-P3 ICR pups. Brains were dissected using a stereomicroscope and cortices were obtained with removal of the meninges. Cortices were triturated 12 times using a P-1000 pipette tip in 0.25% trypsin and were incubated at room temperature for 4 minutes. Glia media (MEM with Earle’s salts, 0.6% glucose, 10% donor equine serum, and 1% penicillin/streptomycin) was added to stop the reaction and minced tissue was added to a tube containing glia media. The tissue was triturated 10 times and was centrifuged at 1000 RPM for 6 minutes. Media was removed and the cortex tissue was vigorously resuspended and passed through a Falcon® 70 μM cell strainer to obtain a single cell suspension. Dissociated cells were added to Poly-d-lysine coated dishes (Avantor-VWR) and maintained at 37°C with 5% CO2.. The media was changed 4–5 days after the isolation to avoid disturbing the formation of the monolayer. After this period, the media was replenished every 3–4 days.
Mouse models
C57BL/6J mice (stock no: 000664), ICR/HaJ mice (stock no: 009122), and B6;SJL-Tg(Thy1-TARDBP)4Singh/J (stock no: 012836) were purchased from the Jackson Laboratory. The mouse Thy1 promoter drives the expression of the human TDP-43 gene in neurons. Both male and female mice were used. The animals were housed in cages under a temperature and humidity-controlled environment and subjected to a standard 12 h light/dark cycle with food and water available ad libitum. All procedures were approved by the Institutional Animal Care and Use Committee of the University of Southern California in accordance with guidelines of the National Institutes of Health.
METHOD DETAILS
iPSC reprogramming
For cohort 1, human lymphocytes from healthy subjects and ALS patients were obtained from the NINDS Biorepository at the Coriell Institute for Medical Research or the Loma Linda University Neurology Clinic and reprogrammed into iPSCs using episomal plasmids as previously described 5,6,58. Briefly, mammalian vectors expressing Oct4, Sox2, Klf4, L-Myc, Lin28, and a p53 shRNA were introduced into the lymphocytes using the Adult Dermal Fibroblast Nucleofector Kit and Nucleofector 2b Device (Lonza) according to the manufacturer’s protocol. The cells were cultured on a MEF feeder layer until the appearance of iPSCs after 26–30 days. The colonies were selected and expanded on Matrigel in mTESR1 medium for further evaluation. For cohort 2, iPSC lines were obtained from various sources (Table S1).
Molecular cloning and viral production
The complementary DNA (cDNA) for each iMN factor (Ngn2, Lhx3, Isl1, NeuroD1, Ascl1, Brn2 and Myt1l) was purchased from Addgene and cloned into the pMXs retroviral expression vector using Gateway cloning technology (Invitrogen). The cDNA for making NIL-iMNs (NGN2, ISL1 and LHX3) were purchased from Addgene and cloned into a doxycycline inducible puromycin resistance carrying lentiviral vector (pLV-TetO-hNGN2-puro; Addgene ID: 79049) using Gibson Assembly® Master Mix (NEB). The Hb9::RFP lentiviral vector and rtTA3 lentiviral vector were also purchased from Addgene (ID: 37081; 61472). Viruses were produced as follows. HEK293T cells were transfected in a 10-cm dish at 80–90% confluence with viral vectors containing each iMN factor and viral packaging plasmids (PIK-MLV-gp and pHDM for retrovirus, pPAX2 and VSVG for lentivirus) using polyethylenimine (PEI)(Sigma-Aldrich). The medium was changed 24 hours after transfection. Viruses were harvested at 48 hours and 72 hours after transfection. Viral supernatants were filtered with 0.45-μm filters, incubated with Lenti-X concentrator (Clontech) for 24 hours at 4°C, and centrifuged at 1,500 g at 4°C for 45 minutes. Pellets were resuspended in DMEM plus 10% FBS (200 μL per 10-cm dish of HEK293T) and stored at −80°C.
Conversion of iPSCs into induced motor neurons (iMNs)
iPSCs were differentiated into fibroblast-like cells to enable efficient retroviral transduction as described 5. Briefly, iPSCs were plated in several T-75 flasks coated with Matrigel and the media was changed to fibroblast media (DMEM + 10% FBS) at 30%-50% confluency. The media was changed once a week until the appearance of fibroblast-like cells. The formation is cell line dependent and ranges from 30–50 days. Reprogramming of fibroblast-like cells was performed in 96-well plates (5 x 10³ cells/ well) or 13-mm plastic coverslip (3 x 10⁴ cells/ coverslip) that had been pre-coated with 0.1% gelatin (1 hour, room temperature) and laminin (4°C, overnight). Seven iMN factors were added in 150 μL of fibroblast medium per 96-well or 500 μL per coverslip with 8 μg/ml polybrene. Cultures were transduced with Hb9::RFP lentivirus at 24 hours post-transduction with seven iMN factors. On day 4, primary mouse cortical glial cells from P2-P3 ICR pups were added to the transduced cultures in glia medium containing MEM (Life Technologies), 10% donor equine serum (HyClone), 20% glucose (Sigma-Aldrich), and 1% penicillin/streptomycin. On day 5, cultures were switched to N3 medium containing DMEM/F12 (Life Technologies), 2% FBS, 1% penicillin/streptomycin, glutamax, N2 and B27 supplements (Life Technologies), 7.5 μM RepSox (Selleck), and 10 ng/ml each of FGF-2, GDNF, BDNF, and CNTF (R&D). The cultures were maintained in N3 with neurotrophic factors (RepSox, FGF, GDNF, BDNF, and CNTF) and changed every other day.
Induced motor neuron survival assay
Hb9::RFP+ iMNs form between day 13–16 after transduction of iMN factors. The iMN survival assay was initiated on day 17. Starting at Day 17, longitudinal tracking of iMNs was performed using Molecular Devices ImageExpress once every other day for 14 days. Tracking of neuronal survival was performed using SVcell 3.0 (DRVision Technologies) or ImageJ. For each neuronal survival assay, iMNs were quantified from three biologically independent iMN conversions per line per condition. Neurons were scored as dead when their soma was no longer detectable by RFP fluorescence. For neurotrophic factor withdrawal conditions, FGF-2, BDNF, GDNF, and CNTF were removed from the culture medium on day 17. For treatment with drugs, cultures were treated with DMSO or 3 μM drug after neurotrophic factor withdrawal (starting at day 17). For ASO treatments, the iMN cultures were pretreated one time with 9 μM ASOs for 48 hours before neurotrophic factor withdrawal on day 17. ASOs were delivered to the cells by gymnotic uptake. ASO gapmers were designed either in-house or by Integrated DNA Technologies and produced by Integrated DNA Technologies (Star Methods and supplemental Table 6). Compound treatments were maintained for the entire survival assay, ASO treatments were performed only once and the medium was changed every three days. Although iMN survival experiments included neurotrophic factor withdrawal in order to exacerbate the survival difference between control and patient iMNS, it was not necessary for the subsequent mechanistic experiments examining TDP-43 pathology, cryptic exon exclusion, neurite outgrowth, and 3D spheroid survival. Neurotrophic factors were included and beneficial effects from SYF2 treatment were still observed.
For hazard ratio plots, the hazard rate of the first condition plotted on the far left was used as the control and its hazard rate was set as 1. The red dotted line represents this hazard rate. The hazard rates of all other conditions were divided by this hazard rate to generate the hazard ratios. For Figure 1, n=100 iMNs from 3 independent conversions/line. Kaplan–Meier survival curves were calculated using the survival data from 100 iMNs/line. Hazard rates (log-rank method) and statistical significance (One-way ANOVA) were calculated for each independent conversion compared to three control lines in aggregate. For Figure 2, n=100/50 iMNs from 3 independent conversions/line for DMSO/norgestrel. Hazard rates (log-rank method) were calculated for each independent conversion compared to the DMSO conditions from the three control lines in aggregate. Statistical significance (One-way ANOVA) was calculated comparing the DMSO-treated condition for each ALS line to the norgestrel-treated condition and the control lines + DMSO in aggregate. Unpaired t-test for DMSO vs. norgestrel for each control line. For Figure 3C, n=100 iMNs from 3 independent conversions/line/condition. Hazard rates (log-rank method) were calculated for each independent conversion compared to the NC ASO conditions from the three control lines in aggregate. Statistical significance (One-way ANOVA) was calculated comparing the NC ASO-treated condition for each ALS line to the SYF2 ASO-1-treated condition and the control lines + NC ASO in aggregate. Unpaired t-test for NC ASO vs. SYF2 ASO-1 for each control line. For Figure 3D, n=100 iMNs from 3 independent conversions/line/condition. Hazard rates (log-rank method) were calculated for each independent conversion compared to the 1 μM NC ASO conditions from the control line. Statistical significance (One-way ANOVA) was calculated comparing the NC ASO condition for each ALS line to the SYF2 ASO-1 condition and control line + NC ASO for each dose. Unpaired t-test for CTRL+NC ASO vs. CTRL+SYF2 ASO-1. For Figure 3E, n=100 iMNs from 4 independent conversions/line/condition. Hazard rates (log-rank method) were calculated for each independent conversion compared to the NC ASO conditions from the nine control lines in aggregate. Statistical significance (One-way ANOVA) was calculated comparing the NC ASO condition for each patient line to the SYF2 ASO-1 condition and control line + NC ASO in aggregate. Unpaired t-test for NC ASO vs. SYF2 ASO-1 for each control line. For Figure 3G, n=100 iMNs from 4 independent conversions/line/condition. Hazard rates (log-rank method) were calculated for each independent conversion compared to the NC ASO conditions from the three control lines in aggregate. Statistical significance (One-way ANOVA) was calculated comparing the NC ASO condition for each patient line to the SYF2 ASO-1 condition and control line + NC ASO in aggregate. Unpaired t-test for NC ASO vs. SYF2 ASO-1 for each control line.
CRISPR/Cas9 genome editing of iPSCs
CRISPR/Cas9-mediated genome editing was performed in C9ORF72 ALS/FTD-1 (C9-ALS/FTD-1) iPSCs as previously described, using Cas9 nuclease 6. Single guide RNAs (sgRNAs) targeting both sides of the C9ORF72 intronic hexanucleotide repeat expansion were designed (STAR Methods). To generate isogenic control iPSCs by removing the repeat expansion, C9-ALS/FTD-1 iPSCs were transfected with human codon-optimized Cas9 (Addgene ID: 31825), the appropriate gRNA constructs by nucleofection (Lonza) according to the manufacturer’s protocol and the homologous recombination donor vector. The surviving colonies were picked on day 7 after transfection and genotyped by PCR amplification and sequencing the targeted genomic site. Colonies showing removal of the repeat expansion were clonally purified on MEF feeders and the resulting colonies were verified by southern blotting. The isogenic control line for C9-ALS/FTD-1 was named C9-ISO-1. Detailed characterization of this line will be published elsewhere. C9-ALS/FTD-4 and its isogenic control line C9-ISO-4 were purchased from Cedars Sinai Biomanufacturing Center (Table S1).
Small molecule screen
The 1926 compounds used in the small molecule screen were obtained largely from the Microsource Spectrum Collection which is composed of approved drugs, bioactive compounds, and natural products. For the primary screen, C9ORF72 ALS/FTD iMNs (derived from a single donor) were treated with DMSO vehicle (0.09% v/v) or drug dissolved in DMSO at 3 μM. The DMSO concentration was well tolerated and not harmful to the iMNs as determined by pilot survival assays. iMN survival was used as the endpoint for the screen and was assessed every two days over a 16-day period using Molecular Devices ImageExpress. Drug treatments occurred every 3 days and were normalized to DMSO vehicle-treated groups on each individual plate. In the primary screen, iMN survival was assessed by a machine learning analytical tool for iMN counting (see below) and selected wells for which this analysis or manual image analysis suggested increased iMN survival over the DMSO control wells were further analyzed by manual longitudinal iMN survival tracking. For the secondary screen, 67 hits were tested on three C9ORF72 ALS/FTD patient lines. 50 compounds that exhibited efficacy on at least two of the three patient lines were next tested on a panel of sporadic ALS patients (n=8 donors) and healthy controls (n=3 donors).
Machine learning analytical tool for iMN counting
A machine learning-enabled analytical tool was applied to detect ALS patient-derived iMNs and track their survival rates over time. This tool was utilized in the primary screen to help identify potential hits which were confirmed by manual longitudinal tracking. Machine learning-enabled classifiers were trained on iMNs based on phenotypic features and used to detect bona fide iMNs. The workflow of the iMN analytical tool consists of two phases: learning and detection. In the learning phase, the cell bodies and neurites of potential iMN objects are first segmented. Overlapping cell body masks and neurite masks are associated to manually label the iMN/non-iMN objects. The cell body and neurite features are calculated for each potential iMN object which are then used to train a random forest-based classifier. In the detection phase, the trained classifier is used to classify the iMN cell body and neurite features in all survival images. Based on the real iMNs classified, the cell counts over time are measured for survival analysis.
Heatmap analysis
To assess induced motor neuron survival, 50 iMNs were sampled for each treatment and were compared to 100 DMSO iMN controls across all iPSC lines. Unsupervised hierarchical clustering was performed on the second logarithm of the hazard ratio for each treatment using the Next-Generation Clustered Heat Map Viewer. Euclidean distances and ward agglomeration were used to determine clusters. Heatmaps were generated using R studio.
Connectivity Map analysis
Clue Touchstone analysis was used to identify genes whose suppression induces gene expression signatures similar to those elicited by treatment with androgenic compounds identified in the small molecule screen (anastrozole, exemestane, levonorgestrel, norgestrel, testosterone) (https://clue.io/touchstone#, heatmap function).
Retinoic acid/purmorphamine protocol for iPSC-motor neuron differentiation for western blot analysis
Directed differentiation of iPSC motor neurons were generated as previously described with slight modifications 59. On day 0, iPSCs were dissociated with Accutase (Life Technologies) into single cell suspension and 300,000 iPSCs were seeded into one well of a six-well plate pre-coated with Matrigel (Corning) in mTeSR medium (Stem Cell Technologies) with 10 μM ROCK inhibitor (Ri, Selleckchem). On day 1, cultures were switched to Neural Differentiation Medium (NDM) consisting of a 1:1 ratio of DMEM/F12 (Genesee Scientific) and Neurobasal medium (Life Technologies), 0.5x N2 (LifeTechnologies), 0.5x B27 (Life Technologies), 0.1 mM ascorbic acid (Sigma), 1x Glutamax (Life Technologies). 3 μM CHIR99021 (Cayman), 2 μM DMH1 (Selleck) and 2 μM SB431542 (Cayman) were also supplemented. The medium was changed every other day. On day 7, cells were dissociated with Accutase and 4–6 million cells were seeded in a 10-cm dish (pre-coated with Matrigel) in NDM supplemented with 1 μM CHIR99021, 2 μM DMH1, 2 μM SB431542, 0.1 μM Retinoic acid (Sigma), 0.5 μM Purmorphamine (Cayman) and 10 μM Ri. Ri was removed on day 9 and the medium was changed every other day. On day 13, cells were dissociated with Accutase and 20 million cells were seeded per well in non-adhesive 6-well plates (Corning) in NDM with 1 μM Retinoic acid, 1 μM Purmorphamine, 0.1 μM Compound E (Cayman), and 5 ng/ml each of BDNF, GDNF and CNTF (R&D Systems). Cells were used for experiments between days 25–35 of differentiation. The medium was changed every other day. For ASO treatments, the cultures were pretreated one time with 9 μM ASOs for 4 days before proceeding to western blot analysis.
Western blotting
iPSC-derived motor neurons were collected in RIPA buffer (Santa Cruz) with a protease inhibitor cocktail (Roche). Mouse brain tissue was homogenized in T-PER buffer supplemented with protease inhibitor using a glass dounce homogenizer followed by passage through a 21-gauge needle 5 times. Samples were centrifuged at 14,000 RPM for 15 minutes at 4°C and supernatants were used for downstream analysis. Protein quantity from cell lysates and brain samples were measured by the BCA assay (Pierce). Samples were run on a 10% SDS gel, and the proteins were transferred onto Immobilon-FL PVDF Membrane (Millipore). The total protein amount for each sample was quantified with Revert™ 700 Total Protein Stain Kits (LI-COR Biosciences). The membrane was blocked with Intercept (TBS) Blocking buffer (LI-COR Biosciences) for 1 hour at room temperature, and incubated with primary antibodies overnight at 4°C. Next day, blots were washed four times with 0.1% TBS-T, and incubated with the appropriate secondary antibodies (LI-COR Biosciences) for 1 hour at room temperature. After three 0.1% TBS-T washes and one TBS wash, blots were visualized with a LI-COR Odyssey CLx imaging system. The following primary antibodies were used: rabbit anti-SYF2 (Millipore Sigma, HPA070710, 1:80) and rabbit anti-STMN2 (Novus, NBP1–49461, 1:200). Sequential staining was performed to distinguish the SYF2 band and the STMN2 band.
Immunocytochemistry
iMN cultures were fixed in 4% paraformaldehyde (PFA) for 20 min at 4°C, permeabilized with 0.1% Triton-X for 10 mins at room temperature, blocked with 10% donkey serum in 1% BSA in PBS for two hours at room temperature, and incubated with primary antibodies at 4°C overnight. Cells were then washed with 0.1% PBS-T for three times and incubated with Alexa Fluor–conjugated secondary antibodies (Life Technologies) for 1 hour at room temperature. iMN cultures were incubated with DAPI (Life Technologies) for 10 minutes at room temperature and then mounted on slides with Vectashield (Vector Labs). Images were acquired on an LSM 800 confocal microscope with oil immersion at 63x (Zeiss). Neuronal area was determined by manual outlining in ImageJ on the basis of the Hb9::RFP signals. The following primary antibodies were used: rabbit anti-GR repeat polyclonal antibody (Proteintech, 23978–1-AP, 1:50), rabbit anti-PR repeat polyclonal antibody (Proteintech, 23979–1-AP, 1:50), rabbit anti-TDP-43 polyclonal antibody (Proteintech, 10782–2-AP, 1:200), mouse anti-Hb9 monoclonal antibody (DHSB, 81.5C10, 1:10), rabbit anti-Islet-1 polyclonal antibody (Abcam, ab20670, 2 μg/ml), chicken anti-GFAP polyclonal antibody (Aves, 1:1000), rabbit anti-histone H2A.X polyclonal antibody (Abcam, ab11175, 1:1000), rabbit anti-STMN2 polyclonal antibody (Novus, NBP1–49461, 1:200), chicken anti-MAP2 polyclonal antibody (Abcam, ab5392, 1:2000) and mouse anti-Tuj1 monoclonal antibody (Biolegend, 801202, 1:1000).
To quantify the poly(GR) and poly(PR) punctae in iMNs, the number of punctae per nuclear area was measured with Image J using the find maxima detection tool with noise tolerance=50. For Figure 1, n=30 iMNs from 2 independent conversions/line from 2 lines for control and patients. To quantify the TDP43 signals, STMN2 signals or H2A.X signals in iMNs, the fluorescence intensity of the TDP43 staining or H2A.X signals in the cell nucleus and cytoplasm were measured using Image J and recorded as the nuclear to cytoplasmic ratio. For Figure 1, n = 60 iMNs for CTRL, n=60 iMNs for C9-ALS/FTD, and n=200 iMNs for sALS from 3 CTRL, 3 C9-ALS/FTD, and 10 sporadic ALS lines (20 iMNs/line). iMNs were quantified from two independent iMN conversions per group. For Figure 4B, n=60 iMNs for CTRL, 60 iMNs for C9-ALS/FTD, and 200 iMNs for sALS per condition from 3 CTRL (CTRL-1, CTRL-2 & CTRL-3), 3 C9-ALS/FTD (C9-ALS/FTD-1, C9-ALS/FTD-2 & C9-ALS/FTD-3), and 10 sporadic ALS lines (sALS-1 to sALS-8, sALS-11 & sALS-22, 20 iMNs/line). iMNs were quantified from two independent iMN conversions per group per line. Statistical significance (Kruskal-Wallis test) was calculated comparing CTRL+NC ASO to NC ASO for each ALS group (C9ORF72 or sporadic) and SYF2 ASO to NC ASO for each ALS group. For Figure 4G, n=60 iMNs for CTRL, 60 iMNs for C9-ALS/FTD, and 200 iMNs for sALS per condition from 3 CTRL (CTRL-1, CTRL-2 & CTRL-3), 3 C9-ALS/FTD (C9-ALS/FTD-1, C9-ALS/FTD-2 & C9-ALS/FTD-3), and 10 sALS lines (sALS-1 to sALS-8, sALS-11 & sALS-22, 20 iMNs/line) (20 iMNs/line). iMNs were quantified from two independent iMN conversions per group per line. Statistical significance (One-way ANOVA) was calculated comparing CTRL+NC ASO to NC ASO for each ALS group (C9ORF72 or sporadic) and SYF2 ASO to NC ASO for each ALS group. For Figure 5E, n=60 iMNs for CTRL and 60 iMNs for sALS per condition from 3 CTRL and 3 sALS lines. Data are normalized to the CTRL + NC ASO condition. iMNs were quantified from two independent iMN conversions per group. Statistical significance (Kruskal-Wallis test) was calculated comparing sALS + NC ASO to the SYF2 ASO-1 condition and to CTRL + NC ASO. Mann-Whitney test for CTRL+NC ASO vs. CTRL+SYF2 ASO-1.
Photo-induction of Cry2-TDP-43-mCherry cytoplasmic aggregation
Lentivirus encoding Cry2-TDP-43-mCherry (obtained from the Chris Donnelly Lab as a gift) was added to NIL-iMNs 17 days after doxycycline started in N3 medium 33. A complete medium change was done the next day. NC ASOs and SYF2 ASOs at 9 μM were added 3 days post-infection by adding them directly to the culture medium. Four days later, a pre-activation image was taken using a Molecular Devices ImageExpress, and iMNs were exposed to an array of LED blue light for 12 hours at 37°C and 5% CO2. Post-activation images were taken immediately after the 12-hour blue light exposure using a Molecular Devices ImageExpress. The number of mCherry+ particles were evaluated using the ImageJ particle analysis function. For Figure 4E, Three wells/line from four different control lines were quantified per ASO condition. n=11261, 9431, 9530 and 10465 punta for NC ASO and SYF2 ASO1–3, respectively. Statistical significance (One-way ANOVA) was calculated by comparing the NC ASO condition vs. SYF2 ASO1–3 conditions.
siRNA Transfection
siRNAs (STAR methods and supplemental table S6) were added with Lipofectamine™ RNAiMAX Transfection Reagent (ThermoFisher Scientific 13778075) on day 16 iMNs in N3 medium. A complete medium change was done on the following day. Cell cultures were harvested for qRT-PCR or western blot analysis 48 hours later.
TDP-43 passive egress assay with digitonin treatment
Dox-NIL iPSC Generation: To generate iPSC lines harboring the dox-inducible expression of NGN2, ISL1, and LHX3 (NIL), cells were transfected with donor cassette and spCas9 RNP with a guide RNA targeting the CLYBL safe-harbor locus (STAR methods). The donor cassette also encoded a constitutively-expressed mApple fluorescent reporter. Transfection was done as described previously 60. In brief, 150,000 iPSCs/well were seeded in matrigel coated 24-well plates in mTesr supplemented with Ri. HiFi Cas9 (IDT, 1081060) and CLYBL targeting sgRNAs (Synthego, STAR methods) were incubated in Opti-MEM (ThermoFisher) for 5 minutes at room temperature. Donor DNA was added to this mix, Opti-MEM and Lipofectamine™ STEM (ThermoFisher, STEM00001) was prepared (2uL Lipofectamine per well) and was then immediately added to the RNP/Donor mix and incubated for 10 minutes at room temperature. The contents (Cas9 RNP, donor DNA, Lipofectamine) were then added dropwise to the cells and incubated overnight. The day following transfection, a complete medium change was done with mTesr supplemented with Ri. 48 hours after transfection, cells were dissociated with accutase and plated sparsely onto matrigel coated 6-well culture dishes. 72 hours after transfection, cells were treated with 20 μM Blasticidin (ThermoFisher, A1113903) and followed by manual picking of selected colonies. mApple was constitutively expressed from the Dox-NIL cassette.
For nuclear egress experiments, day 16 iMNs (16 days after the start of doxycycline treatment) were treated with a scrambled siRNA or one of the two SYF2 siRNAs at 3 nM. After 24 hours, a complete medium change was done with N3 medium. After an additional 48 hours, iMNs were treated with 30 μg/mL of digitonin (Cayman, 14952) in N3 medium and incubated for 1 hour at 37°C and 5% CO2. Cells were then immediately washed three times with PBS and fixed with 4% paraformaldehyde for 15 minutes at room temperature. The cells were then permeabilized with 0.5% PBS-T (Triton X-100) for 15 minutes. After three 5-minute washes with PBS, cells were blocked with 10% FBS in 0.1% PBS-T for 1-hour at room temperature, and immunostained.
For Figure 4C, n=50 iMNs from two independent conversions were quantified for the scrambled siRNA and SYF2 siRNA-1, and n=47 iMNs were quantified for SYF2 siRNA-2. For each group, the average nuclear intensity of TDP-43 at one hour was normalized to the average nuclear intensity of the same group at time zero in order to control for any possible differences in nuclear TDP-43 levels before digitonin treatment. The mApple reporter gene was constitutively expressed from the Dox-inducible NGN2-ISL1-LHX3 cassette knocked into the CLYBL safe-harbor locus for motor neuron generation.
5-EU labeling of iMNs
Two days post the ASO treatment, iMNs cultures were paused with 5mM 5-Ethynyl uridine (5-EU, Sigma, 909475) for 24 hours at 37°C and 5% CO2 and fixed with 4% PFA for 20 min at room temperature. Staining of the labeled RNA was performed using Click-iT RNA Alexa Fluor 594 imaging kit as per manufacturer’s protocol (ThermoFisher, C10330). Immunostaining of MAP2 was performed right after the 5-EU Click reaction in order to identify neurons.
Neurite out-growth assay
Induced motor neurons were generated in 96-well plates as described above. Lentivirus encoding STMN2 or STMN2-GFP were added to the iMN cultures one day prior to the addition of rodent glia. On day 6 of the iMN conversion, scramble siRNAs or siRNAs targeting SYF2 were added to the iMN cultures without STMN/STMN-GFP transduction. A complete medium change was done 24 hours post transfection with siRNAs. Daily live imaging of the whole wells were taken at 4x with Molecular Devices ImageExpress from day 9 to day 12 of the iMN conversion to track neurite out-growth. Images at day 12 were used for neurite length analysis. Manual tracing of neurites was performed with ImageJ. For Figure 5H, n = 30 iMNs with the longest neurites from three independent iMN conversions/line/condition. For the GFP or STMN2-GFP transduced conditions, statistical significance (Unpaired t-test with Bonferroni correction) was calculated comparing the GFP condition for each ALS line to the STMN2-GFP condition. For the scramble siRNA or SYF2 siRNA treated conditions, statistical significance (One-way ANOVA) was calculated comparing the scrambled siRNA treated condition for each C9-ALS/FTD line to the SYF2 siRNA treated condition and the control lines + scrambled siRNA in aggregate, which was set to 1 (red dashed line).
Axotomy assay
Day 11 iMNs were replated onto laminin coated 4-well microfluidic devices (XonaChip® 900 μm barrier, Xona 5670). On day 17, iMNs were transduced with lentiviruses encoding STMN2 or STMN2-GFP. On day 19, a different set of iMNs were transfected with scrambled siRNA or siRNAs targeting SYF2. Axotomy was performed on day 21 with vacuum aspiration per manufacturer’s protocol (Xona 5670). Images of the whole device were taken right before, right after and 4 days after the axotomy assay. Manual tracing of neurites that were removed from the axotomy and re-appeared 4 days after the axotomy was performed with ImageJ. For Figure 5J, n=30 iMNs with the longest neurites after recovery from three independent iMN conversions/line/condition. For the GFP or STMN2-GFP transduced conditions, statistical significance (Unpaired t-test with Bonferroni correction) was calculated comparing the GFP condition for each ALS line to the STMN2-GFP condition. For the scramble siRNA or SYF2 siRNA treated conditions, statistical significance (One-way ANOVA) was calculated comparing the scrambled siRNA treated condition for each ALS line to the SYF2 siRNA treated condition and the control lines + scrambled siRNA in aggregate, which was set to 1 (red dashed line).
Quantitative real time PCR
Total RNA was extracted from iMNs, iPSC-derived motor neurons or mouse brain tissue with RNA Extraction Kit (Qiagen) and reverse transcribed with an Oligo dT primer using a ProtoScript II First Strand Synthesis Kit (NEB). RNA integrity was checked using the NanoDrop 1000 (Thermo). Real-time PCR was performed with iTaq Universal SYBR Green Supermix (Bio-Rad) using primers 61,62 shown in the STAR methods and supplemental table S6. For Figure 5A, n=10 independent cultures/line/condition from 3 CTRL (CTRL-1, CTRL-3 & CTRL-7), 4 C9-ALS/FTD (C9-ALS/FTD-1 to C9-ALS/FTD-3 & C9-ALS/FTD-5) and 3 sALS (sALS-4, sALS-5 & sALS-19) lines. For Figure 5B, n=12 independent iMN cultures/line/condition from 3 CTRL (CTRL-1, CTRL-3 & CTRL-7) lines. For Figure 5C, n=10 independent iMN cultures/line/condition from 4 C9-ALS/FTD (C9-ALS/FTD-1 to C9-ALS/FTD-3 & C9-ALS/FTD-5) lines. For Figure 5D, n=10 independent iMN cultures/line/condition from 3 sALS (sALS-4, sALS-5 & sALS-19) lines.
iMN generation using a polycistronic lentivirus for RNAseq analysis
To generate iMNs without fibroblasts or glia for assessing the transcriptomic changes induced by SYF2 suppression, NGN2, ISL1, LHX3 (NIL)-driven iMNs were made as previously described 60. Briefly, iPSCs were seeded in Matrigel coated 24-well plates at 80–120k cells/well in mTeSR1 supplemented with 10 μM Ri. The next day, cells were infected with a lentivirus encoding NIL, and a lentivirus encoding rtTA3. Induction medium (DMEM/F12, GlutaMAX, NEAA, N2 supplement, 0.2 μM compound E, 10 ng/ml BDNF, 10 ng/ml NT3, 10 ng/ml GDNF and 10 ng/ml CNTF) with 10 μM Ri and 1 μg/ml doxycycline was added to the infected cells to drive the NIL over-expression and the puromycin resistance after a 1:2 replating. Puromycin at 0.5 μg/ml was added to the induction medium two days later for 24 hours to remove non-infected iPSCs. On the next day, converting iMNs were replated in N3 medium with BrdU at 40 μM to eliminate any dividing cells. Doxycycline was maintained in the medium for 7 days. On day 8 after the start of doxycycline treatment, transfection of a scramble siRNA or one of the two SYF2 targeting siRNAs was done at 3nM. Next day, a complete medium change was done with N3 medium. On day 10 after the start of doxycycline treatment, iMNs were harvested in the RLT buffer and total RNA were extracted using RNeasy Plus Kits (QIAGEN, 74034).
Bulk RNA-seq analysis
Total RNA was shipped to Novogene Co., Ltd for poly(A) mRNA enrichment and library preparation. Libraries were sequenced on Illumina NovaSeq 6000. A total of 20 million to 30 million 150-bp, paired-end reads were obtained from the samples. Reads were aligned to Hg38 transcriptome using STAR 63. Aligned reads were then quantified using Partek E/M with Partek® Flow® software, v10.0 (Partek Inc.). Gene counts were normalized using median ratio with offset by one before performing differential expression analysis using DESeq264,65. Three biological replicates (independent conversions) were submitted for RNAseq analysis. One replicate each from SYF2 siRNA-2 treated C9-ALS/FTD iMNs, scrambled siRNA treated C9-ISO iMNs, SYF2 siRNA-2 treated C9-ISO iMNs were considered as outliers from PCA analysis and disregarded from DEG and pathway analysis. Pathway analysis was performed using Ingenuity Pathway Analysis (Qiagen Inc.).
Alternative Splicing Analysis
Aligned reads from the bulk RNAseq were quantified using the ASpli 2.8.0 package in R to assess for splicing events based on the bin-coverage signals. The standard pipeline was applied, and a minimum read length of 100 bp and a maximum intron size of 50,000 bp were defined. Genes with multiple exons were subdivided into non-overlapping sub-genic features which were labeled as indicated in the manuscript. Bins in genes with a minimum average expression of 10 reads across all conditions and a minimum average bin read of 5 in any condition were subjected to differential splicing analysis. The bins’ log-fold-change were normalized to the log-fold-change of the corresponding gene. Bins with a log-fold-change of log2(3) and a corresponding p-value of ≤ 0.05 were considered statistically significant. Finally, bin and junction information were integrated using the default parameters for statistically significant region-based information about splicing signals44.
Immunohistochemistry
Paraffin-embedded post-mortem tissue sections were obtained from Johns Hopkins ALS Postmortem Resource Core and BioChain Institute Inc. (STAR methods). Tissues were deparaffinized with three washes in xylene (Millipore Sigma, XX0060–4), 3 min each, and rehydrated with sequential washes of xylene: ethanol 1:1 for 3 min, ethanol for 3 min twice, 95% ethanol for 3 min, 70% ethanol for 3 min, 50% ethanol for 3 min and water for 10 min. For antigen retrieval, slides were kept in a vertical slide container with Tris-EDTA buffer and incubated in a water bath at 90°C for 15 min. Next, slides were let cool in the Tris-EDTA buffer for 10 min at room temperature and washed 3 times with water. After being washed with PBS twice, slides were permeabilized with 0.4% triton in PBS for 10 min at room temperature. After being washed with PBS three times, slides were blocked with DAKO protein-free serum block (DAKO, X090930–2) for 1 hour at room temperature in the pap-pen outlined tissue areas. Primary antibody staining was done at 4 °C overnight. Next day, slides were washed three times in PBS and incubated with secondary antibodies (1:200) for 1h at room temperature. After three washes in PBS, slides were incubated with DAPI (1:500) for 20 min at room temperature and mounted with glass coverslips for confocal analysis.
For motor cortex tissues, a rabbit polyclonal antibody against Mu Crystallin (CryM, Proteintech, CL594–12495, 1:200) was used to identify motor neurons. For spinal cord tissues, a chicken polyclonal antibody against MAP2 (Abcam, ab5392, 1:500) was used to label neurons. Lower motor neurons were identified with their locations in the ventral horn and their size. A mouse monoclonal antibody against SYF2 (Abcam, ab236417, 1:150) was used to co-stain with CryM and MAP2 using Tris-EDTA antigen retrieval method. Confocal images at 40x (Zeiss) were analyzed with ImageJ. Neurons were outlined manually and the fluorescence levels of SYF2 staining was measured per neuron. Based on availability of tissues, subject CTRL (1), CTRL (2) and sALS (1)-(5) were included for motor cortex study and subject CTRL (1), CTRL (3), sALS (4), sALS (5) were included for spinal cord study (STAR methods).
TDP-43 mouse studies
TDP-43 transgenic mice were purchased from the Jackson Laboratory (stock no: 012836). The mouse Thy1 promoter drives the expression of the human TDP-43 gene in neurons. TDP-43 Tg/Tg homozygous mutant mice were generated by crossing TDP-43 Tg/+ heterozygous mice with TDP-43 Tg/+ heterozygous mice. Mice were genotyped using common primer (5’-TGAAATCCGGGTGGTATTGG-3’), wild type primer (5’-GGTGAGTTTAACCTTCAAGGGCT-3’), and transgene primer (5’-AGCTTGCTAGCGGATCCAGAC-3’). Homozygous mutants were identified by a single band at 500 bp, heterozygotes were identified by bands at 303 bp and 500 bp, and wild types were identified by a single band at 303 bp. Homozygous mutants and their corresponding WT littermate controls were used in the experiments.
For ASO treatments, 50 μg of negative control or Syf2 ASO was administered by intracerebroventricular injection at P1. The ASOs (supplemental table S6) were synthesized by Integrated DNA Technologies and contained chemical modifications designed to bolster their efficacy for inhibition of gene expression. Phosphorothioate bonds were added to the sequence to provide protection from degradation by external nucleases and the modified base 2’-O-methoxy-ethyl (MOE) was also added to facilitate increased nuclease stability and binding affinity of the ASO to the mRNA target of interest. To enhance the purity of the ASOs for the in vivo studies, the ASOs were HPLC purified followed by a sodium/salt exchange. Finally, ethanol precipitation was performed to remove any residual chemical impurities. The sequence of the negative control ASO consisted of: 5’-/52MOErC/*/i2MOErC/ /i2MOErT/ /i2MOErA/ /i2MOErT/A*G*G*A*C*T*A*T*C*C*/i2MOErA/ /i2MOErG/ /i2MOErG/* /i2MOErA/*/32MOErA/-3’. The SYF2 ASO sequence consisted of: 5’-/52MOErT/*/i2MOErC//i2MOErC//i2MOErA/ /i2MOErC/A*A*C*T*T*C*C*T*G*G*/i2MOErT//i2MOErG//i2MOErA/*/i2MOErT/*/32MOErT/-3’.
Briefly, P1 neonatal mice were anesthetized by placing them on a paper towel lined bucket of ice to induce hypothermia. The injection site targeting the lateral ventricles was defined as the distance of 40% between the lambda (anatomical landmark) and the eye. To perform the intracerebroventricular (ICV) injection, a 900 series Hamilton syringe (10 μL) was adapted with the bottom portion of Neuros model 1701 RN syringe. A 33-gauge needle was inserted 2mM deep perpendicular to the skull surface into the left lateral ventricle. Mice received 3 μl of negative control ASO or Syf2 ASO in PBS (a total of 50 μg). Within each litter half of the pups received negative control ASO and the other half received Syf2 ASO. Mice were placed under a heat lamp in a new cage containing soiled bedding from the parental cage and were closely monitored until they had fully recovered.
Gait, kyphosis, and tremor were examined starting at 14 days of age (first signs of abnormal movement) and continued until 20 days of age. Phenotype scoring was assessed according to a composite rubric previously reported 50. All investigators were blinded to the genotype and treatment of each experimental group. The humane euthanasia endpoint for the study occurred when the mouse was no longer able to right itself. Hydrogel, powdered pellets, and high caloric diet gel were placed on the bottom of each cage containing TDP-43 mutant mice.
Cerebrospinal fluid (CSF) Collection
P1 wild type C57BL/6J mice (Jackson laboratory stock number: 000664) were injected by ICV injection with negative control ASO (50 μg) or Syf2 ASO (50 μg). CSF was collected at P4. The neonatal mice were placed on a bucket of ice lined with paper towels and were anesthetized by hypothermia. The skull was exposed by a large incision through the flap of skin on top of the scalp. The site of the lateral ventricles was defined as the distance of 40% between the lambda (anatomical landmark) and the eye. The 33-gauge needle was inserted 2mM deep perpendicular to the skull surface and clear CSF fluid was aspirated.
Mouse tissue collection
Wildtype or TDP-43 Tg/Tg mice (postnatal day1) were treated with 50 μg negative control ASO or Syf2 ASO via intracerebroventricular injection at postnatal day 1. For tissue collection, P21 mice were anesthetized and intracardiac perfusion was performed with cold PBS. Brains were separated into two hemispheres sagittally. One hemisphere was frozen at −80°C for immunoblotting or RNA analysis. The other brain hemisphere and spinal cords were fixed in cold 4% PFA overnight prior to being cryoprotected in 30% sucrose in PBS +0.01% sodium azide in preparation for immunofluorescence analysis. For muscle collection, the tibialis anterior muscles were extracted from both hind legs. The muscles were submerged in 4% paraformaldehyde for 10 minutes, then stored in 30% sucrose + 0.01% sodium azide overnight. For CSF collection and Syf2 ASO CNS distribution studies, ASO injected mice were euthanized at P4 and P14, respectively.
Histology
Cryoprotected tissues were embedded in O.C.T (Fisher Scientific, catalog number 23–730-571) and cryosectioned to 16 μm slices using Leica CM3050S cryostat. Sections were stored at −80°C. For immunofluorescence staining with primary antibodies, slides were treated with citrate buffer (pH 6)/0.05% tween-20 for 20 minutes at 80℃ prior to antibody staining. All primary antibody stainings were done with 3 overnight incubations at 4°C. Secondary antibody incubation was done at room temperature for one hour. The list of antibodies and working concentrations is provided in the STAR methods. For NeuroTrace (ThermoFisher, N21480) (Fluorescent Nissl Stain) staining, the slides were rehydrated in 10x PBS for at least 40 minutes and washed in 1x PBS/0.1% Triton X-100 for 10 minutes. The slides were washed in 1x PBS 2 times for 5 minutes each and then incubated with diluted NeuroTrace (1:50 in PBS) in the dark for 20 minutes. Slides were washed for 10 minutes in PBS/0.1% Triton X-100, 2 x 5 minutes in PBS and 2 hours at room temperature or overnight at 4°C in PBS prior to mounting. To quantify the ventral motor neurons in the lumbar spinal cord, 4–5 sections per animal were stained with NeuroTrace and imaged using a Zeiss LSM 880 at 10x. Both lateral motor column and medial motor column motor neurons in each half spinal cord were quantified and the average total motor neuron counts per hemicord was recorded for individual animals.
To quantify the mislocalization of TDP43 into the cytoplasm, the nuclear:cytoplasmic ratio was measured using a TDP-43 polyclonal antibody raised against an N-terminal fragment of TDP-43 (Proteintech, 10782–2-AP, 1:200). The fluorescent intensity of the TDP-43 staining in the cell nucleus and cytoplasm were measured using Image J and recorded as the nuclear to cytoplasmic ratio. To quantify the numbers of cytoplasmic phosphorylated TDP-43 (pTDP-43) puncta in motor neurons, a rabbit polyclonal raised against Ser409/410 (Proteintech, 22309–1-AP, 1:100) was used. For Figure 6H&J, the average number of pTDP-43+ puncta per μm2 across 10–15 neurons from three sections in one mouse was measured using Image J. Statistical significance (One-way ANOVA) was calculated comparing the NC ASO treated TDP-43Tg/Tg mice to the Syf2 ASO condition, and to WT mice + NC ASO. Unpaired t-test for WT mice + NC ASO vs. WT mice + Syf2 ASO. GFAP (Aves, 1:1000) and Iba1 (GeneTex, GT101495, 1:100) antibodies were used to stain astrocytes and microglia, respectively. Motor neurons in the primary motor cortex and ventral spinal cord were imaged using Zeiss LSM 880 with oil immersion at 63x. 15–25 neurons were quantified per animal.
For NMJ analysis, tibialis anterior muscles were embedded and longitudinally sliced into 16 um-thick sections. To visualize innervation of the NMJs, acetylcholine receptors were labeled with α-Bungarotoxin (Invitrogen B13423), and presynaptic vesicles were stained with synaptophysin (Synaptic Systems, 101002). The percentage of overlapping signals was quantified via manual counting. ~60 endplates across three sections in one mouse were quantified from each animal. For Figure 6L, Statistical significance (One-way ANOVA) was calculated comparing the NC ASO treated TDP-43Tg/Tg mice to the Syf2 ASO condition, and to WT mice + NC ASO. Unpaired t-test for WT mice + NC ASO vs. WT mice + Syf2 ASO.
Quantification and statistical analysis
Statistical analysis and data visualization were performed with the statistical software package GraphPad Prism version 9.1.0. For all experiments, the normal distribution of data sets was tested by the D’Agostino-Pearson omnibus normality test. Differences between two groups were analyzed using a two-tailed Student’s t-test, unless the data were non–normally distributed, in which case two-sided Mann-Whitney testing was used. Differences between multiple groups were analyzed using Ordinary One-way ANOVA. P-values were corrected for multiple comparisons using Dunnett’s multiple comparisons test for One-way ANOVA and Bonferroni correction for Student’s t-test. Mean and standard error of the mean was used for normally distributed data sets, and median and interquartile range were used for non–normally distributed data sets. Significance was assumed at p < 0.05. Sample size estimation was performed by power analysis using preliminary data (https://www.stat.ubc.ca/~rollin/stats/ssize/n2.html). Any outliers that were excluded were determined by an outlier ROUT test in GraphPad Prism.
For iMN survival studies, statistical analysis was performed using two-sided log-rank test to account for the events that did not occur (meaning that iMNs that did not degenerate at the end of the survival assay). For each line, iMNs were randomly selected for tracking and used to generate the Kaplan–Meier survival curves. The number of iMNs counted per group was specified in the Kaplan-Meier plot or method section for each survival experiment. The hazard rates were calculated with the Log-rank method and statistical analysis was performed with One-way ANOVA. The number of biological replicates (independent conversions) per group was specified in the method section. For immunocytochemistry, iMNs were quantified from two independent conversions per group. The number of iMNs counted per group was specified in the method section. For qRT-PCR, the number of biological replicates (independent conversions) was specified in the method section. For western blotting, the number of biological replicates (independent conversions) was specified in each figure. For animal studies, the number of animals per group was specified in each figure.
Supplementary Material
Pathways with their p-values and z-scores from Ingenuity Pathway Analysis (IPA) of differentially expressed genes with FDR<0.05 from bulk RNAseq of C9-ALS/FTD-1 and C9-ISO-1 iMNs treated with a scrambled siRNA or two SYF2 siRNAs. n=3 biologically independent iMN conversions without glia per condition per line. Additional sheets report bin and junction results from alternative splicing analysis comparing C9-ALS/FTD-1 and C9-ISO-1 iMNs treated with a scrambled siRNA or two SYF2 siRNAs performed by ASpli.
Related to Figure 1. Karyotyping and donor information for all iPSC lines.
iMN survival was assessed by automated image analysis and selected wells for which automated image analysis or manual assessment of iMN survival suggested a protective effect on iMN survival were further analyzed by manual iMN survival tracking. “N/A” refers to wells for which image quality or culture conditions made automated image analysis difficult. These wells were assessed by manual image analysis. P-values were calculated by log-rank test comparing each compound-treated condition to the DMSO control. “Corroborated” refers to compounds for which manual iMN survival tracking detected a significant increase in iMN survival compared to DMSO treatment.
P-values and hazard ratios were calculated using the survival data of 50 iMNs per compound treatment taken from 3 independent iMN conversions. P-values (log-rank test) and hazard ratios were calculated comparing iMN survival for each line/compound combination to the iMN survival for the same line with DMSO treatment. For the hazard ratio calculations, the hazard rate of the DMSO-treated condition was set as 1 for each line.
Highlights
A phenotypic screen identifies SYF2 suppression as a therapeutic target for ALS
SYF2 suppression alleviates disease in a diverse collection of iPSC models of ALS
SYF2 suppression slows TDP-43 nuclear export, reduces aggregation, and improves splicing
Syf2 suppression mitigates motor deficits and neuropathology in a mouse model of ALS
eTOC blurb
Reducing levels of a spliceosome associated factor, SYF2, attenuates TDP-43 pathology in models of diverse forms of ALS. Therefore, these findings by Linares et al., indicate that SYF2 suppression may function as a broadly acting therapeutic strategy for the treatment of ALS.
Acknowledgements
We thank the NINDS Biorepository at Coriell Institute and Answer ALS for providing several of the cell lines. We thank Said Beydoun and the ALS Association Certified Center of Excellence at USC Keck School of Medicine for providing additional ALS patient blood samples for iPSC generation. In addition, for one of the TARDBP lines, we thank Juliana Acosta-Uribe and Francisco Lopera at the Grupo de Neurociencias de Antioquia - Universidad de Antioquia, Kenneth S. Kosik at the Neuroscience Research Institute, University of California at Santa Barbara, as well as the family who donated a biospecimen for the development of the cell line. Whole-genome sequencing was provided by the University of Washington Center for Mendelian Genomics (UW-CMG), funded by NHGRI/NHLBI grants UM1 HG006493/U24 HG008956 and the Office of the Director, NIH, under award S10OD021553. The content is solely the responsibility of the authors and does not necessarily represent the official views of the NIH. We thank Lyle Ostrow and Ian Robey of the Johns Hopkins ALS Postmortem Tissue Core and the VA Biorepository Brain Bank, respectively, for providing postmortem tissue samples for immunostaining analysis. We thank the Donnelly Lab for the Cry2-TDP-43-mCherry plasmid. We thank Helen Falk and Sandy Falk, USC Libraries Bioinformatics Service, and the Choi Family Therapeutic Screening Facility for bioinformatic, imaging, and chemical screening support. This work was also supported by NIH grants R00NS077435, R01NS097850, 2R01NS097850, R01NS131409, R44NS097094, and R01NS131409, US Department of Defense grant W81XWH-15–1-0187, W81XWH-20–1-0424, W81XWH-21–1-0168, and W81XWH-21–1-0131, and ALS Association grants 22-PDF-588, 984923, and the Lawrence and Isabel Barnett Drug Development Award, the Donald E. and Delia B. Baxter Foundation, the Tau Consortium, the Frick Foundation for ALS Research, the Muscular Dystrophy Association, the New York Stem Cell Foundation, the Alzheimer′s Drug Discovery Foundation, the Association for Frontotemporal Degeneration, the Pape Adams Foundation, the John Douglas French Alzheimer′s Foundation, the Harrington Discovery Institute, the Merkin Family Foundation, the USC Broad Innovation Award, the University of Southern California Alzheimer′s Disease Research Center, and the SC-CTSI to J.K.I. J.K.I. is a New York Stem Cell Foundation-Robertson Investigator and the John Douglas French Alzheimer’s Foundation Endowed Associate Professor of Stem Cell Biology and Regenerative Medicine. G.R.L. was supported in part by a Broad Postdoctoral Fellowship and NIH Diversity Supplement. Y.L. was supported in part by the Milton Safenowitz Postdoctoral Fellowship from the ALS Association.
Footnotes
Publisher's Disclaimer: This is a PDF file of an unedited manuscript that has been accepted for publication. As a service to our customers we are providing this early version of the manuscript. The manuscript will undergo copyediting, typesetting, and review of the resulting proof before it is published in its final form. Please note that during the production process errors may be discovered which could affect the content, and all legal disclaimers that apply to the journal pertain.
Declaration of interests
J.K.I. and S.A. are co-founders of AcuraStem, Inc. S.A., W.-H.C., S.M., and S.H. are employees of AcuraStem, Inc. J.K.I. is a co-founder of Modulo Bio, serves on the scientific advisory boards of AcuraStem, Spinogenix, Synapticure, and Vesalius Therapeutics, and is employed by BioMarin Pharmaceutical. H.G. is a co-founder of Exai Bio and Vevo Therapeutics and serves on the scientific advisory boards of Exai Bio and Verge Genomics. J.K.I. and G.R.L. are inventors on a patent application (PCT/US2021/014541) that has been filed related to this work.
Inclusion and diversity
One or more of the authors of this paper self-identifies as an underrepresented ethnic minority in their field of research or within their geographical location. One or more of the authors of this paper self-identifies as a gender minority in their field of research. One or more of the authors of this paper received support from a program designed to increase minority representation in their field of research.
References
- 1.Mejzini R, Flynn LL, Pitout IL, Fletcher S, Wilton SD, and Anthony Akkari P (2019). ALS Genetics, Mechanisms, and Therapeutics: Where Are We Now? Frontiers in Neuroscience 13. 10.3389/fnins.2019.01310. [DOI] [PMC free article] [PubMed] [Google Scholar]
- 2.Pihlstrøm L, Wiethoff S, and Houlden H (2017). Genetics of neurodegenerative diseases: an overview. Handb. Clin. Neurol 145, 309–323. [DOI] [PubMed] [Google Scholar]
- 3.Finkel RS, Mercuri E, Darras BT, Connolly AM, Kuntz NL, Kirschner J, Chiriboga CA, Saito K, Servais L, Tizzano E, et al. (2017). Nusinersen versus Sham Control in Infantile-Onset Spinal Muscular Atrophy. N. Engl. J. Med 377, 1723–1732. [DOI] [PubMed] [Google Scholar]
- 4.Miller T, Cudkowicz M, Shaw PJ, Andersen PM, Atassi N, Bucelli RC, Genge A, Glass J, Ladha S, Ludolph AL, et al. (2020). Phase 1–2 Trial of Antisense Oligonucleotide Tofersen for SOD1 ALS. N. Engl. J. Med 383, 109–119. [DOI] [PubMed] [Google Scholar]
- 5.Shi Y, Hung S-T, Rocha G, Lin S, Linares GR, Staats KA, Seah C, Wang Y, Chickering M, Lai J, et al. (2019). Identification and therapeutic rescue of autophagosome and glutamate receptor defects in C9ORF72 and sporadic ALS neurons. JCI Insight 5. 10.1172/jci.insight.127736. [DOI] [PMC free article] [PubMed] [Google Scholar]
- 6.Shi Y, Lin S, Staats KA, Li Y, Chang W-H, Hung S-T, Hendricks E, Linares GR, Wang Y, Son EY, et al. (2018). Haploinsufficiency leads to neurodegeneration in C9ORF72 ALS/FTD human induced motor neurons. Nat. Med 24, 313–325. [DOI] [PMC free article] [PubMed] [Google Scholar]
- 7.DeJesus-Hernandez M, Mackenzie IR, Boeve BF, Boxer AL, Baker M, Rutherford NJ, Nicholson AM, Finch NA, Flynn H, Adamson J, et al. (2011). Expanded GGGGCC hexanucleotide repeat in noncoding region of C9ORF72 causes chromosome 9p-linked FTD and ALS. Neuron 72, 245–256. [DOI] [PMC free article] [PubMed] [Google Scholar]
- 8.Renton AE, Majounie E, Waite A, Simón-Sánchez J, Rollinson S, Gibbs JR, Schymick JC, Laaksovirta H, van Swieten JC, Myllykangas L, et al. (2011). A hexanucleotide repeat expansion in C9ORF72 is the cause of chromosome 9p21-linked ALS-FTD. Neuron 72, 257–268. [DOI] [PMC free article] [PubMed] [Google Scholar]
- 9.Zhang K, Daigle JG, Cunningham KM, Coyne AN, Ruan K, Grima JC, Bowen KE, Wadhwa H, Yang P, Rigo F, et al. (2018). Stress Granule Assembly Disrupts Nucleocytoplasmic Transport. Cell 173, 958–971.e17. [DOI] [PMC free article] [PubMed] [Google Scholar]
- 10.Davidson Y, Robinson AC, Liu X, Wu D, Troakes C, Rollinson S, Masuda-Suzukake M, Suzuki G, Nonaka T, Shi J, et al. (2016). Neurodegeneration in frontotemporal lobar degeneration and motor neurone disease associated with expansions in C9orf72 is linked to TDP-43 pathology and not associated with aggregated forms of dipeptide repeat proteins. Neuropathol. Appl. Neurobiol 42, 242–254. [DOI] [PMC free article] [PubMed] [Google Scholar]
- 11.Barmada SJ, Skibinski G, Korb E, Rao EJ, Wu JY, and Finkbeiner S (2010). Cytoplasmic mislocalization of TDP-43 is toxic to neurons and enhanced by a mutation associated with familial amyotrophic lateral sclerosis. J. Neurosci 30, 639–649. [DOI] [PMC free article] [PubMed] [Google Scholar]
- 12.Suk TR, and Rousseaux MWC (2020). The role of TDP-43 mislocalization in amyotrophic lateral sclerosis. Mol. Neurodegener 15, 45. [DOI] [PMC free article] [PubMed] [Google Scholar]
- 13.Lombardi P (2002). Exemestane, a new steroidal aromatase inhibitor of clinical relevance. Biochim. Biophys. Acta 1587, 326–337. [DOI] [PubMed] [Google Scholar]
- 14.Phillips A, Demarest K, Hahn DW, Wong F, and McGuire JL (1990). Progestational and androgenic receptor binding affinities and in vivo activities of norgestimate and other progestins. Contraception 41, 399–410. [DOI] [PubMed] [Google Scholar]
- 15.Jones RC, Singer AC, and Edgren RA (1979). The biological activities of norgestrel and its enantiomers. Int. J. Fertil 24, 39–43. [PubMed] [Google Scholar]
- 16.Geisler J (2011). Differences between the non-steroidal aromatase inhibitors anastrozole and letrozole--of clinical importance? Br. J. Cancer 104, 1059–1066. [DOI] [PMC free article] [PubMed] [Google Scholar]
- 17.Zwain IH, and Yen SS (1999). Neurosteroidogenesis in astrocytes, oligodendrocytes, and neurons of cerebral cortex of rat brain. Endocrinology 140, 3843–3852. [DOI] [PubMed] [Google Scholar]
- 18.Fang H, Tong W, Branham WS, Moland CL, Dial SL, Hong H, Xie Q, Perkins R, Owens W, and Sheehan DM (2003). Study of 202 natural, synthetic, and environmental chemicals for binding to the androgen receptor. Chem. Res. Toxicol 16, 1338–1358. [DOI] [PubMed] [Google Scholar]
- 19.Corsello SM, Bittker JA, Liu Z, Gould J, McCarren P, Hirschman JE, Johnston SE, Vrcic A, Wong B, Khan M, et al. (2017). The Drug Repurposing Hub: a next-generation drug library and information resource. Nat. Med 23, 405–408. [DOI] [PMC free article] [PubMed] [Google Scholar]
- 20.Wierman ME, Arlt W, Basson R, Davis SR, Miller KK, Murad MH, Rosner W, and Santoro N (2014). Androgen therapy in women: a reappraisal: an Endocrine Society clinical practice guideline. J. Clin. Endocrinol. Metab 99, 3489–3510. [DOI] [PubMed] [Google Scholar]
- 21.Russell CS, Ben-Yehuda S, Dix I, Kupiec M, and Beggs JD (2000). Functional analyses of interacting factors involved in both pre-mRNA splicing and cell cycle progression in Saccharomyces cerevisiae. RNA 6, 1565–1572. [DOI] [PMC free article] [PubMed] [Google Scholar]
- 22.Ben-Yehuda S, Dix I, Russell CS, McGarvey M, Beggs JD, and Kupiec M (2000). Genetic and physical interactions between factors involved in both cell cycle progression and pre-mRNA splicing in Saccharomyces cerevisiae. Genetics 156, 1503–1517. [DOI] [PMC free article] [PubMed] [Google Scholar]
- 23.Zhang X, Yan C, Hang J, Finci LI, Lei J, and Shi Y (2017). An Atomic Structure of the Human Spliceosome. Cell 169, 918–929.e14. [DOI] [PubMed] [Google Scholar]
- 24.Hogg R, McGrail JC, and O’Keefe RT (2010). The function of the NineTeen Complex (NTC) in regulating spliceosome conformations and fidelity during pre-mRNA splicing. Biochem. Soc. Trans 38, 1110–1115. [DOI] [PMC free article] [PubMed] [Google Scholar]
- 25.Acosta-Uribe J, Aguillón D, Cochran JN, Giraldo M, Madrigal L, Killingsworth BW, Singhal R, Labib S, Alzate D, Velilla L, et al. (2022). A neurodegenerative disease landscape of rare mutations in Colombia due to founder effects. Genome Med 14, 27. [DOI] [PMC free article] [PubMed] [Google Scholar]
- 26.Fujimori K, Ishikawa M, Otomo A, Atsuta N, Nakamura R, Akiyama T, Hadano S, Aoki M, Saya H, Sobue G, et al. (2018). Modeling sporadic ALS in iPSC-derived motor neurons identifies a potential therapeutic agent. Nat. Med 24, 1579–1589. [DOI] [PubMed] [Google Scholar]
- 27.Xu W, Cao M, Zheng H, Tan X, Li L, Cui G, Xu J, Cao J, Ke K, and Wu Q (2014). Upregulation of SYF2 is associated with neuronal apoptosis caused by reactive astrogliosis to neuroinflammation. J. Neurosci. Res 92, 318–328. [DOI] [PubMed] [Google Scholar]
- 28.Neumann M, Kwong LK, Lee EB, Kremmer E, Flatley A, Xu Y, Forman MS, Troost D, Kretzschmar HA, Trojanowski JQ, et al. (2009). Phosphorylation of S409/410 of TDP-43 is a consistent feature in all sporadic and familial forms of TDP-43 proteinopathies. Acta Neuropathol 117, 137–149. [DOI] [PMC free article] [PubMed] [Google Scholar]
- 29.Gasset-Rosa F, Lu S, Yu H, Chen C, Melamed Z ‘ev, Guo, L., Shorter, J., Da Cruz, S., and Cleveland, D.W. (2019). Cytoplasmic TDP-43 De-mixing Independent of Stress Granules Drives Inhibition of Nuclear Import, Loss of Nuclear TDP-43, and Cell Death. Neuron 102, 339–357.e7. [DOI] [PMC free article] [PubMed] [Google Scholar]
- 30.Melamed Z, López-Erauskin J, Baughn MW, Zhang O, Drenner K, Sun Y, Freyermuth F, McMahon MA, Beccari MS, Artates JW, et al. (2019). Premature polyadenylation-mediated loss of stathmin-2 is a hallmark of TDP-43-dependent neurodegeneration. Nat. Neurosci 22, 180–190. [DOI] [PMC free article] [PubMed] [Google Scholar]
- 31.Klim JR, Williams LA, Limone F, Guerra San Juan I, Davis-Dusenbery BN, Mordes DA, Burberry A, Steinbaugh MJ, Gamage KK, Kirchner R, et al. (2019). ALS-implicated protein TDP-43 sustains levels of STMN2, a mediator of motor neuron growth and repair. Nat. Neurosci 22, 167–179. [DOI] [PMC free article] [PubMed] [Google Scholar]
- 32.Bracha D, Walls MT, Wei M-T, Zhu L, Kurian M, Avalos JL, Toettcher JE, and Brangwynne CP (2019). Mapping Local and Global Liquid Phase Behavior in Living Cells Using Photo-Oligomerizable Seeds. Cell 176, 407. [DOI] [PubMed] [Google Scholar]
- 33.Mann JR, Gleixner AM, Mauna JC, Gomes E, DeChellis-Marks MR, Needham PG, Copley KE, Hurtle B, Portz B, Pyles NJ, et al. (2019). RNA Binding Antagonizes Neurotoxic Phase Transitions of TDP-43. Neuron 102, 321–338.e8. [DOI] [PMC free article] [PubMed] [Google Scholar]
- 34.Archbold HC, Jackson KL, Arora A, Weskamp K, Tank EM-H, Li X, Miguez R, Dayton RD, Tamir S, Klein RL, et al. (2018). TDP43 nuclear export and neurodegeneration in models of amyotrophic lateral sclerosis and frontotemporal dementia. Sci. Rep 8, 4606. [DOI] [PMC free article] [PubMed] [Google Scholar]
- 35.Ederle H, Funk C, Abou-Ajram C, Hutten S, Funk EBE, Kehlenbach RH, Bailer SM, and Dormann D (2018). Nuclear egress of TDP-43 and FUS occurs independently of Exportin-1/CRM1. Sci. Rep 8, 7084. [DOI] [PMC free article] [PubMed] [Google Scholar]
- 36.Pinarbasi ES, Cağatay T, Fung HYJ, Li YC, Chook YM, and Thomas PJ (2018). Active nuclear import and passive nuclear export are the primary determinants of TDP-43 localization. Sci. Rep 8, 7083. [DOI] [PMC free article] [PubMed] [Google Scholar]
- 37.Love DC, Sweitzer TD, and Hanover JA (1998). Reconstitution of HIV-1 rev nuclear export: independent requirements for nuclear import and export. Proc. Natl. Acad. Sci. U. S. A 95, 10608–10613. [DOI] [PMC free article] [PubMed] [Google Scholar]
- 38.Adam SA (2016). Nuclear Protein Transport in Digitonin Permeabilized Cells. Methods Mol. Biol 1411, 479–487. [DOI] [PubMed] [Google Scholar]
- 39.Ling JP, Pletnikova O, Troncoso JC, and Wong PC (2015). TDP-43 repression of nonconserved cryptic exons is compromised in ALS-FTD. Science 10.1126/science.aab0983. [DOI] [PMC free article] [PubMed]
- 40.Xiao S, McKeever PM, Lau A, and Robertson J (2019). Synaptic localization of C9orf72 regulates post-synaptic glutamate receptor 1 levels. Acta Neuropathol Commun 7, 161. [DOI] [PMC free article] [PubMed] [Google Scholar]
- 41.Perkins EM, Burr K, Banerjee P, Mehta AR, Dando O, Selvaraj BT, Suminaite D, Nanda J, Henstridge CM, Gillingwater TH, et al. (2021). Altered network properties in C9ORF72 repeat expansion cortical neurons are due to synaptic dysfunction. Mol. Neurodegener 16, 13. [DOI] [PMC free article] [PubMed] [Google Scholar]
- 42.Jensen BK, Schuldi MH, McAvoy K, Russell KA, Boehringer A, Curran BM, Krishnamurthy K, Wen X, Westergard T, Ma L, et al. (2020). Synaptic dysfunction induced by glycine‐alanine dipeptides in C9orf72‐ ALS / FTD is rescued by SV 2 replenishment. EMBO Molecular Medicine 12. 10.15252/emmm.201910722. [DOI] [PMC free article] [PubMed] [Google Scholar]
- 43.Butti Z, Pan YE, Giacomotto J, and Patten SA (2021). Reduced C9orf72 function leads to defective synaptic vesicle release and neuromuscular dysfunction in zebrafish. Commun Biol 4, 792. [DOI] [PMC free article] [PubMed] [Google Scholar]
- 44.Mancini E, Rabinovich A, Iserte J, Yanovsky M, and Chernomoretz A (2021). Corrigendum to: ASpli: Integrative analysis of splicing landscapes through RNA-Seq assays. Bioinformatics 10.1093/bioinformatics/btab345. [DOI] [PubMed]
- 45.Ma XR, Prudencio M, Koike Y, Vatsavayai SC, Kim G, Harbinski F, Briner A, Rodriguez CM, Guo C, Akiyama T, et al. (2022). TDP-43 represses cryptic exon inclusion in the FTD–ALS gene UNC13A. Nature 603, 124–130. [DOI] [PMC free article] [PubMed] [Google Scholar]
- 46.Brown A-L, Wilkins OG, Keuss MJ, Hill SE, Zanovello M, Lee WC, Bampton A, Lee FCY, Masino L, Qi YA, et al. (2022). TDP-43 loss and ALS-risk SNPs drive mis-splicing and depletion of UNC13A. Nature 603, 131–137. [DOI] [PMC free article] [PubMed] [Google Scholar]
- 47.Farg MA, Konopka A, Soo KY, Ito D, and Atkin JD (2017). The DNA damage response (DDR) is induced by the C9orf72 repeat expansion in amyotrophic lateral sclerosis. Hum. Mol. Genet 26, 2882–2896. [DOI] [PubMed] [Google Scholar]
- 48.Andrade NS, Ramic M, Esanov R, Liu W, Rybin MJ, Gaidosh G, Abdallah A, Del’Olio S, Huff TC, Chee NT, et al. (2020). Dipeptide repeat proteins inhibit homology-directed DNA double strand break repair in C9ORF72 ALS/FTD. Mol. Neurodegener 15, 13. [DOI] [PMC free article] [PubMed] [Google Scholar]
- 49.Chen CH, Chu PC, Lee L, Lien HW, Lin TL, and Fan CC, Chi P, Huang CJ, Chang MS (2012a) Disruption of murine mp29/Syf2/Ntc31 gene results in embryonic lethality with aberrant checkpoint response. PLoS One [DOI] [PMC free article] [PubMed]
- 50.Becker LA, Huang B, Bieri G, Ma R, Knowles DA, Jafar-Nejad P, Messing J, Kim HJ, Soriano A, Auburger G, et al. (2017). Therapeutic reduction of ataxin-2 extends lifespan and reduces pathology in TDP-43 mice. Nature 544, 367–371. [DOI] [PMC free article] [PubMed] [Google Scholar]
- 51.Wils H, Kleinberger G, Janssens J, Pereson S, Joris G, Cuijt I, Smits V, Ceuterick-de Groote C, Van Broeckhoven C, and Kumar-Singh S (2010). TDP-43 transgenic mice develop spastic paralysis and neuronal inclusions characteristic of ALS and frontotemporal lobar degeneration. Proceedings of the National Academy of Sciences 107, 3858–3863. [DOI] [PMC free article] [PubMed] [Google Scholar]
- 52.Sang A, Yang X, Chen H, Qin B, Zhu M, Dai M, Zhu R, and Liu X (2015). Upregulation of SYF2 Relates to Retinal Ganglion Cell Apoptosis and Retinal Glia Cell Proliferation After Light-Induced Retinal Damage. J. Mol. Neurosci 56, 480–490. [DOI] [PubMed] [Google Scholar]
- 53.Yoo Y-E, and Ko C-P (2012). Dihydrotestosterone ameliorates degeneration in muscle, axons and motoneurons and improves motor function in amyotrophic lateral sclerosis model mice. PLoS One 7, e37258. [DOI] [PMC free article] [PubMed] [Google Scholar]
- 54.Vivekananda U, Manjalay Z-R, Ganesalingam J, Simms J, Shaw CE, Leigh PN, Turner MR, and Al-Chalabi A (2011). Low index-to-ring finger length ratio in sporadic ALS supports prenatally defined motor neuronal vulnerability. J. Neurol. Neurosurg. Psychiatry 82, 635–637. [DOI] [PubMed] [Google Scholar]
- 55.Thomas PS, Fraley GS, Damien V, Woodke LB, Zapata F, Sopher BL, Plymate SR, and La Spada AR (2006). Loss of endogenous androgen receptor protein accelerates motor neuron degeneration and accentuates androgen insensitivity in a mouse model of X-linked spinal and bulbar muscular atrophy. Hum. Mol. Genet 15, 2225–2238. [DOI] [PubMed] [Google Scholar]
- 56.Chen C-H, Chu P-C, Lee L, Lien H-W, Lin T-L, Fan C-C, Chi P, Huang C-J, and Chang M-S (2012). Disruption of murine mp29/Syf2/Ntc31 gene results in embryonic lethality with aberrant checkpoint response. PLoS One 7, e33538. [DOI] [PMC free article] [PubMed] [Google Scholar]
- 57.Karczewski KJ, Weisburd B, Thomas B, Solomonson M, Ruderfer DM, Kavanagh D, Hamamsy T, Lek M, Samocha KE, Cummings BB, et al. (2017). The ExAC browser: displaying reference data information from over 60 000 exomes. Nucleic Acids Res 45, D840–D845. [DOI] [PMC free article] [PubMed] [Google Scholar]
- 58.Okita K, Matsumura Y, Sato Y, Okada A, Morizane A, Okamoto S, Hong H, Nakagawa M, Tanabe K, Tezuka K-I, et al. (2011). A more efficient method to generate integration-free human iPS cells. Nat. Methods 8, 409–412. [DOI] [PubMed] [Google Scholar]
- 59.Du Z-W, Chen H, Liu H, Lu J, Qian K, Huang C-L, Zhong X, Fan F, and Zhang S-C (2015). Generation and expansion of highly pure motor neuron progenitors from human pluripotent stem cells. Nat. Commun 6, 6626. [DOI] [PMC free article] [PubMed] [Google Scholar]
- 60.Fernandopulle MS, Prestil R, Grunseich C, Wang C, Gan L, and Ward ME (2018). Transcription Factor-Mediated Differentiation of Human iPSCs into Neurons. Curr. Protoc. Cell Biol 79, e51. [DOI] [PMC free article] [PubMed] [Google Scholar]
- 61.Melamed Z. ‘ev, López-Erauskin J, Baughn MW, Zhang O, Drenner K, Sun Y, Freyermuth F, McMahon MA, Beccari MS, Artates JW, et al. (2019). Premature polyadenylation-mediated loss of stathmin-2 is a hallmark of TDP-43-dependent neurodegeneration. Nat. Neurosci 22, 180–190. [DOI] [PMC free article] [PubMed] [Google Scholar]
- 62.Guerra San Juan I, Nash LA, Smith KS, Leyton-Jaimes MF, Qian M, Klim JR, Limone F, Dorr AB, Couto A, Pintacuda G, et al. (2022). Loss of mouse Stmn2 function causes motor neuropathy. Neuron 110, 1671–1688.e6. [DOI] [PMC free article] [PubMed] [Google Scholar]
- 63.Dobin A, Davis CA, Schlesinger F, Drenkow J, Zaleski C, Jha S, Batut P, Chaisson M, and Gingeras TR (2013). STAR: ultrafast universal RNA-seq aligner. Bioinformatics 29, 15–21. [DOI] [PMC free article] [PubMed] [Google Scholar]
- 64.Liao Y, Smyth GK, and Shi W (2014). featureCounts: an efficient general purpose program for assigning sequence reads to genomic features. Bioinformatics 30, 923–930. 10.1093/bioinformatics/btt656. [DOI] [PubMed] [Google Scholar]
- 65.Love MI, Huber W, and Anders S (2014). Moderated estimation of fold change and dispersion for RNA-seq data with DESeq2. Genome Biol 15, 550. [DOI] [PMC free article] [PubMed] [Google Scholar]
Associated Data
This section collects any data citations, data availability statements, or supplementary materials included in this article.
Supplementary Materials
Pathways with their p-values and z-scores from Ingenuity Pathway Analysis (IPA) of differentially expressed genes with FDR<0.05 from bulk RNAseq of C9-ALS/FTD-1 and C9-ISO-1 iMNs treated with a scrambled siRNA or two SYF2 siRNAs. n=3 biologically independent iMN conversions without glia per condition per line. Additional sheets report bin and junction results from alternative splicing analysis comparing C9-ALS/FTD-1 and C9-ISO-1 iMNs treated with a scrambled siRNA or two SYF2 siRNAs performed by ASpli.
Related to Figure 1. Karyotyping and donor information for all iPSC lines.
iMN survival was assessed by automated image analysis and selected wells for which automated image analysis or manual assessment of iMN survival suggested a protective effect on iMN survival were further analyzed by manual iMN survival tracking. “N/A” refers to wells for which image quality or culture conditions made automated image analysis difficult. These wells were assessed by manual image analysis. P-values were calculated by log-rank test comparing each compound-treated condition to the DMSO control. “Corroborated” refers to compounds for which manual iMN survival tracking detected a significant increase in iMN survival compared to DMSO treatment.
P-values and hazard ratios were calculated using the survival data of 50 iMNs per compound treatment taken from 3 independent iMN conversions. P-values (log-rank test) and hazard ratios were calculated comparing iMN survival for each line/compound combination to the iMN survival for the same line with DMSO treatment. For the hazard ratio calculations, the hazard rate of the DMSO-treated condition was set as 1 for each line.
Data Availability Statement
Whole exome sequencing data of sporadic ALS patients used in cohort 1 of the study can be found in Sequence Read Archive (SRA) with accession numbers PRJNA552114 and PRJNA903195. Please note that whole genome sequencing data, instead of whole exome sequencing data, were presented for some of the subjects in PRJNA552114. This is due to the involvement of these subjects in other studies that requires whole genome sequencing data and those studies are not related to the current manuscript. For sporadic ALS patients in cohort 2, whole genome sequencing data and results of rare variant analysis are available from their corresponding sources websites (STAR methods). The bulk RNA-sequencing and splicing analysis data generated as part of this study are available at the Gene Expression Omnibus. Accession numbers are listed in the key resources table and the output of the analyses are available upon request.
Original code was not used in this study.
Any additional information required to reanalyze the data reported in this paper is available from the Lead Contact upon request.
Key resources table
| REAGENT or RESOURCE | SOURCE | IDENTIFIER |
|---|---|---|
| Antibodies | ||
| Anti-histone H2A.X (rabbit IgG, 1:1000) | Abcam | Cat# ab5392 |
| Bungarotoxin (BTX, 1:750) (Alexa594-conjugated) | Invitrogen | Cat# B13423 |
| GFAP (chicken IgY, 1:1000) | Aves Labs Inc | GFAP |
| GR repeat (rabbit IgG, 1:50) | Proteintech | Cat# 23978–1-AP |
| Hb9 (mouse IgG1 kappa light chain, 1:10) | DSHB | Cat# 81.5C10 |
| Iba1 (rabbit IgG, 1:100) | GeneTex | Cat# GT101495 |
| Islet 1 (rabbit IgG, 2 μg/ml) | Abcam | Cat# ab20670 |
| MAP2 (chicken IgY, 1:2000) | Abcam | Cat# ab5392 |
| Mu Crystallin (rabbit IgG, 1: 200) (CoraLite®594-conjugated) | Proteintech | Cat# CL594–12495 |
| Phospho TDP43(Ser409/410) (mouse IgG2a,1:100) | ProteinTech | Cat# 22309–1-AP |
| PR repeat (rabbit IgG, 1:50) | Proteintech | Cat# 23979–1-AP |
| STMN2 (rabbit IgG, 1:200) | Novus | Cat# NBP1–49461 |
| SYF2 (rabbit IgG, 1:80) for iMN staining and western blots | MilliporeSigma | Cat# HPA070710 |
| SYF2 (mouse IgG, 1:150) for post-mortem tissue staining | Abcam | Cat# ab236417 |
| Synaptophysin (rabbit IgG, 1:100) | Synaptic systems | Cat# 101002 |
| TDP43 (rabbit IgG, 1:200) | Proteintech | Cat# 10782–2-AP |
| Tuj1 (mouse IgG, 1:1000) | Biolegend | Cat# 801202 |
| DAPI | Thermo Fisher Scientific | Cat# 62248 |
| Donkey Anti-Chicken IgY (IgG) (H+L) Alexa Fluor® 647 | Jackson ImmunoResearch | Cat# 703–605-155 |
| Donkey anti-Mouse, IgG (H+L) Highly Cross-Adsorbed, Alexa Fluor® 488 | Invitrogen | Cat# A21202 |
| Donkey anti-Mouse, IgG (H+L) Highly Cross-Adsorbed, Alexa Fluor® 555 | Invitrogen | Cat# A31570 |
| Donkey anti-Mouse, IgG (H+L) Highly Cross-Adsorbed, Alexa Fluor® 647 | Invitrogen | Cat# A32787 |
| Donkey anti-Rabbit, IgG (H+L) Highly Cross-Adsorbed, Alexa Fluor® 488 | Invitrogen | Cat# A-21206 |
| IRDye® 680RD Donkey anti-Rabbit IgG Secondary Antibody | LI-COR Biosciences | Cat# 926–68073 |
| IRDye® 800CW Donkey anti-Mouse IgG Secondary Antibody | LI-COR Biosciences | Cat# 926–32212 |
| NeuroTrace™ 500/525 Green Fluorescent Nissl Stain (1:50) | Thermo Fisher Scientific | Cat# N21480 |
| Biological samples | ||
| CTRL (1) | Johns Hopkins ALS Postmortem Resource Core | JHU124 |
| CTRL (2) | Johns Hopkins ALS Postmortem Resource Core | JHU129 |
| CTRL (3) | BioChain Institute Inc. | T2234234 |
| sALS (1) | Johns Hopkins ALS Postmortem Resource Core | JHU121 |
| sALS (2) | Johns Hopkins ALS Postmortem Resource Core | JHU122 |
| sALS (3) | Johns Hopkins ALS Postmortem Resource Core | JHU126 |
| sALS (4) | Johns Hopkins ALS Postmortem Resource Core | JHU127 |
| sALS (5) | Johns Hopkins ALS Postmortem Resource Core | JHU128 |
| Chemicals, peptides, and recombinant proteins | ||
| DMEM | Gibco | Cat# 11995–065 |
| Opti-MEM | Gibco | Cat# 31985–070 |
| FBS | GenClone | Cat# 25–514 |
| Trypsin | GenClone | Cat# 25–510 |
| Polybrene (Hexadimethrine bromide) | Millipore Sigma | Cat# H9268–5G |
| DMEM/F12 | Corning | Cat# 10–090-CV |
| Laminin | Invitrogen | Cat#23017015 |
| Glutamax | Gibco | Cat# 35050–061 |
| N2 supplement | Gibco | Cat# 17502048 |
| B27 supplement | Gibco | Cat# 17504044 |
| Non-essential amino acids (NEAA) | Gibco | Cat# 11140050 |
| Human FGF-beta | Peprotech | Cat# 100–18B |
| Repsox | Selleckchem | Cat# S7223 |
| human CNTF | R&D | Cat# 257-NT |
| human BDNF | R&D | Cat# 248BDB |
| human GDNF | R&D | Cat# 212-GD |
| Alt-R® S.p. HiFi Cas9 Nuclease V3, (100 μg) | IDT | Cat# 1081060 |
| Matrigel | Corning | Cat#3 54277 |
| mTeSR | StemCell | Cat# 85851 |
| Accutase | Innovative Cell Technologies | Cat# AT4104 |
| Y-27632 2HCl (ROCK inhibitor) | Selleckchem | Cat# S1049 |
| Lenti-X concentrator | TaKaRa | Cat# 631232 |
| Polybrene (Hexadimethrine bromide) | Millipore Sigma | Cat# H9268–5G |
| Neurobasal-A | Life Technologies | Cat# 10888–022 |
| Apilimod | achemblock | Cat# O33822 |
| SB431542 | Cayman Chemical | Cat# 13031 |
| CHIR99021 | Cayman Chemical | Cat# 13122 |
| Retinoic Acid | Millipore Sigma | Cat# R2625 |
| DMH1 | Selleckchem | Cat# S7146 |
| Purmorphamine | Cayman Chemical | Cat# 10009634 |
| T-PER buffer | Thermofisher | Cat# 78510 |
| Donor Equine Serum | HyClone | Cat# 16777–030 |
| MEM media | Life Technologies | Cat# 10370088 |
| Penicillin-streptomycin 50X | Corning | Cat# 30–001-CI |
| Compound E | Cayman Chemicals | Cat# 15579 |
| Digitonin | Cayman Chemicals | Cat# 14952 |
| 5-Ethynyl uridine | Millipore Sigma | Cat# 909475 |
| Blasticidin S HCl | ThermoFisher | Cat# A1113903 |
| Lipofectamine™ Stem Transfection Reagent | Thermo | Cat# STEM00001 |
| Doxycycline | Clontech | Cat# 631311 |
| BrdU | Millipore Sigma | Cat# B9285 |
| Puromycin | Millipore Sigma | Cat# SBR00017 |
| Spectrum Collection | Microsource Discovery Systems | The Spectrum collection |
| Doramectin | Microsource Spectrum | Cat# 01505902 |
| Avermectin A1a | Microsource Spectrum | Cat# 01502347 |
| Abamectin (avermectin B1a) | Cayman Chemical | Cat# 19201 |
| Moxidectin | Cayman Chemical | Cat# 17165 |
| Selamectin | Cayman Chemical | Cat# 21529 |
| Eprinomectin | Millipore Sigma | Cat# 32526 |
| Ivermectin | Selleckchem | Cat# S1351 |
| Cloxyquin (5 chloro-8-quinolinol) 95% | Millipore Sigma | Cat# C47000 |
| Dicloxacillin sodium | Millipore Sigma | Cat# D9016 |
| Ibuprofen | Millipore Sigma | Cat# I4883 |
| Acetylcholine chloride | Tocris Bioscience | Cat# 2809 |
| Salsolidine | abCam | Cat# ab143546 |
| Alfuzosin hydrochloride | Cayman Chemicals | Cat# 13648 |
| Canrenone | Cayman Chemicals | Cat# 21307 |
| Torsemide | Selleckchem | Cat# S1698 |
| Phenazopyridine hydrochloride | Millipore Sigma | Cat# 34076 |
| Phenelzine sulfate | Millipore Sigma | Cat# P6777 |
| Levonorgestrel | Cayman Chemicals | Cat# 10006318 |
| Dexibuprofen | Cayman Chemicals | Cat# 16793 |
| Amlexanox | Cayman Chemicals | Cat# 14181 |
| Deflazacort | Cayman Chemicals | Cat# 20386 |
| Levetiracetam | Tocris Bioscience | Cat# 2839 |
| Alpha tocopherol | Millipore Sigma | Cat# 258024 |
| Alpha tocopheryl acetate | Cayman Chemicals | Cat# 10007705 |
| Capecitabine | Cayman Chemicals | Cat# 10487 |
| Anastrozole | Millipore Sigma | Cat# A2736 |
| Fulvestrant | Cayman Chemicals | Cat# 10011269 |
| Lomustine | Millipore Sigma | Cat# L5918 |
| Pemetrexed | Cayman Chemicals | Cat# 14269 |
| Acenocoumarol | Cayman Chemicals | Cat# 10010569 |
| Clinafloxacin Hydrochloride | Cayman Chemicals | Cat# 16923 |
| CoEnzyme Q10 (Ubidecarenone) | Selleckchem | Cat# S2398 |
| Pirenzepine hydrochloride | Tocris Bioscience | Cat# 1071 |
| Ketoprofen | Cayman Chemicals | Cat# 10006661 |
| Cefsulodin | Cayman Chemicals | Cat# 16127 |
| Cefoperazone | Cayman Chemicals | Cat# 16113 |
| Cycloheximide | Cayman Chemicals | Cat# 14126 |
| Menadione | Cayman Chemicals | Cat# 15950 |
| β-carotene | Cayman Chemicals | Cat# 16837 |
| Pyrazinamide | Cayman Chemicals | Cat# 23416 |
| Salicyclic Acid | Selleckchem | Cat# S4539 |
| Sulfabenzamide | Selleckchem | Cat# S4576 |
| Sulfacetamide | Cayman Chemicals | Cat# 20377 |
| Tetracycline hydrochloride | Cayman Chemicals | Cat# 14328 |
| Thioguanine | Cayman Chemicals | Cat# 15774 |
| Timolol maleate | Selleckchem | Cat# S4123 |
| Tolmetin sodium | Cayman Chemicals | Cat# 18195 |
| Ursodiol | Selleckchem | Cat# S1643 |
| Azlocillin sodium | Cayman Chemicals | Cat# 18424 |
| Cefaclor | Santa Cruz Biotechnology | Cat# sc-205242 |
| Vidarabine | Cayman Chemicals | Cat# 18149 |
| Arecoline | Cayman Chemicals | Cat# 13662 |
| Mebeverine hydrochloride | Santa Cruz Biotechnology | Cat# sc-235579 |
| Paromomycin sulfate | Cayman Chemicals | Cat# 23634 |
| Cytisine | Selleckchem | Cat# S2287 |
| Ftaxilide | Microsource Spectrum | Cat# 01504523 |
| Bambuterol hydrochloride | Selleckchem | Cat# S4277 |
| Bucladesine | Selleckchem | Cat# S7858 |
| Hexamethonium bromide | Selleckchem | Cat# S4069 |
| Niacin | Selleckchem | Cat# S1744 |
| Nifedipine | Cayman Chemicals | Cat# 11106 |
| Norethynodrel | Microsource Spectrum | Cat# 01500435 |
| Norgestrel | Cayman Chemicals | Cat# 10006319 |
| Noscapine hydrochloride | Cayman Chemicals | Cat# 17255 |
| Phenacemide | Microsource Spectrum | Cat# 01500472 |
| Pheniramine maleate | Selleckchem | Cat# S4045 |
| Phenylbutazone | Cayman Chemicals | Cat# 70400 |
| Levosimendan | Cayman Chemicals | Cat# 16128 |
| Nortriptyline hydrochloride | Cayman Chemicals | Cat# 15904 |
| Oxidopamine hydrochloride | Microsource Spectrum | Cat# 01500450 |
| Tibolone | Cayman Chemicals | Cat# 10006321 |
| Exemestane | Cayman Chemicals | Cat# 15008 |
| Metformin | Selleckchem | Cat# S1950 |
| Ganciclovir | Cayman Chemicals | Cat# 13853 |
| Letrozole | Cayman Chemicals | Cat# 11568 |
| Dihydrotestosterone | Cayman Chemicals | Cat# 15874 |
| Riluzole | Millipore Sigma | Cat# R116 |
| Edaravone | Selleckchem | Cat# S1326 |
| Fluphenazine | Cayman Chemicals | Cat# 23555 |
| Critical commercial assays | ||
| Click-iT RNA Alexa Fluor 594 imaging kit | Thermo Fisher Scientific | Cat# C10330 |
| RNeasy 96 kit | Qiagen | Cat# 74181 |
| RNeasy plus mini kit | Qiagen | Cat# 74136 |
| Pierce™ BCA Protein assay kit | Thermo Fisher Scientific | Cat# 23227 |
| Deposited data | ||
| Sequence Read Archive (SRA) (Whole exome sequencing of sALS patients) | https://www.ncbi.nlm.nih.gov/sra | PRJNA552114 |
| Sequence Read Archive (SRA) (Whole exome sequencing of sALS patients) | https://www.ncbi.nlm.nih.gov/sra | PRJNA903195 |
| Gene Expression Omnibus (Bulk RNA-seq and splicing analysis) | https://www.ncbi.nlm.nih.gov/geo/ | GSE218079 |
| Experimental models: Cell lines | ||
| CTRL-1 | NINDS Biorepository | ND03231 |
| CTRL-2 | NINDS Biorepository | ND03719 |
| CTRL-3 | NINDS Biorepository | ND05280 |
| CTRL-4 | NINDS Biorepository | ND00184 |
| CTRL-5 | NINDS Biorepository | ND41865 |
| CTRL-6 | Cedars Sinai Biomanufacturing Center | CS5MRLiCTR |
| CTRL-7 | Cedars Sinai Biomanufacturing Center | CS2PFYiCTR |
| CTRL-8 | Cedars Sinai Biomanufacturing Center | CS2BVGiCTR |
| CTRL-9 | Cedars Sinai Biomanufacturing Center | CS2GW3iCTR |
| C9-ALS/FTD-1 | NINDS Biorepository | ND06769 |
| C9-ALS/FTD-2 | NINDS Biorepository | ND10689 |
| C9-ALS/FTD-3 | NINDS Biorepository | ND12099 |
| C9-ALS/FTD-4 | Cedars Sinai Biomanufacturing Center | CS29iALS |
| C9-ALS/FTD-5 | Cedars Sinai Biomanufacturing Center | CS2YNLiALS |
| C9-ALS/FTD-6 | NINDS Biorepository | ND08957 |
| C9-ALS/FTD-7 | NINDS Biorepository | ND12100 |
| C9-ALS/FTD-8 | Cedars Sinai Biomanufacturing Center | CS2DDGiALS |
| C9-ALS/FTD-9 | NINDS Biorepository | ND50000 |
| C9-ISO-1 | Ichida Lab | 6769 iso c1 |
| C9-ISO-4 | Cedars Sinai Biomanufacturing Center | 29iALS-ISO |
| sALS-1 | NINDS Biorepository | ND08705 |
| sALS-2 | NINDS Biorepository | ND09292 |
| sALS-3 | NINDS Biorepository | ND09329 |
| sALS-4 | NINDS Biorepository | ND10739 |
| sALS-5 | NINDS Biorepository | ND13454 |
| sALS-6 | NINDS Biorepository | ND14185 |
| sALS-7 | Loma Linda University | #3 |
| sALS-8 | Loma Linda University | #4 |
| sALS-9 | NINDS Biorepository | ND09711 |
| sALS-10 | NINDS Biorepository | ND11813 |
| sALS-11 | NINDS Biorepository | ND50073 |
| sALS-12 | Cedars Sinai Biomanufacturing Center | CS0WD8iALS |
| sALS-13 | Cedars Sinai Biomanufacturing Center | CS0KHAiALS |
| sALS-14 | Ichida Lab | sALS-14 |
| sALS-15 | Cedars Sinai Biomanufacturing Center | CS0GR5iALS |
| sALS-16 | Acurastem Inc | ALS93E |
| sALS-17 | Cedars Sinai Biomanufacturing Center | CS3XLKiALS |
| sALS-18 | Cedars Sinai Biomanufacturing Center | CS2NDDiALS |
| sALS-19 | Cedars Sinai Biomanufacturing Center | CS2WW0iALS |
| sALS-20 | Cedars Sinai Biomanufacturing Center | CS1RUGiALS |
| sALS-21 | Cedars Sinai Biomanufacturing Center | CS2CLNiALS |
| sALS-22 | NINDS Biorepository | ND50082 |
| sALS-23 | Cedars Sinai Biomanufacturing Center | CS2VU4iALS |
| sALS-24 | Cedars Sinai Biomanufacturing Center | CS5HF7iALS |
| sALS-25 | Cedars Sinai Biomanufacturing Center | CS0KBHiALS |
| sALS-26 | Cedars Sinai Biomanufacturing Center | CS3AH9iALS |
| sALS-27 | Cedars Sinai Biomanufacturing Center | CS0JCLiALS |
| TARDBP-ALS/FTD-1 | NINDS Biorepository | ND50007 |
| TARDBP-ALS/FTD-2 | Grupo de Neurociencias de Antioquia - Universidad de Antioquia | 12240 |
| FUS-ALS-1 | NINDS Biorepository | ND35663 |
| FUS-ALS-2 | NINDS Biorepository | ND39034 |
| SOD1-ALS-1 | NINDS Biorepository | ND35658 |
| SOD1-ALS-2 | NINDS Biorepository | ND35659 |
| SOD1-ALS-3 | Kiskinis Lab | 39B |
| CMT2A-1 | New York Stem Cell Foundation | NYCSF-AG0017–01-MR |
| MAPT-1 | Tau consortium | ND32951A.15ᐃ2B09 |
| Experimental models: Organisms/strains | ||
| Mice: Tg(Thy1-TARDBP)4Singh | The Jackson Laboratory | Strain# 012836 |
| Mice: C57BL/6J mice | The Jackson Laboratory | Strain# 000664 |
| Mice: ICR/Ha J mice | The Jackson Laboratory | Strain# 009122 |
| Oligonucleotides | ||
| sgRNA-1 targeting upstream of repeat expansion | This paper | GUAACCUACGGUGUCCCGCU |
| sgRNA-2b targeting downstream of repeat expansion | This paper | ACCCCAAACAGCCACCCGCC |
| Primer 1 for repeat primed PCR | This paper | FAM-tgtaaaacgacggccagtCAAGGAGGGAAACAACCGCAGCC |
| Primer 2 for repeat primed PCR | This paper | caggaaacagctatgaccGGGCCCGCCCCGACCACGCCCCGGCCCCGGCCCCGG |
| Primer 3 for repeat primed PCR | This paper | caggaaacagctatgacc |
| CLYBL crRNA | Synthego | ATGTTGGAAGGATGAGGAAA |
| qPCR primer for HPRT, Forward | This paper | GACTTTGCTTTCCTTGGTCAG |
| qPCR primer for HPRT, Reverse | This paper | GGCTTATATCCAACACTTCGTGGG |
| qPCR primer for SYF1, Forward | This paper | CATTTCGAGAAGGCTCGGGA |
| qPCR primer for SYF1, Reverse | This paper | CAGCTGTCCGTTGTCCTCAT |
| Software and algorithms | ||
| Image J | https://imagej.nih.gov/ij/ | N/A |
| Prism | https://www.graphpad.com/scientific-software/prism/ | N/A |
| Next-generation clustered heat map builder and viewer | https://bioinformatics.mdanderson.org/public-software/ngchm/ | N/A |
| R studio | https://www.rstudio.com/ | N/A |
| Biorender | https://biorender.com/ | N/A |