

Summary
Amyotrophic lateral sclerosis (ALS) is a fatal neurodegenerative disease that results from many diverse genetic causes. Although therapeutics specifically targeting known causal mutations may rescue individual types of ALS, these approaches cannot treat most cases since they have unknown genetic etiology. Thus, there is a pressing need for therapeutic strategies that rescue multiple forms of ALS. Here, we show that pharmacological inhibition of PIKFYVE kinase activates an unconventional protein clearance mechanism involving exocytosis of aggregation-prone proteins. Reducing PIKFYVE activity ameliorates ALS pathology and extends survival of animal models and patient-derived motor neurons representing diverse forms of ALS including C9ORF72, TARDBP, FUS, and sporadic. These findings highlight a potential approach for mitigating ALS pathogenesis that does not require stimulating macroautophagy or the ubiquitin-proteosome system.
Graphical Abstract

In Brief
Pharmacological reduction of PIKFYVE kinase activity activates an unconventional protein clearance mechanism involving exocytosis of aggregation-prone proteins that mitigates disease in diverse models of ALS.
Introduction
ALS is a fast-progressing neurodegenerative disease characterized by motor neuron loss, paralysis, and death within 2–5 years of onset1. Similar to other prominent neurodegenerative diseases such as Alzheimer’s disease and frontotemporal dementia (FTD), ALS has many diverse genetic etiologies2. Since each genetic form is rare and the etiology unknown for most cases, a central goal is the identification of pathways that can treat multiple forms of ALS.
The accumulation of misfolded proteins can induce neuron death and is a common feature of neurodegenerative diseases1,3,4. Canonical proteostasis mechanisms including the ubiquitin-proteosome system and autophagy decline with age but recent studies suggest that neurons can utilize a third, unconventional protein clearance pathway involving exocytosis of aggregation-prone proteins5–7. However, it remains unclear if stimulating exocytosis of aggregation-prone proteins could be used to treat neurodegenerative diseases.
Here, we show that PIKFYVE kinase inhibition is broadly-efficacious in models of diverse forms of ALS. PIKFYVE inhibition stimulates the exocytosis of neurotoxic proteins from ALS patient iMNs, reduces intracellular pathology, and increases TDP-43 splicing activity. Thus, activating the exocytosis of pathological proteins from neurons mitigates disease in models representing diverse forms of ALS.
Results
PIKFYVE inhibition ameliorates C9ORF72 ALS/FTD neurodegeneration
In a phenotypic screen to identify targets that extend C9ORF72 ALS/FTD iMN survival, we previously found that PIKFYVE kinase inhibitors were among the most efficacious compounds8. PIKFYVE converts phosphatidylinositol-3-phosphate (PI3P) to phosphatidylinositol-3,5-bisphosphate (PI(3,5)P2), which resides on autophagosomal, endosomal, and lysosomal membranes and regulates vesicle fusion9,10. However, how PIKFYVE inhibition ameliorates C9ORF72 processes, if it can address other forms of ALS, and its efficacy in chronic in vivo models remain unknown.
To extend our analyses to additional C9ORF72 dipeptide repeat proteins (DPRs) and TDP-43 loss-of-function phenotypes, we expressed Ngn2, Isl1, Lhx3, Ascl1, Brn2, Myt1l, NeuroD1, and a lentiviral Hb9::RFP reporter to convert control and C9ORF72 ALS/FTD induced pluripotent stem cells (iPSCs) into Hb9::RFP+ iMNs (Figure 1A; Figure S1A)8,11. Control and patient lines generated iMNs with similar efficiency (Table S1; Figure S1B). C9ORF72 ALS/FTD iMNs displayed prominent poly(GR)+ and poly(PR)+ punctae compared to isogenic and non-isogenic controls and showed TDP-43 mislocalization into the cytoplasm (Figure S1C–I).
Figure 1. PIKFYVE inhibition ameliorates C9ORF72 ALS/FTD neurodegeneration.

(A) Production of Hb9::RFP+ iMNs and survival tracking by longitudinal microscopy.
(B) iMN survival for three control (CTRL) and three C9ORF72 ALS/FTD lines. Log-rank test.
(C) Hazard ratios for (B). Mean of independent iMN conversions ± SEM. One-way ANOVA.
(D) Survival of C9-ALS/FTD iMNs (three lines) in DMSO/apilimod (AP). Log-rank test.
(E) Hazard ratios for CTRL (three lines in aggregate) and C9-ALS/FTD iMNs treated with DMSO/apilimod. Mean of independent iMN conversions ± SEM. One-way ANOVA.
(F) Hazard ratios from CTRL (two lines in aggregate) and C9-ALS/FTD iMNs treated with negative control (NC) ASO, PIKFYVE ASO1, or PIKFYVE ASO2. Mean of independent iMN conversions ± SEM. One-way ANOVA.
(G) Locomotor function in Drosophila larvae overexpressing C9ORF72 GR.100 with/without apilimod treatment. N=30 larvae/group. Kruskal-Wallis test. Mean ± SEM.
Similar to our previous studies, we used longitudinal tracking to determine iMN survival8,11–14. When stressed by neurotrophic factor withdrawal, C9ORF72 ALS/FTD iMNs degenerated faster than controls (Figure 1B, C; Figure S1J, K). To facilitate quantitative comparisons between multiple groups, we used the Mantel-Haenszel method to assess iMN survival data and calculate a hazard rate, or likelihood of neuron death during a specified time interval15. We normalized the hazard rate for each group to a control condition to generate a hazard ratio. For C9ORF72 ALS/FTD iMNs relative to control iMNs, this resulted in a hazard ratio >1 (Figure 1C). The small molecule PIKFYVE inhibitor apilimod and multiple PIKFYVE-suppressing ASOs improved C9ORF72 ALS/FTD iMN survival in a dose-dependent manner (Figure 1D–F; Figure S1L–R). Apilimod also increased motor function and the number of neuromuscular junction (NMJ) active zones in poly(GR)-expressing Drosophila larvae (Figure 1G; Figure S1S, T)16.
PIKFYVE inhibition ameliorates disease pathology in iMNs
RNA-seq analysis of DMSO- and apilimod-treated C9ORF72 ALS/FTD iMNs revealed differences in autophagy- and vesicle-related gene categories, suggesting PIKFYVE inhibition might affect proteostasis (Figure S2A; Table S2). Indeed, apilimod reduced poly(GR)+, poly(PR)+, and poly(GA)+ punctae, lowered cytoplasmic TDP-43, increased the nuclear:cytoplasmic TDP-43 ratio, reduced STMN2 cryptic exon inclusion, and increased full-length STMN2 and UNC13A transcripts in C9ORF72 ALS/FTD iMNs (Figure 2A–F; Figure S2B–D).
Figure 2. PIKFYVE inhibition ameliorates disease pathology in C9ORF72 ALS/FTD iMNs.

(A) Truncated Stathmin2 RNA levels (normalized to MAP2) relative to full-length Stathmin2 in CTRL/C9-ALS/FTD iMNs treated with DMSO/apilimod. Gray circles = independent iMN conversions. One-way ANOVA. Mean ± SEM.
(B-D) Immunostaining/quantification of total TDP-43 in CTRL/C9-ALS/FTD iMNs with DMSO/apilimod treatment. Dots = (C) the mean cytoplasmic TDP-43 intensity or (D) the average nuclear:cytoplasmic TDP-43 ratio in one iMN. Kruskal-Wallis test. Median ± interquartile range. Solid/dotted lines outline the cell body/nucleus.
(E-F) Immunostaining/quantification of endogenous poly(GR)+ punctae in CTRL/C9-ALS/FTD iMNs treated with DMSO/apilimod. Gray circles = the number of nuclear poly(GR)+ punctae/μm2 in one iMN. Kruskal-Wallis test. Median ± interquartile range. Solid/dotted lines outline the cell body/nucleus.
PIKFYVE inhibition stimulates exocytosis of aggregation-prone proteins from iMNs
Since apilimod induced changes in autophagy-related gene sets, we determined if it increased autophagy (Figure S2A). We transduced C9ORF72 ALS/FTD iMNs with an mRFP-GFP-LC3 construct that labels autophagosomes as GFP+/mRFP+ and lysosomes as mRFP+-only (Figure S3A)11,17. In the presence of bafilomycin, apilimod increased mRFP+/GFP+ autophagosome production by 3-fold (Figure S3A, B)18. Although apilimod induced gene expression changes resembling TFEB overexpression, it did not increase nuclear TFEB, phosphorylated TFEB, or TFEB target gene activation in C9ORF72 ALS/FTD iMNs (Table S2; Figure S3C, D; Data S1). In addition, apilimod increased the ratio of mRFP+/GFP+ autophagosomes:total mRFP+ vesicles and LC3-II:LC3-I by a slightly greater amount without bafilomycin than with bafilomycin, suggesting it modestly decreased autophagic flux (Figure S3A, B, E, F). Moreover, apilimod decreased mRFP+/GFP- autolysosomes without bafilomycin even though lysosensor green detected more lysosomes (Figure S3G–H). Importantly, bafilomycin did not prevent PIKFYVE inhibition from increasing C9ORF72 ALS/FTD iMN survival (Figure S3I, Data S1). Thus, PIKFYVE inhibition did not increase macroautophagy, nor was macroautophagy required for apilimod’s efficacy.
Surprisingly, apilimod did not increase the total number of LC3-mRFP+ vesicles in iMNs, suggesting that autophagosomes might leave the cell or be degraded through a macroautophagy-independent route (Figure S3J). PIKFYVE inhibition can activate an unconventional form of secretion in which autophagosome-associated proteins, cytosolic aggregation-prone proteins, and leaderless proteins are preferentially exocytosed (Figure 3A)19–21. We harvested extracellular vesicles from iMN supernatants using polyethylene glycol/ultracentrifugation, and after normalizing by total protein content and controlling for differences in neuron death using TUJ1 levels in the cell pellet fraction, immunoblotting showed that apilimod increased levels of the exosomal marker TSG101 in extracellular vesicles from iMN supernatants (Figure 3B, C; Figure S3K; Data S1)22,23. Co-treatment with GW4869, a small molecule Neutral Sphingomyelinase 2 inhibitor that blocks exosome release, abolished the ability of apilimod to increase supernatant TSG101 (Figure 3B, C; Data S1)6,24. To visualize exosome release, we overexpressed GFP in iMNs, isolated and labeled exosomes with carboxyfluorescein succinimidyl ester (CFSE)-far red dye and performed flow cytometry25. Apilimod increased the number of GFP+/CSFE+ particles in the iMN supernatant (Figure S3L). Electron microscopy confirmed that the particles secreted by C9ORF72 ALS/FTD iMNs upon apilimod treatment were exosomes of ~100 nm in diameter (Figure 3D)26.
Figure 3. PIKFYVE inhibition increases exocytosis of aggregation-prone proteins from iMNs.
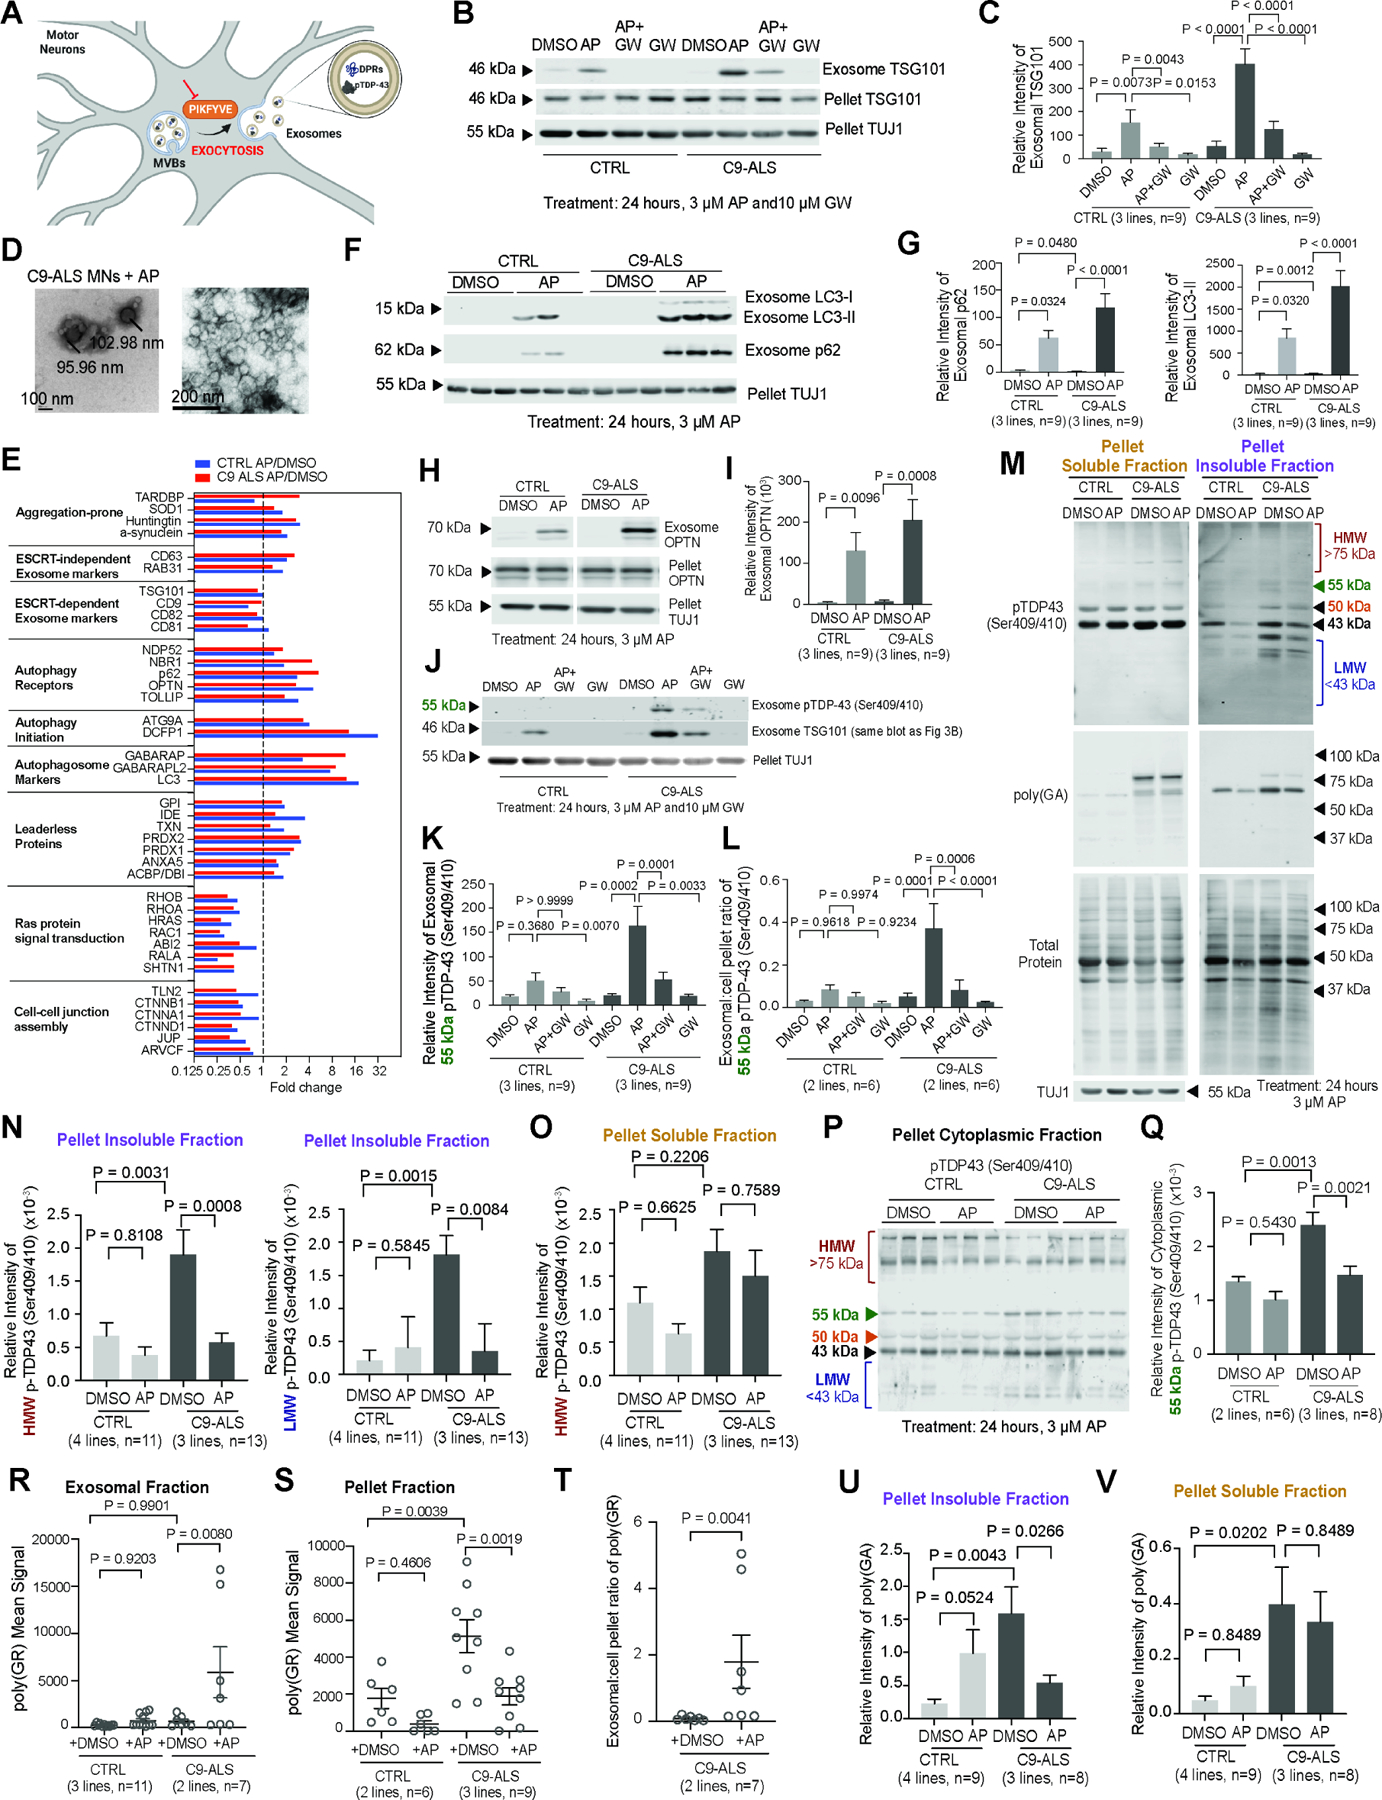
(A) PIKFYVE’s putative role in the exocytosis of aggregation-prone proteins.
(B-C) Immunoblots/quantification of TSG101 in exosomal or pellet fractions from CTRL/C9-ALS/FTD iMNs treated with DMSO, apilimod, apilimod+GW4869, or GW4869. Pellet TUJ1 controlled for cell death. One-way ANOVA. Mean ± SEM.
(D) Electron microscopic images of secreted vesicles in the exosomal fraction of apilimod-treated C9-ALS/FTD iMN cultures.
(E) Fold-change of selected protein levels in exosomal fractions after apilimod treatment versus DMSO from CTRL/C9-ALS/FTD iMNs.
(F-G) Immunoblots/quantification of LC3 and p62 in the exosomal fraction from CTRL/C9-ALS/FTD iMN cultures treated with DMSO/apilimod. One-way ANOVA. Mean ± SEM.
(H-I) Immunoblots/quantification of OPTN in exosomal and pellet fractions from C9-ALS/FTD iMNs treated with DMSO/apilimod. Unpaired t-test. Mean ± SEM.
(J-L) Immunoblots/quantification of pTDP-43 in exosomal and pellet fractions from CTRL/C9-ALS/FTD iMNs treated with DMSO, apilimod, apilimod+GW4869, or GW4869. The same blot from Figure 3B was used to facilitate comparisons between markers. Exosome TSG101 is the same as Figure 3B. (K) Exosomal pTDP-43 levels. (L) pTDP-43 exosomal:pellet ratio for CTRL/C9-ALS/FTD iMNs. One-way ANOVA. Mean ± SEM.
(M) pTDP43 and poly(GA) immunoblots on soluble/insoluble fractions from CTRL/C9-ALS/FTD iMNs treated with DMSO/apilimod.
(N-O) Quantification of high molecular weight (HMW, >75kDa) and low molecular weight (LMW, <43 kDa) pTDP-43 in the pellet insoluble (N) or soluble (O) fraction from (M). For HMW, one-way ANOVA. Mean ± SEM. For LMW, Kruskal-Wallis test, Median ± interquartile range (N). One-way ANOVA, Mean ± SEM (O).
(P-Q) Immunoblots/quantification of pTDP-43 (55 kDa) in cytoplasmic fractions from CTRL/C9-ALS/FTD iMNs treated with DMSO/apilimod. One-way ANOVA. Mean ± SEM.
(R-S) Immunoassay of poly(GR) levels in exosomal (R) or cell pellet (S) fractions of CTRL/C9-ALS/FTD iMNs. Gray circles = one biological replicate. One-way ANOVA. Mean ± SEM.
(T) Ratio of poly(GR) in exosomal:pellet fractions of CTRL/C9-ALS/FTD iMNs. Mann-Whitney test. Mean ± SEM.
(U-V) Quantification of poly(GA) in the pellet insoluble (U) and soluble (V) fraction from (M). Values = relative intensity of insoluble poly(GA) (37–100 kDa) normalized to total protein. One-way ANOVA. Mean ± SEM.
Mass spectrometry and immunoblotting showed that apilimod-induced exosomes showed enrichment of autophagosome-associated proteins and aggregation-prone proteins linked to neurodegenerative disease while showing de-enrichment for Ras signaling and cell-cell junction proteins (Figure 3E–I; Figure S3K–N; Table S3). Apilimod treatment increased the exosomal:cell pellet ratios of TSG101 and the autophagosome-associated protein OPTN to ~2:1 and ~0.4:1, respectively, suggesting large fractions of these proteins were exocytosed (Figure 3B, H; Figure S3O; Data S1). Importantly, apilimod increased secretion of pTDP-43 (Ser409/410) from C9ORF72 ALS/FTD iMNs, but not controls (Figure 3J, K; Data S1). Apilimod also increased total TDP-43 release from C9ORF72 ALS/FTD iMNs to a greater extent than from control iMNs (Figure S3P; Data S1). Co-administration of GW4869 severely reduced pTDP-43 and total TDP-43 release, confirming their secretion was exocytosis-dependent (Figure 3J, K; Figure S3P; Data S1). Apilimod treatment resulted in a pTDP-43 exosomal:cell pellet ratio of ~0.4:1, a 10-fold increase over the DMSO-treated condition and reduced insoluble high- and low-molecular weight (HMW, LMW) pTDP-43 species in C9ORF72 ALS/FTD iMNs (Figure 3L–N; Figure S3Q; Data S1). PIKFYVE inhibition did not reduce soluble pTDP-43 in whole cell C9ORF72 ALS/FTD iMN lysates or cytoplasmic extracts that were verified for purity using Fibrillarin and HSP90, except for a 55-kDa pTDP-43 species in cytoplasmic extracts (Figure 3M, O–Q; Figure S3R–T; Data S1). Apilimod did not significantly alter soluble or insoluble total TDP-43 in C9ORF72 ALS/FTD iMNs, indicating it caused the largest percent reduction in insoluble pTDP-43 rather than soluble pTDP-43 or total TDP-43 (Figure S3U, V; Data S1). Thus, PIKFYVE inhibition triggers the secretion and clearance of insoluble pTDP-43 from C9ORF72 ALS/FTD iMNs.
Our previously-validated ELISA assay showed that apilimod increased poly(GR) in exosomes from C9ORF72 ALS/FTD, but not control iMNs (Figure 3R)27,28. Apilimod increased the poly(GR) exosomal:pellet ratio to ~2:1 and reduced poly(GR) to background levels in C9ORF72 ALS/FTD iMNs (Figure 3R–T). Apilimod also reduced cellular levels of insoluble, but not soluble poly(GA), suggesting it caused the clearance of oligomeric/aggregated poly(GA)(Figure 3M, U, V; Data S1). Thus, proteins that drive ALS pathology are substrates for PIKFYVE inhibition-induced exocytosis in iMNs.
PIKFYVE inhibition clears pTDP-43 through amphisome and multivesicular body exocytosis
While the exocytosis inhibitor GW4869 did not alter control or C9ORF72 ALS/FTD iMN survival on its own, it blocked the ability of apilimod to increase C9ORF72 ALS/FTD iMN survival (Figure 4A; Figure S4A). We used ASOs to selectively suppress different secretory and protein clearance pathways in C9ORF72 ALS/FTD iMNs to determine which were required for apilimod’s efficacy. We suppressed the genes encoding VAMP7 and RAB27A, which are critical for plasma membrane fusion of multivesicular bodies and amphisomes, ATG7 and RAB8A, which promote amphisome exocytosis by stimulating autophagosome biogenesis and fusion with the plasma membrane, respectively, HSPA8, which is required for microautophagy and chaperone-mediated autophagy, MCOLN1, a protein critical for lysosomal exocytosis, GORASP1, an important component of the secretory autophagy pathway, and NSMAF, which is required for LC3-dependent extracellular vesicle loading and secretion (Figure S4B)29–39. Suppression of VAMP7, RAB27A, ATG7, and RAB8A prevented apilimod from increasing C9ORF72 ALS/FTD iMN survival and reduced apilimod-induced pTDP-43 and TSG101+ exosome secretion from C9ORF72 ALS/FTD iMNs, suggesting that amphisome and multivesicular body exocytosis are most critical for the efficacy of PIKFYVE inhibition (Figure 4B–F; Figure S4C, D; Data S1, S2).
Figure 4. PIKFYVE inhibition clears pTDP-43 through amphisome and multivesicular body exocytosis.

(A) Hazard ratios of CTRL/C9-ALS/FTD iMNs treated with DMSO, apilimod, apilimod+GW4869, or GW4869. Mean of independent iMN conversions ± SEM. One-way ANOVA.
(B) Hazard ratios of CTRL (2 lines in aggregate) or C9-ALS/FTD iMNs (2 lines in aggregate) treated with the ASOs indicated plus DMSO/apilimod. Mean of independent iMN conversions ± SEM. One-way ANOVA.
(C-D) Immunoblots/quantification of TSG101 in exosomal or pellet fractions from CTRL/C9-ALS/FTD iMNs. Cells were treated with the ASOs indicated and DMSO/apilimod. One-way ANOVA. Mean ± SEM.
(E-F) Immunoblots/quantification of exosomal pTDP-43 (50 kDa) from C9-ALS/FTD iMNs treated with the ASOs indicated and DMSO/apilimod. Exosomal TSG101 controlled for exosome secretion/collection. One-way ANOVA. Mean ± SEM.
(G-H) Immunostaining/quantification of pTDP-43+/CD63+/LC3B+ punctae in C9-ALS/FTD iMNs treated with negative control or RAB27A ASO and DMSO/apilimod. (G) Confocal Z-axis scanning. Yellow arrows denote pTDP-43 colocalized with CD63 and LC3B in 3D space. White arrows denote other colocalized pTDP-43+/CD63+/LC3B+ punctae. (H) Gray circles = the average number of pTDP-43+/CD63+/LC3B+ punctae/μm2 in one C9-ALS/FTD iMN. One-way ANOVA. Mean ± SEM.
(I) Correlative light and electron microscopic images of secreted CD63+ vesicles containing TDP-43 on the membrane of a C9-ALS/FTD iMN treated with apilimod. Top row: light microscopy images. Bottom row: electron microscopy images of the same cell. Arrows mark a CD63+/TDP-43+ vesicle in the process of being secreted.
To confirm these results, we performed immunofluorescence and electron microscopy. When we blocked exocytosis by suppressing RAB27A, PIKFYVE inhibition increased the total number of LC3+ vesicles in C9ORF72 ALS/FTD iMNs (Figure S4E). Apilimod increased LC3+/LAMP1+ and LC3+/CD63+ vesicles in C9ORF72 ALS/FTD iMNs, reflecting more autophagosome fusion with late endosomes/multivesicular bodies to form amphisomes (Figure S4F, G). RAB27A suppression further increased the number of LC3+/CD63+ vesicles within apilimod-treated, but not vehicle-treated C9ORF72 ALS/FTD iMNs, suggesting that PIKFYVE inhibition normally caused secretion of these vesicles (Figure S4G). Apilimod increased RAB7+ late endosomes in C9ORF72 ALS/FTD iMNs, which possibly contributed to the elevated amphisome formation (Figure S4H). Increased amphisome formation did not result from fewer available primary lysosomes since PIKFYVE inhibition slightly increased the number of small, primary lysosomes and decreased the abundance of large, secondary lysosomes that had likely fused with endosomes (Figure S4I). Lysosomes also possess high LAMP1 levels and the LC3/LAMP1 co-labeling results could, in principle, reflect increased autophagosome-lysosome fusion. However, our experiments with the LC3-RFP-GFP construct showed that apilimod decreased the number of LC3-RFP+/GFP- autolysosomes (Figure S3G). Thus, PIKFYVE inhibition increased amphisome formation and promoted their secretion.
We next determined if amphisomes mediated pTDP-43 clearance. Indeed, apilimod increased the number of pTDP-43+/LC3+/CD63+ vesicles in C9ORF72 ALS/FTD iMNs (Figure 4G, H). Overlaying immunofluorescence and electron microscopy imaging enabled direct visualization of the presence and secretion of pTDP-43+/CD63+ vesicles from apilimod-treated C9ORF72 ALS/FTD iMNs (Figure 4I). Blocking exocytosis with RAB27A suppression increased pTDP-43+/LC3+/CD63+ vesicles within apilimod-treated C9ORF72 ALS/FTD iMNs, providing further evidence that PIKFYVE inhibition induced the secretion of pTDP-43+ exosomes (Figure 4G, H). Apilimod reduced the number and size of cytoplasmic pTDP-43+ punctae without affecting their localization or intensity in C9ORF72 ALS/FTD iMNs (Figure S4J). Thus, PIKFYVE inhibition mitigates pTDP-43 pathology in C9ORF72 ALS/FTD iMNs by increasing the formation and secretion of pTDP-43+ amphisomes and multivesicular bodies.
PIKFYVE inhibition improves iMN proteostasis and survival for diverse forms of ALS
Since the accumulation of misfolded proteins is common to all ALS patients, we hypothesized activating exocytosis might increase iMN survival for diverse forms of ALS. For iMNs from 8 sporadic ALS lines without known ALS mutations, apilimod and PIKFYVE ASO treatment ameliorated TDP-43 mislocalization and neurodegeneration in a dose-dependent manner (Figure 5A–E; Figure S5A, B; Table S1).
Figure 5. PIKFYVE inhibition improves iMN proteostasis and survival for diverse forms of ALS.

(A-D) Immunostaining/quantification of total TDP-43 in CTRL/sporadic ALS (sALS) iMNs (A-B) or in sporadic ALS iMNs treated with DMSO/apilimod (C-D). Solid/dotted lines outline the cell body/nucleus. Gray circles = the nuclear:cytoplasmic TDP-43 ratio from one iMN. Mann-Whitney test. Median ± interquartile range.
(E-F) Hazard ratios of iMNs from CTRL/sporadic ALS lines (E) or CTRL, two FUS ALS (H517Q, R522R mutation), and TARDBP ALS (G298S mutation) lines (F) treated with DMSO/apilimod. Mean of independent iMN conversions ± SEM. One-way ANOVA.
(G) Hazard ratios of iMNs from CTRL, two sporadic ALS, and one FUS ALS (R522R mutation) line treated with negative control or RAB27A ASO plus DMSO/apilimod. Mean of independent iMN conversions ± SEM. One-way ANOVA.
(H-I) Larval turning time of TDP-43G298S Drosophila larvae with Pikfyve RNAi (H) or apilimod treatment (I). N=33 larvae/group. One-way ANOVA. Mean ± SEM.
Although wild-type TDP-43 aggregates in most ALS cases, some patients harbor ALS-causing mutations in TDP-43, such as G298S, that promote its aggregation40,41. TDP-43G298S iMNs degenerated significantly faster than controls and apilimod potently increased their survival (Figure 5F; Figure S5F). A small percentage of ALS patients harbor disease-causing Fused in sarcoma (FUS) mutations and develop neurotoxic FUS pathology42. We generated iMNs from two ALS patients who carried causal FUS mutations (H517Q, R522R) that drive FUS mislocalization in iMNs43. Indeed, FUS ALS iMNs displayed decreased survival and nuclear:cytoplasmic FUS ratios and apilimod ameliorated these phenotypes (Figure 5F; Figures S5F, G). Suppression of RAB27A, VAMP7, or ATG7 or GW4869 treatment blocked the ability of apilimod to increase sporadic, TARDBP, and FUS ALS iMN survival (Figure 5F, G; Figure S5A, F–H, I–M; Data S1). Similar to iMNs with TDP-43-mediated disease processes, blocking autophagic flux with bafilomycin did not affect apilimod’s efficacy in FUS ALS iMNs (Figure S3I, S5N). Thus, PIKFYVE inhibition extends the survival of C9ORF72, TARDBP, FUS, and sporadic ALS iMNs in an exocytosis-dependent manner.
PIKFYVE inhibition increases motor function in vivo
Apilimod and Pikfyve RNAi both ameliorated motor defects in TDP-43G298S-expressing Drosophila larvae as determined by larval turning assay (Figure 5H, I)44. Apilimod also reduced the percentage of TDP-43A315T-expressing C. elegans displaying paralysis and neurodegeneration (Figure S5O–Q)45. In mice, intrathecal injection of apilimod increased cerebrospinal fluid (CSF) levels of PIKFYVE inhibition-induced exosome markers such as OPTN, LC3, and WIPI2 (autophagosome markers), Huntingtin and SOD1 (aggregation-prone proteins), and ANXA2 (leaderless protein), suggesting that PIKFYVE inhibition can induce exocytosis in vivo (Figure S6A). To chronically and stably activate exocytosis, we genetically suppressed Pikfyve by two approaches - an ASO targeting Pikfyve or genetic deletion of exon 6 in one copy of Pikfyve using a CMV-Cre driver line crossed with a published Pikfyve-flox line (Figure S6B–G; Data S1)46,47. Deletion of exon 6 in one copy of Pikfyve or intracerebroventricular Pikfyve ASO administration reduced PIKFYVE mRNA and protein levels by 50% (Figure S6B–G; Data S1). Pikfyve ASO treatment increased CSF OPTN levels, suggesting that suppressing Pikfyve by ~50% activated exocytosis in vivo (Figure 6A; Data S1). Single allele deletion of Pikfyve or Pikfyve ASO treatment ameliorated motor impairment in the TAR4/4 Thy1::TDP-43 mouse model and extended survival by 25–30% (Figure 6B–E; Figure S6H–K; Video S1)48. GW4869 blocked stimulation of exocytosis by the ASO and impaired its ability to increase TDP-43 mouse motor function (Figure 6F–G; Figure S6L–M; Video S2; Data S1). A 5-fold lower ASO dose (5 ug) significantly improved motor function in TDP-43 mice, suggesting a therapeutic index of at least 5x (Figure S6N–P). Thus, Pikfyve suppression improves motor function and survival of TDP-43 mice in an exocytosis-dependent manner.
Figure 6. Pikfyve suppression improves motor function and extends survival of TDP-43 and C9ORF72 mice.

(A) Immunoblot/quantification of OPTN in CSF with negative control/Pikfyve ASO intracerebroventricular administration in neonatal mice. Unpaired t-test. Mean± SEM. Data points = one mouse.
(B) Gait impairment scores of Pikfyve+/+;WT, Pikfyve+/−;WT, Pikfyve+/+;TDP-43Tg/Tg and Pikfyve+/−; TDP-43Tg/Tg mice. Unpaired t-test at each time point. Mean ± SEM.
(C) Survival of Pikfyve+/+;TDP-43Tg/Tg and Pikfyve+/−;TDP-43Tg/Tg mice. Log-rank test.
(D) Gait impairment scores of WT or TDP-43Tg/Tg mice treated with vehicle and negative control/Pikfvye ASO. Unpaired t-test at each time point. Mean ± SEM.
(E) Survival of TDP-43Tg/Tg mice treated with vehicle and negative control/Pikfyve ASO. Log-rank test.
(F) Immunoblot/quantification of OPTN in CSF after administration of GW4869 and negative control/Pikfyve ASO. Unpaired t-test. Mean± SEM. Data points = one mouse.
(G) Gait impairment scores of TDP-43Tg/Tg mice treated with vehicle/GW4869 and negative control/Pikfyve ASO. Unpaired t-test at each time point. Mean ± SEM.
(H) Hindlimb clasping of AAV-eGFP-(GR)100 mice treated with negative control/Pikfyve ASO. Unpaired t-test at each timepoint. Mean ± SEM.
(I) Survival of AAV-(GR)100 mice treated with negative control/Pikfyve ASO. Log-rank test.
We next examined C9ORF72 disease processes using an AAV-GR100-GFP mouse model49. AAV-GR100-GFP-infected mice displayed GFP+/poly(GR)+ cells in the cortex, whereas AAV-GFP-infected mice only possessed GFP+/poly(GR)- cells (Figure S6Q). Pikfyve ASO treatment at P4 and P30 reduced hindlimb clasping and extended median survival of AAV-GR100- GFP mice by at least 60% beyond day 57, the last time point tested (Figure 6H, I).
Pikfyve suppression reduces TDP-43 and C9ORF72 pathology and neurodegeneration in vivo
Pikfyve ASO treatment lowered cytoplasmic pTDP-43+ (Ser403/404) punctae and pTDP-43 levels, reduced TDP-43 mislocalization, and fully prevented the loss of large neurons in the spinal cord ventral horn at day 21, and GW4869 blocked these therapeutic effects (Figure 7A–F; Figure S7A, B, Data S1).
Figure 7. Pikfyve suppression reduces TDP-43 and C9ORF72 pathology and neurodegeneration in vivo.

(A-B) Images/quantification of large, NeuroTrace (Nissl)+ lateral motor column (LMC) neurons in the lumbar spinal cord in WT/TDP-43Tg/Tg mice treated with vehicle/GW4869 and negative control/Pikfyve ASO. Data points = the average number of NeuroTrace+ LMC neurons/ventral horn hemicord section for one mouse. One-way ANOVA. Mean ± SEM. Red dotted line = the LMC region.
(C-F) Immunostaining/quantification of pTDP-43+ (Ser403/404) punctae in large TUJ1+ neurons in the spinal cord ventral horn from WT/TDP-43Tg/Tg mice treated with vehicle (C-D) or GW4869 (E-R) and negative control/Pikfyve ASO. Data points = the average number of pTDP-43+ punctae in TUJ1+ neurons/μm2 for one mouse. One-way ANOVA. Mean ± SEM. Solid/dotted lines outline the cell body/nucleus. Arrows mark pTDP-43+ punctae.
(G-H) Immunostaining of total TDP-43 in large TUJ1+ neurons in the ventral horn of WT/TDP-43Tg/Tg mice treated with negative control/Pikfyve ASO. Data points = the average nuclear:cytoplasmic TDP-43 ratio in TUJ1+ neurons for one mouse. One-way ANOVA. Mean ± SEM. Solid/dotted lines outline the cell body/nucleus.
(I-J) Immunostaining/quantification of pTDP-43+ (Ser403/404) punctae in IBA1+ microglia in the spinal cord ventral horn from WT/TDP-43Tg/Tg mice treated with negative control/Pikfyve ASO. Data points = the average number of pTDP-43+ punctae in IBA1+ microglia/μm2 for one mouse. One-way ANOVA. Mean ± SEM. Solid lines outline the cell body. Arrows mark pTDP-43+ punctae.
(K-L, O-P) Representative images and quantification of large NeuroTrace+ LMC neurons in the lumbar spinal cord in 10-month-old Pikfyve+/+;WT, Pikfyve+/−;WT, Pikfyve+/+;TDP-43Tg/+ and Pikfyve+/−; TDP-43Tg/+ mice (K-L) or day 26 AAV-eGFP or AAV-eGFP-(GR)100 mice treated with negative control/Pikfyve ASO (O-P). Data points = the average number of large NeuroTrace+ LMC neurons/ventral horn hemicord section for one mouse. One-way ANOVA. Mean ± SEM. Red dotted line = the LMC region.
(M-N) Immunostaining/quantification of pTDP-43+ (Ser409/410) punctae in large TUJ1+ neurons in spinal cord ventral horn from 10-month-old Pikfyve+/+;WT, Pikfyve+/−;WT, Pikfyve+/+;TDP- 43Tg/+ and Pikfyve+/−; TDP-43Tg/+ mice. Data points = the average number of pTDP-43+ punctae/μm2 in TUJ1+ neurons for one mouse. One-way ANOVA. Mean ± SEM. Solid/dotted lines outline the cell body/nucleus, respectively. Arrows mark pTDP-43+ punctae.
Beyond the ventral spinal cord, Pikfyve ASO administration reduced pTDP-43+ punctae in dorsal spinal cord neurons and CTIP2+ layer V neurons in the motor cortex in TDP-43 mice (Figure S7C, D). In the caudal putamen, neurons did not display elevated pTDP-43+ punctae in TDP-43 mice and Pikfyve ASO treatment did not alter neuronal pTDP-43+ punctae levels (Figure S7E). Therefore, Pikfyve suppression ameliorates TDP-43 pathology in multiple regions of the CNS without spreading pathology to neurons in surrounding areas.
In contrast to neurons, microglia displayed more pTDP-43+ punctae after Pikfyve ASO treatment, suggesting they received the pTDP-43 exocytosed from neighboring neurons (Figure 7I, J). Consistent with this, iPSC-derived microglia exposed to exosomes harvested from apilimod-treated C9ORF72 ALS/FTD iMNs displayed a large increase in pTDP-43+ (Ser409/410) punctae and amoeboid morphology within 24 hours (Figure S7F–H). By 96 hours, the pTDP-43+ punctae and amoeboid morphology decreased significantly, suggesting that microglia can take up and clear the pTDP-43 secreted from ALS neurons and that changes in microglial morphology are transient and reversible. (Figure S7F–H). Pikfyve ASO treatment did not increase the number of microglia or astrocytes in control or TDP-43 mice, and in fact reduced microgliosis in TDP-43 mice, indicating that activation of exocytosis did not stimulate gliosis (Figure S7I, J).
To examine efficacy over a longer disease course, we employed TAR4 mice, which express less human TDP-43 and develop neurodegeneration at 10 months instead of 1 month48. To reduce Pikfyve expression by 50%, we crossed TAR4 mice with Pikfyve-flox mice harboring a ubiquitous Cre driver46. At 10 months, Pikfyve+/−;TAR4 mice possessed more large ventral horn neurons and fewer pTDP-43+ (Ser409/410) punctae in these neurons than Pikfyve+/+;TAR4 mice (Figure 7K–N). With respect to C9ORF72 disease processes, Pikfyve ASO treatment ameliorated the loss of large ventral horn neurons in AAV-GR100-GFP mice at day 26 (Figure 7O, P).
Severe reduction in PIKFYVE activity can lead to enlarged LAMP1+ vacuoles that might drive cytotoxicity10,50. However, we did not observe abnormalities in the number of RAB7+ late endosomes, percentage of large LAMP1+ lysosomes, or number of LC3+/LAMP1+ vesicles in Pikfyve ASO-treated mice with ~50% reduced PIKFYVE levels or 10-month-old Pikfyve+/− mice (Figure S6G; S7K–M, O). Pikfyve ASO treatment did not affect TFEB localization in the brain (Figure S7N; Data S1). Moreover, apilimod-treated iMNs in the middle of the in vitro survival assay (day 8) did not display increased LAMP1+ punctae (Figure S7P).
Discussion
Further investigation could increase the therapeutic implications of our findings. PIKFYVE inhibition provides one means to stimulate exocytosis of pathological proteins, but other mechanisms that stimulate exosome formation and release may provide unforeseen advantages. It will also be important to determine if PIKFYVE inhibition-induced exocytosis can clear other disease-associated proteins. With regard to safety, Pikfyve heterozygous mice are healthy and reduction of PIKFYVE activity does not become cytotoxic until it is more severely reduced10,50. A recent study suggests that prions induce vacuolization in neurons by reducing PIKFYVE activity50. Although vacuolization only emerged after severe reduction of PIKFYVE and the contribution of vacuolization to neuron viability was not determined, it would be important to consider these data during therapeutic development50. The unusually broad efficacy we observed across models of different forms of ALS merit further investigation into this unconventional protein clearance mechanism and its potential as a therapeutic approach.
Limitations of the study
It will be important to determine if stable PIKFYVE suppression or transient PIKFYVE inhibition, such as that induced by ASO or small molecule treatment, respectively, is most efficacious. Stable PIKFYVE suppression may provide better protection against spreading of pathology after secretion if it prevents uptake of extracellular TDP-43 or DPRs by other neurons, which it does for tau and alpha-synuclein51,52.
STAR METHODS
RESOURCE AVAILABILITY
Lead contact
Further information and requests for resources and reagents should be directed to and will be fulfilled by the lead contact, Justin Ichida (ichida@usc.edu).
Materials availability
Human iPSC lines used in this study are available from the Ichida lab at the University of Southern California (https://ichidalab.usc.edu/).
Data and code availability
The bulk RNA-sequencing data generated as part of this study are available at the Gene Expression Omnibus. Accession numbers are listed in the key resources table and the output of the analyses are available upon request. Original western blot images are included in Supplemental Data S1. The mass spectrometry raw data is provided in Supplemental Table S3.
All code used in this study is available from the lead contact upon request.
Any additional information required to reanalyze the data reported in this work paper is available from the Lead Contact upon request.
Key resources table
| REAGENT or RESOURCE | SOURCE | IDENTIFIER |
|---|---|---|
| Antibodies | ||
| TSG101 (mouse IgG1) | BD Transduction Laboratories™ | 612697 |
| TUJ1 (Mouse IgG2a, κ) | Biolegend | MMS-435P |
| LC3 (Rabbit IgG) | MBL | PM036 |
| P62 (Mouse IgG1, κ) | BD Transduction | 610832 |
| OPTN (Rabbit IgG) | Proteintech | 10837-1-AP |
| Phospho-TDP43(Ser409/410) (Rabbit IgG) | Proteintech | 22309-1-AP |
| PIP5K3 (Rabbit IgG) | Proteintech | 13361-1-AP |
| TFEB (Rabbit IgG) | Bethyl Laboratories® | A303-673A |
| Phospho-TFEB (Ser142) (Rabbit IgG) | Sigma-Aldrich | ABE1971-I-25UL |
| Huntingtin (Rabbit IgG) | Abcam | ab109115 |
| alpha Synuclein (Rabbit IgG) | Invitrogen | PA5-85791 |
| Fibrillarin (Rabbit IgG) | Abcam | ab166630 |
| HSP90 (Rabbit IgG) | Proteintech | 13171-1-AP |
| GR repeat (Rabbit IgG) | Proteintech | 23978-1-AP |
| PR repeat (Rabbit IgG) | Proteintech | 23979-1-AP |
| GA repeat (Rabbit IgG) | Proteintech | 24492-1-AP |
| TDP43 (Rabbit IgG) | ProteinTech | 10782-2-AP |
| Poly-GA (Mouse IgG) | Milipore | MABN889 |
| LysoSensor™ Green DND-189 | Invitrogen | L7535 |
| LysoTracker™ Deep Red | Invitrogen | L12492 |
| LC3B (Rabbit IgG) | Abcam | ab192890 |
| LAMP1 (Mouse IgG) | Abcam | ab25630 |
| CD63 (mouse IgG1, κ) | BD Transduction Laboratories™ | 556019 |
| RAB7 (Rabbit IgG) | Abcam | ab137029 |
| Phospho-TDP43(Ser409/410) (Rabbit IgG) | Cosmo Bio | CAC-TIP-PTD-P07 |
| Alexa Fluor® 647 Anti-LC3B antibody | Abcam | ab225383 |
| FUS (Goat IgG) | Bethyl Laboratories® | A303-839A |
| IBA1 (Goat IgG) | Abcam | ab5076 |
| MAP2 (Chicken IgY) | Abcam | ab5392 |
| TUJ1/Tubb3 (Mouse IgG) | Neuromics | CH23005 |
| NeuN (Mouse IgG) | Millipore | MAB377 |
| ChAT (Goat polyclonal) | Millipore Sigma | AB144P |
| Phospho TDP43(Ser403/404) (Mouse IgG2a) | ProteinTech | 66079-1-Ig |
| LAMP1 (Rabbit IgG) | Abcam | ab24170 |
| RAB7 (Mouse IgG1 κ) | Santa Cruz | sc-376362 |
| LC3B (Mouse IgG2a) | GeneTex | GT3612 |
| GFP (Chicken IgY) | Aves Lab | GFP-1010 |
| GFAP (Rabbit IgG) | Abcam | ab7260 |
| Iba1 (Rabbit IgG) | GeneTex | GT101495 |
| DAPI | Thermo Fisher | 62248 |
| NeuroTrace™ 500/525 Green Fluorescent Nissl Stain | Thermo Fisher | N21480 |
| Goat anti-Chicken IgY (H+L) Cross-Adsorbed Secondary Antibody, Alexa Fluor™ Plus 405 | Thermo Fisher | A48260 |
| Donkey anti-Rabbit, IgG (H+L) Highly Cross-Adsorbed, Alexa Fluor® 488 | Invitrogen | A-21206 |
| Donkey anti-Mouse,IgG (H+L) Highly Cross-Adsorbed, Alexa Fluor® 555 | Invitrogen | A31570 |
| Donkey anti-Mouse, IgG (H+L) Highly Cross-Adsorbed, Alexa Fluor® 488 | Invitrogen | A21202 |
| Donkey anti-Mouse, IgG (H+L) Highly Cross-Adsorbed, Alexa Fluor® 647 | Invitrogen | A32787 |
| Donkey Anti-Chicken IgY (IgG) (H+L) Alexa Fluor® 647 | Jackson ImmunoResearch | 703-605-155 |
| Goat anti-Chicken IgY (H+L) Cross-Adsorbed Secondary Antibody, Alexa Fluor Plus 488 | Invitrogen | A32931TR |
| Donkey anti-Goat, IgG (H+L) Highly Cross-Adsorbed , Alexa Fluor 555 | Invitrogen | A32816 |
| IRDye® 680RD Donkey anti-Rabbit IgG Secondary Antibody | LI-COR Biosciences | 926-68073 |
| IRDye® 800CW Donkey anti-Mouse IgG Secondary Antibody | LI-COR Biosciences | 926-32212 |
| CFSE dye | Thermo | C34554 |
| Chemicals, peptides, and recombinant proteins | ||
| DMEM | Gibco | 11995-065 |
| Opti-MEM | Gibco | 31985-070 |
| FBS | GenClone | 25-514 |
| Trypsin | GenClone | 25-510 |
| Polybrene (Hexadimethrine bromide) | Sigma | H9268-5G |
| DMEM/F12 | Corning | 10-090-CV |
| Laminin | Invitrogen | 23017015 |
| Glutamax | Gibco | 35050-061 |
| N2 | Gibco | 17502048 |
| B27 | Gibco | 17504044 |
| Human FGF-beta | Peprotech | 100-18B |
| Repsox | Selleckchem | S7223 |
| human CNTF | R&D | 257-NT |
| human BDNF | R&D | 248BDB |
| human GDNF | R&D | 212-GD |
| Matrigel | Corning | 354277 |
| mTeSR | StemCell | 85851 |
| Accutase | Innovative Cell Technologies | AT4104 |
| Y-27632 2HCl | selleckchem | S1049 |
| Lenti-X concentrator | TaKaRa | 631232 |
| Polybrene (Hexadimethrine bromide) | Sigma | H9268-5G |
| Neurobasal-A | Life Technologies | 10888-022 |
| Apilimod | achemblock | O33822 |
| GW 4869 (hydrochloride hydrate) | Cayman Chemicals | 13127 |
| SB431542 | Cayman Chemical | 13031 |
| CHIR99021 | Cayman Chemical | 13122 |
| Retinoic Acid | Millipore Sigma | R2625 |
| DMH1 | selleckchem | S7146 |
| Purmorphamine | Cayman Chemical | 10009634 |
| Donor Equine Serum | HyClone | 16777-030 |
| BMP4 | Invitrogen | PHC9534 |
| VEGF | Invitrogen | PHC9394 |
| SCF | Miltenyi | 130-096-692 |
| X-VIVO15 | SLS (Lonza) | LZBE02-060F |
| M-CSF | Invitrogen | PHC9501 |
| IL-3 | Invitrogen | PHC0033 |
| 2-mercaptoethanol | Gibco | 21985023 |
| IL-34 | Biolegend | 577906 |
| Bafilomycin A1 | Cayman | 11038 |
| HEPES Stock Solution (1 M) | Cayman | 600212 |
| Citrate Buffer pH 6.0 | Electron Microscopy Sciences (EMS) | 64142-07 |
| Normal Donkey Serum | VWR | 102644-006 |
| cOmplete™, EDTA-free Protease Inhibitor Cocktail | Roche | 4693132001 |
| PhosSTOP™ | Roche | 4906845001 |
| Chameleon® Duo Pre-stained Protein Ladder | Licor | 928-60000 |
| Odyssey® One-Color Protein Molecular Weight Marker | Licor | 928-40000 |
| MEM media | Life Technologies | 10370088 |
| Urea | Sigma | U5378-100G |
| Thiourea | Sigma | T8656-50G |
| CHAPS | Sigma | 10810118001 |
| Tris-HCl 1.5M, pH=8.8 | Teknova | T1588 |
| Penicillin-streptomycin 50X | Corning | 30-001-CI |
| Compound E | Cayman Chemicals | 15579 |
| PEG 6000 | Sigma-Aldrich | 81253 |
| Experimental models: Cell lines | ||
| ND03231 (CTRL1) | NINDS Biorepository | 3231 |
| ND05280 (CTRL2) | NINDS Biorepository | 5280 |
| ND03719 (CTRL3) | NINDS Biorepository | 3719 |
| ND00184 (CTRL4) | NINDS Biorepository | 00184 |
| ND41865 (CTRL5) | NINDS Biorepository | 41865 |
| ND06769 (C9-ALS 1) | NINDS Biorepository | 6769 |
| ND10689 (C9-ALS 2) | NINDS Biorepository | 10689 |
| ND12099 (C9-ALS 3) | NINDS Biorepository | 12099 |
| ND50000 (C9-ALS 4) | NINDS Biorepository | 50000 |
| ND10739 (sALS1) | NINDS Biorepository | 10739 |
| ND13454 (sALS2) | NINDS Biorepository | 13454 |
| ND11813 (sALS3) | NINDS Biorepository | 11813 |
| ND09711 (sALS4) | NINDS Biorepository | 9711 |
| ND14185 (sALS5) | NINDS Biorepository | 14185 |
| ND08705 (sALS6) | NINDS Biorepository | 8705 |
| ND09292 (sALS7) | NINDS Biorepository | 9292 |
| ND09329 (sALS8) | NINDS Biorepository | 9329 |
| ALS93E (sALS9) | This Manuscript | N/A |
| ND35663 (FUS H517Q) | NINDS Biorepository | 35663 |
| ND39034 (FUS R522R) | NINDS Biorepository | 39034 |
| ND50007 (TDP-43 G298S) | NINDS Biorepository | 50007 |
| Experimental models: Animal Models | ||
| C. elegans: TDP-43A315T | Parker lab | N/A |
| Drosophila: Wild type (w1118) | Zarnsecu and Dickman labs | N/A |
| Drosophila: GR.100 larvae (w;OK6-Gal4/UAS-100xGR) | Dickman lab | N/A |
| Drosophila: w1118 ; UAS-TDP-43G298S- YFP | Zarnescu lab | N/A |
| Drosophila: y[1]v[1]; P{Y[+(7.7) = GSYP}attP2 | Bloomington Drosophila Stock Center | BDSC # 8622 |
| Drosophila: y[1] sc[*] v[1]; P{y[+t7.7] v[+t1.8]=TRiP.GL00246}attP2 | Bloomington Drosophila Stock Center | BDSC # 35793 |
| Drosophila: P{UAS-poly-GR.PO-100}attP40 | Bloomington Drosophila Stock Center | BDSC#58696 |
| Mice: TDP-43 transgenic mice | Jackson Laboratory | 012836 |
| Mice: B6.Cg-PIKFYVE<tm1.1Ashi>/J | Jackson Laboratory | 029331 |
| Mice: B6.C-Tg(CMV-Cre)1Cgn/J | Jackson Laboratory | 006054 |
| Mice: C57BL/6J mice | Jackson Laboratory | 000664 |
| Oligonucleotides | ||
| sgRNA-1 targeting upstream of repeat expansion | This Manuscript | GUAACCUACGGUGUCCCGCU |
| sgRNA-2b targeting downstream of repeat expansion | This Manuscript | ACCCCAAACAGCCACCCGCC |
| Primer 1 for repeat primed PCR | This Manuscript | FAM-tgtaaaacgacggccagtCAAGGAGGGAAACAACCGCAGCC |
| Primer 2 for repeat primed PCR | This Manuscript | caggaaacagctatgaccGGGCCCGCCCCGACCACGCCCCGGCCCCGGCCCCGG |
| Primer 3 for repeat primed PCR | This Manuscript | caggaaacagctatgacc |
| Forward primer for Southern Probe | This Manuscript | AGAACAGGACAAGTTGCC |
| Reverse primer for Southern Probe | This Manuscript | AACACACACCTCCTAAACC |
| qPCR primer for RAB27A, Forward | This Manuscript | AGAGGCCAGAGAATCCACCT |
| qPCR primer for RAB27A, Reverse | This Manuscript | CACACCGTTCCATTCGCTTC |
| qPCR primer for HPRT, Forward | This Manuscript | GACTTTGCTTTCCTTGGTCAG |
| qPCR primer for HPRT, Reverse | This Manuscript | GGCTTATATCCAACACTTCGTGGG |
| qPCR primer for VAMP7, Forward | This Manuscript | CGGTTCAAGAGCACAGACAGCA |
| qPCR primer for VAMP7, Reverse | This Manuscript | ATCCACTTGGGCTTGAGTCTCC |
| qPCR primer for RAB8A, Forward | This Manuscript | TCAGGAACGGTTTCGGACGATC |
| qPCR primer for RAB8A, Reverse | This Manuscript | GCTCCTCAATGTTGCGAATCCAG |
| qPCR primer for HSP8A, Forward | This Manuscript | TCCTACCAAGCAGACACAGACC |
| qPCR primer for HSP8A, Reverse | This Manuscript | CAGGAGGTATGCCTGTGAGTTC |
| qPCR primer for NSMAF, Forward | This Manuscript | GTCTGAACACCTTCACGAGTGG |
| qPCR primer for NSMAF, Reverse | This Manuscript | CTGTTCAAGTCTACACCTCCTTC |
| qPCR primer for ATG7, Forward | This Manuscript | CGTTGCCCACAGCATCATCTTC |
| qPCR primer for ATG7, Reverse | This Manuscript | CACTGAGGTTCACCATCCTTGG |
| qPCR primer for MCOLN1, Forward | This Manuscript | CTGATGCTGCAAGTGGTCAAG |
| qPCR primer for MCOLN1, Reverse | This Manuscript | GGTGTTCTCTTCCCGGAATGTC |
| qPCR primer for GORASP1, Forward | This Manuscript | CACGGGGATGTGGAACCATC |
| qPCR primer for GORASP1, Reverse | This Manuscript | ATCAGCTTCAAGGGCTTCCC |
| qPCR primer for SMPD3, Forward | This Manuscript | GAAGCACACCTCAGGACCAAAG |
| qPCR primer for SMPD3, Reverse | This Manuscript | CAGCCAGTCCTGAAGCAGGTC |
| qPCR primer for PIKFYVE, Forward | This Manuscript | GGCTCACGCCTATAATCCTATC |
| qPCR primer for PIKFYVE, Reverse | This Manuscript | GCTGGAATGCAATGGTGTAATC |
| qPCR primer for GAPDH, Forward | This Manuscript | CGAGATCCCTCCAAAATCAA |
| qPCR primer for GAPDH, Reverse | This Manuscript | GTCTTCTGGGTGGCAGTGAT |
| qPCR primer for MAP2, Forward | This Manuscript | GGAACCAACTCTCTCTGGATTT |
| qPCR primer for MAP2, Reverse | This Manuscript | GCATTCTCTCTTCAGCCTTCT |
| qPCR primer for truncated STMN2, Forward | This Manuscript | GGACTCGGCAGAAGACCTTC |
| qPCR primer for truncated STMN2, Reverse | This Manuscript | GCAGGCTGTCTGTCTCTCTC |
| qPCR primer for Pikfyve, Forward (exon 6) | This Manuscript | GAAGCAATATTGGATGCCAGA |
| qPCR primer for Pikfyve, Reverse (exon 6) | This Manuscript | CCCATAAATTTTCCAGGGATT |
| qPCR primer for Pikfyve, Forward | This Manuscript | ACAGTGCTGAAGAAGGGCTC |
| qPCR primer for Pikfyve, Reverse | This Manuscript | ACAGATCAGGGCTCTTCCCT |
| qPCR primer for PPIA, Forward | This Manuscript | TCCTGGACCCAAAACGCTCC |
| qPCR primer for PPIA, Reverse | This Manuscript | CCATGGCAAATGCTGGACCA |
| DNA primer for S0 genotyping, Forward | This Manuscript | GTGACTAGTGAACCTAGCACATTG |
| DNA Common primer, TDP-43 genotyping | This Manuscript | TGAAATCCGGGTGGTATTGG |
| DNA WT primer, TDP-43 genotyping | This Manuscript | GGTGAGTTTAACCTTCAAGGGCT |
| DNA Transgene primer, TDP-43 genotyping | This Manuscript | AGCTTGCTAGCGGATCCAGAC |
| DNA primer for S1 genotyping, Forward | This Manuscript | GCCTGAGTTCTGAGAGTGAGTG |
| DNA primer for S2 genotyping, Forward | This Manuscript | CTGAAGCAATATTGGATGCCAGATAGC |
| DNA primer for S3 genotyping, Forward | This Manuscript | GTAAAGGTTGACTTGACTTACATGATAG |
| DNA primer for A1 genotyping, Reverse | This Manuscript | CTATGATGGGAAGAGTGGACAGTC |
| DNA primer for Cre Control, Forward | This Manuscript | CTAGGCCACAGAATTGAAAGATCT |
| DNA primer for Cre Control, Reverse | This Manuscript | GTAGGTGGAAATTCTAGCATCATCC |
| DNA primer for Cre Transgene, Forward | This Manuscript | GCGGTCTGGCAGTAAAAACTATC |
| DNA primer for Cre Transgene, Reverse | This Manuscript | GTGAAACAGCATTGCTGTCACTT |
| Negative control ASO | This Manuscript | mG*mC*mG*mA*mC*T*A*T*A*C*G*C*G*C*A*mA*mU*mA*mU*mG |
| PIKFYVE ASO1 | This Manuscript | mU*mG*mG*mC*mC*T*C*C*T*T*C*T*G*C*T*mC*mU*mC*mU*mC |
| PIKFYVE ASO2 | This Manuscript | mG*mC*mU*mG*mG*T*C*C*A*A*C*T*T*C*C*mA*mC*mU*mC*mA |
| RAB27A ASO | This Manuscript | mG*mA*mA*mA*mC*C*T*C*T*C*C*T*G*C*C*mC*mU*mG*mC*mU |
| VAMP7 ASO | This Manuscript | mC*mU*mA*mG*mG*C*T*A*A*A*C*A*G*G*T*mG*mG*mC*mU*mA |
| RAB8A ASO | This Manuscript | mU*mG*mG*mU*mU*G*A*C*C*T*G*G*T*C*C*mC*mA*mG*mU*mC |
| HSPA8 ASO | This Manuscript | mC*mA*mA*mG*mG*A*A*G*G*T*A*G*T*T*G*mC*mC*mA*mA*mC |
| NSMAF ASO | This Manuscript | mA*mU*mC*mU*mG*C*C*C*T*A*A*G*A*G*A*mA*mU*mA*mG*mC |
| ATG7 ASO | This Manuscript | mG*mU*mU*mG*mA*G*T*G*C*C*A*T*A*C*C*mA*mG*mU*mA*mG |
| MCOLN1 ASO | This Manuscript | mG*mG*mU*mU*mA*G*A*T*G*T*A*C*C*T*T*mC*mA*mC*mA*mU |
| GORASP1 ASO | This Manuscript | mG*mG*mA*mU*mA*G*A*C*C*T*A*G*T*C*A*mG*mG*mU*mA*mG |
| SMPD3 ASO | This Manuscript | mG*mG*mA*mU*mU*G*T*C*A*A*A*A*A*C*A*mG*mU*mC*mC*mC |
| Negative control ASO (in vivo) | This Manuscript | /52MOErC/*/i2MOErC//i2MOErT//i2MOErA//i2MOErT/A*G*G*A*C*T*A*T*C*C*/i2MOErA//i2MOErG//i2MOErG/*/i2MOErA/*/32MOErA/ |
| Pikfyve ASO (in vivo) | This Manuscript | /52MOErG/*/i2MOErC//i2MOErA//i2MOErT//i2MOErC/T*T*G*T*G*G*A*A*C*T*/i2MOErC//i2MOErT//i2MOErC/*/i2MOErC/*/32MOErC/ |
| Deposited data | ||
| Bulk RNA-seq data (DMSO or AP treatment) | This Manuscript | GEO: GSE221015 |
| Bulk RNA-seq data (Negative control or PIKFYVE ASO treatment) | This Manuscript | GEO: GSE221016, GSE221017 |
| Software and Algorithms | ||
| ImageJ | Schneider et al.68 | https://imagej.nih.gov/ij/index.html |
| Prism | Graphpad | https://www.graphpad.com/scientific-software/prism/ |
| Enrichr | Kuleshov et al.60 | https://maayanlab.cloud/Enrichr/ |
EXPERIMENTAL MODELS AND SUBJECT DETAIL
Cell lines
Human iPSC lines were generated by the Ichida lab from lymphoblastoid lines obtained from the NINDS Biorepository (Table S1). Both male and female iPSC lines were used. The iPSCs were maintained in mTeSR1 medium using a feeder-free culture protocol in six-well plates coated with growth factor-reduced Matrigel and iPSCs below passage 25 were used to generate iMNs. iPSCs were cultured at 37 C and 5% CO2 with daily feeding of 2mL mTeSR per well. To ensure consistency, cultures were kept below 90% confluency. Passaging of iPSC colonies was carried out using Accutase (Innovative Cell Technologies) to the desired split ratio.
C. elegans
C. elegans mutants were developed and maintained by the Parker lab as previously described 45. Both male and female worms were used. For motor and histological assessment, age-synchronized L4 worms were transferred to NGM plates and scored daily for paralysis, from day 1 to day 12 of adulthood.
Drosophila
The wild-type, GR.100, and TDP-43 strains were obtained from the Bloomington Drosophila Stock Center and maintained in the Dickman and Zarnescu labs as described in the Methods. Both male and female larvae were used at the third-instar larvae stage for both turning and NMJ assays.
Mouse models
FVB/NJ (Stock No: 001800), and TAR4/4 (Stock No: 012836) mice were obtained from Jackson Laboratory. Mice were housed in standard conditions with food and water ad libitum in the conventional vivarium at the University of Southern California. All animal use and care were in accordance with local institution guidelines of the University of Southern California and the IACUC board of the University of Southern California with the protocol numbers 21099 and 11938.
METHOD DETAILS
iPSC reprogramming
Human lymphocytes from healthy subjects and ALS patients were obtained from the NINDS Biorepository at the Coriell Institute for Medical Research and reprogrammed into iPSCs as previously described 8,11.
Molecular cloning and viral production
The complementary DNA (cDNA) for each iMN factor (Ngn2, Lhx3, Isl1, NeuroD1, Ascl1, Brn2 and Myt1l) and mRFP-GFP-LC3 construct was purchased from Addgene and cloned into the pMXs retroviral expression vector using Gateway cloning technology (Invitrogen). The Hb9::RFP lentiviral vector was also purchased from Addgene (ID: 37081). Viruses were produced as follows. HEK293T cells were transfected in a 10-cm dish at 80–90% confluence with viral vectors containing each iMN factor and viral packaging plasmids (PIK-MLV-gp and pHDM for retrovirus, pPAX2 and VSVG for lentivirus) using polyethylenimine (PEI) (Sigma-Aldrich). The medium was changed 24 hours after transfection. Viruses were harvested at 48 hours and 72 hours after transfection. Viral supernatants were filtered with 0.45-μm filters, incubated with Lenti-X concentrator (Clontech) for 24 hours at 4°C, and centrifuged at 1,500 g at 4°C for 45 minutes. Pellets were resuspended in DMEM plus 10% FBS (200 μL per 10-cm dish of HEK293T) and stored at −80°C.
Conversion of iPSCs into induced motor neurons
iPSCs were first differentiated into fibroblast-like cells to enable efficient retroviral transduction as described 11. Reprogramming of fibroblast-like cells was performed in 96-well plates (5 x 10³ cells/ well) or 13-mm plastic coverslip (3 x 10⁴ cells/ coverslip) that had been pre-coated with 0.1% gelatin (1 hour, room temperature) and laminin (4°C, overnight). Seven iMN factors were added in 100 μL of fibroblast medium (DMEM plus 10% FBS) per 96-well or 500 μL per coverslip with 5 μg/ml polybrene. Cultures were transduced with Hb9::RFP lentivirus after 48 hours transduction with seven iMN factors. On day 5, primary mouse cortical glial cells from P1 ICR pups were added to the transduced cultures in glia medium containing MEM (Life Technologies), 10% donor equine serum (HyClone), 20% glucose (Sigma-Aldrich), and 1% penicillin/streptomycin. On day 6, cultures were switched to N3 medium containing DMEM/F12 (Life Technologies), 2% FBS, 1% penicillin/streptomycin, N2 and B27 supplements (Life Technologies), 7.5 μM RepSox (Selleck), and 10 ng/ml each of FGF, GDNF, BDNF, and CNTF (R&D). The cultures were maintained in N3 with neurotrophic factors (RepSox, FGF, GDNF, BDNF, and CNTF) and changed every other day.
Induced motor neuron survival assay
Hb9::RFP+ iMNs appear between day 13–16 after transduction of iMN factors. The iMN survival assay was initiated on day 17. Starting at Day 17, longitudinal tracking of iMNs was performed using Molecular Devices ImageExpress once every other day for 14–20 days. Tracking of neuronal survival was performed using SVcell 3.0 (DRVision Technologies) or ImageJ. For each neuronal survival assay, iMNs were quantified from three biologically independent iMN conversions per line per condition. Neurons were scored as dead when their soma was no longer detectable by RFP fluorescence. For neurotrophic factor withdrawal conditions, BDNF, GDNF, and CNTF were removed from the culture medium on day 17. For treatment with apilimod, cultures were treated with DMSO or 3 μM apilimod (Achemblock, O33822) after neurotrophic factor withdrawal (starting at day 17). For treatment with GW4869 to block exocytosis, cultures were treated with 10 μM GW4869 (Cayman Chemical, 13127) along with DMSO or 3 μM apilimod after neurotrophic factor withdrawal (starting at day 17). For PIKFYVE ASO treatment, the iMN cultures were pretreated one time with 10 μM ASOs for 48 hours before neurotrophic factor withdrawal on day 17. For Rab27a, VAMP7, ATG7, RAB8A, HSPA8, MCOLN1, GORASP1, and NSMAF ASO treatments, the iMN cultures were pretreated one time with 9 μM ASOs for 24 hours before neurotrophic factor withdrawal (on day 17) and treated with DMSO or 3 μM apilimod starting at day 17. ASO gapmers were designed and produced by IDT. All treatments were maintained for the whole survival assay and the medium was changed every other day. For hazard ratio plots, the hazard rate of the first condition plotted on the far left was used as the control and its hazard rate was set as 1. The red dotted line represents this hazard rate. The hazard rates of all other conditions was divided by this hazard rate to generate the hazard ratios.
CRISPR/Cas9 genome editing of iPSCs
CRISPR/Cas9-mediated genome editing was performed in human iPSCs as previously described, using Cas9 nuclease 8. Single guide RNAs (sgRNAs) targeting both sides of the C9ORF72 intronic hexanucleotide repeat expansion were designed (Key resource table). To generate isogenic control iPSCs by removing the repeat expansion, C9ORF72 ALS/FTD patient iPSCs were transfected with human codon-optimized Cas9 (Addgene ID: 31825), the appropriate gRNA constructs by nucleofection (Lonza) according to the manufacturer’s protocol and the homologous recombination donor vector. The surviving colonies were picked on day 7 after transfection and genotyped by PCR amplification and sequencing the targeted genomic site. Colonies showing removal of the repeat expansion were clonally purified on MEF feeders and the resulting colonies were verified by southern blotting.
C9ORF72 Southern blotting
A 241-bp digoxigenin (DIG)-labeled probe was generated from 100 ng control genomic DNA (gDNA) by PCR reaction using Q5 High-Fidelity DNA Polymerase (NEB) with primers shown in the Key resource table. Genomic DNA was harvested from iPSCs using cell lysis buffer (100 mM Tris-HCl pH 8.0, 50 mM EDTA, 1% w/v sodium dodecyl sulfate (SDS)) at 55 °C overnight and performing phenol:chloroform extraction. A total of 25 µg of gDNA was digested with AflII at 37 °C overnight, run on a 0.8% agarose gel, then transferred to a positive charged nylon membrane (Roche) using suction by vacuum and UV-crosslinked at 120 mJ. The membrane was pre-hybridized in 25 ml DIG EasyHyb solution (Roche) for 3 h at 47 °C then hybridized at 47 °C overnight in a shaking incubator, followed by two 5-min washes each in 2X Standard Sodium Citrate (SSC) and in 0.1% SDS at room temperature, and two 15-min washes in 0.1x SSC and in 0.1% SDS at 68 °C. Detection of the hybridized probe DNA was carried out as described in DIG System User’s Guide. CDP-Star® Chemilumnescent Substrate (Sigma-Aldrich) was used for detection and the signal was developed on X-ray film (Genesee Scientific) after 20 to 40 min.
Repeat primed PCR (RP-PCR)
Genomic DNA was isolated with Qiagen DNeasy Blood & Tissue Kit (cat 69504). 100 ng of genomic DNA was amplified by PCR using primers listed in the Key resource table in a 20 µl PCR reaction consisting of 0.25 mM each of 7-deaza-2-deoxyguanine triphosphate (deaza-dGTP) (NEB), dATP, dCTP and dTTP, 5% DMSO, 1x Qiagen buffer, 1x Taq polymerase (Roche), 1M betaine and 1 µM each of the three primers. During the PCR, the annealing temperature was gradually decreased from 70 °C and 56 °C in 2 °C increments with a 3-min extension time for each cycle. The PCR products were purified using the QiaQuick PCR purification kit (Qiagen) and analyzed using fragment analysis by Genewiz.
Retinoic acid/purmorphamine protocol for iPSC-motor neuron differentiation
Directed differentiation of iPSC motor neurons were generated for large-scale exosome preparations as previously described with slight modifications 53. On day 0, iPSCs were dissociated with Accutase (Life Technologies) into single cell suspension and 300,000 iPSCs were seeded into one well of six-well plate (pre-coated with Matrigel (Corning)) in mTeSR medium (Stem Cell Technologies) with 10 μM Rock Inhibitor (Selleck). On day 1, cultures were switched to Neural Differentiation Medium (NDM) consisting of a 1 to 1 ratio of DMEM/F12 (Corning) and Neurobasal medium (Life Technologies), 0.5x N2 (LifeTechnologies), 0.5x B27 (Life Technologies), 0.1 mM ascorbic acid (Sigma), 1x Glutamax (Life Technologies). 3 μM CHIR99021 (Cayman), 2 μM DMH1 (Selleck) and 2 μM SB431542 (Cayman) were also added. The medium was changed every other day. On day 7, cells were dissociated with Accutase and 4–6 million cells were seeded in a 10-cm dish (pre-coated with Matrigel) in NDM plus 1 μM CHIR99021, 2 μM DMH1, 2 μM SB431542, 0.1 μM Retinoic acid (Sigma), 0.5 μM Purmorphamine (Cayman) and 10 μM Rock Inhibitor. Rock inhibitor was removed on day 9 and the medium was changed every other day. On day 13, cells were dissociated with Accutase and 20 million cells were seeded per well in non-adhesive 6-well plates (Corning) in NDM plus 1 μM Retinoic acid, 1 μM Purmorphamine, 0.1 μM Compound E (Cayman), and 5 ng/ml each of BDNF, GDNF and CNTF (R&D Systems). Cells were used for experiments between days 25–35 of differentiation. The medium was changed every other day.
Isolation of extracellular vesicles with polyethylene glycol
iPSC-derived motor neurons were cultured in non-adhesive 6-well plates. The conditioned medium was harvested 24 hours after DMSO, 3 μM apilimod, 3 μM apilimod with 10 μM GW4869, or 10 μM GW4869 treatment. The harvested medium was centrifuged at 200g for 5 minutes at room temperature to remove cell pellets. The supernatants were collected and centrifuged at 2,000g for 20 minutes at 4°C to remove remaining cell debris 23. The supernatants were collected and centrifuged at 10,000g for 30 minutes at 4°C to remove apoptotic bodies. The obtained supernatants were supplemented with 50% w/v stock solutions of PEG 6000 (Sigma-Aldrich, 81253) and with 1M NaCl to final concentration of 8% PEG and 0.5M NaCl. Samples were mixed gently and incubated at 4°C overnight with rotating. Extracellular vesicles were concentrated by centrifuge at 3,000g at 4°C for an hour. Supernatants were removed and pellets were suspended with PBS. Extracellular vesicle samples were kept in −80°C for long-term storage.
Conversion of iPSCs into microglia
Microglia were generated from human iPSCs as previously described with slight modifications 54. In brief, 4.5 x 10⁶ iPSCs were seeded into a well of an Aggrewell 800 (STEMCELL Technologies) to form embryoid bodies (EBs) in EB medium consisting of mTeSR1 plus BMP4 (Gibco), 50 ng/mL VEGF (Gibco), 20 ng/mL SCF (Miltenyi Biotec), and 10 uM Rock inhibitor (Selleck). A 75% EB medium change was performed daily for 3 days without Rock inhibitor. On Day 4, EBs were transferred to a low-attachment 6-well plate (Corning) and left undisturbed for 3 days. On Day 7, EBs were transferred to a T75 flask pre-coated with growth factor reduced Matrigel (Corning) in X-VIVO15 (Lonza), supplemented with 100 ng/mL M-CSF (Biolegend), 25 ng/mL IL-3 (Biolegend), 1x Glutamax (Life Technologies), 100 U/mL penicillin and 100 μg/mL streptomycin (Gibco), and 55 uM 2-mercaptoethanol (Gibco) and left undisturbed for one week, after which fresh medium added weekly (without replacement). Macrophage precursors began to emerge about 4 weeks, after which cells were collected weekly and flasks replaced with fresh medium. Harvested cells were plated onto plastic coverslips (Thermo Scientific) at 100,000 per cm2 and differentiated into microglia-like cells for 10 days or more in differentiation medium consisting of DMEM/F12 (Corning), 1x N2 (Life Technologies), 100 U/mL penicillin and 100 μg/mL streptomycin (Gibco), 50 uM 2-mercaptoethanol (Gibco), 1x Glutamax (Life Technologies), and 100 ng/mL IL-34 (Biolegend).
Isolation of nuclear and cytoplasmic cell fractions for immunoblotting
Pellet samples treated with DMSO or 3 μM apilimod from control and C9ORF72 ALS/FTD patient MNs were collected. The nuclear and cytoplasmic cell fractions were prepared using the NE-PER™ Nuclear and Cytoplasmic Extraction Reagents (Thermo Scientific™, cat. 78833) according to the manufacturer’s instructions. Briefly, the cell pellets were washed once with PBS and centrifuged at 500g for 3 minutes. The cell pellet was suspended with 200 μl of cytoplasmic extraction reagent I (CER-I) by vortexing for 15 seconds. The suspension was incubated for 10 minutes on ice. 11 μl of cytoplasmic extraction reagent II (CER-I) was added to the suspension and the samples were vortexed for 5 seconds, incubated for 1 minute on ice, vortexed for another 5 seconds, and centrifuged at 16,000g for 5 minutes. The supernatant fraction (cytoplasmic extract) was transferred to a new tube and stored. The insoluble (pellet) fraction was re-suspended with 100 μl of nuclear extraction reagent (NER) and subjected to 4 cycles of vortexing for 15 seconds and incubation on ice for 10 minutes. Then samples were centrifuged at 16,000g for 10 minutes. The supernatant fraction (nuclear extract) was transferred to a new tube and stored.
Isolation of soluble and insoluble cell fractions for immunoblotting
Pellet samples treated with DMSO or 3 μM apilimod from control and C9ORF72 ALS/FTD patient MNs for 24 hours were collected. The soluble (detergent-soluble) and insoluble (urea-soluble) cell fractions were prepared as previously described 55. The cell pellets were washed once with PBS and centrifuged at 300g for 5 minutes. The cell pellets were suspended with 200 μl of cold RIPA buffer (Santa Cruz) with a protease inhibitor cocktail (Roche) and a phosphatase inhibitor cocktail (Roche). The suspension was incubated for 10 minutes on ice and then centrifuged at 15,700g for 30 minutes at 4°C. After centrifuging, the supernatants were collected as the soluble (or detergent-soluble) fractions. The detergent-insoluble pellets were washed once with cold RIPA buffer and suspended with 200 μl of urea buffer, containing 7M urea (Sigma), 2M thiourea (Sigma), 4% (wt/vol) CHAPS (Sigma), 30 mM Tris pH8.5 (Teknova), protease inhibitor cocktail (Roche) and phosphatase inhibitor cocktail (Roche). The samples were sonicated 10 seconds for three times in a sonicator water bath, and centrifuged at 100,000g for 30 minutes at 22°C using TLA-45 rotor. The supernatants were collected to a new tube and stored as the insoluble (or urea-soluble) fractions.
Negative staining transmission electron microscopy
Exosomes were fixed with 4% formaldehyde in PBS. 200-mesh, formvar-filmed copper grids were plasma-treated (Harrick PDC-001; Harrick Plasma, Ithaca, NY) and immediately incubated on a drop of exosomal vesicles for ten minutes. The grid was blotted and immediately placed on a drop of 1% phosphotungstic acid at pH7 for one minute, blotted again and air dried. The samples were imaged in a Zeiss EM10 transmission electron microscope (Zeiss, White Plains, NY) at 80 kV using a Gatan Erlangshen CCD camera (Gatan, Pleasanton, CA).
Correlative Light Electron Microscopy (CL-EM)
C9-ALS1 iMNs were converted on 15 mm Nunc™ Thermanox™ Coverslips (Thermo Scientific™, 174969) pre-coated with 0.1% gelatin (1 hour, room temperature) and laminin (4°C, overnight). iMNs were treated with 3 μM apilimod for 24 hours and fixed with 4% paraformaldehyde (PFA) in 0.25 M HEPES for 1 hour at room temperature, washed with 0.1 M HEPES for three times, permeabilized with 0.1% Triton-X in 0.1 M HEPES for 10 mins at room temperature, blocked with 10% donkey serum in 1% BSA in 0.1 M HEPES for two hours at room temperature, and incubated with primary antibodies (diluted in 1% BSA in 0.1M HEPES) at 4°C overnight. The following antibodies were used: rabbit anti-TDP-43 Polyclonal antibody (Proteintech, 10782-2-AP, 1:200) and mouse anti-CD63 Monoclonal antibody (BD Transduction Laboratories, 556019, 1:100). Cells were then washed with 0.1M HEPES with 0.1% Triton-X for three times and incubated with Alexa Fluor–conjugated secondary antibodies (Life Technologies) (diluted in 1% BSA in 0.1M HEPES) for 2 hours at room temperature. iMNs were stained with DAPI (Life Technologies) for 10 minutes at room temperature and then mounted on slides with Vectashield (Vector Labs). Neuronal area was determined on the basis of the Hb9::RFP signals. High magnification images and z-stack images (fluorescence images) were acquired on an LSM 800 confocal microscope with oil immersion at 63x (Zeiss). Low magnification images (10–20X) were acquired with light microscopy to locate the cell of interest. Cells were fixed with glutaraldehyde and osmium tetroxide, stained with uranyl acetate, dehydrated through graded ethanol, infiltrated with epoxy resin. After polymerizing the block for 18 hours, the cells were separated from the Thermonox coverslip to the block and sectioned into 500 nm sections. The sections were mounted on TEM grid and examined with a transmission electron microscope.
Mass spectrometry analysis of exosomes
10 µg of each sample was reduced for 10 minutes at 50°C with 10 mM DTT and alkylated for 30 minutes at room temperature in the dark with 15 mM iodoacetamide. Proteins were precipitated with 8 volumes of ice-cold acetone and 1 volume of ice-cold methanol 2h at −80°C. The pellets were washed 3 times with 250 µl of cold methanol. Protein pellets were resolubilized in 100 µl of 50 mM Tris pH 8.0 and pre-digested with 0.3 µg of Trypsin/LysC for 3 hours at 37°C with agitation. Another 0.3 µg of Trypsin/LysC was added to the proteins and the digestion was continued overnight at 37°C with agitation. Samples were then acidified with 2% formic acid and the peptides were purified by Strata-X reversed phase SPE (Phenomenex).
Acquisition was performed with a ABSciex TripleTOF 6600 (ABSciex, Foster City, CA, USA) equipped with an electrospray interface with a 25 μm iD capillary and coupled to an Eksigent μUHPLC (Eksigent, Redwood City, CA, USA). Analyst TF 1.8 software was used to control the instrument and for data processing and acquisition. The samples were analyzed in SWATH acquisition mode (data independent acquisition). The source voltage was set to 5.5 kV and maintained at 325oC, curtain gas was set at 45 psi, gas one at 25 psi and gas two at 25 psi. Separation was performed on a reversed phase Kinetex XB column 0.3 μm i.d., 2.6 μm particles, 150mm long (Phenomenex) which was maintained at 60oC. Samples were injected by loop overfilling into a 5μL loop. For the 45 minutes LC gradient, the mobile phase consisted of the following solvent A (0.2% v/v formic acid and 3% DMSO v/v in water) and solvent B (0.2% v/v formic acid and 3% DMSO in EtOH) at a flow rate of 3 μL/min.
SWATH samples were processed using a publicly available ion library (SWATH Atlas). Retention times in the library were recalibrated using known abundant proteins and keratins. Proteins were quantified using a maximum of 10 peptides per protein and 4 MS/MS transitions per peptide. The quantification for a protein represents the sum of the area under the curve (AUC) of all the integrated peptides (max 10) for this protein. The intensity of each sample was normalized against every other sample using the total signal. GO analyses have been done using the Reactome FI plugin of Cytoscape, with only the significant genes.
Western blotting
iPSC-derived motor neurons were collected in RIPA buffer (Santa Cruz) with a protease inhibitor cocktail (Roche). Protein quantity from cell lysates and exosomal samples was measured by the BCA assay (Pierce). Samples were run on a 10% SDS gel, and the proteins were transferred onto Immobilon-FL PVDF Membrane (Millipore). The total protein for each sample was stained by Revert™ 700 Total Protein Stain Kits (LI-COR Biosciences) and quantified. The membrane was blocked with Intercept (TBS) Blocking buffer (LI-COR Biosciences), incubated with primary antibodies overnight at 4°C, washed three times with 0.1% TBS-T, and then incubated with IRDye® 680RD Donkey anti-Rabbit IgG Secondary Antibody or IRDye® 800RD Donkey anti-Mouse IgG Secondary Antibody (LI-COR Biosciences). After washing with 0.1% TBS-T for three times and TBS once, blots were scanned using LI-COR Odyssey CLx imaging system. The following primary antibodies were used: mouse anti-TSG101 (Biosciences, 612697, 1:500), mouse anti-TUJ1 (Biolegend, MMS-435P, 1:2000), rabbit anti-LC3 (MBL, PM036, 1:500), mouse anti-p62 (Biosciences, 610832, 1:1000), rabbit anti-OPTN Polyclonal antibody (Proteintech, 10837-1-AP, 1:500), rabbit anti-phospho-TDP43 (Ser409/410) Polyclonal antibody (Proteintech, 22309-1-AP, 1:500), Rabbit anti-PIP5K3 Polyclonal antibody (Proteintech, 13361-1-AP, 1:300), rabbit anti-TDP-43 Polyclonal antibody (Proteintech, 10782-2-AP, 1:500), mouse anti-poly(GA) Monoclonal antibody (MABN889, Millipore, 1:1000), rabbit anti-TFEB Polyclonal antibody (Bethyl Laboratories, A303-673A, 1:500), rabbit anti-phospho-TFEB (Ser142) Polyclonal antibody (Sigma-Aldrich, ABE1971-I-25UL, 1:500), rabbit anti-Huntingtin Monoclonal antibody (abcam, ab109115, 1:500), rabbit anti-alpha-Synuclein Polyclonal Antibody (Invitrogen, PA5-85791, 1:500), rabbit anti-Fibrillarin Monoclonal antibody (abcam, ab166630, 1:1000) and rabbit anti-HSP90 Polyclonal antibody (Proteintech, 13171-1-AP, 1:1000). The list of antibodies was provided in the Key resource table. The full blots for all experiments are shown in Data S1: The regions shown in the main and supplementary figures were highlighted in red for each blot image. Some membranes were cut before immunoblotting in order to enable blotting with multiple antibodies on the same membranes. Cutting sites are labeled with blue lines. Mr = Odyssey® One-Color Protein Molecular Weight Marker (Licor); Mr Duo = Chameleon® Duo Pre-stained Protein Ladder (Licor).
The quantified values were calculated as the relative intensity of indicated proteins normalized to total protein per sample unless otherwise mentioned. For Figure 3C, 3G, 3I, 3K, S3K and S3O, n=9 independent conversions/condition from three CTRL and three C9-ALS/FTD patients (n=3 per line). For Figure 3L and S3N, n=6 independent conversions/condition from two CTRL and two C9-ALS/FTD patients (n=3 per line). For Figure 3N, 3O, S3Q and S3R, n=11 independent conversions/condition from three CTRL lines and one corrected isogenic line (n=3 for CTRL2, CTRL3 and C9-ALS/FTD1 corrected isogenic line and n=2 for CTRL5) and n=13 from from three C9-ALS/FTD patients (n=6 for C9-ALS/FTD1, n=4 for C9-ALS/FTD2 and n=3 for C9-ALS/FTD3). For Figure 3Q and S3T, n=6 independent conversions/condition from two CTRL (n=3 per line) and n=8 from independent conversions/condition from three C9-ALS/FTD patients (n=2 for C9-ALS/FTD1 and n=3 for C9-ALS/FTD2 and C9-ALS/FTD3). For Figure 3U–V, n=9 independent conversions/condition from three CTRL lines and one corrected isogenic line (n=3 for CTRL2 and n=2 for CTRL3, CTRL5 and C9-ALS/FTD1 corrected isogenic line) and n=8 from independent conversions/condition from three C9-ALS/FTD patients (n=2 for C9-ALS/FTD1 and n=3 for C9-ALS/FTD2 and C9-ALS/FTD3). For Figure S3D, n=8 biological replicates (independent conversions) per condition from three CTRL lines (n=3 for CTRL1 and CTRL2, n=2 for CTRL3) and n=8 biological replicates (independent conversions) per condition from three C9-ALS/FTD patients (n=3 for C9-ALS/FTD1 and C9-ALS/FTD3, n=2 for C9-ALS/FTD2). For Figure S3F, n=6 biological replicates (independent conversions) per condition from two CTRL lines and n=9 biological replicates (independent conversions) per condition from three C9-ALS/FTD patients (n=3 per line). For Figure S3V, n=7 independent conversions/condition from two CTRL and one C9-ALS/FTD1 corrected isogenic line (n=3 for CTRL2 and C9-ALS/FTD1 corrected isogenic line and n=2 for CTRL5) and n=9 from independent conversions/condition from three C9-ALS/FTD patients (n=5 for C9-ALS/FTD2 and n=2 for C9-ALS/FTD1 and C9-ALS/FTD3). For Figure 4D, n=4 independent iMN conversions/condition from two CTRL (n=2 for CTRL2 and CTRL3) and n=7 independent conversions/condition from three C9-ALS/FTD lines (n=3 for C9-ALS/FTD1 and C9-ALS/FTD2, and n=1 for C9-ALS/FTD3). For Figure 4F, n=7 independent conversions/condition from three C9-ALS/FTD patients (n=3 for C9-ALS/FTD1 and C9-ALS/FTD2, and n=1 for C9-ALS/FTD3).
Dipeptide repeat protein expression in iMNs and FACS analysis of GFP+/CFSE+ exosomes
iMNs were generated as described53. At day 25 of differentiation, we performed lentiviral transduction of GP(50)-GFP or GFP using previously-published constructs 56. 3 days after lentiviral transduction of 5–6 embryoid bodies per sample, iMNs were treated with DMSO or 3 µM apilimod for 24-hours and supernatant was harvested. 1 µl of CFSE dye (Thermo, catalog number: C34554) was added to the supernatant and incubated for 20 minutes at room temperature with gentle agitation. GFP+/CFSE+ exosomes were quantified using flow-cytometry gated for particles smaller than cells. n=3 independent differentiations/condition.
Poly(GR) Immunoassay
Poly(GR) levels in concentrated exosome and pellet samples from control and C9ORF72 ALS/FTD patient MNs were measured in a blinded manner using Meso Scale Discovery (MSD) platform based Poly(GR) sandwich immunoassay with custom made affinity purified rabbit polyclonal GR antibodies as previously described with minor modifications 27,28. Biotinylated poly(GR) antibodies at 0.5 ug/ml were coated on MSD Gold 96-well single spot streptavidin plates and incubated overnight at 4°C. After washing and blocking, concentrated exosome samples (40 ul) were loaded on plates in duplicate wells and incubated for 1.5 hrs at room temperature on a shaking platform. After 3-time washes, plates were loaded with 0.5 ug/ml MSD-Gold-Sulfo-tagged poly(GR) detection antibody and incubated for 1 hour at room temperature on a shaking platform followed by three final washes. After adding 1X MSD-Read buffer, plates were immediately read using MSD-QuickPlex SQ 120 reader and data presented as raw electrochemiluminescence (ECL) signals detected from the samples.
For Figure 3R, n=11 biological replicates (independent conversions)/condition from three CTRL lines (n=3 for CTRL2 and n=4 for CTRL1 and CTRL3) and n=7 independent conversions/condition from two C9-ALS/FTD lines (n=3 for C9-ALS/FTD1 and n=4 for C9-ALS/FTD2). For Figure 3S, n=6 biological replicates (independent conversions)/condition from two CTRL lines (n=3 for CTRL2 and CTRL3) and n=9 independent conversions/condition from three C9-ALS/FTD lines (n=3 for C9-ALS/FTD1, C9-ALS/FTD2 and C9-ALS/FTD3). For 3T, n=7 independent conversions/condition from two C9-ALS/FTD patients, n=3 for C9-ALS/FTD1 and n=4 for C9-ALS/FTD2).
mRFP-GFP-LC3 assay
Retrovirus encoded by pMXs-mRFP-GFP-LC3 was transduced into iMN cultures 24 hours before transduction with iMN reprogramming factors. On day 17, iMNs were treated with DMSO or 3 μM apilimod for 24 hours and then fixed with 4% paraformaldehyde at 4°C for 1 hour. The cultures were immunostained with anti-MAP2 antibody to detect motor neurons. Coverslips were imaged on a Zeiss LSM 800 confocal microscope. Quantification was performed using ImageJ.
RNA-seq and pathway analysis
iPSC-derived motor neurons from C9-ALS/FTD patients (C9-ALS/FTD1) were cultured with DMSO or 3 μM apilimod for 24 hours and collected. 3′-Digital gene expression RNA-Seq of all samples was performed by Amaryllis Nucleics. Briefly, mRNA was extracted using the NEBNext Poly(A) mRNA Magnetic Isolation Module according to the manufacturer’s instructions. 3′ RNA-Seq libraries were generated using the 3′-Digital Gene Expression RNAseq Library Kit (Amaryllis Nucleics). Libraries were sequenced on an Illumina NextSeq 500 sequencer. A total of 10 million to 25 million 80-bp, single-end reads were obtained for each sample. Reads were aligned to the Hg38 transcriptome using HISAT2 57. A count table was obtained using FeatureCounts with strand specificity enabled. Differential expression analysis was performed using DESeq2 58,59. The list of differentially expressed genes can be found in the Supplementary Table 2.
KEGG pathway enrichment analysis, transcription factor enrichment analysis (TFEA) and Bioplanet analysis were performed by providing Enrichr with a list of all genes identified by DESeq2 as having a greater than 95% chance of being differentially expressed 60.
iPSC-derived motor neurons from C9-ALS/FTD patients (C9-ALS/FTD1 and C9-ALS/FTD3) were cultured with 10 μM NC ASO or PIKFYVE ASO for 96 hours and collected. mRNA sequencing was performed by Novogene Co., Ltd. (US). Briefly, total RNA was extracted using RNeasy Plus Mini Kit (Qiagen) according to manufacturer’s instructions. Total RNA was then shipped to Novogene Co., Ltd for poly(A) mRNA enrichment and library preparation. Libraries were sequenced on Illumina NovaSeq 6000. A total of 20 million to 40 million 150-bp, paired-end reads were obtained for samples sent. Reads were aligned to the Hg38 transcriptome using STAR 61. Aligned reads were then quantified using Partek E/M with Partek® Flow® software, v10.0 (Partek Inc.). Gene counts were normalized using median ratio with offset by one before performing differential expression analysis using DESeq2 59,62.
Immunocytochemistry
iMNs were fixed in 4% paraformaldehyde (PFA) for 1 hour at 4°C, permeabilized with 0.1% Triton-X for 10 mins at room temperature, blocked with 10% donkey serum in 1% BSA in PBS for two hours at room temperature, incubated with primary antibodies at 4°C overnight. Cells were then washed with 0.1% PBS-T for three times and incubated with Alexa Fluor–conjugated secondary antibodies (Life Technologies) for 2 hours at room temperature. iMNs were stained with DAPI (Life Technologies) for 10 minutes at room temperature and then mounted on slides with Vectashield (Vector Labs). Neuronal area was determined by manual outlining in ImageJ on the basis of the Hb9::RFP signals. Images were acquired on an LSM 800 confocal microscope with oil immersion at 63x (Zeiss). iMNs were quantified from two independent conversion/group for each experiment. The following primary antibodies were used: rabbit anti-GR repeat Polyclonal antibody (Proteintech, 23978-1-AP, 1:50), rabbit anti-PR repeat Polyclonal antibody (Proteintech, 23979-1-AP, 1:50), rabbit anti-TDP-43 Polyclonal antibody (Proteintech, 10782-2-AP, 1:200) and chicken anti-MAP2 antibody (Abcam, ab5392, 1:5000), rabbit anti-GA repeat Polyclonal antibody (Proteintech, 24492-1-AP, 1:50), rabbit anti-TFEB Polyclonal antibody (Bethyl Laboratories, A303-673A, 1:100), rabbit anti-LC3B Monoclonal antibody (Abcam, ab192890, 1:100), mouse anti-LAMP1 Monoclonal antibody (Abcam, ab25630, 1:20), mouse anti-CD63 Monoclonal antibody (BD Transduction Laboratories, 556019, 1:100), rabbit anti-RAB7 Monoclonal antibody (Abcam, ab137029, 1:100), rabbit anti-phospho TDP-43 (pS409/410) Polyclonal antibody (Cosmo Bio, CAC-TIP-PTD-P07, 1:200), goat anti-FUS Polyclonal antibody (Bethyl Laboratories, A303-839A, 1:200) and goat anti-IBA1 Polyclonal antibody (Abcam, ab5076, 1:100). The following dyes and conjugated antibodies were used: LysoSensor™ Green DND-189 (Invitrogen™, L7535, 5 µM), LysoTracker™ Deep Red (Invitrogen™, L12492, 100 nM), Alexa Fluor® 647 Anti-LC3B antibody (Abcam, ab225383, 1:100). The list of antibodies was provided in the Key resource table. To quantify the number of punctae in iMNs and MNs, the number of punctae per area (µm2) was measured with Image J using the find maxima detection tool with noise tolerance=50–100 (depending on the antibodies). To quantify the TDP43, TFEB and FUS signals in iMNs, the fluorescence intensity of the TDP43, TFEB or FUS staining in the cell nucleus and cytoplasm were measured using Image J and recorded as the nuclear to cytoplasmic ratio. To quantify the number of colocalized punctae in MNs, the number of colocalized punctae per area (µm2) was measured with Image J using the spots colocalization (ComDet) tool. To quantify the endogenous LAMP1+ punctae in iMNs, the size of LAMP1+ vesicles < 0.81 μm2 were defined as small LAMP1+ vesicles; while vesicles > 0.81 μm2 were defined as large LAMP1+ vesicles. 75% of LAMP1+ vesicles were < 0.81 μm2 in C9-ALS /FTD iMNs treated with apilimod.
Quantitative real time PCR
Total RNA was extracted from HeLa cells, iPSC-derived motor neurons or mice brain tissue with RNA Extraction Kit (Life Technologies) and reverse transcribed with an Oligo dT primer using a ProtoScript II First Strand Synthesis Kit (NEB). RNA integrity was checked using the NanoDrop 1000 (Thermo). Real-time PCR was performed with iTaq Universal SYBR Green Supermix (Bio-Rad) using primers shown in the Key resource table.
C. elegans paralysis assay on solid media
Standard methods for culturing and handling the worms were used 45,63. Briefly, 40 age-synchronized L4 worms were transferred to NGM plates and scored daily for paralysis, from day 1 to day 12 of adulthood. Animals were counted as paralyzed if they failed to move upon prodding with a worm pick. Worms were scored as dead if they failed to move their head after being prodded on the nose and showed no pharyngeal pumping. All experiments were conducted at 20 C and in triplicate, three times. Some experiments were conducted by dissolving apilimod (1 M) into the NGM plates.
C. elegans neurodegeneration assay
For scoring of neuronal processes for gaps or breakage, worms were selected at day 9 of adulthood for visualization of motor neurons in vivo. Animals were immobilized in 5 mM levamisole dissolved in M9 and mounted on slides with 2% agarose pads. Visualization was done using a Zeiss Axio Imager M2 microscope, using a 10X objective and a 1.0 Optovar. The software used was Zen 2.3 Lite. At least one hundred worms were scored per condition, over 8 distinct experiments.
Drosophila larval turning assay
All stocks and crosses were maintained on standard yeast/cornmeal/ molasses food (25.0 °C using) a 12 hours light and dark cycle unless otherwise noted. The following stocks were used: (i) GAL4 motor neuron driver D42-GAL4 was used to drive the expression of UAS transgenes using the GAL4-UAS bipartite expression system, (ii) w1118 as used as a genetic background control for TDP-43 transgenes, (iii) w1118 ; UAS-TDP-43G298S- YFP used to drive TDP-43 expression in motor neurons was previously described 64. (iv) y[1]v[1]; P{Y[+(7.7) = GSYP}attP2 (Bloomington Drosophila Stock Center (BDSC # 8622)) was used as genetic background control for PIKFYVE RNAi. y[1] sc[*] v[1]; P{y[+t7.7] v[+t1.8]=TRiP.GL00246}attP2, used to knock-down PIKFYVE by RNAi was obtained from the Bloomington Drosophila Stock Center (BDSC # 35793). To model C9ORF72 we used w1118; P{UAS-poly-GR.PO-100}attP40 (BDSC#58696) with y1 w1118; attP40 as genetic background control. RNAi experiments were performed with chronic RNAi expression and Pikfyve suppression. For apilimod experiments, larvae were fed yeast mixed with either solvent (DMSO) or apilimod (10 µM) for 5 days throughout larval development in a chronic treatment paradigm.
Larval turning assays were performed using third instar larvae as previously described 65. Briefly, third instar larvae were placed on a Petri dish filled with a solidified grape juice/agar medium and allowed to accommodate for a few seconds. Larvae were gently turned ventral side up with a clean paintbrush and the time it took for each larva to turn ventral side down and make the first forward movement was recorded. 33 larvae per genotype, per condition were screened for YFP and evaluated for locomotor function. Larval turning data was analyzed with Graphpad Prism9 for statistical significance using Kruskal-Wallis with multiple comparisons.
Drosophila C9ORF72 GR.100 NMJ assay
Drosophila larvae were reared and immunostained as described 16. Wild type (w1118) or GR.100 larvae (w;OK6-Gal4/UAS-100xGR) were reared on individual apple plates at 25°C and fed yeast mixed with either solvent (DMSO) or apilimod (30 µM) for 5 days throughout larval development. Briefly, third-instar larvae were dissected in saline and immunostained with anti-BRP (nc82; Developmental Studies Hybridoma Bank; 1:100) and anti-HRP (Cyanine 3 (Cy3) conjugated; Jackson ImmunoResearch; 1:400). Alexa Fluor 488-conjugated mouse secondary antibody was used at 1:400 (Jackson ImmunoResearch). NMJs were imaged using a Nikon A1R Resonant Scanning Confocal microscope with a 100x APO 1.4 NA oil immersion objective. BRP puncta were quantified using Nikon Elements Software and data was analyzed using Graphpad Prism.
TDP-43 mice
TDP-43 transgenic mice were purchased from the Jackson Laboratory (stock no: 012836). The mouse Thy1 promoter drives the expression of the human TDP-43 gene in neurons. TDP-43 Tg/Tg homozygous mutant mice were generated by crossing TDP-43 Tg/+ heterozygous mice with TDP-43 Tg/+ heterozygous mice. Mice were genotyped using primers listed in the Key resource table. Homozygous mutants were identified by a single band at 500 bp, heterozygotes were identified by bands at 303 bp and 500 bp, and wild types were identified by a single band at 303 bp. Homozygous mutants and their corresponding WT littermate controls were used in the experiments.
ASO Treatment in TDP-43 mice
25 ug of negative control or Pikfyve ASO was administered by intracerebroventricular injection at P1. The ASOs were synthesized by Integrated DNA Technologies (IDT) and contained chemical modifications designed to bolster their efficacy for inhibition of gene expression. Phosphorothioate bonds were added to the sequence to provide protection from degradation by external nucleases and the modified base 2’-O-methoxy-ethyl (MOE) was also added to facilitate increased nuclease stability and binding affinity of the ASO to the mRNA target of interest. To enhance the purity of the ASOs for the in vivo studies, the ASOs were HPLC purified followed by a sodium/salt exchange. Finally, ethanol precipitation was performed to remove any residual chemical impurities. The sequences of the ASOs were listed in the Key resource table (m=2’-O-Methyl, *-phosphorothioate linkage, MOE = 2’-Methoxyethyl).
P1 neonatal mice were anesthetized by placing them on a paper towel lined bucket of ice to induce hypothermia. The injection site targeting the lateral ventricles was defined as the distance of 40% between the lambda (anatomical landmark) and the eye. To perform the intracerebroventricular (ICV) injection, a 900 series Hamilton syringe (10 µL) was adapted with the bottom portion of Neuros model 1701 RN syringe. A 33-gauge needle was inserted 2mM deep perpendicular to the skull surface into the left lateral ventricle. Mice received 3 µl of negative control ASO or Pikfyve ASO in PBS (a total of 25 µg). Within each litter half of the pups received negative control ASO and the other half received Pikfyve ASO. Mice were placed under a heat lamp in a new cage containing soiled bedding from the parental cage and were closely monitored until they had fully recovered. Beginning at P5, mice were administered vehicle (3.75% DMSO in 0.9% normal saline) or 6.7 µg/kg GW4869 by intraperitoneal (IP) injection every other day throughout the remainder of the experiment.
Genetic deletion of Pikfyve in TDP-43 mice
For experiments using genetic deletion of Pikfyve, B6.Cg-PIKFYVE<tm1.1Ashi>/J were purchased from the Jackson Laboratory (stock no: 029331). The Pikfyve-flox mice were established by inserting loxP sites flanking Pikfyve exon 6 (encoding the FYVE finger domain). Removal of the floxed sequence creates a null allele. Mice heterozygous for the floxed allele (Pikfyve +/flox) were bred to germline expressing B6.C-Tg(CMV-Cre)1Cgn/J mice (Jackson lab stock no: 006054) to generate Pikfyve mice with a single allele knockout (Pikfyve +/−). The Pikfyve +/− mice were crossed with TDP-43 Tg/+ to generate Pikfyve +/−;TDP-43 Tg/+. The resulting offspring were then crossed with TDP-43 Tg/+ mice to generate Pikfyve +/−;TDP-43 Tg/Tg mice. Mice were genotyped using several primer pairs according to a previous study (Iknonomov et al, Journal of Biological Chemistry, 2011) and listed in the Key resource table: S0 and A1 generating products of 1232 bp, 1476 bp or 574 bp, for the wild type allele, the floxed allele or the knockout allele, respectively. S1 and A1, generating products of 1063 bp, 1308 bp or 405 bp, for the wild type, the floxed allele or the knockout alleles, respectively. S2 and A1, generating 663 bp product, 852 bp product or no product, for the wild type, the floxed allele or the knockout alleles, respectively; and S3 and A1, generating 208 bp product, 378 bp product or no product, for the wild type allele, the floxed allele or the knockout allele, respectively.
Gait impairment, kyphosis, and tremor analysis
Gait impairment, kyphosis, and tremor were examined starting at 14 days of age (first signs of abnormal movement) and continued until 22 days of age. Phenotype scoring was assessed according to a composite rubric previously reported 66. A score of 0 indicates no phenotype and 4 indicates the most severe phenotype. Statistical significance was calculated by comparing the score at each time point. All investigators were blinded to the genotype and treatment of each experimental group. The humane euthanasia endpoint for the study occurred when the mouse was no longer able to right itself. Hydrogel, powdered pellets, and high caloric diet gel were placed on the bottom of each cage containing TDP-43 mutant mice. The animals were housed in cages under a temperature and humidity-controlled environment and subjected to a standard 12 h light/dark cycle with food and water available ad libitum. All procedures were approved by the Institutional Animal Care and Use Committee of the University of Southern California in accordance with guidelines of the National Institutes of Health.
Cerebrospinal fluid (CSF) Collection
P1 wild type C57BL/6J mice (Jackson laboratory stock number: 000664) were injected by ICV injection with negative control ASO (25 µg) or PIKFYVE ASO (25 µg). Beginning at P3, mice were administered vehicle (3.75% DMSO in 0.9% normal saline) or 6.7 µg/kg GW4869 by intraperitoneal (IP) injection every other day until P7. CSF was collected on P7, 3 hours after the final IP injection. The neonatal mice were placed on a bucket of ice lined with paper towels and were anesthetized by hypothermia. The skull was exposed by a large incision through the flap of skin on top of the scalp. The site of the lateral ventricles was defined as the distance of 40% between the lambda (anatomical landmark) and the eye. The 33-gauge needle was inserted 2 mm deep perpendicular to the skull surface and clear CSF fluid was aspirated.
For the analysis of CSF by mass spectrometry after vehicle (5% Tween 80, 10% N-methyl-2 pyrrolidone, 85% 30 mM citrate buffer in water, pH 3.1) or apilimod treatment, 6–8 week-old female mice were anesthetized and fur was removed from the dorsal lumbar area, extending from L1 to the sacrum. Ophthalmic ointment was placed on the eyes to prevent drying of the cornea. The injection site was disinfected with 70% ethanol using a sterile swab. Using a fingernail, the groove between L5-L6 was located and the needle was inserted at 90° to the spine on the midline and into the groove. The substance (vehicle or apilimod) was slowly injected and the needle left in place for 5–10 sec prior to withdrawal. 10 µL of vehicle or 50 µM apilimod using a 25 µL Hamilton syringe with a 30–32 gauge needle. For CSF collection, mice were anesthetized with tribromoethanol 4 hours after vehicle or apilimod administration. When the plane of anesthesia was reached, CSF was collected through the cisterna magna (~ 1~3 µL/ mouse). All samples were flash frozen on dry ice and then stored in −80°C until shipped to the study sponsor.
Mouse tissue collection
Wildtype or TDP43 Tg/Tg mice (postnatal day1) were treated with 25 ug negative control ASO or Pikfyve ASO via intracerebroventricular injection at postnatal day 1. For tissue collection, P19-P21 mice were anesthetized and intracardiac perfusion was performed with cold PBS. Brains were separated into two hemispheres sagittally. One hemisphere was frozen at −80°C for immunoblotting or RNA analysis. The other brain hemisphere and spinal cords were fixed in cold 4%PFA overnight prior to being cryoprotected in 30% sucrose in PBS+0.01% sodium azide in preparation for immunofluorescence analysis. For CSF collection, ASO injected mice were euthanized at P7.
Histology
Cryoprotected tissues were embedded in O.C.T compound (Fisher Scientific, catalog number 23-730-571) and cryosectioned to 16 um slices using Leica CM3050S cryostat. Sections were stored at −80°C. For immunofluorescence staining with primary antibodies, slides were treated with citrate buffer (pH 6)/0.05% tween-20 for 20 minutes at 80°C prior to antibody staining. All primary antibody stainings were done with 3 overnight incubations at 4°C. Secondary antibody incubation was done at room temperature in the dark for one hour. The list of antibodies was provided in the Key resource table. For NeuroTrace (Fluorescent Nissl Stain, Thermo Fisher Scientific, N21480) staining, the slides were rehydrated in 10x PBS for at least 40 minutes and washed in 1x PBS/0.1% Triton X-100 for 10 minutes. The slides were washed in 1x PBS 2 times for 5 minutes each and then incubated with diluted NeuroTrace (1:50 in PBS) in the dark for 20 minutes. Slides were washed for 10 minutes in PBS/0.1% Triton X-100, 2 x 5 minutes in PBS and 2 hours at room temperature or overnight at 4°C in PBS prior to mounting. To quantify the ventral motor neurons in the lumbar spinal cord, 4–5 sections per animal were stained with NeuroTrace and imaged using a Zeiss LSM 880 at 10x. Both lateral motor column and medial motor column motor neurons in each half spinal cord were quantified and the average total motor neuron counts per hemicord was recorded for individual animals.
To quantify the mislocalization of TDP43 into the cytoplasm, the nuclear:cytoplasmic ratio was measured using a total TDP43 antibody (10782-2-AP, Proteintech, 1:400). The fluorescence intensity of the TDP43 staining in the cell nucleus and cytoplasm were measured using Image J and recorded as the nuclear to cytoplasmic ratio. Motor neurons in the ventral spinal cord were imaged using Zeiss LSM 880 with oil immersion at 63x. 15–25 neurons were quantified per animal. To quantify the phosphorylated and aggregated TDP43+ punctae, brain and spinal cord sections were stained with phospho(Ser403/404)-TDP43 antibody (Proteintech, 66079-1-lg, 1:100) or phospho(Ser409/410)-TDP43 antibody (Cosmo Bio, CAC-TIP-PTD-P07, 1:200) and imaged at 40x with either a Zeiss LSM800 (spinal cord) or LSM880 (brain). The number of phosphorylated-TDP43+ punctae per cytosolic area was measured with Image J using the find maxima detection tool with noise tolerance=70. Neurons and its cell area were identified using Tuj1 antibody staining (Neuromics, CH23005, 1:100) and cell nucleus was identified using DAPI. Only the cytosolic area in neurons were quantified. 15–25 neurons were quantified per animal. To quantify the number of colocalized punctaes, spinal cord sections were stained with rabbit anti-LAMP1 (Abcam, ab24170, 1:100), mouse anti-RAB7 (Santa Cruz, sc-376362, 1:100) and mouse anti-LC3B (GeneTex, GT3612, 1:100) and images at 40x or 64x with a Zeiss LSM800. The number of colocalized punctae per area (µm2) was measured with Image J using the spots colocalization (ComDet) tool. For glial analysis in the spinal cord, numbers of GFAP+ astrocytes (Abcam, ab7260, 1:100) or IBA1+ microglia (GeneTex, GT101495, 1:100) in a 150μm x150μm area of the ventral horn were quantified manually in Image J. The cell density in each ventral horn section was recorded and 4–6 ventral horn sections were quantified for each animal. The average cell density from each animal was used for statistical analysis.
AAV-(GR)100 mouse model
The AAV9-CMV-eGFP-rBG and AAV9-CMV-eGFP-hGR100-rBG were prepared for generating viruses as previously described 49. Intracerebroventricular injection of 2 μL (1 × 10¹⁰ genomes μ l−1) of AAV-eGFP or AA-VeGFP-(GR)100 virus were performed in postnatal day1 (P1) C57BL/6J pups. Postnatal day 4 (P4) mouse pups received 25 μg of NC or Pikfyve ASO by intracerebroventricular injection. Mice were placed under a heat lamp in a new cage containing soiled bedding from the parental cage and were closely monitored until they had fully recovered. The humane euthanasia endpoint for the study occurred when the mouse was no longer able to right itself. The animals were housed in cages under a temperature and humidity-controlled environment and subjected to a standard 12 h light/dark cycle with food and water available ad libitum. All procedures were approved by the Institutional Animal Care and Use Committee of the University of Southern California in accordance with guidelines of the National Institutes of Health. The brain sections were stained with anti-GFP Polyclonal antibody (Aves Lab, GFP-1010, 1:100) and rabbit anti-GR repeat Polyclonal antibody (Proteintech, 23978-1-AP, 1:50). The spinal cord sections were stained with NeuroTrace (Fluorescent Nissl Stain, Thermo Fisher Scientific, N21480).
Hindlimb clasping test
Hindlimb clasping test was examined stating 14 days of age (first signs of abnormal movement) and continued until 26 days of age. Mice were suspended by the tail and hindlimb clasping was observed for 30 seconds. Phenotypic scoring was assessed according to a composite rubric previously reported 67. All investigators were blinded to the genotype and treatment of each experimental group.
QUANTIFICATION AND STATISTICAL ANALYSIS
Statistical analysis and data visualization were performed with the statistical software package GraphPad Prism version 9.1.0. For all experiments, the normal distribution of data sets was tested by the D’Agostino-Pearson omnibus normality test. Differences between two groups were analyzed using a two-tailed Student’s t test, unless the data were non–normally distributed, in which case two-sided Mann-Whitney testing was used. Differences between multiple groups were analyzed using Ordinary one-way ANOVA. P-values were corrected for multiple comparisons using statistical hypothesis testing (Šídák method) unless the data were non–normally distributed for which nonparametric Kruskal-Wallis testing and Dunn’s test (for correcting multiple comparison) were used. Mean and standard error of the mean was used for normally distributed data sets, and the median and interquartile range were used for non–normally distributed data sets. Significance was assumed at p < 0.05. Sample size estimation was performed by power analysis using preliminary data (https://www.stat.ubc.ca/~rollin/stats/ssize/n2.html). Any outliers that were excluded were determined by an outlier ROUT test in GraphPad Prism.
For iMN survival studies, statistical analysis was performed using two-sided log-rank test to account for the events that did not occur (meaning that iMNs that did not degenerate at the end of the survival assay). For each line, iMNs were randomly selected for tracking and used to generate the Kaplan–Meier survival curves. The number of iMNs counted per group was specified in the Kaplan-Meier plot or method section for each survival experiment. The hazard rates were calculated with the Mantel-Haenszel method and statistical analysis was performed with one-way ANOVA. The number of biological replicates (independent conversions) per group was specified in each figure. For immunocytochemistry, iMNs were quantified from two independent conversions per group. The number of iMNs counted per group was specified in each figure. For qRT-PCR, poly(GR) immunoassay and western blotting, the number of biological replicates (independent conversions) was specified in each figure or method section. For animal studies, the number of animals per group was specified in each figure.
Supplementary Material
(A) MAP2 immunostaining of iMNs expressing Hb9::RFP.
(B) Images of Hb9::RFP+ iMNs generated from CTRL/C9-ALS/FTD/sporadic ALS lines at the start of the survival assay.
(C, D) Immunostaining/quantification of endogenous poly(GR)+ (C) or poly(PR)+ (D) punctae in CTRL/C9-ALS/FTD iMNs. Gray circles = the number of nuclear poly(GR)+ or poly(PR)+ punctae/μm2 in one iMN. Mann-Whitney test. Mean ± interquartile range. Solid/dotted lines outline the cell body/nucleus.
(E) Removal of the C9ORF72 repeat expansion by CRISPR-Cas9 editing. Guide RNAs shown as scissors.
(F) Southern blot examining the C9ORF72 repeat length in C9-ALS/FTD1 and its corrected isogenic line. Normal C9ORF72 allele = 3.8 kb band.
(G) Repeat-primed PCR analysis of the repeat expansion in C9-ALS/FTD1 and its isogenic control line.
(H) Quantification of poly(GR)+ and poly(PR)+ punctae in C9-ALS/FTD1 and isogenic control iMNs. Gray circles = the number of nuclear poly(GR)+ or poly(PR)+ punctae/μm2 in one iMN. Unpaired t-test. Mean ± SEM.
(I) Immunostaining/quantification of total TDP-43 in CTRL/C9-ALS/FTD iMNs. Gray circles = the ratio of nuclear:cytoplasmic TDP-43 from one iMN. Mann-Whitney test. Median ± interquartile range. Solid/dotted lines outline the cell body/nucleus.
(J) Images of CTRL, C9-ALS/FTD and sporadic ALS iMNs during the survival assay.
(K) Survival of CTRL/C9-ALS/FTD iMNs (all lines/genotype in aggregate). Log-rank test.
(L) Images of C9-ALS/FTD iMNs during the survival assay when treated with DMSO, apilimod, apilimod+GW4869, or GW4869.
(M) Survival of C9-ALS/FTD iMNs (three lines in aggregate) in DMSO/apilimod. Log-rank test.
(N) Survival curves of C9-ALS/FTD iMNs in DMSO/apilimod. Log-rank test.
(O) PIKFYVE mRNA levels (relative to GAPDH) in HeLa cells treated with indicated ASOs. One-way ANOVA. Mean of three independent ASO treatments/condition ± SEM.
(P) Survival of control/C9-ALS/FTD iMNs treated with indicated ASOs. Log-rank test.
(Q) Survival of CTRL3 and C9-ALS3 treated with negative control ASO/PIKFYVE ASO1. Log-rank test.
(R) Hazard ratio of iMNs from CTRL3 and C9-ALS3 treated with negative control/PIKFYVE ASO1. Mean of independent iMN conversions ± SEM. One-way ANOVA.
(S) Images of muscle and NMJs in wild-type/C9ORF72 GR.100 Drosophila larvae treated with DMSO/apilimod and immunostained with anti-BRP (active zone marker) and anti-HRP (neuronal membrane marker).
(T) Quantification of active zones at NMJs in the indicated genotypes and conditions. Unpaired t-test. Mean ± SEM.
(A) Transcription factor enrichment and KEGG pathway analysis of differentially-expressed genes from RNA-seq data of C9-ALS/FTD iMNs treated with DMSO/apilimod.
(B) Normalized expression (from RNA-seq data) of STMN2 and UNC13A from C9-ALS/FTD iMNs treated with DMSO/apilimod. Unpaired t-test. Mean ± SEM.
(C-D) Immunostaining/quantification of poly(PR)+ (C) and poly(GA)+ (D) punctae in CTRL/C9-ALS/FTD iMNs treated with DMSO/apilimod. Gray circles = the number of nuclear poly(PR)+ or poly(GA) punctae/μm2 in one iMN. Kruskal-Wallis test. Median ± interquartile range. Solid/dotted lines outline the cell body/nucleus.
(A-B) Images/quantification of LC3-mRFP-GFP3 fluorescence in C9-ALS/FTD iMNs in DMSO/apilimod +/− bafilomycin. Gray circles = the number of LC3-GFP+/mRFP+ punctae/μm2 in one iMN. Kruskal-Wallis test. Median ± interquartile range. Solid/dotted lines outline the cell body/nucleus.
(C) Immunostaining/quantification of TFEB in CTRL/C9-ALS/FTD iMNs treated with DMSO/apilimod. Gray circles = the mean intensity of nuclear TFEB (left panel) and the average nuclear:cytoplasmic TFEB ratio (right panel) from one iMN. Kruskal-Wallis test. Median ± interquartile range. Solid/dotted lines outline the cell body/nucleus.
(D) Immunoblots/quantification of phosphorylated (Ser142) TFEB in pellet fractions from CTRL/C9-ALS/FTD iMNs treated with DMSO/apilimod. One-way ANOVA. Mean ± SEM.
(E) Quantification of the “no bafilomycin” conditions from (A). Gray circles = the ratio of LC3-mRFP+/GFP+:total LC3-mRFP+ (LC3-mRFP+/GFP+ and LC3-mRFP+/GFP-) punctae in one iMN. Mann-Whitney test. Median ± interquartile range.
(F) Immunoblots/quantification of LC3 (LC3-I above 15kDa and LC3-II below 15kDa) in pellet fractions from CTRL/C9-ALS/FTD iMNs treated with DMSO/apilimod. One-way ANOVA. Mean ± SEM.
(G) Quantification of the “no bafilomycin” conditions from (A). Gray circles = the number of LC3-mRFP+/GFP- punctae/μm2 in one iMN. Mann-Whitney test. Median ± interquartile range.
(H) Staining/quantification of LysoSensor Green and LysoTracker in C9-ALS/FTD iMNs treated with DMSO or apilimod. Gray circles = the percentage of LysoSensor+ punctae/total LysoTracker+ punctae in one iMN. Kruskal-Wallis test. Median ± interquartile range. Solid/dotted lines outline the cell body/nucleus.
(I) Hazard ratio of CTRL/C9-ALS/FTD iMNs treated with DMSO, apilimod, DMSO+bafilomycin, or apilimod+bafilomycin. Mean of independent iMN conversions ± SEM. One-way ANOVA.
(J) Quantification of (A), the DMSO/apilimod conditions +/− bafilomycin. Gray circles = the number of total LC3-mRFP+ punctae/μm2 in one iMN. Kruskal-Wallis test. Median ± interquartile range.
(K) Quantification of TUJ1 in pellet fractions from CTRL/C9-ALS/FTD iMNs treated with DMSO, apilimod, apilimod+GW4869, or GW4869. One-way ANOVA. Mean ± SEM.
(L) FACS analysis of GFP+/CFSE+ exosomes from CTRL iMNs treated with DMSO/apilimod. Data points = an independently-differentiated culture. Unpaired t-test. Mean ± SEM.
(M) KEGG pathways of differentially-expressed proteins in the exosomal fraction of C9-ALS/FTD iMNs treated with DMSO/apilimod.
(N) Immunoblots/quantification of Huntingtin and alpha-synuclein in exosomal fractions from CTRL/C9-ALS/FTD iMNs treated with DMSO/apilimod. One-way ANOVA. Mean ± SEM.
(O) Ratios of TSG101 and OPTN in the exosomal:cell pellet fractions of CTRL/C9-ALS/FTD iMNs. One-way ANOVA. Mean ± SEM.
(P) Immunoblots of total TDP43 (43kDa) and TSG101 in exosomal fractions from CTRL/C9-ALS/FTD iMNs treated with DMSO, apilimod, apilimod+GW4869, or GW4869.
(Q-R) Quantification of 50kDa and 43kDa pTDP-43 (Ser409/410) in the pellet insoluble (Q) or soluble (R) fraction from Figure 3M. One-way ANOVA. Mean ± SEM.
(S) Immunoblots of Fibrillarin (37kDa) and HSP90 (90kDa) in nuclear or cytoplasmic fractions from CTRL/C9-ALS/FTD iMNs treated with DMSO/apilimod.
(T) Quantification of high molecular weight (HMW, >75kDa), 50 kDa, 43kDa and low molecular weight (LMW, <43kDa) pTDP-43 in the cytoplasmic soluble fraction from Figure 3P. One-way ANOVA. Mean ± SEM.
(U-V) Immunoblots/quantification of total TDP-43 in soluble/insoluble fractions from CTRL/C9-ALS/FTD iMNs treated with DMSO/apilimod. One-way ANOVA. Mean ± SEM.
(A) Survival C9-ALS/FTD iMNs treated with DMSO, apilimod, or apilimod+GW4869. Log-rank test. P-values were not corrected for multiple comparisons.
(B) mRNA levels of RAB27A (relative to HPRT) or other indicated genes (relative to GAPDH) in iMNs treated with negative control ASO or an ASO targeting each gene. Unpaired t-test. Mean ± SEM.
(C) Hazard ratio of CTRL iMNs treated with the ASOs indicated plus DMSO/apilimod. Mean of independent iMN conversions ± SEM. One-way ANOVA.
(D) Immunoblots of TSG101 and pTDP-43 (Ser409/410)(50 kDa) in exosomal fractions from C9-ALS/FTD iMNs treated with DMSO/apilimod plus negative control/RAB27A ASO1.
(E) Quantification of endogenous LC3B+ punctae in CTRL or C9-ALS/FTD iMNs treated with negative control/RAB27A ASO and DMSO/apilimod. Gray circles = the number of LC3B+ punctae/μm2 in one iMN. Kruskal-Wallis test. Median ± interquartile range.
(F) Immunostaining/quantification of endogenous LC3B+/LAMP1+ punctae in CTRL or C9-ALS/FTD iMNs treated with DMSO/apilimod. Gray circles = the number of LC3+/LAMP1+ punctae/μm2 in one iMN. Kruskal-Wallis test. Median ± interquartile range. Solid lines outline the cell body.
(G) Immunostaining/quantification of endogenous LC3B+/CD63+ punctae in CTRL/C9-ALS/FTD iMNs treated with negative control/RAB27A ASO and DMSO/apilimod. Gray circles = the number of LC3B+/CD63+ punctae/μm2 from one iMN. Kruskal-Wallis test. Median ± interquartile range. Solid lines outline the cell body.
(H) Immunostaining/quantification of endogenous RAB7+ punctae in CTRL/C9-ALS/FTD iMNs treated with DMSO/apilimod. Gray circles = the number of RAB7+ punctae/μm2 from one iMN. Kruskal-Wallis test. Median ± interquartile range. Solid/dotted lines outline the cell body/nucleus.
(I) Immunostaining/quantification of endogenous LAMP1+ punctae in CTRL/C9-ALS/FTD iMNs treated with DMSO/apilimod. Gray circles = the percentage of small LAMP1+ vesicles/cell (Left) and large LAMP1+ vesicles/cell (Right) from one iMN. One-way ANOVA. Mean ± SEM. Solid/dotted lines outline the cell body/nucleus.
(J) Quantification of pTDP-43+ (Ser409/410) punctae in CTRL/C9-ALS/FTD iMNs treated with DMSO/apilimod. Gray circles = the number of cytoplasmic pTDP43+ punctae/μm2 (left), the average size (in μm2) of pTDP43+ punctae/neuron (middle) and the average intensity of pTDP43+ punctae/neuron (right) in one iMN. One-way ANOVA (left); Unpaired t-test (middle and right). Mean ± SEM.
(A) Images of sporadic ALS iMNs during the survival assay when treated with DMSO, apilimod, apilimod+GW4869 , or GW4869.
(B) Survival of CTRL iMNs treated with DMSO and eight sporadic ALS (sALS) iMNs treated with DMSO/apilimod. Log-rank test.
(C) Survival of iMNs from sALS9 in DMSO/apilimod. Log-rank test.
(D) Hazard ratios of iMNs from sALS9 treated with DMSO/apilimod. Mean of independent iMN conversions ± SEM. One-way ANOVA.
(E) Hazard ratios of iMNs from three CTRL and six sALS lines in aggregate (sALS1-sALS6) treated with negative control ASO, PIKFYVE ASO1, or ASO2. Mean of independent iMN conversions ± SEM. One-way ANOVA.
(F) Survival of iMNs from two FUS ALS (H517Q, R522R mutation) and TARDBP ALS (G298S mutation) lines treated with DMSO/apilimod. Log-rank test.
(G) Immunostaining/quantification of FUS in iMNs from two CTRL and two FUS ALS (H517Q, R522R mutation) lines treated with DMSO/apilimod. Gray circles = the nuclear:cytoplasmic FUS ratio from one iMN. Kruskal-Wallis test. Median ± interquartile range. Solid/dotted lines outline the cell body/nucleus.
(H) Hazard ratios of iMNs from CTRL, two sporadic ALS, and one FUS-ALS (R522R mutation) lines treated with negative control, VAMP7, or ATG7 ASO plus DMSO/apilimod. Mean of independent iMN conversions ± SEM. One-way ANOVA.
(I) Hazard ratios of iMNs from CTRL and three sporadic ALS lines treated with DMSO, apilimod or apilimod+GW4869. Mean of independent iMN conversions ± SEM. One-way ANOVA.
(J) Survival of iMNs from three sporadic ALS lines treated with DMSO, apilimod, or apilimod+GW4869. Log-rank test.
(K-L) Hazard ratios of iMNs from one CTRL and one TARDBP ALS (G298S mutation) (K) or one FUS ALS (H517Q) line (L) treated with DMSO, apilimod, or apilimod+GW4869. Mean of independent iMN conversions ± SEM. One-way ANOVA.
(M) Survival of iMNs from a FUS ALS (H517Q) and TARDBP ALS line treated with DMSO, apilimod, or apilimod+GW4869. Log-rank test.
(N) Hazard ratios of iMNs from two CTRL lines treated with DMSO and one FUS ALS (R522R mutation) line treated with DMSO, apilimod, DMSO+bafilomycin, or apilimod+bafilomycin. Mean of independent iMN conversions ± SEM. One-way ANOVA.
(O) Images of worms: control, untreated (Top) or apilimod-treated (Bottom) TDP-43A315T transgenics expressing unc-47::GFP in motor neurons. Arrows indicate gaps or breaks along neuronal processes that are scored as neurodegeneration events.
(P) Apilimod delayed paralysis in TDP-43A315T transgenics. Log-rank test. n>200 worms/experiment.
(Q) Apilimod suppressed motor neuron degeneration in TDP-43A315T transgenics. One-way ANOVA.
(A) Fold-change of selected protein levels in adult mouse CSF after intrathecal injection of apilimod compared to vehicle. n=6 and 4 mice for the vehicle- and apilimod-treated group, respectively. Values = the average of two technical replicates/condition/group.
(B) Mating scheme for generation of a single-allele deletion of Pikfyve in TDP-43Tg/Tg mice.
(C) Targeting strategy to disrupt exon-6 of the Pikfyve gene using the Cre-lox system.
(D) Pikfyve mRNA levels in Pikfyve+/−;TDP-43Tg/Tg mouse brain (normalized to Pikfyve+/+;TDP-43Tg/Tg mice) at 15–18 days of age. Unpaired t-test. Mean ± SEM. Data points = one mouse.
(E) Immunoblot of PIKFYVE in whole brains of Pikfyve +/+; WT and Pikfyve +/−; WT mice at P15–18. Unpaired t-test. Mean ± SEM. Data points = one mouse.
(F) Pikfyve mRNA levels (relative to Ppia) in brains of P7 WT mice treated with negative control/Pikfyve ASO at P0. n=3 mice/group. Unpaired t-test. Mean± SEM.
(G) Immunoblot of PIKFYVE levels in whole brains of WT and TDP-43Tg/Tg mice at P20 after treatment with negative control/Pikfyve ASO at P1. Mann-Whitney test. Median ± interquartile range. Data points = one mouse.
(H-I) The kyphosis (H) and tremor scores (I) of Pikfyve+/+;WT, Pikfyve+/−;WT, Pikfyve+/+;TDP-43Tg/Tg and Pikfyve+/−; TDP-43Tg/Tg mice. Unpaired t-test. Mean ± SEM.
(J-K) The kyphosis (J) and tremor scores (K) of WT or TDP-43Tg/Tg mice treated with vehicle and negative control/Pikfyve ASO. Unpaired t-test. Mean ± SEM.
(L-M) The kyphosis (L) and tremor scores (M) of TDP-43Tg/Tg mice treated with vehicle+NC ASO, vehicle+Pikfyve ASO, GW4869+negative control ASO, and GW4869+Pikfyve ASO. Unpaired t-test. Mean ± SEM.
(N-P) The gait impairment (N), kyphosis (O) and tremor (P) scores of WT or TDP-43Tg/Tg mice treated with negative control/Pikfyve ASO. Unpaired t-test. Mean ± SEM.
(Q) Immunostaining of GFP and poly(GR) in the cortex of mice transduced with AAV-eGFP or AAV-eGFP-(GR)100. Rectangle = magnification of the area .
(A) Immunoblot of total TDP-43 levels in whole brains of WT/TDP-43Tg/Tg mice treated with negative control/Pikfyve ASO. One-way ANOVA. Mean± SEM. Data points = one mouse.
(B) Immunoblot of pTDP-43 (Ser409/410) levels in the cytoplasmic fraction of whole brain lysates from TDP-43Tg/Tg mice treated with negative control/Pikfyve ASO. Unpaired t-test. Mean± SEM. Data points = one mouse.
(C-E) Immunostaining/quantification of pTDP-43+ (Ser403/404) punctae in large TUJ1+ neurons in the dorsal spinal cord (C), in layer V neurons in the motor cortex layer (D), in neurons in the caudal putamen (E) from WT/TDP-43Tg/Tg mice treated with negative control/Pikfyve ASO. Solid/dotted lines outline the cell body/nucleus. Arrows mark pTDP-43+ punctae. Data points = the average number of pTDP-43+ punctae in neurons/μm2 for one mouse. (C) One-way ANOVA. Mean ± SEM. (D-E) Kruskal-Wallis test. Mean ± SEM.
(F) Immunostaining of pTDP-43+ (Ser409/410) punctae in CTRL iPSC-derived IBA1+ microglia treated with/without exosomes harvested from C9-ALS/FTD iMNs for 24 or 96 hours. Arrows mark pTDP-43+ punctae in IBA1+ microglia.
(G-H) Quantification of (F). For (G), gray circles = the number of pTDP-43+ punctae in IBA1+ microglia/μm2 in one IBA1+ microglial cell treated with/without exosomes harvested from C9-ALS/FTD iMNs. Kruskal-Wallis test. Median ± interquartile range. For (H), values = the percentage of ramified or amoeboid IBA1+ microglia.
(I) Immunostaining/quantification of IBA1+ microglia in the spinal cord ventral horn of WT or TDP-43Tg/Tg mice treated with negative control/Pikfyve ASO. Data points = the number of IBA1+ microglia/ventral horn section in one mouse. One-way ANOVA. Mean ± SEM.
(J) Immunostaining/quantification of GFAP+ astrocytes in the spinal cord ventral horn of WT or TDP-43Tg/Tg mice treated with negative control/Pikfyve ASO. Data points = the number of GFAP+ astrocytes/ventral horn section in one mouse. One-way ANOVA. Mean ± SEM.
(K-M) Immunostaining/quantification of RAB7+ punctae (K), percentage of large LAMP1+ vesicles (L), or the number of LC3B+/LAMP1+ punctae (M) in large TUJ1+ neurons in the spinal cord ventral horn from WT/TDP-43Tg/Tg mice treated with negative control/Pikfyve ASO. Data points = the average number of RAB7+ punctae/μm2 (K), the percentage of large LAMP1+ vesicles (L), or the number of LC3B+/LAMP1+ punctae (M) in TUJ1+ neurons for one mouse. One-way ANOVA. Mean ± SEM.
(N) Immunoblot of TFEB levels in the nuclear or cytoplasmic fraction of whole brain lysates from TDP-43Tg/Tg mice treated with negative control/Pikfyve ASO. Data points = the nuclear:cytoplasmic TFEB ratio in one mouse. Mann-Whitney test. Mean ± SEM.
(O) Immunostaining/quantification of the percentage of large LAMP1+ vesicles in large TUJ1+ neurons in the spinal cord ventral horn from 10-month-old Pikfyve+/+;WT, Pikfyve+/−;WT, Pikfyve+/+;TDP-43Tg/+ and Pikfyve+/−;TDP-43Tg/+ mice. Solid/dotted lines outline the cell body/nucleus. Arrows mark LAMP1+ punctae. Data points = the percentage of large LAMP1+ vesicles in TUJ1+ neurons for one mouse. One-way ANOVA. Mean ± SEM.
(P) Quantification of LAMP1+ punctae in CTRL and C9-ALS/FTD iMNs treated with DMSO/apilimod. Gray circles = the number of LAMP1+ punctae/μm2 in one iMN. Kruskal-Wallis test. Median ± interquartile range.
(1) C9-ALS/FTD iPSC-derived motor neurons treated with DMSO or 3 μM apilimod for 24 hours (displayed as +apilimod/+DMSO).
(2) C9-ALS/FTD iPSC-derived motor neurons treated with 9 μM NC ASO or PIKFYVE ASO for 3 days (displayed as +PIKFYVE ASO /+NC ASO).
(3) Lysosomal TFEB target genes comparing Apilimod to DMSO
(4) Lysosomal TFEB target genes comparing PIKFYVE ASO to NC ASO
Exosomal fractions from CTRL and C9-ALS/FTD iPSC-derived motor neurons after DMSO or 3 μM apilimod treatment for 24 hours. n=3 independent neuron conversions per condition from one CTRL and one C9-ALS/FTD line. The table included Cellular component (CC) and Biological processes (BP) of gene ontology enrichment analysis of proteins present at significantly different levels in the exosomal fractions of C9-ALS/FTD iPSC-derived motor neurons treated with DMSO or 3 μM apilimod.
TDP-43Tg/Tg mice at day 21 after treatment with a NC ASO (short-tail) or a Pikfyve ASO (long-tail) at P1.
TDP-43Tg/Tg mice at day 21 after treatment with a Pikfyve ASO + vehicle (long-tail) or a Pikfyve ASO + GW4869 (short-tail) at P1.
Highlights.
PIKFYVE inhibition mitigates disease in iPSC and animal models of diverse forms of ALS
PIKFYVE inhibition clears aggregation-prone proteins via exocytosis
Pikfyve suppression reduces pathology and extends survival of ALS mouse models
Chronic reduction of PIKFYVE activity is well-tolerated and efficacious in TDP-43 mice
Acknowledgements
We thank the NINDS Biorepository for providing cell lines. Whole-genome sequencing was provided by the University of Washington Center for Mendelian Genomics, funded by NHGRI/NHLBI grants (UM1HG006493, U24HG008956) and Office of the Director (S10OD021553). The content is solely the responsibility of the authors and does not necessarily represent the official views of the NIH. We thank Helen and Sandy Falk, USC Libraries Bioinformatics Service, the Choi Family Therapeutic Screening Facility, Chris Buser, and Carolyn Marks (USC Core Center of Excellence in Nano Imaging) for bioinformatic and imaging support. This work was supported by NIH grants R00NS077435, R01NS097850, 2R01NS097850, 1R01NS131409, and R44NS097094, US Department of Defense grants W81XWH-15-1-0187, W81XWH-20-1-0424, W81XWH-21-1-0168, and W81XWH-21-1-0131, and grants from the Donald E. and Delia B. Baxter Foundation, the Tau Consortium, the Frick Foundation, the Muscular Dystrophy Association, the New York Stem Cell Foundation, the Alzheimer′s Drug Discovery Foundation, the Association for Frontotemporal Degeneration, the Pape Adams Foundation, the John Douglas French Alzheimer′s Foundation, the Harrington Discovery Institute, the Merkin Family Foundation, the USC Broad Innovation Award, and the SC-CTSI to J.K.I. This work was also supported by NINDS grants (NS111414) to D.K.D, (R01NS091299) to D.C.Z, (R37NS057553, R01NS101986) to F.-B.G., and the Target ALS Foundation (F.-B.G.). J.K.I. is a New York Stem Cell Foundation-Robertson Investigator and the John Douglas French Alzheimer’s Foundation Endowed Associate Professor of Stem Cell Biology and Regenerative Medicine. G.R.L. was supported by a Broad Postdoctoral Fellowship and an NIH Diversity Supplement.
Footnotes
Publisher's Disclaimer: This is a PDF file of an unedited manuscript that has been accepted for publication. As a service to our customers we are providing this early version of the manuscript. The manuscript will undergo copyediting, typesetting, and review of the resulting proof before it is published in its final form. Please note that during the production process errors may be discovered which could a ffect the content, and all legal disclaimers that apply to the journal pertain.
Declaration of Interests
J.K.I. and S.A. are co-founders of AcuraStem, Inc. S.A., W.-H.C., S.M., and S.H. are employees of AcuraStem, Inc. J.K.I. is a co-founder of Modulo Bio, serves on the scientific advisory boards of AcuraStem, Spinogenix, Synapticure, and Vesalius Therapeutics, and is employed by BioMarin Pharmaceutical. B.V.Z. is a co-founder of ZZ Biotech and chairman of its scientific advisory board. J.A.P. is a co-founder of Modelis. F-B. Gao receives research funding from Stealth BioTherapeutics.
Inclusion and Diversity
One or more of the authors of this paper self-identifies as an underrepresented ethnic minority in their field of research or within their geographical location. One or more of the authors of this paper self-identifies as a gender minority in their field of research. One or more of the authors of this paper self-identifies as a member of the LGBTQIA+ community. One or more of the authors of this paper received support from a program designed to increase minority representation in their field of research.
References
- 1.Mejzini R, Flynn LL, Pitout IL, Fletcher S, Wilton SD, and Anthony Akkari P (2019). ALS Genetics, Mechanisms, and Therapeutics: Where Are We Now? Frontiers in Neuroscience 13. 10.3389/fnins.2019.01310. [DOI] [PMC free article] [PubMed] [Google Scholar]
- 2.Pihlstrøm L, Wiethoff S, and Houlden H (2017). Genetics of neurodegenerative diseases: an overview. Handb. Clin. Neurol 145, 309–323. 10.1016/B978-0-12-802395-2.00022-5. [DOI] [PubMed] [Google Scholar]
- 3.Barmada SJ, Skibinski G, Korb E, Rao EJ, Wu JY, and Finkbeiner S (2010). Cytoplasmic mislocalization of TDP-43 is toxic to neurons and enhanced by a mutation associated with familial amyotrophic lateral sclerosis. J. Neurosci 30, 639–649. 10.1523/JNEUROSCI.4988-09.2010. [DOI] [PMC free article] [PubMed] [Google Scholar]
- 4.Sweeney P, Park H, Baumann M, Dunlop J, Frydman J, Kopito R, McCampbell A, Leblanc G, Venkateswaran A, Nurmi A, et al. (2017). Protein misfolding in neurodegenerative diseases: implications and strategies. Transl. Neurodegener 6, 6. 10.1186/s40035-017-0077-5. [DOI] [PMC free article] [PubMed] [Google Scholar]
- 5.Melentijevic I, Toth ML, Arnold ML, Guasp RJ, Harinath G, Nguyen KC, Taub D, Parker JA, Neri C, Gabel CV, et al. (2017). C. elegans neurons jettison protein aggregates and mitochondria under neurotoxic stress. Nature 542, 367–371. 10.1038/nature21362. [DOI] [PMC free article] [PubMed] [Google Scholar]
- 6.Iguchi Y, Eid L, Parent M, Soucy G, Bareil C, Riku Y, Kawai K, Takagi S, Yoshida M, Katsuno M, et al. (2016). Exosome secretion is a key pathway for clearance of pathological TDP-43. Brain 139, 3187–3201. 10.1093/brain/aww237. [DOI] [PMC free article] [PubMed] [Google Scholar]
- 7.Kaushik S, and Cuervo AM (2015). Proteostasis and aging. Nat. Med 21, 1406–1415. 10.1038/nm.4001. [DOI] [PubMed] [Google Scholar]
- 8.Shi Y, Lin S, Staats KA, Li Y, Chang W-H, Hung S-T, Hendricks E, Linares GR, Wang Y, Son EY, et al. (2018). Haploinsufficiency leads to neurodegeneration in C9ORF72 ALS/FTD human induced motor neurons. Nat. Med 24, 313–325. 10.1038/nm.4490. [DOI] [PMC free article] [PubMed] [Google Scholar]
- 9.de Lartigue J, Polson H, Feldman M, Shokat K, Tooze SA, Urbé S, and Clague MJ (2009). PIKfyve regulation of endosome-linked pathways. Traffic 10, 883–893. 10.1111/j.1600-0854.2009.00915.x. [DOI] [PMC free article] [PubMed] [Google Scholar]
- 10.Zolov SN, Bridges D, Zhang Y, Lee W-W, Riehle E, Verma R, Lenk GM, Converso-Baran K, Weide T, Albin RL, et al. (2012). In vivo, Pikfyve generates PI(3,5)P2, which serves as both a signaling lipid and the major precursor for PI5P. Proceedings of the National Academy of Sciences 109, 17472–17477. 10.1073/pnas.1203106109. [DOI] [PMC free article] [PubMed] [Google Scholar]
- 11.Shi Y, Hung S-T, Rocha G, Lin S, Linares GR, Staats KA, Seah C, Wang Y, Chickering M, Lai J, et al. (2019). Identification and therapeutic rescue of autophagosome and glutamate receptor defects in C9ORF72 and sporadic ALS neurons. JCI Insight 5. 10.1172/jci.insight.127736. [DOI] [PMC free article] [PubMed] [Google Scholar]
- 12.Kramer NJ, Haney MS, Morgens DW, Jovičić A, Couthouis J, Li A, Ousey J, Ma R, Bieri G, Tsui CK, et al. (2018). CRISPR-Cas9 screens in human cells and primary neurons identify modifiers of C9ORF72 dipeptide-repeat-protein toxicity. Nat. Genet 50, 603–612. 10.1038/s41588-018-0070-7. [DOI] [PMC free article] [PubMed] [Google Scholar]
- 13.Yamada SB, Gendron TF, Niccoli T, Genuth NR, Grosely R, Shi Y, Glaria I, Kramer NJ, Nakayama L, Fang S, et al. (2019). RPS25 is required for efficient RAN translation of C9orf72 and other neurodegenerative disease-associated nucleotide repeats. Nat. Neurosci 22, 1383–1388. 10.1038/s41593-019-0455-7. [DOI] [PMC free article] [PubMed] [Google Scholar]
- 14.Maor-Nof M, Shipony Z, Lopez-Gonzalez R, Nakayama L, Zhang Y-J, Couthouis J, Blum JA, Castruita PA, Linares GR, Ruan K, et al. (2021). p53 is a central regulator driving neurodegeneration caused by C9orf72 poly (PR). Cell 184, 689–708. [DOI] [PMC free article] [PubMed] [Google Scholar]
- 15.Muenz LR, Green SB, and Byar DP (1977). Applications of the Mantel-Haenszel statistic to the comparison of survival distributions. Biometrics 33, 617–626. [PubMed] [Google Scholar]
- 16.Perry S, Han Y, Das A, and Dickman D (2017). Homeostatic plasticity can be induced and expressed to restore synaptic strength at neuromuscular junctions undergoing ALS-related degeneration. Hum. Mol. Genet. 26, 4153–4167. 10.1093/hmg/ddx304. [DOI] [PMC free article] [PubMed] [Google Scholar]
- 17.Kimura S, Noda T, and Yoshimori T (2007). Dissection of the autophagosome maturation process by a novel reporter protein, tandem fluorescent-tagged LC3. Autophagy 3, 452–460. 10.4161/auto.4451. [DOI] [PubMed] [Google Scholar]
- 18.Mauvezin C, and Neufeld TP (2015). Bafilomycin A1 disrupts autophagic flux by inhibiting both V-ATPase-dependent acidification and Ca-P60A/SERCA-dependent autophagosome-lysosome fusion. Autophagy 11, 1437–1438. 10.1080/15548627.2015.1066957. [DOI] [PMC free article] [PubMed] [Google Scholar]
- 19.Hessvik NP, Øverbye A, Brech A, Torgersen ML, Jakobsen IS, Sandvig K, and Llorente A (2016). PIKfyve inhibition increases exosome release and induces secretory autophagy. Cell. Mol. Life Sci 73, 4717–4737. 10.1007/s00018-016-2309-8. [DOI] [PMC free article] [PubMed] [Google Scholar]
- 20.Hessvik NP, and Llorente A (2018). Current knowledge on exosome biogenesis and release. Cell. Mol. Life Sci 75, 193–208. 10.1007/s00018-017-2595-9. [DOI] [PMC free article] [PubMed] [Google Scholar]
- 21.Ponpuak M, Mandell MA, Kimura T, Chauhan S, Cleyrat C, and Deretic V (2015). Secretory autophagy. Curr. Opin. Cell Biol 35, 106–116. 10.1016/j.ceb.2015.04.016. [DOI] [PMC free article] [PubMed] [Google Scholar]
- 22.Willms E, Johansson HJ, Mäger I, Lee Y, Blomberg KEM, Sadik M, Alaarg A, Smith CIE, Lehtiö J, El Andaloussi S, et al. (2016). Cells release subpopulations of exosomes with distinct molecular and biological properties. Sci. Rep 6, 22519. 10.1038/srep22519. [DOI] [PMC free article] [PubMed] [Google Scholar]
- 23.Ludwig A-K, De Miroschedji K, Doeppner TR, Börger V, Ruesing J, Rebmann V, Durst S, Jansen S, Bremer M, Behrmann E, et al. (2018). Precipitation with polyethylene glycol followed by washing and pelleting by ultracentrifugation enriches extracellular vesicles from tissue culture supernatants in small and large scales. J. Extracell. Vesicles 7, 1528109. 10.1080/20013078.2018.1528109. [DOI] [PMC free article] [PubMed] [Google Scholar]
- 24.Kosaka N, Iguchi H, Yoshioka Y, Takeshita F, Matsuki Y, and Ochiya T (2010). Secretory mechanisms and intercellular transfer of microRNAs in living cells. J. Biol. Chem 285, 17442–17452. 10.1074/jbc.M110.107821. [DOI] [PMC free article] [PubMed] [Google Scholar]
- 25.Lyons AB (2000). Analysing cell division in vivo and in vitro using flow cytometric measurement of CFSE dye dilution. J. Immunol. Methods 243, 147–154. 10.1016/s0022-1759(00)00231-3. [DOI] [PubMed] [Google Scholar]
- 26.Zaborowski MP, Balaj L, Breakefield XO, and Lai CP (2015). Extracellular Vesicles: Composition, Biological Relevance, and Methods of Study. Bioscience 65, 783–797. 10.1093/biosci/biv084. [DOI] [PMC free article] [PubMed] [Google Scholar]
- 27.Choi SY, Lopez-Gonzalez R, Krishnan G, Phillips HL, Li AN, Seeley WW, Yao W-D, Almeida S, and Gao F-B (2019). C9ORF72-ALS/FTD-associated poly(GR) binds Atp5a1 and compromises mitochondrial function in vivo. Nat. Neurosci 22, 851–862. 10.1038/s41593-019-0397-0. [DOI] [PMC free article] [PubMed] [Google Scholar]
- 28.Krishnan G, Raitcheva D, Bartlett D, Prudencio M, McKenna-Yasek DM, Douthwright C, Oskarsson BE, Ladha S, King OD, Barmada SJ, et al. (2022). Poly(GR) and poly(GA) in cerebrospinal fluid as potential biomarkers for C9ORF72-ALS/FTD. Nat. Commun 13, 2799. 10.1038/s41467-022-30387-4. [DOI] [PMC free article] [PubMed] [Google Scholar]
- 29.Chen Y-D, Fang Y-T, Cheng Y-L, Lin C-F, Hsu L-J, Wang S-Y, Anderson R, Chang C-P, and Lin Y-S (2017). Exophagy of annexin A2 via RAB11, RAB8A and RAB27A in IFN-γ-stimulated lung epithelial cells. Sci. Rep 7, 5676. 10.1038/s41598-017-06076-4. [DOI] [PMC free article] [PubMed] [Google Scholar]
- 30.Chiang HL, Terlecky SR, Plant CP, and Dice JF (1989). A role for a 70-kilodalton heat shock protein in lysosomal degradation of intracellular proteins. Science 246, 382–385. 10.1126/science.2799391. [DOI] [PubMed] [Google Scholar]
- 31.Gee HY, Noh SH, Tang BL, Kim KH, and Lee MG (2011). Rescue of ΔF508-CFTR trafficking via a GRASP-dependent unconventional secretion pathway. Cell 146, 746–760. 10.1016/j.cell.2011.07.021. [DOI] [PubMed] [Google Scholar]
- 32.Kim MS, Muallem S, Kim SH, Kwon KB, and Kim MS (2019). Exosomal release through TRPML1-mediated lysosomal exocytosis is required for adipogenesis. Biochem. Biophys. Res. Commun 510, 409–415. 10.1016/j.bbrc.2019.01.115. [DOI] [PMC free article] [PubMed] [Google Scholar]
- 33.Komatsu M, Waguri S, Ueno T, Iwata J, Murata S, Tanida I, Ezaki J, Mizushima N, Ohsumi Y, Uchiyama Y, et al. (2005). Impairment of starvation-induced and constitutive autophagy in Atg7-deficient mice. J. Cell Biol 169, 425–434. 10.1083/jcb.200412022. [DOI] [PMC free article] [PubMed] [Google Scholar]
- 34.Leidal AM, Huang HH, Marsh T, Solvik T, Zhang D, Ye J, Kai F, Goldsmith J, Liu JY, Huang Y-H, et al. (2020). The LC3-conjugation machinery specifies the loading of RNA-binding proteins into extracellular vesicles. Nat. Cell Biol 22, 187–199. 10.1038/s41556-019-0450-y. [DOI] [PMC free article] [PubMed] [Google Scholar]
- 35.Ostrowski M, Carmo NB, Krumeich S, Fanget I, Raposo G, Savina A, Moita CF, Schauer K, Hume AN, Freitas RP, et al. (2010). Rab27a and Rab27b control different steps of the exosome secretion pathway. Nat. Cell Biol 12, 19–30; sup pp 1–13. 10.1038/ncb2000. [DOI] [PubMed] [Google Scholar]
- 36.Padmanabhan S, and Manjithaya R (2020). Facets of Autophagy Based Unconventional Protein Secretion–The Road Less Traveled. Frontiers in Molecular Biosciences 7. 10.3389/fmolb.2020.586483. [DOI] [PMC free article] [PubMed] [Google Scholar]
- 37.Sahu R, Kaushik S, Clement CC, Cannizzo ES, Scharf B, Follenzi A, Potolicchio I, Nieves E, Cuervo AM, and Santambrogio L (2011). Microautophagy of cytosolic proteins by late endosomes. Dev. Cell 20, 131–139. 10.1016/j.devcel.2010.12.003. [DOI] [PMC free article] [PubMed] [Google Scholar]
- 38.Son SM, Cha M-Y, Choi H, Kang S, Choi H, Lee M-S, Park SA, and Mook-Jung I (2016). Insulin-degrading enzyme secretion from astrocytes is mediated by an autophagy-based unconventional secretory pathway in Alzheimer disease. Autophagy 12, 784–800. 10.1080/15548627.2016.1159375. [DOI] [PMC free article] [PubMed] [Google Scholar]
- 39.Wojnacki J, Nola S, Bun P, Cholley B, Filippini F, Pressé MT, Lipecka J, Lam SM, N’guyen J, Simon A, et al. (2021). Role of VAMP7-dependent secretion of reticulon 3 in neurite growth. Cell Reports 35, 109006. 10.1016/j.celrep.2021.109006. [DOI] [PubMed] [Google Scholar]
- 40.Gopal PP, Nirschl JJ, Klinman E, and Holzbaur ELF (2017). Amyotrophic lateral sclerosis-linked mutations increase the viscosity of liquid-like TDP-43 RNP granules in neurons. Proc. Natl. Acad. Sci. U. S. A 114, E2466–E2475. 10.1073/pnas.1614462114. [DOI] [PMC free article] [PubMed] [Google Scholar]
- 41.Mann JR, Gleixner AM, Mauna JC, Gomes E, DeChellis-Marks MR, Needham PG, Copley KE, Hurtle B, Portz B, Pyles NJ, et al. (2019). RNA Binding Antagonizes Neurotoxic Phase Transitions of TDP-43. Neuron 102, 321–338.e8. 10.1016/j.neuron.2019.01.048. [DOI] [PMC free article] [PubMed] [Google Scholar]
- 42.Lai S-L, Abramzon Y, Schymick JC, Stephan DA, Dunckley T, Dillman A, Cookson M, Calvo A, Battistini S, Giannini F, et al. (2011). FUS mutations in sporadic amyotrophic lateral sclerosis. Neurobiol. Aging 32, 550.e1–e4. 10.1016/j.neurobiolaging.2009.12.020. [DOI] [PMC free article] [PubMed] [Google Scholar]
- 43.Liu M-L, Zang T, and Zhang C-L (2016). Direct Lineage Reprogramming Reveals Disease-Specific Phenotypes of Motor Neurons from Human ALS Patients. Cell Rep 14, 115–128. 10.1016/j.celrep.2015.12.018. [DOI] [PMC free article] [PubMed] [Google Scholar]
- 44.Coyne AN, Siddegowda BB, Estes PS, Johannesmeyer J, Kovalik T, Daniel SG, Pearson A, Bowser R, and Zarnescu DC (2014). Futsch/MAP1B mRNA is a translational target of TDP-43 and is neuroprotective in a Drosophila model of amyotrophic lateral sclerosis. Journal of Neuroscience 34, 15962–15974. [DOI] [PMC free article] [PubMed] [Google Scholar]
- 45.Aggad D, Vérièpe J, Tauffenberger A, and Parker JA (2014). TDP-43 toxicity proceeds via calcium dysregulation and necrosis in aging Caenorhabditis elegans motor neurons. J. Neurosci 34, 12093–12103. 10.1523/JNEUROSCI.2495-13.2014. [DOI] [PMC free article] [PubMed] [Google Scholar]
- 46.Ikonomov OC, Sbrissa D, Delvecchio K, Xie Y, Jin J-P, Rappolee D, and Shisheva A (2011). The phosphoinositide kinase PIKfyve is vital in early embryonic development: preimplantation lethality of PIKfyve-/- embryos but normality of PIKfyve+/− mice. J. Biol. Chem 286, 13404–13413. 10.1074/jbc.M111.222364. [DOI] [PMC free article] [PubMed] [Google Scholar]
- 47.Schwenk F, Baron U, and Rajewsky K (1995). A cre-transgenic mouse strain for the ubiquitous deletion of loxP-flanked gene segments including deletion in germ cells. Nucleic Acids Res 23, 5080–5081. 10.1093/nar/23.24.5080. [DOI] [PMC free article] [PubMed] [Google Scholar]
- 48.Wils H, Kleinberger G, Janssens J, Pereson S, Joris G, Cuijt I, Smits V, Ceuterick-de Groote C, Van Broeckhoven C, and Kumar-Singh S (2010). TDP-43 transgenic mice develop spastic paralysis and neuronal inclusions characteristic of ALS and frontotemporal lobar degeneration. Proceedings of the National Academy of Sciences 107, 3858–3863. [DOI] [PMC free article] [PubMed] [Google Scholar]
- 49.Zhang Y-J, Gendron TF, Ebbert MTW, O’Raw AD, Yue M, Jansen-West K, Zhang X, Prudencio M, Chew J, Cook CN, et al. (2018). Poly(GR) impairs protein translation and stress granule dynamics in C9orf72-associated frontotemporal dementia and amyotrophic lateral sclerosis. Nat. Med 24, 1136–1142. 10.1038/s41591-018-0071-1. [DOI] [PMC free article] [PubMed] [Google Scholar]
- 50.Lakkaraju AKK, Frontzek K, Lemes E, Herrmann U, Losa M, Marpakwar R, and Aguzzi A (2021). Loss of PIKfyve drives the spongiform degeneration in prion diseases. EMBO Mol. Med 13, e14714. 10.15252/emmm.202114714. [DOI] [PMC free article] [PubMed] [Google Scholar]
- 51.See SK, Chen M, Bax S, Tian R, Woerman A, Tse E, Johnson IE, Nowotny C, Muñoz EN, Sengstack J, et al. (2021). PIKfyve inhibition blocks endolysosomal escape of α-synuclein fibrils and spread of α-synuclein aggregation. bioRxiv, 2021.01.21.427704 10.1101/2021.01.21.427704. [DOI] [Google Scholar]
- 52.Soares AC, Ferreira A, Mariën J, Delay C, Lee E, Trojanowski JQ, Moechars D, Annaert W, and De Muynck L (2021). PIKfyve activity is required for lysosomal trafficking of tau aggregates and tau seeding. J. Biol. Chem, 100636. 10.1016/j.jbc.2021.100636. [DOI] [PMC free article] [PubMed] [Google Scholar]
- 53.Du Z-W, Chen H, Liu H, Lu J, Qian K, Huang C-L, Zhong X, Fan F, and Zhang S-C (2015). Generation and expansion of highly pure motor neuron progenitors from human pluripotent stem cells. Nat. Commun 6, 6626. 10.1038/ncomms7626. [DOI] [PMC free article] [PubMed] [Google Scholar]
- 54.Haenseler W, Sansom SN, Buchrieser J, Newey SE, Moore CS, Nicholls FJ, Chintawar S, Schnell C, Antel JP, Allen ND, et al. (2017). A Highly Efficient Human Pluripotent Stem Cell Microglia Model Displays a Neuronal-Co-culture-Specific Expression Profile and Inflammatory Response. Stem Cell Reports 8, 1727–1742. 10.1016/j.stemcr.2017.05.017. [DOI] [PMC free article] [PubMed] [Google Scholar]
- 55.Bilican B, Serio A, Barmada SJ, Nishimura AL, Sullivan GJ, Carrasco M, Phatnani HP, Puddifoot CA, Story D, Fletcher J, et al. (2012). Mutant induced pluripotent stem cell lines recapitulate aspects of TDP-43 proteinopathies and reveal cell-specific vulnerability. Proc. Natl. Acad. Sci. U. S. A 109, 5803–5808. 10.1073/pnas.1202922109. [DOI] [PMC free article] [PubMed] [Google Scholar]
- 56.Wen X, Tan W, Westergard T, Krishnamurthy K, Markandaiah SS, Shi Y, Lin S, Shneider NA, Monaghan J, Pandey UB, et al. (2014). Antisense proline-arginine RAN dipeptides linked to C9ORF72-ALS/FTD form toxic nuclear aggregates that initiate in vitro and in vivo neuronal death. Neuron 84, 1213–1225. 10.1016/j.neuron.2014.12.010. [DOI] [PMC free article] [PubMed] [Google Scholar]
- 57.Kim D, Langmead B, and Salzberg SL (2015). HISAT: a fast spliced aligner with low memory requirements. Nat. Methods 12, 357–360. 10.1038/nmeth.3317. [DOI] [PMC free article] [PubMed] [Google Scholar]
- 58.Liao Y, Smyth GK, and Shi W (2014). featureCounts: an efficient general purpose program for assigning sequence reads to genomic features. Bioinformatics 30, 923–930. 10.1093/bioinformatics/btt656. [DOI] [PubMed] [Google Scholar]
- 59.Love MI, Huber W, and Anders S (2014). Moderated estimation of fold change and dispersion for RNA-seq data with DESeq2. Genome Biol 15, 550. 10.1186/s13059-014-0550-8. [DOI] [PMC free article] [PubMed] [Google Scholar]
- 60.Kuleshov MV, Jones MR, Rouillard AD, Fernandez NF, Duan Q, Wang Z, Koplev S, Jenkins SL, Jagodnik KM, Lachmann A, et al. (2016). Enrichr: a comprehensive gene set enrichment analysis web server 2016 update. Nucleic Acids Res 44, W90–W97. 10.1093/nar/gkw377. [DOI] [PMC free article] [PubMed] [Google Scholar]
- 61.Dobin A, Davis CA, Schlesinger F, Drenkow J, Zaleski C, Jha S, Batut P, Chaisson M, and Gingeras TR (2013). STAR: ultrafast universal RNA-seq aligner. Bioinformatics 29, 15–21. 10.1093/bioinformatics/bts635. [DOI] [PMC free article] [PubMed] [Google Scholar]
- 62.Liao Y, Smyth GK, and Shi W (2019). The R package Rsubread is easier, faster, cheaper and better for alignment and quantification of RNA sequencing reads. Nucleic Acids Res 47, e47. 10.1093/nar/gkz114. [DOI] [PMC free article] [PubMed] [Google Scholar]
- 63.Therrien M, Rouleau GA, Dion PA, and Parker JA (2013). Deletion of C9ORF72 results in motor neuron degeneration and stress sensitivity in C. elegans. PLoS One 8, e83450. 10.1371/journal.pone.0083450. [DOI] [PMC free article] [PubMed] [Google Scholar]
- 64.Estes PS, Daniel SG, McCallum AP, Boehringer AV, Sukhina AS, Zwick RA, and Zarnescu DC (2013). Motor neurons and glia exhibit specific individualized responses to TDP-43 expression in a Drosophila model of amyotrophic lateral sclerosis. Dis. Model. Mech 6, 721–733. 10.1242/dmm.010710. [DOI] [PMC free article] [PubMed] [Google Scholar]
- 65.Estes PS, Boehringer A, Zwick R, Tang JE, Grigsby B, and Zarnescu DC (2011). Wild-type and A315T mutant TDP-43 exert differential neurotoxicity in a Drosophila model of ALS. Hum. Mol. Genet 20, 2308–2321. 10.1093/hmg/ddr124. [DOI] [PMC free article] [PubMed] [Google Scholar]
- 66.Becker LA, Huang B, Bieri G, Ma R, Knowles DA, Jafar-Nejad P, Messing J, Kim HJ, Soriano A, Auburger G, et al. (2017). Therapeutic reduction of ataxin-2 extends lifespan and reduces pathology in TDP-43 mice. Nature 544, 367–371. 10.1038/nature22038. [DOI] [PMC free article] [PubMed] [Google Scholar]
- 67.Lieu CA, Chinta SJ, Rane A, and Andersen JK (2013). Age-related behavioral phenotype of an astrocytic monoamine oxidase-B transgenic mouse model of Parkinson’s disease. PLoS One 8, e54200. 10.1371/journal.pone.0054200. [DOI] [PMC free article] [PubMed] [Google Scholar]
- 68.Schneider CA, Rasband WS, and Eliceiri KW (2012). NIH Image to ImageJ: 25 years of image analysis. Nat. Methods 9, 671–675. 10.1038/nmeth.2089. [DOI] [PMC free article] [PubMed] [Google Scholar]
Associated Data
This section collects any data citations, data availability statements, or supplementary materials included in this article.
Supplementary Materials
(A) MAP2 immunostaining of iMNs expressing Hb9::RFP.
(B) Images of Hb9::RFP+ iMNs generated from CTRL/C9-ALS/FTD/sporadic ALS lines at the start of the survival assay.
(C, D) Immunostaining/quantification of endogenous poly(GR)+ (C) or poly(PR)+ (D) punctae in CTRL/C9-ALS/FTD iMNs. Gray circles = the number of nuclear poly(GR)+ or poly(PR)+ punctae/μm2 in one iMN. Mann-Whitney test. Mean ± interquartile range. Solid/dotted lines outline the cell body/nucleus.
(E) Removal of the C9ORF72 repeat expansion by CRISPR-Cas9 editing. Guide RNAs shown as scissors.
(F) Southern blot examining the C9ORF72 repeat length in C9-ALS/FTD1 and its corrected isogenic line. Normal C9ORF72 allele = 3.8 kb band.
(G) Repeat-primed PCR analysis of the repeat expansion in C9-ALS/FTD1 and its isogenic control line.
(H) Quantification of poly(GR)+ and poly(PR)+ punctae in C9-ALS/FTD1 and isogenic control iMNs. Gray circles = the number of nuclear poly(GR)+ or poly(PR)+ punctae/μm2 in one iMN. Unpaired t-test. Mean ± SEM.
(I) Immunostaining/quantification of total TDP-43 in CTRL/C9-ALS/FTD iMNs. Gray circles = the ratio of nuclear:cytoplasmic TDP-43 from one iMN. Mann-Whitney test. Median ± interquartile range. Solid/dotted lines outline the cell body/nucleus.
(J) Images of CTRL, C9-ALS/FTD and sporadic ALS iMNs during the survival assay.
(K) Survival of CTRL/C9-ALS/FTD iMNs (all lines/genotype in aggregate). Log-rank test.
(L) Images of C9-ALS/FTD iMNs during the survival assay when treated with DMSO, apilimod, apilimod+GW4869, or GW4869.
(M) Survival of C9-ALS/FTD iMNs (three lines in aggregate) in DMSO/apilimod. Log-rank test.
(N) Survival curves of C9-ALS/FTD iMNs in DMSO/apilimod. Log-rank test.
(O) PIKFYVE mRNA levels (relative to GAPDH) in HeLa cells treated with indicated ASOs. One-way ANOVA. Mean of three independent ASO treatments/condition ± SEM.
(P) Survival of control/C9-ALS/FTD iMNs treated with indicated ASOs. Log-rank test.
(Q) Survival of CTRL3 and C9-ALS3 treated with negative control ASO/PIKFYVE ASO1. Log-rank test.
(R) Hazard ratio of iMNs from CTRL3 and C9-ALS3 treated with negative control/PIKFYVE ASO1. Mean of independent iMN conversions ± SEM. One-way ANOVA.
(S) Images of muscle and NMJs in wild-type/C9ORF72 GR.100 Drosophila larvae treated with DMSO/apilimod and immunostained with anti-BRP (active zone marker) and anti-HRP (neuronal membrane marker).
(T) Quantification of active zones at NMJs in the indicated genotypes and conditions. Unpaired t-test. Mean ± SEM.
(A) Transcription factor enrichment and KEGG pathway analysis of differentially-expressed genes from RNA-seq data of C9-ALS/FTD iMNs treated with DMSO/apilimod.
(B) Normalized expression (from RNA-seq data) of STMN2 and UNC13A from C9-ALS/FTD iMNs treated with DMSO/apilimod. Unpaired t-test. Mean ± SEM.
(C-D) Immunostaining/quantification of poly(PR)+ (C) and poly(GA)+ (D) punctae in CTRL/C9-ALS/FTD iMNs treated with DMSO/apilimod. Gray circles = the number of nuclear poly(PR)+ or poly(GA) punctae/μm2 in one iMN. Kruskal-Wallis test. Median ± interquartile range. Solid/dotted lines outline the cell body/nucleus.
(A-B) Images/quantification of LC3-mRFP-GFP3 fluorescence in C9-ALS/FTD iMNs in DMSO/apilimod +/− bafilomycin. Gray circles = the number of LC3-GFP+/mRFP+ punctae/μm2 in one iMN. Kruskal-Wallis test. Median ± interquartile range. Solid/dotted lines outline the cell body/nucleus.
(C) Immunostaining/quantification of TFEB in CTRL/C9-ALS/FTD iMNs treated with DMSO/apilimod. Gray circles = the mean intensity of nuclear TFEB (left panel) and the average nuclear:cytoplasmic TFEB ratio (right panel) from one iMN. Kruskal-Wallis test. Median ± interquartile range. Solid/dotted lines outline the cell body/nucleus.
(D) Immunoblots/quantification of phosphorylated (Ser142) TFEB in pellet fractions from CTRL/C9-ALS/FTD iMNs treated with DMSO/apilimod. One-way ANOVA. Mean ± SEM.
(E) Quantification of the “no bafilomycin” conditions from (A). Gray circles = the ratio of LC3-mRFP+/GFP+:total LC3-mRFP+ (LC3-mRFP+/GFP+ and LC3-mRFP+/GFP-) punctae in one iMN. Mann-Whitney test. Median ± interquartile range.
(F) Immunoblots/quantification of LC3 (LC3-I above 15kDa and LC3-II below 15kDa) in pellet fractions from CTRL/C9-ALS/FTD iMNs treated with DMSO/apilimod. One-way ANOVA. Mean ± SEM.
(G) Quantification of the “no bafilomycin” conditions from (A). Gray circles = the number of LC3-mRFP+/GFP- punctae/μm2 in one iMN. Mann-Whitney test. Median ± interquartile range.
(H) Staining/quantification of LysoSensor Green and LysoTracker in C9-ALS/FTD iMNs treated with DMSO or apilimod. Gray circles = the percentage of LysoSensor+ punctae/total LysoTracker+ punctae in one iMN. Kruskal-Wallis test. Median ± interquartile range. Solid/dotted lines outline the cell body/nucleus.
(I) Hazard ratio of CTRL/C9-ALS/FTD iMNs treated with DMSO, apilimod, DMSO+bafilomycin, or apilimod+bafilomycin. Mean of independent iMN conversions ± SEM. One-way ANOVA.
(J) Quantification of (A), the DMSO/apilimod conditions +/− bafilomycin. Gray circles = the number of total LC3-mRFP+ punctae/μm2 in one iMN. Kruskal-Wallis test. Median ± interquartile range.
(K) Quantification of TUJ1 in pellet fractions from CTRL/C9-ALS/FTD iMNs treated with DMSO, apilimod, apilimod+GW4869, or GW4869. One-way ANOVA. Mean ± SEM.
(L) FACS analysis of GFP+/CFSE+ exosomes from CTRL iMNs treated with DMSO/apilimod. Data points = an independently-differentiated culture. Unpaired t-test. Mean ± SEM.
(M) KEGG pathways of differentially-expressed proteins in the exosomal fraction of C9-ALS/FTD iMNs treated with DMSO/apilimod.
(N) Immunoblots/quantification of Huntingtin and alpha-synuclein in exosomal fractions from CTRL/C9-ALS/FTD iMNs treated with DMSO/apilimod. One-way ANOVA. Mean ± SEM.
(O) Ratios of TSG101 and OPTN in the exosomal:cell pellet fractions of CTRL/C9-ALS/FTD iMNs. One-way ANOVA. Mean ± SEM.
(P) Immunoblots of total TDP43 (43kDa) and TSG101 in exosomal fractions from CTRL/C9-ALS/FTD iMNs treated with DMSO, apilimod, apilimod+GW4869, or GW4869.
(Q-R) Quantification of 50kDa and 43kDa pTDP-43 (Ser409/410) in the pellet insoluble (Q) or soluble (R) fraction from Figure 3M. One-way ANOVA. Mean ± SEM.
(S) Immunoblots of Fibrillarin (37kDa) and HSP90 (90kDa) in nuclear or cytoplasmic fractions from CTRL/C9-ALS/FTD iMNs treated with DMSO/apilimod.
(T) Quantification of high molecular weight (HMW, >75kDa), 50 kDa, 43kDa and low molecular weight (LMW, <43kDa) pTDP-43 in the cytoplasmic soluble fraction from Figure 3P. One-way ANOVA. Mean ± SEM.
(U-V) Immunoblots/quantification of total TDP-43 in soluble/insoluble fractions from CTRL/C9-ALS/FTD iMNs treated with DMSO/apilimod. One-way ANOVA. Mean ± SEM.
(A) Survival C9-ALS/FTD iMNs treated with DMSO, apilimod, or apilimod+GW4869. Log-rank test. P-values were not corrected for multiple comparisons.
(B) mRNA levels of RAB27A (relative to HPRT) or other indicated genes (relative to GAPDH) in iMNs treated with negative control ASO or an ASO targeting each gene. Unpaired t-test. Mean ± SEM.
(C) Hazard ratio of CTRL iMNs treated with the ASOs indicated plus DMSO/apilimod. Mean of independent iMN conversions ± SEM. One-way ANOVA.
(D) Immunoblots of TSG101 and pTDP-43 (Ser409/410)(50 kDa) in exosomal fractions from C9-ALS/FTD iMNs treated with DMSO/apilimod plus negative control/RAB27A ASO1.
(E) Quantification of endogenous LC3B+ punctae in CTRL or C9-ALS/FTD iMNs treated with negative control/RAB27A ASO and DMSO/apilimod. Gray circles = the number of LC3B+ punctae/μm2 in one iMN. Kruskal-Wallis test. Median ± interquartile range.
(F) Immunostaining/quantification of endogenous LC3B+/LAMP1+ punctae in CTRL or C9-ALS/FTD iMNs treated with DMSO/apilimod. Gray circles = the number of LC3+/LAMP1+ punctae/μm2 in one iMN. Kruskal-Wallis test. Median ± interquartile range. Solid lines outline the cell body.
(G) Immunostaining/quantification of endogenous LC3B+/CD63+ punctae in CTRL/C9-ALS/FTD iMNs treated with negative control/RAB27A ASO and DMSO/apilimod. Gray circles = the number of LC3B+/CD63+ punctae/μm2 from one iMN. Kruskal-Wallis test. Median ± interquartile range. Solid lines outline the cell body.
(H) Immunostaining/quantification of endogenous RAB7+ punctae in CTRL/C9-ALS/FTD iMNs treated with DMSO/apilimod. Gray circles = the number of RAB7+ punctae/μm2 from one iMN. Kruskal-Wallis test. Median ± interquartile range. Solid/dotted lines outline the cell body/nucleus.
(I) Immunostaining/quantification of endogenous LAMP1+ punctae in CTRL/C9-ALS/FTD iMNs treated with DMSO/apilimod. Gray circles = the percentage of small LAMP1+ vesicles/cell (Left) and large LAMP1+ vesicles/cell (Right) from one iMN. One-way ANOVA. Mean ± SEM. Solid/dotted lines outline the cell body/nucleus.
(J) Quantification of pTDP-43+ (Ser409/410) punctae in CTRL/C9-ALS/FTD iMNs treated with DMSO/apilimod. Gray circles = the number of cytoplasmic pTDP43+ punctae/μm2 (left), the average size (in μm2) of pTDP43+ punctae/neuron (middle) and the average intensity of pTDP43+ punctae/neuron (right) in one iMN. One-way ANOVA (left); Unpaired t-test (middle and right). Mean ± SEM.
(A) Images of sporadic ALS iMNs during the survival assay when treated with DMSO, apilimod, apilimod+GW4869 , or GW4869.
(B) Survival of CTRL iMNs treated with DMSO and eight sporadic ALS (sALS) iMNs treated with DMSO/apilimod. Log-rank test.
(C) Survival of iMNs from sALS9 in DMSO/apilimod. Log-rank test.
(D) Hazard ratios of iMNs from sALS9 treated with DMSO/apilimod. Mean of independent iMN conversions ± SEM. One-way ANOVA.
(E) Hazard ratios of iMNs from three CTRL and six sALS lines in aggregate (sALS1-sALS6) treated with negative control ASO, PIKFYVE ASO1, or ASO2. Mean of independent iMN conversions ± SEM. One-way ANOVA.
(F) Survival of iMNs from two FUS ALS (H517Q, R522R mutation) and TARDBP ALS (G298S mutation) lines treated with DMSO/apilimod. Log-rank test.
(G) Immunostaining/quantification of FUS in iMNs from two CTRL and two FUS ALS (H517Q, R522R mutation) lines treated with DMSO/apilimod. Gray circles = the nuclear:cytoplasmic FUS ratio from one iMN. Kruskal-Wallis test. Median ± interquartile range. Solid/dotted lines outline the cell body/nucleus.
(H) Hazard ratios of iMNs from CTRL, two sporadic ALS, and one FUS-ALS (R522R mutation) lines treated with negative control, VAMP7, or ATG7 ASO plus DMSO/apilimod. Mean of independent iMN conversions ± SEM. One-way ANOVA.
(I) Hazard ratios of iMNs from CTRL and three sporadic ALS lines treated with DMSO, apilimod or apilimod+GW4869. Mean of independent iMN conversions ± SEM. One-way ANOVA.
(J) Survival of iMNs from three sporadic ALS lines treated with DMSO, apilimod, or apilimod+GW4869. Log-rank test.
(K-L) Hazard ratios of iMNs from one CTRL and one TARDBP ALS (G298S mutation) (K) or one FUS ALS (H517Q) line (L) treated with DMSO, apilimod, or apilimod+GW4869. Mean of independent iMN conversions ± SEM. One-way ANOVA.
(M) Survival of iMNs from a FUS ALS (H517Q) and TARDBP ALS line treated with DMSO, apilimod, or apilimod+GW4869. Log-rank test.
(N) Hazard ratios of iMNs from two CTRL lines treated with DMSO and one FUS ALS (R522R mutation) line treated with DMSO, apilimod, DMSO+bafilomycin, or apilimod+bafilomycin. Mean of independent iMN conversions ± SEM. One-way ANOVA.
(O) Images of worms: control, untreated (Top) or apilimod-treated (Bottom) TDP-43A315T transgenics expressing unc-47::GFP in motor neurons. Arrows indicate gaps or breaks along neuronal processes that are scored as neurodegeneration events.
(P) Apilimod delayed paralysis in TDP-43A315T transgenics. Log-rank test. n>200 worms/experiment.
(Q) Apilimod suppressed motor neuron degeneration in TDP-43A315T transgenics. One-way ANOVA.
(A) Fold-change of selected protein levels in adult mouse CSF after intrathecal injection of apilimod compared to vehicle. n=6 and 4 mice for the vehicle- and apilimod-treated group, respectively. Values = the average of two technical replicates/condition/group.
(B) Mating scheme for generation of a single-allele deletion of Pikfyve in TDP-43Tg/Tg mice.
(C) Targeting strategy to disrupt exon-6 of the Pikfyve gene using the Cre-lox system.
(D) Pikfyve mRNA levels in Pikfyve+/−;TDP-43Tg/Tg mouse brain (normalized to Pikfyve+/+;TDP-43Tg/Tg mice) at 15–18 days of age. Unpaired t-test. Mean ± SEM. Data points = one mouse.
(E) Immunoblot of PIKFYVE in whole brains of Pikfyve +/+; WT and Pikfyve +/−; WT mice at P15–18. Unpaired t-test. Mean ± SEM. Data points = one mouse.
(F) Pikfyve mRNA levels (relative to Ppia) in brains of P7 WT mice treated with negative control/Pikfyve ASO at P0. n=3 mice/group. Unpaired t-test. Mean± SEM.
(G) Immunoblot of PIKFYVE levels in whole brains of WT and TDP-43Tg/Tg mice at P20 after treatment with negative control/Pikfyve ASO at P1. Mann-Whitney test. Median ± interquartile range. Data points = one mouse.
(H-I) The kyphosis (H) and tremor scores (I) of Pikfyve+/+;WT, Pikfyve+/−;WT, Pikfyve+/+;TDP-43Tg/Tg and Pikfyve+/−; TDP-43Tg/Tg mice. Unpaired t-test. Mean ± SEM.
(J-K) The kyphosis (J) and tremor scores (K) of WT or TDP-43Tg/Tg mice treated with vehicle and negative control/Pikfyve ASO. Unpaired t-test. Mean ± SEM.
(L-M) The kyphosis (L) and tremor scores (M) of TDP-43Tg/Tg mice treated with vehicle+NC ASO, vehicle+Pikfyve ASO, GW4869+negative control ASO, and GW4869+Pikfyve ASO. Unpaired t-test. Mean ± SEM.
(N-P) The gait impairment (N), kyphosis (O) and tremor (P) scores of WT or TDP-43Tg/Tg mice treated with negative control/Pikfyve ASO. Unpaired t-test. Mean ± SEM.
(Q) Immunostaining of GFP and poly(GR) in the cortex of mice transduced with AAV-eGFP or AAV-eGFP-(GR)100. Rectangle = magnification of the area .
(A) Immunoblot of total TDP-43 levels in whole brains of WT/TDP-43Tg/Tg mice treated with negative control/Pikfyve ASO. One-way ANOVA. Mean± SEM. Data points = one mouse.
(B) Immunoblot of pTDP-43 (Ser409/410) levels in the cytoplasmic fraction of whole brain lysates from TDP-43Tg/Tg mice treated with negative control/Pikfyve ASO. Unpaired t-test. Mean± SEM. Data points = one mouse.
(C-E) Immunostaining/quantification of pTDP-43+ (Ser403/404) punctae in large TUJ1+ neurons in the dorsal spinal cord (C), in layer V neurons in the motor cortex layer (D), in neurons in the caudal putamen (E) from WT/TDP-43Tg/Tg mice treated with negative control/Pikfyve ASO. Solid/dotted lines outline the cell body/nucleus. Arrows mark pTDP-43+ punctae. Data points = the average number of pTDP-43+ punctae in neurons/μm2 for one mouse. (C) One-way ANOVA. Mean ± SEM. (D-E) Kruskal-Wallis test. Mean ± SEM.
(F) Immunostaining of pTDP-43+ (Ser409/410) punctae in CTRL iPSC-derived IBA1+ microglia treated with/without exosomes harvested from C9-ALS/FTD iMNs for 24 or 96 hours. Arrows mark pTDP-43+ punctae in IBA1+ microglia.
(G-H) Quantification of (F). For (G), gray circles = the number of pTDP-43+ punctae in IBA1+ microglia/μm2 in one IBA1+ microglial cell treated with/without exosomes harvested from C9-ALS/FTD iMNs. Kruskal-Wallis test. Median ± interquartile range. For (H), values = the percentage of ramified or amoeboid IBA1+ microglia.
(I) Immunostaining/quantification of IBA1+ microglia in the spinal cord ventral horn of WT or TDP-43Tg/Tg mice treated with negative control/Pikfyve ASO. Data points = the number of IBA1+ microglia/ventral horn section in one mouse. One-way ANOVA. Mean ± SEM.
(J) Immunostaining/quantification of GFAP+ astrocytes in the spinal cord ventral horn of WT or TDP-43Tg/Tg mice treated with negative control/Pikfyve ASO. Data points = the number of GFAP+ astrocytes/ventral horn section in one mouse. One-way ANOVA. Mean ± SEM.
(K-M) Immunostaining/quantification of RAB7+ punctae (K), percentage of large LAMP1+ vesicles (L), or the number of LC3B+/LAMP1+ punctae (M) in large TUJ1+ neurons in the spinal cord ventral horn from WT/TDP-43Tg/Tg mice treated with negative control/Pikfyve ASO. Data points = the average number of RAB7+ punctae/μm2 (K), the percentage of large LAMP1+ vesicles (L), or the number of LC3B+/LAMP1+ punctae (M) in TUJ1+ neurons for one mouse. One-way ANOVA. Mean ± SEM.
(N) Immunoblot of TFEB levels in the nuclear or cytoplasmic fraction of whole brain lysates from TDP-43Tg/Tg mice treated with negative control/Pikfyve ASO. Data points = the nuclear:cytoplasmic TFEB ratio in one mouse. Mann-Whitney test. Mean ± SEM.
(O) Immunostaining/quantification of the percentage of large LAMP1+ vesicles in large TUJ1+ neurons in the spinal cord ventral horn from 10-month-old Pikfyve+/+;WT, Pikfyve+/−;WT, Pikfyve+/+;TDP-43Tg/+ and Pikfyve+/−;TDP-43Tg/+ mice. Solid/dotted lines outline the cell body/nucleus. Arrows mark LAMP1+ punctae. Data points = the percentage of large LAMP1+ vesicles in TUJ1+ neurons for one mouse. One-way ANOVA. Mean ± SEM.
(P) Quantification of LAMP1+ punctae in CTRL and C9-ALS/FTD iMNs treated with DMSO/apilimod. Gray circles = the number of LAMP1+ punctae/μm2 in one iMN. Kruskal-Wallis test. Median ± interquartile range.
(1) C9-ALS/FTD iPSC-derived motor neurons treated with DMSO or 3 μM apilimod for 24 hours (displayed as +apilimod/+DMSO).
(2) C9-ALS/FTD iPSC-derived motor neurons treated with 9 μM NC ASO or PIKFYVE ASO for 3 days (displayed as +PIKFYVE ASO /+NC ASO).
(3) Lysosomal TFEB target genes comparing Apilimod to DMSO
(4) Lysosomal TFEB target genes comparing PIKFYVE ASO to NC ASO
Exosomal fractions from CTRL and C9-ALS/FTD iPSC-derived motor neurons after DMSO or 3 μM apilimod treatment for 24 hours. n=3 independent neuron conversions per condition from one CTRL and one C9-ALS/FTD line. The table included Cellular component (CC) and Biological processes (BP) of gene ontology enrichment analysis of proteins present at significantly different levels in the exosomal fractions of C9-ALS/FTD iPSC-derived motor neurons treated with DMSO or 3 μM apilimod.
TDP-43Tg/Tg mice at day 21 after treatment with a NC ASO (short-tail) or a Pikfyve ASO (long-tail) at P1.
TDP-43Tg/Tg mice at day 21 after treatment with a Pikfyve ASO + vehicle (long-tail) or a Pikfyve ASO + GW4869 (short-tail) at P1.
Data Availability Statement
The bulk RNA-sequencing data generated as part of this study are available at the Gene Expression Omnibus. Accession numbers are listed in the key resources table and the output of the analyses are available upon request. Original western blot images are included in Supplemental Data S1. The mass spectrometry raw data is provided in Supplemental Table S3.
All code used in this study is available from the lead contact upon request.
Any additional information required to reanalyze the data reported in this work paper is available from the Lead Contact upon request.
Key resources table
| REAGENT or RESOURCE | SOURCE | IDENTIFIER |
|---|---|---|
| Antibodies | ||
| TSG101 (mouse IgG1) | BD Transduction Laboratories™ | 612697 |
| TUJ1 (Mouse IgG2a, κ) | Biolegend | MMS-435P |
| LC3 (Rabbit IgG) | MBL | PM036 |
| P62 (Mouse IgG1, κ) | BD Transduction | 610832 |
| OPTN (Rabbit IgG) | Proteintech | 10837-1-AP |
| Phospho-TDP43(Ser409/410) (Rabbit IgG) | Proteintech | 22309-1-AP |
| PIP5K3 (Rabbit IgG) | Proteintech | 13361-1-AP |
| TFEB (Rabbit IgG) | Bethyl Laboratories® | A303-673A |
| Phospho-TFEB (Ser142) (Rabbit IgG) | Sigma-Aldrich | ABE1971-I-25UL |
| Huntingtin (Rabbit IgG) | Abcam | ab109115 |
| alpha Synuclein (Rabbit IgG) | Invitrogen | PA5-85791 |
| Fibrillarin (Rabbit IgG) | Abcam | ab166630 |
| HSP90 (Rabbit IgG) | Proteintech | 13171-1-AP |
| GR repeat (Rabbit IgG) | Proteintech | 23978-1-AP |
| PR repeat (Rabbit IgG) | Proteintech | 23979-1-AP |
| GA repeat (Rabbit IgG) | Proteintech | 24492-1-AP |
| TDP43 (Rabbit IgG) | ProteinTech | 10782-2-AP |
| Poly-GA (Mouse IgG) | Milipore | MABN889 |
| LysoSensor™ Green DND-189 | Invitrogen | L7535 |
| LysoTracker™ Deep Red | Invitrogen | L12492 |
| LC3B (Rabbit IgG) | Abcam | ab192890 |
| LAMP1 (Mouse IgG) | Abcam | ab25630 |
| CD63 (mouse IgG1, κ) | BD Transduction Laboratories™ | 556019 |
| RAB7 (Rabbit IgG) | Abcam | ab137029 |
| Phospho-TDP43(Ser409/410) (Rabbit IgG) | Cosmo Bio | CAC-TIP-PTD-P07 |
| Alexa Fluor® 647 Anti-LC3B antibody | Abcam | ab225383 |
| FUS (Goat IgG) | Bethyl Laboratories® | A303-839A |
| IBA1 (Goat IgG) | Abcam | ab5076 |
| MAP2 (Chicken IgY) | Abcam | ab5392 |
| TUJ1/Tubb3 (Mouse IgG) | Neuromics | CH23005 |
| NeuN (Mouse IgG) | Millipore | MAB377 |
| ChAT (Goat polyclonal) | Millipore Sigma | AB144P |
| Phospho TDP43(Ser403/404) (Mouse IgG2a) | ProteinTech | 66079-1-Ig |
| LAMP1 (Rabbit IgG) | Abcam | ab24170 |
| RAB7 (Mouse IgG1 κ) | Santa Cruz | sc-376362 |
| LC3B (Mouse IgG2a) | GeneTex | GT3612 |
| GFP (Chicken IgY) | Aves Lab | GFP-1010 |
| GFAP (Rabbit IgG) | Abcam | ab7260 |
| Iba1 (Rabbit IgG) | GeneTex | GT101495 |
| DAPI | Thermo Fisher | 62248 |
| NeuroTrace™ 500/525 Green Fluorescent Nissl Stain | Thermo Fisher | N21480 |
| Goat anti-Chicken IgY (H+L) Cross-Adsorbed Secondary Antibody, Alexa Fluor™ Plus 405 | Thermo Fisher | A48260 |
| Donkey anti-Rabbit, IgG (H+L) Highly Cross-Adsorbed, Alexa Fluor® 488 | Invitrogen | A-21206 |
| Donkey anti-Mouse,IgG (H+L) Highly Cross-Adsorbed, Alexa Fluor® 555 | Invitrogen | A31570 |
| Donkey anti-Mouse, IgG (H+L) Highly Cross-Adsorbed, Alexa Fluor® 488 | Invitrogen | A21202 |
| Donkey anti-Mouse, IgG (H+L) Highly Cross-Adsorbed, Alexa Fluor® 647 | Invitrogen | A32787 |
| Donkey Anti-Chicken IgY (IgG) (H+L) Alexa Fluor® 647 | Jackson ImmunoResearch | 703-605-155 |
| Goat anti-Chicken IgY (H+L) Cross-Adsorbed Secondary Antibody, Alexa Fluor Plus 488 | Invitrogen | A32931TR |
| Donkey anti-Goat, IgG (H+L) Highly Cross-Adsorbed , Alexa Fluor 555 | Invitrogen | A32816 |
| IRDye® 680RD Donkey anti-Rabbit IgG Secondary Antibody | LI-COR Biosciences | 926-68073 |
| IRDye® 800CW Donkey anti-Mouse IgG Secondary Antibody | LI-COR Biosciences | 926-32212 |
| CFSE dye | Thermo | C34554 |
| Chemicals, peptides, and recombinant proteins | ||
| DMEM | Gibco | 11995-065 |
| Opti-MEM | Gibco | 31985-070 |
| FBS | GenClone | 25-514 |
| Trypsin | GenClone | 25-510 |
| Polybrene (Hexadimethrine bromide) | Sigma | H9268-5G |
| DMEM/F12 | Corning | 10-090-CV |
| Laminin | Invitrogen | 23017015 |
| Glutamax | Gibco | 35050-061 |
| N2 | Gibco | 17502048 |
| B27 | Gibco | 17504044 |
| Human FGF-beta | Peprotech | 100-18B |
| Repsox | Selleckchem | S7223 |
| human CNTF | R&D | 257-NT |
| human BDNF | R&D | 248BDB |
| human GDNF | R&D | 212-GD |
| Matrigel | Corning | 354277 |
| mTeSR | StemCell | 85851 |
| Accutase | Innovative Cell Technologies | AT4104 |
| Y-27632 2HCl | selleckchem | S1049 |
| Lenti-X concentrator | TaKaRa | 631232 |
| Polybrene (Hexadimethrine bromide) | Sigma | H9268-5G |
| Neurobasal-A | Life Technologies | 10888-022 |
| Apilimod | achemblock | O33822 |
| GW 4869 (hydrochloride hydrate) | Cayman Chemicals | 13127 |
| SB431542 | Cayman Chemical | 13031 |
| CHIR99021 | Cayman Chemical | 13122 |
| Retinoic Acid | Millipore Sigma | R2625 |
| DMH1 | selleckchem | S7146 |
| Purmorphamine | Cayman Chemical | 10009634 |
| Donor Equine Serum | HyClone | 16777-030 |
| BMP4 | Invitrogen | PHC9534 |
| VEGF | Invitrogen | PHC9394 |
| SCF | Miltenyi | 130-096-692 |
| X-VIVO15 | SLS (Lonza) | LZBE02-060F |
| M-CSF | Invitrogen | PHC9501 |
| IL-3 | Invitrogen | PHC0033 |
| 2-mercaptoethanol | Gibco | 21985023 |
| IL-34 | Biolegend | 577906 |
| Bafilomycin A1 | Cayman | 11038 |
| HEPES Stock Solution (1 M) | Cayman | 600212 |
| Citrate Buffer pH 6.0 | Electron Microscopy Sciences (EMS) | 64142-07 |
| Normal Donkey Serum | VWR | 102644-006 |
| cOmplete™, EDTA-free Protease Inhibitor Cocktail | Roche | 4693132001 |
| PhosSTOP™ | Roche | 4906845001 |
| Chameleon® Duo Pre-stained Protein Ladder | Licor | 928-60000 |
| Odyssey® One-Color Protein Molecular Weight Marker | Licor | 928-40000 |
| MEM media | Life Technologies | 10370088 |
| Urea | Sigma | U5378-100G |
| Thiourea | Sigma | T8656-50G |
| CHAPS | Sigma | 10810118001 |
| Tris-HCl 1.5M, pH=8.8 | Teknova | T1588 |
| Penicillin-streptomycin 50X | Corning | 30-001-CI |
| Compound E | Cayman Chemicals | 15579 |
| PEG 6000 | Sigma-Aldrich | 81253 |
| Experimental models: Cell lines | ||
| ND03231 (CTRL1) | NINDS Biorepository | 3231 |
| ND05280 (CTRL2) | NINDS Biorepository | 5280 |
| ND03719 (CTRL3) | NINDS Biorepository | 3719 |
| ND00184 (CTRL4) | NINDS Biorepository | 00184 |
| ND41865 (CTRL5) | NINDS Biorepository | 41865 |
| ND06769 (C9-ALS 1) | NINDS Biorepository | 6769 |
| ND10689 (C9-ALS 2) | NINDS Biorepository | 10689 |
| ND12099 (C9-ALS 3) | NINDS Biorepository | 12099 |
| ND50000 (C9-ALS 4) | NINDS Biorepository | 50000 |
| ND10739 (sALS1) | NINDS Biorepository | 10739 |
| ND13454 (sALS2) | NINDS Biorepository | 13454 |
| ND11813 (sALS3) | NINDS Biorepository | 11813 |
| ND09711 (sALS4) | NINDS Biorepository | 9711 |
| ND14185 (sALS5) | NINDS Biorepository | 14185 |
| ND08705 (sALS6) | NINDS Biorepository | 8705 |
| ND09292 (sALS7) | NINDS Biorepository | 9292 |
| ND09329 (sALS8) | NINDS Biorepository | 9329 |
| ALS93E (sALS9) | This Manuscript | N/A |
| ND35663 (FUS H517Q) | NINDS Biorepository | 35663 |
| ND39034 (FUS R522R) | NINDS Biorepository | 39034 |
| ND50007 (TDP-43 G298S) | NINDS Biorepository | 50007 |
| Experimental models: Animal Models | ||
| C. elegans: TDP-43A315T | Parker lab | N/A |
| Drosophila: Wild type (w1118) | Zarnsecu and Dickman labs | N/A |
| Drosophila: GR.100 larvae (w;OK6-Gal4/UAS-100xGR) | Dickman lab | N/A |
| Drosophila: w1118 ; UAS-TDP-43G298S- YFP | Zarnescu lab | N/A |
| Drosophila: y[1]v[1]; P{Y[+(7.7) = GSYP}attP2 | Bloomington Drosophila Stock Center | BDSC # 8622 |
| Drosophila: y[1] sc[*] v[1]; P{y[+t7.7] v[+t1.8]=TRiP.GL00246}attP2 | Bloomington Drosophila Stock Center | BDSC # 35793 |
| Drosophila: P{UAS-poly-GR.PO-100}attP40 | Bloomington Drosophila Stock Center | BDSC#58696 |
| Mice: TDP-43 transgenic mice | Jackson Laboratory | 012836 |
| Mice: B6.Cg-PIKFYVE<tm1.1Ashi>/J | Jackson Laboratory | 029331 |
| Mice: B6.C-Tg(CMV-Cre)1Cgn/J | Jackson Laboratory | 006054 |
| Mice: C57BL/6J mice | Jackson Laboratory | 000664 |
| Oligonucleotides | ||
| sgRNA-1 targeting upstream of repeat expansion | This Manuscript | GUAACCUACGGUGUCCCGCU |
| sgRNA-2b targeting downstream of repeat expansion | This Manuscript | ACCCCAAACAGCCACCCGCC |
| Primer 1 for repeat primed PCR | This Manuscript | FAM-tgtaaaacgacggccagtCAAGGAGGGAAACAACCGCAGCC |
| Primer 2 for repeat primed PCR | This Manuscript | caggaaacagctatgaccGGGCCCGCCCCGACCACGCCCCGGCCCCGGCCCCGG |
| Primer 3 for repeat primed PCR | This Manuscript | caggaaacagctatgacc |
| Forward primer for Southern Probe | This Manuscript | AGAACAGGACAAGTTGCC |
| Reverse primer for Southern Probe | This Manuscript | AACACACACCTCCTAAACC |
| qPCR primer for RAB27A, Forward | This Manuscript | AGAGGCCAGAGAATCCACCT |
| qPCR primer for RAB27A, Reverse | This Manuscript | CACACCGTTCCATTCGCTTC |
| qPCR primer for HPRT, Forward | This Manuscript | GACTTTGCTTTCCTTGGTCAG |
| qPCR primer for HPRT, Reverse | This Manuscript | GGCTTATATCCAACACTTCGTGGG |
| qPCR primer for VAMP7, Forward | This Manuscript | CGGTTCAAGAGCACAGACAGCA |
| qPCR primer for VAMP7, Reverse | This Manuscript | ATCCACTTGGGCTTGAGTCTCC |
| qPCR primer for RAB8A, Forward | This Manuscript | TCAGGAACGGTTTCGGACGATC |
| qPCR primer for RAB8A, Reverse | This Manuscript | GCTCCTCAATGTTGCGAATCCAG |
| qPCR primer for HSP8A, Forward | This Manuscript | TCCTACCAAGCAGACACAGACC |
| qPCR primer for HSP8A, Reverse | This Manuscript | CAGGAGGTATGCCTGTGAGTTC |
| qPCR primer for NSMAF, Forward | This Manuscript | GTCTGAACACCTTCACGAGTGG |
| qPCR primer for NSMAF, Reverse | This Manuscript | CTGTTCAAGTCTACACCTCCTTC |
| qPCR primer for ATG7, Forward | This Manuscript | CGTTGCCCACAGCATCATCTTC |
| qPCR primer for ATG7, Reverse | This Manuscript | CACTGAGGTTCACCATCCTTGG |
| qPCR primer for MCOLN1, Forward | This Manuscript | CTGATGCTGCAAGTGGTCAAG |
| qPCR primer for MCOLN1, Reverse | This Manuscript | GGTGTTCTCTTCCCGGAATGTC |
| qPCR primer for GORASP1, Forward | This Manuscript | CACGGGGATGTGGAACCATC |
| qPCR primer for GORASP1, Reverse | This Manuscript | ATCAGCTTCAAGGGCTTCCC |
| qPCR primer for SMPD3, Forward | This Manuscript | GAAGCACACCTCAGGACCAAAG |
| qPCR primer for SMPD3, Reverse | This Manuscript | CAGCCAGTCCTGAAGCAGGTC |
| qPCR primer for PIKFYVE, Forward | This Manuscript | GGCTCACGCCTATAATCCTATC |
| qPCR primer for PIKFYVE, Reverse | This Manuscript | GCTGGAATGCAATGGTGTAATC |
| qPCR primer for GAPDH, Forward | This Manuscript | CGAGATCCCTCCAAAATCAA |
| qPCR primer for GAPDH, Reverse | This Manuscript | GTCTTCTGGGTGGCAGTGAT |
| qPCR primer for MAP2, Forward | This Manuscript | GGAACCAACTCTCTCTGGATTT |
| qPCR primer for MAP2, Reverse | This Manuscript | GCATTCTCTCTTCAGCCTTCT |
| qPCR primer for truncated STMN2, Forward | This Manuscript | GGACTCGGCAGAAGACCTTC |
| qPCR primer for truncated STMN2, Reverse | This Manuscript | GCAGGCTGTCTGTCTCTCTC |
| qPCR primer for Pikfyve, Forward (exon 6) | This Manuscript | GAAGCAATATTGGATGCCAGA |
| qPCR primer for Pikfyve, Reverse (exon 6) | This Manuscript | CCCATAAATTTTCCAGGGATT |
| qPCR primer for Pikfyve, Forward | This Manuscript | ACAGTGCTGAAGAAGGGCTC |
| qPCR primer for Pikfyve, Reverse | This Manuscript | ACAGATCAGGGCTCTTCCCT |
| qPCR primer for PPIA, Forward | This Manuscript | TCCTGGACCCAAAACGCTCC |
| qPCR primer for PPIA, Reverse | This Manuscript | CCATGGCAAATGCTGGACCA |
| DNA primer for S0 genotyping, Forward | This Manuscript | GTGACTAGTGAACCTAGCACATTG |
| DNA Common primer, TDP-43 genotyping | This Manuscript | TGAAATCCGGGTGGTATTGG |
| DNA WT primer, TDP-43 genotyping | This Manuscript | GGTGAGTTTAACCTTCAAGGGCT |
| DNA Transgene primer, TDP-43 genotyping | This Manuscript | AGCTTGCTAGCGGATCCAGAC |
| DNA primer for S1 genotyping, Forward | This Manuscript | GCCTGAGTTCTGAGAGTGAGTG |
| DNA primer for S2 genotyping, Forward | This Manuscript | CTGAAGCAATATTGGATGCCAGATAGC |
| DNA primer for S3 genotyping, Forward | This Manuscript | GTAAAGGTTGACTTGACTTACATGATAG |
| DNA primer for A1 genotyping, Reverse | This Manuscript | CTATGATGGGAAGAGTGGACAGTC |
| DNA primer for Cre Control, Forward | This Manuscript | CTAGGCCACAGAATTGAAAGATCT |
| DNA primer for Cre Control, Reverse | This Manuscript | GTAGGTGGAAATTCTAGCATCATCC |
| DNA primer for Cre Transgene, Forward | This Manuscript | GCGGTCTGGCAGTAAAAACTATC |
| DNA primer for Cre Transgene, Reverse | This Manuscript | GTGAAACAGCATTGCTGTCACTT |
| Negative control ASO | This Manuscript | mG*mC*mG*mA*mC*T*A*T*A*C*G*C*G*C*A*mA*mU*mA*mU*mG |
| PIKFYVE ASO1 | This Manuscript | mU*mG*mG*mC*mC*T*C*C*T*T*C*T*G*C*T*mC*mU*mC*mU*mC |
| PIKFYVE ASO2 | This Manuscript | mG*mC*mU*mG*mG*T*C*C*A*A*C*T*T*C*C*mA*mC*mU*mC*mA |
| RAB27A ASO | This Manuscript | mG*mA*mA*mA*mC*C*T*C*T*C*C*T*G*C*C*mC*mU*mG*mC*mU |
| VAMP7 ASO | This Manuscript | mC*mU*mA*mG*mG*C*T*A*A*A*C*A*G*G*T*mG*mG*mC*mU*mA |
| RAB8A ASO | This Manuscript | mU*mG*mG*mU*mU*G*A*C*C*T*G*G*T*C*C*mC*mA*mG*mU*mC |
| HSPA8 ASO | This Manuscript | mC*mA*mA*mG*mG*A*A*G*G*T*A*G*T*T*G*mC*mC*mA*mA*mC |
| NSMAF ASO | This Manuscript | mA*mU*mC*mU*mG*C*C*C*T*A*A*G*A*G*A*mA*mU*mA*mG*mC |
| ATG7 ASO | This Manuscript | mG*mU*mU*mG*mA*G*T*G*C*C*A*T*A*C*C*mA*mG*mU*mA*mG |
| MCOLN1 ASO | This Manuscript | mG*mG*mU*mU*mA*G*A*T*G*T*A*C*C*T*T*mC*mA*mC*mA*mU |
| GORASP1 ASO | This Manuscript | mG*mG*mA*mU*mA*G*A*C*C*T*A*G*T*C*A*mG*mG*mU*mA*mG |
| SMPD3 ASO | This Manuscript | mG*mG*mA*mU*mU*G*T*C*A*A*A*A*A*C*A*mG*mU*mC*mC*mC |
| Negative control ASO (in vivo) | This Manuscript | /52MOErC/*/i2MOErC//i2MOErT//i2MOErA//i2MOErT/A*G*G*A*C*T*A*T*C*C*/i2MOErA//i2MOErG//i2MOErG/*/i2MOErA/*/32MOErA/ |
| Pikfyve ASO (in vivo) | This Manuscript | /52MOErG/*/i2MOErC//i2MOErA//i2MOErT//i2MOErC/T*T*G*T*G*G*A*A*C*T*/i2MOErC//i2MOErT//i2MOErC/*/i2MOErC/*/32MOErC/ |
| Deposited data | ||
| Bulk RNA-seq data (DMSO or AP treatment) | This Manuscript | GEO: GSE221015 |
| Bulk RNA-seq data (Negative control or PIKFYVE ASO treatment) | This Manuscript | GEO: GSE221016, GSE221017 |
| Software and Algorithms | ||
| ImageJ | Schneider et al.68 | https://imagej.nih.gov/ij/index.html |
| Prism | Graphpad | https://www.graphpad.com/scientific-software/prism/ |
| Enrichr | Kuleshov et al.60 | https://maayanlab.cloud/Enrichr/ |