Abstract
Allergic rhinitis (AR) – commonly called hay fever – is a widespread condition that affects the quality of life of millions of people. The pathophysiology of AR remains incompletely understood. In particular, it is unclear if members of the colonizing nasal microbiota contribute to AR. Here using 16S rRNA sequencing we show that the nasal microbiome of patients with AR (n=55) shows distinct differences compared to that from healthy individuals (n=105), including decreased heterogeneity and the increased abundance of one species, Streptococcus salivarius. Using ex vivo and in vivo models of AR we demonstrate that this commensal bacterium contributes to AR development, promoting inflammatory cytokine release and morphological changes in the nasal epithelium that are characteristic of AR. Our data indicate that this is due to the ability of S. salivarius to adhere to the nasal epithelium under AR conditions. Our study indicates the potential of targeted antibacterial approaches for AR therapy.
Introduction
Rhinitis is a heterogeneous acute or chronic disorder that is associated with a significant burden on the quality of life and affects millions of people worldwide1. Allergic rhinitis (AR) is the most common form of rhinitis and distinguished from other forms by the underlying allergic cause and reaction2,3. In developed countries, the prevalence of AR has increased progressively over the last few decades, currently affecting between 10% and 30% of all adults4,5.
Symptoms of AR include nasal obstruction, itching, sneezing, and clear nasal discharge, which are caused by IgE-mediated reactions against inhaled allergens2,3. AR frequently coexists with asthma and other allergic diseases6. AR is classified in three ways: first, by the type of allergen, distinguishing seasonal AR, for which aeroallergens are the most common allergens, from perennial AR, for which allergens include dust mites, animal dander, and tree pollen; second, the frequency of symptoms, distinguishing intermittent AR (symptoms lasting < 4 days/week or < 4 weeks/year) from persistent AR (symptoms lasting ≥ 4 days/week and ≥ 4 weeks/year); third, by severity, distinguishing mild (symptoms not interfering with sleep, daily activities, physical exercise, entertainment, work and study) from moderate-severe AR (symptoms disturbing and severely affecting patient life)7,8.
The pathogenesis of AR includes a complex interaction of genetic and environmental factors that shape the immune system and host response. The early phase response occurs in sensitized individuals within minutes of allergen exposure, with mast cells being the best-known effector cells in this phase. The late phase reaction (2 to 6 hours after allergen exposure) typically involves infiltration of the nasal epithelium by eosinophils, basophils, monocytes and T-lymphocytes. The cytokine products of mast cells have the potential to recruit and activate other immune cells. Increasing evidence shows that also epithelial cells, in addition to their structural function, have potent immunomodulatory activities3.
The airway microbiome has long been believed to play an important role in the development of rhinitis9. However, in contrast to chronic (non-allergic) rhinosinusitis, for which several studies found significant differences in the microbiome composition as compared to healthy controls10–13, in the more limited number of studies on AR, considerable differences were not reported14,15. One study found overall increased diversity in the microbiome of seasonal AR patients but did not investigate further which bacterial phyla, genera or species are involved16, and another reported that microbial dysbiosis in AR correlated with total IgE levels17. Our knowledge about the relationship between the nasal microbiome and AR is thus still incomplete, and the reported lack of association of the composition of microbial nasal communities with AR may be due to the low sample sizes that were used in previous studies. Notably, all previous studies on that subject were merely observational in character and did not address the important question whether any detected dysbiosis contributes to the pathogenesis of AR or represents a mere consequence of the physiological changes in the nasal epithelium that are independently associated with AR development.
Here, we analyzed the nasal microbiome in a large cohort of AR patients and healthy controls, which allowed us to detect significant overall differences in microbiome composition as well as significant correlations of bacterial abundance with AR on the phylum, genus, and species level. We found that presence of one specific species, Streptococcus salivarius, was strongly associated with AR and that S. salivarius promoted main symptoms of AR as tested in vitro and in animal models of AR, indicating a causal relationship between that bacterium and AR pathogenesis.
Results
Study participants
For the analysis of the nasal microbiome, we collected samples from the middle meatus of AR patients (n=55) and healthy controls (HC, n=105). All samples were collected between November 1 and December 30, 2018, to minimize the influence of factors associated with seasonal AR, which in the northern hemisphere typically occurs in the summer months. All analyzed individuals filled out a written questionnaire, which contained questions on personal details (sex and age), clinical symptoms directly related to or associated with AR (nasal obstruction, nose itching, sneezing, nasal discharge, itchy eyes, tears, red eyes, ear occlusion, hearing loss, cough, chest tightness) and AR classification after explanation of defining factors. There were no significant differences in age or sex between the AR and HC groups, and types of AR categories (severity, seasonality, frequency) were about evenly distributed among AR patients (Table 1). All AR patients showed the defining symptoms of AR (see Methods) and were positive in the skin prick test (SPT) or serum-specific IgE test, which are routinely used to diagnose AR18. In contrast, all HC lacked these criteria. AR patients also showed common AR-related symptoms significantly more frequently than HC. In a subset of 34 randomly selected individuals (17 AR patients, 17 HC), AR patients showed increased serum concentrations of cytokines (significant for IL-6, IL-1β, and IFN-α), which is considered a hallmark of an allergic reaction19 (Extended Data Tab. 1). Among AR patients, significant differences in AR-related symptoms regarding AR severity, seasonality, and frequency were rare (Table 1).
Table 1.
Participant characteristics and symptoms
| AR patients | Healthy controls (HC) | p value1 | AR type by frequency | AR type by seasonality | AR type by severity | |||||||
|---|---|---|---|---|---|---|---|---|---|---|---|---|
| Intermittent | Persistent | p value1 | Seasonal | Perennial | p value1 | Mild | Moderate-severe | p value1 | ||||
| n | 55 | 102 | 25 | 30 | 27 | 28 | 26 | 29 | ||||
| Age | 31.38 ± 6.56 | 32.68 ± 11.73 | 31.24 ± 7.00 | 31.50 ± 6.29 | 32.19 ± 7.10 | 30.61 ± 6.02 | 32.81 ± 6.80 | 30.10 ± 6.17 | ||||
| Sex | ||||||||||||
| male | 27 (49%) | 63 (62%) | 0.13 | 10 (40%) | 17 (57%) | 0.28 | 12 (44%) | 15 (54%) | 0.59 | 10 38.5% | 12 41.4% | >0.9999 |
| female | 28 (51%) | 39 (38%) | 15 (60%) | 13 (43%) | 15 (56%) | 13 (46%) | 16 61.5% | 17 58.6% | ||||
| Nasal symptoms | ||||||||||||
| Obstruction | 51 (93%) | 0 (0%) | <0.0001 | 23 (92%) | 28 (93%) | >0.9999 | 25 (93%) | 26 (93%) | 0.67 | 22 (85%) | 29 (100%) | 0.044 |
| Itchiness | 46 (84%) | 0 (0%) | <0.0001 | 19 (76%) | 27 (90%) | 0.27 | 23 (85%) | 23 (82%) | >0.9999 | 21 (81%) | 25 (86%) | 0.72 |
| Sneezing | 47 (86%) | 0 (0%) | <0.0001 | 21 (84%) | 26 (87%) | >0.9999 | 23 (85%) | 24 (86%) | >0.9999 | 20 (77%) | 27 (93%) | 0.13 |
| Clear discharge | 49 (89%) | 0 (0%) | <0.0001 | 20 (80%) | 29 (97%) | 0.082 | 23 (85%) | 26 (93%) | 0.42 | 22 (85%) | 27 (93%) | 0.41 |
| Other symptoms | ||||||||||||
| Chest tightness | 3 (5.5%) | 0 (0%) | 0.042 | 2 (8.0%) | 1 (3.3%) | 0.59 | 1 (3.7%) | 2 (7.1%) | >0.9999 | 1 (3.8%) | 2 (6.9%) | >0.9999 |
| Cough | 6 (11%) | 0 (0%) | 0.0015 | 1 (4.0%) | 5 (17%) | 0.2 | 2 (7.4%) | 4 (14%) | 0.67 | 2 (7.7%) | 4 (14%) | 0.67 |
| Itchy or red eyes | 25 (46%) | 0 (0%) | <0.0001 | 11 (44%) | 14 (47%) | >0.9999 | 8 (30%) | 17 (61%) | 0.031 | 9 (35%) | 16 (55%) | 0.27 |
| Ear occlusion or hearing loss | 6 (11%) | 0 (0%) | 0.0015 | 1 (4.0%) | 5 (17%) | 0.2 | 2 (7.4%) | 4 (14%) | 0.67 | 2 (7.7%) | 4 (14%) | 0.67 |
Fisher’s exact test. Significance (p<0.05) is indicated by bold face of p values.
Microbiome composition in AR
All obtained samples underwent 16S rRNA amplicon sequencing. Three samples from the HC group were excluded due to insufficient sequence read depth. 157 samples provided a high-quality profile for analysis (Extended Data Fig. 1). There was no significant difference in total operational taxonomic units (OTUs) between the AR and HC groups, confirming compositional similarity (Extended Data Fig. 1). We detected significantly lower microbiota diversity in the AR than HC group (α-diversity, Shannon diversity index, p<0.0001) and significant compositional difference of the microbiota of the two groups (β-diversity, Weighted Unifrac PCoA, p= 0.0005) (Fig. 1a,b).
Fig. 1. Nasal microbiome composition in allergic rhinitis patients.
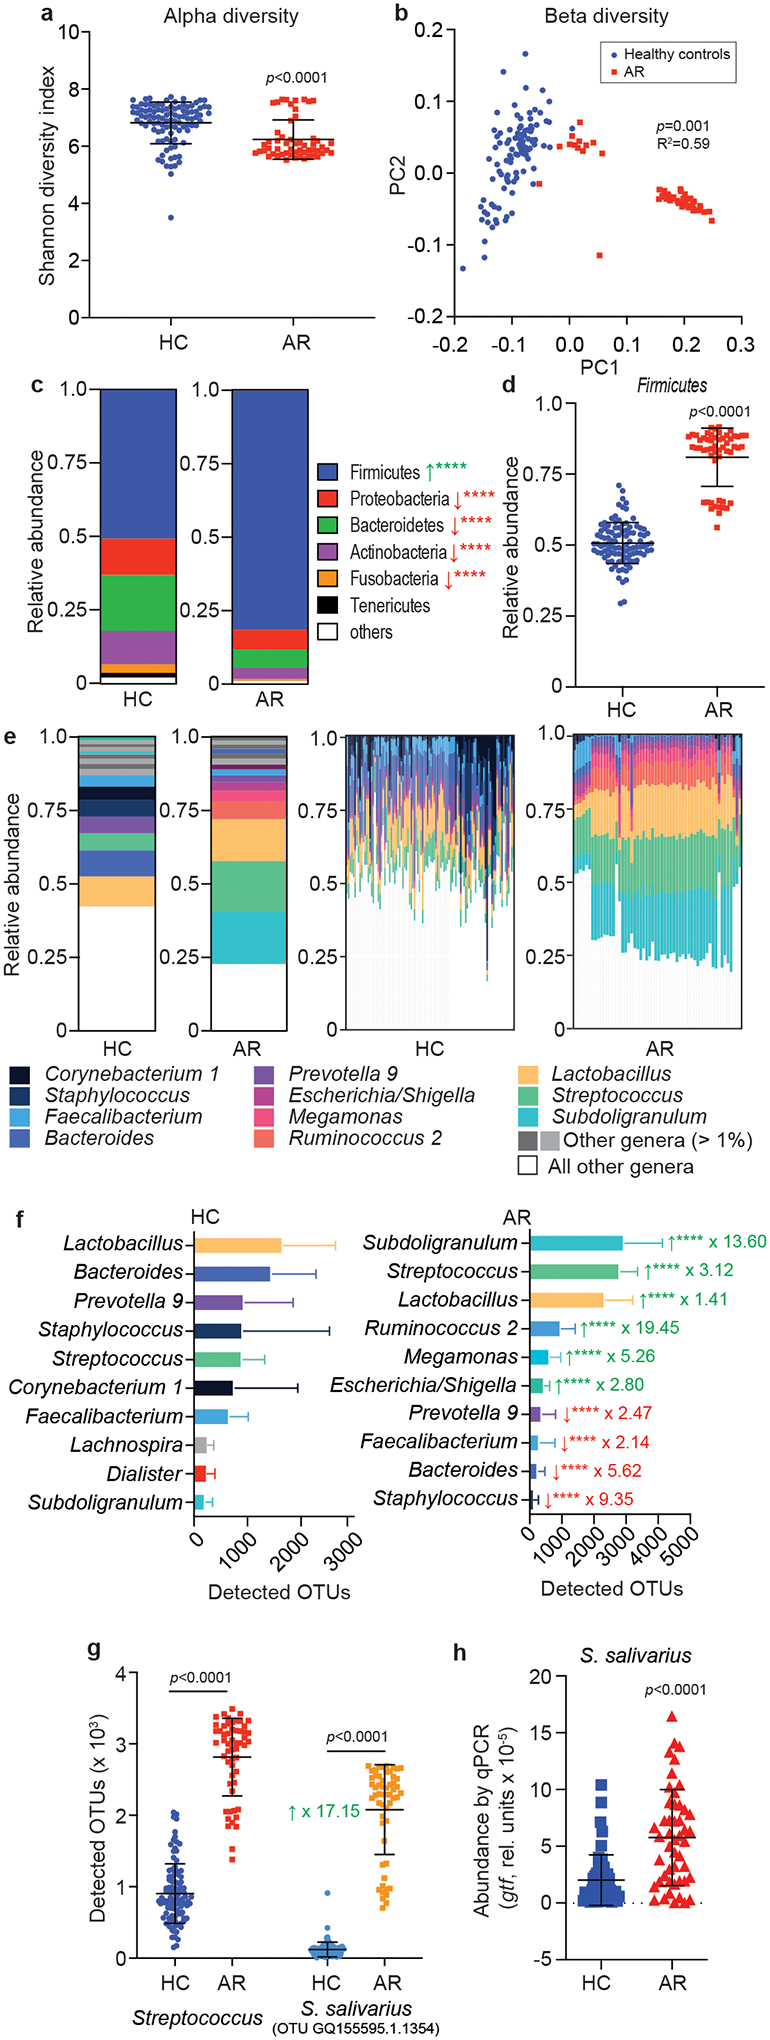
a, α-diversity (Shannon index), and b, β-diversity (principal coordinate analysis, PC) of nasal microbiome samples from allergic rhinitis patients (AR) and healthy controls (HC). c, Relative abundance of phyla. Green arrows signify significant increase in AR patients, red arrows significant decrease. ****, p<0.0001. d, Relative abundance data for the phylum Firmicutes (Bacillota) by single individual. See Extended Data Fig. 2 for the other phyla shown in panel c. e, Relative abundance of genera. Left two graphs, overall abundance; right two graphs, abundance by single individual. f, Absolute abundance of the 10 most abundant genera in AR and HC. ****, p<0.0001. Green arrows signify significant increase in AR patients, red arrows significant decrease. Factors by which the means differ are indicated. See Extended Data Fig. 4 for results by single individual. g, Absolute abundance of the genus Streptococcus and the OTU representing S. salivarius. h, Abundance of S. salivarius by qPCR. a,c,d,f,g,h, Statistical analysis is by two-tailed unpaired Mann-Whitney tests. Error bars show the mean ± SD. b, Statistical analysis is by Adonis. a-g, n= 55 (AR), n=102 (HC); h, n=52 (AR), n=58 (HR) (all samples with sufficient DNA for qRT-PCR analysis). c,f,
Analysis at the phylum level revealed a significant increase of the Firmicutes (Bacillota) phylum (Fig. 1c,d; Extended Data Fig. 2). This appeared to occur at the expense of other abundant phyla, as there were no significant differences in the absolute number of bacteria in the noses of HC and AR patients (Extended Data Fig. 3). Analysis at the genus level showed striking loss of heterogeneity of the microbiota in AR patients as compared to HC (Fig. 1e,f), in accordance with the α-diversity results. Both relative and absolute abundance analyses at the genus level revealed significant changes in abundance of virtually all major genera (Fig. 1e,f; Extended Data Fig. 4). In most AR patients, only two genera, Subdoligranulum and Streptococcus, comprised about 30% of the differentially abundant genera (with a linear discriminant analysis score >3 and p < 0.05). In contrast, no bacterial genus showed similarly consistent prevalence in the HC group, where the genus composition generally showed much higher individual variation. These data demonstrate considerable and defined changes in the microbiome composition in AR patients, which according to our results is characterized by abundant prevalence of only a few specific genera in remarkable consistence among different individuals suffering from AR.
We also analyzed whether there are differences in the microbiome composition in our AR population regarding age and sex, as well as severity, seasonality, and frequency of AR symptoms. We did not observe significant differences between the analyzed groups in any of those categories on the overall, phylum, or genus levels (Extended Data Figs. 5,6).
Prevalence of Streptococcus salivarius in the AR microbiome
When we analyzed our data for the abundance of specific OTUs, we found that the by far most abundant OTU in AR patients, representing 12.69% of all OTUs in that group, was an OTU composed of one specific species, Streptococcus salivarius (Table 2). The abundance of this OTU even exceeded that of the combined major Subdoligranulum OTUs, even though those represent an entire genus. This S. salivarius OTU was strongly and significantly increased in abundance in the AR as compared to the HC group (× 17.15; p < 0.0001) and accounted for virtually the entire difference observed for combined Streptococcus OTUs (Fig. 1g). This result strongly contrasted that obtained for Staphylococcus epidermidis, a species associated with a beneficial function in the nasal microbiome20. S. epidermidis was the most abundant singular-species OTU and the second most abundant OTU in general in HC (Table 2) and showed significantly higher abundance in HC than AR patients (Extended Data Fig. 7). We confirmed the results obtained by 16S RNA sequencing by quantitative PCR of species-specific genes for S. salivarius and S. epidermidis (Fig. 1h; Extended Data Fig. 7). These findings show strongly increased abundance of S. salivarius in the nasal microbiome of AR patients, and among all members of the nasal microbiome an exceptional and remarkable association with AR.
Table 2.
Most abundant OTUs in the nasal microbiome of AR patients versus healthy controls
| OTU ID | Genus | Species | Mean OUT number | Percent of total OTU |
|---|---|---|---|---|
| Increased in AR patients | ||||
| GQ155595.1.1354 | Streptococcus | Streptococcus salivarius | 2078.91 | 12.69 |
| HQ790217.1.1420 | Subdoligranulum | 1072.56 | 6.55 | |
| FP929051.297741.300852 | Ruminococcus 2 | 947.38 | 5.78 | |
| DQ057426.1.1473 | Lactobacillus | Lactobacillus salivarius strain | 847.71 | 5.17 |
| GQ130122.1.1447 | Subdoligranulum | 763.24 | 4.66 | |
| New reference OTU161 | Lactobacillus | 616.18 | 3.76 | |
| KF842617.1.1434 | Megamonas | 500.51 | 3.06 | |
| FJ950694.1.1472 | Escherichia/Shigella | 432.16 | 2.64 | |
| JN981856.1.1446 | Lactobacillus | 420.76 | 2.57 | |
| Increased in Healthy Controls (HC) | ||||
| GQ448342.1.1392 | Prevotella 9 | 899.56 | 5.51 | |
| GBKB01000906.322.1853 | Staphylococcus | Staphylococcus epidermidis | 840.15 | 5.15 |
| KF078047.1.1392 | Lactobacillus | 780.57 | 4.78 | |
| GQ448359.1.1396 | Bacteroides | Bacteroides vulgatus strain | 499.30 | 3.06 |
| GQ061101.1.1342 | Corynebacterium 1 | Corynebacterium segmentosum | 441.87 | 2.71 |
| GQ492999.1.1327 | Faecalibacterium | 423.36 | 2.59 | |
| New reference OTU470 | Lactobacillus | 336.60 | 2.06 | |
| CVOA01000775.73.1588 | Bifidobacteriaceae | 318.87 | 1.95 | |
| FJ983094.1.1542 | Streptococcus | Streptococcus sanguinis | 281.03 | 1.72 |
| HQ802052.1.1445 | Bacteroides | 275.29 | 1.69 | |
S. salivarius abundance is not due to bacteriocins.
S. salivarius is a major commensal of the human oral cavity and upper airways throughout life21,22. S. salivarius has occasionally been reported to cause opportunistic infections, such as meningitis23, but is also known as a potential probiotic, with the probiotic potential mostly linked to bacteriocin production and bacteriocin-based competition with pathogenic bacteria24. However, the production of bacteriocins is limited to specific isolates of this species. Notably, if the abundance of S. salivarius that we observed in the noses of AR patients were due to bacteriocin production, it would likely also manifest under non-allergic conditions. To further establish that this observed abundance is unlikely to be due to bacteriocin-based bacterial competition, we analyzed anti-bacterial activity of all 14 S. salivarius nasal isolates we obtained using as targets main nose-colonizing bacteria (S. epidermidis, Corynebacterium accolens, Cutibacterium acnes)25 and Micrococcus luteus, a bacterium highly sensitive to bacteriocin activity of Gram-positive bacteria and routinely used to assess bacteriocin production26. We detected only weak activity in two out of 14 isolates and only toward M. luteus but not the nasal colonizers (Extended Data Fig. 8). Furthermore, we sequenced the whole genome of all those obtained 14 S. salivarius strains, only four of which contained bacteriocin biosynthetic operons, in agreement with the reported strain specificity of bacteriocin production in S. salivarius. While neither in vitro nor genome analyses can completely exclude production of antibacterial substances in vivo, these observations indicate that a bacteriocin-based direct bacterial competition effect is unlikely to explain the observed abundance of S. salivarius in the noses of AR patients.
Increased AR pathology due to S. salivarius
To test whether the increased abundance of S. salivarius in the nasal microbiome of AR patients contributes to AR pathophysiology, we employed an Alternaria alternata-induced mouse model of airway inflammation. The fungus A. alternata is primarily an environmental aeroallergen and has been clinically associated with AR and asthma27. It is frequently used to induce allergic conditions in allergy models28. In our model, C57BL/6J mice received S. salivarius (a nasal isolate from an AR patient randomly selected from those isolates previously selected for measurement of bacteriocin activity) or PBS as control, and A. alternata or vehicle an hour later, once daily over three days (Fig. 2a). One hour after the last treatment, mice were euthanized, and nasal epithelia investigated by histology and analyzed for cytokine gene expression. Treatment with A. alternata or S. salivarius alone increased expression of a series of cytokine genes, with the increase of TNF-α and IL-6 mRNA significant for stimulation by S. salivarius and that of IL-5, IL-6, and TNF-α mRNA significant for A. alternata treatment (Fig. 2b). Notably, compared to mice only receiving S. salivarius or A. alternata treatment, those receiving S. salivarius and A. alternata treatment showed significantly higher mRNA levels of all tested cytokines, namely the inflammatory cytokines IL-1β29, IL-630, and TNF-α31, the epithelial cytokine IL-2532, and the Th-2-response-related cytokine IL-533 (Fig. 2b, Extended Data Fig. 9).
Fig. 2. S. salivarius exacerbates pathophysiology of AR in a mouse model.
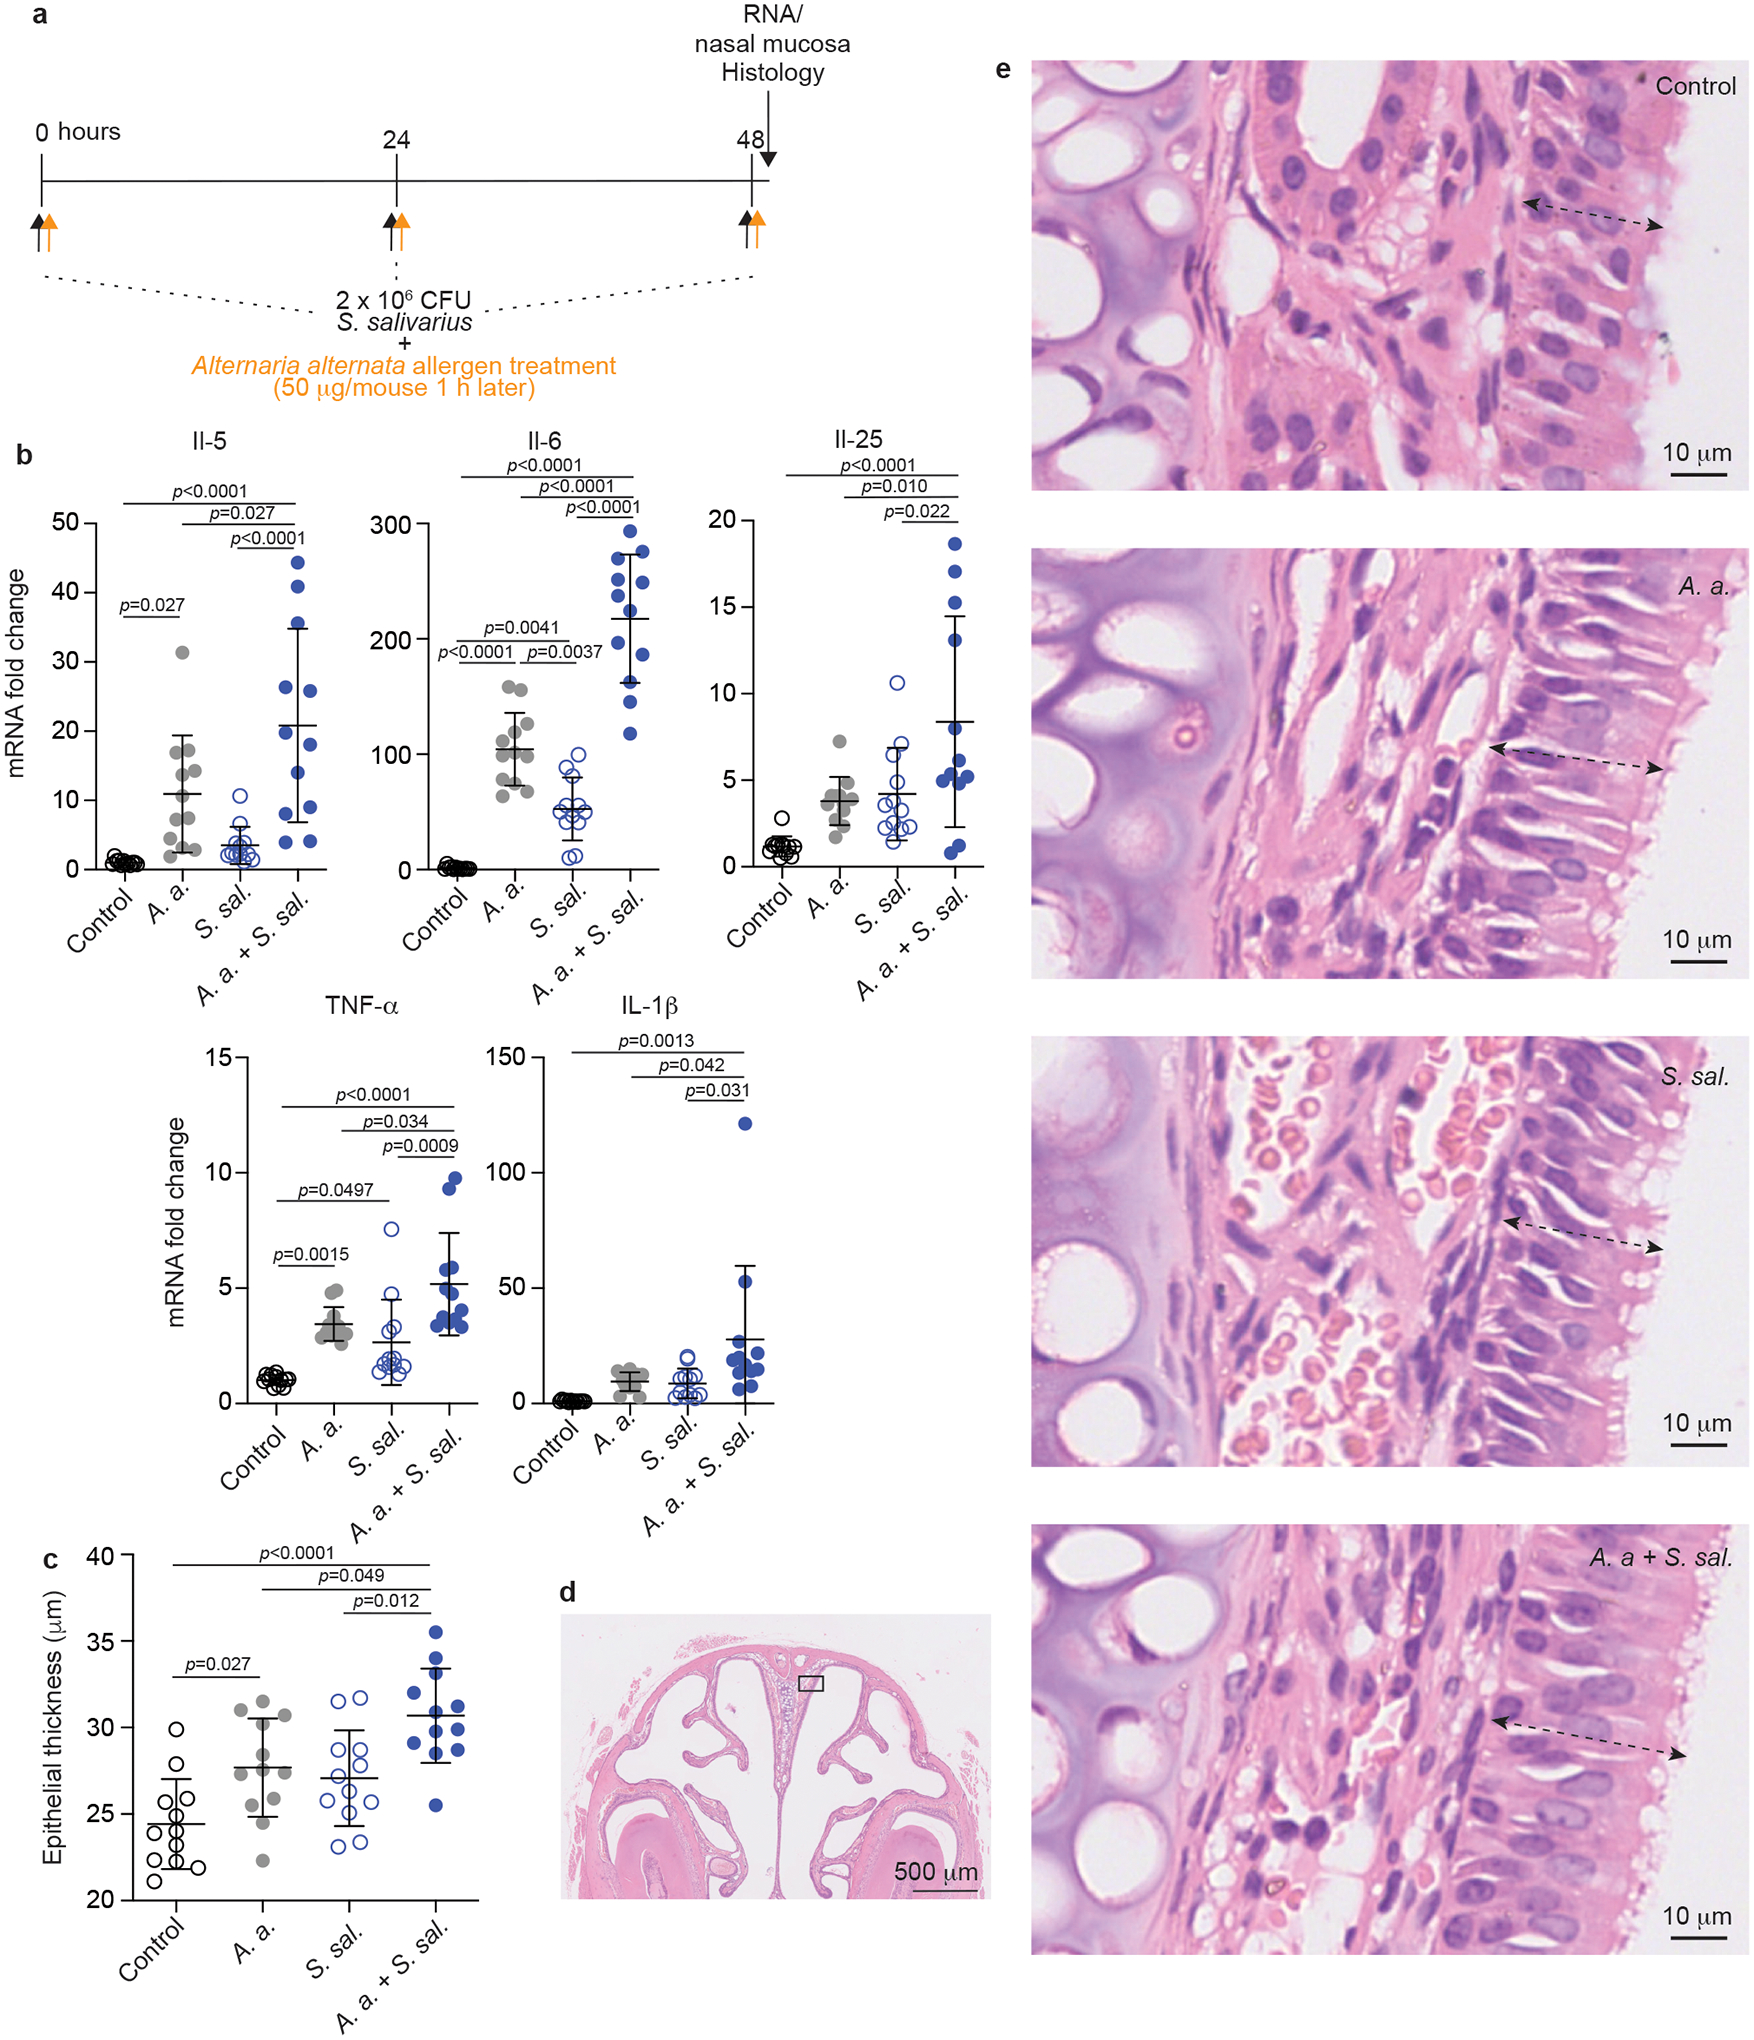
a, Mouse model of AR. 2 × 10⁶ CFU S. salivarius was instilled into the nares of C57BL/6J mice (n=12/group) once daily for 3 days. One hour later, 20 μl of A. alternata extract (50 μg per mouse) or vehicle (20 μl of 0.1% BSA in PBS) was instilled. Control animals were sham infected with PBS alone. All mice were sacrificed one hour after their last intranasal treatment. The nasal mucosa was collected, homogenized and used for RNA extraction. b, Cytokine expression in harvested nasal mucosal tissue. c, Thickness of the nasal epithelium as determined by histological examination. d, Examples of histological assessment of nasal epithelia. e, Example picture of nose histology with the approximate location where pictures for the examination shown in panels c and d were taken. Dotted arrows show extension of the epithelium. b,c, Statistical analysis is by 1-way ANOVAs with Tukey’s post-tests. *, p<0.05; **, p <0.01; ***, p <0.001; ****, p <0.0001. Error bars show the mean ± SD. This experiment was repeated in its entirety with cytokine expression and epithelial thickness results showing similar results (Extended Data Fig. 9).
Furthermore, we examined the effect of S. salivarius and A. alternata on nasal epithelial thickness in the posterior lateral meatus. Coadministration of S. salivarius with A. alternata induced significantly enhanced epithelial thickness as compared to treatment with S. salivarius or A. alternata alone (Fig. 2c–e, Extended Data Fig. 9). These findings indicate a significant impact of S. salivarius on the pathophysiological hallmarks of AR development.
S. salivarius induce cytokines in airway epithelial cells.
To gain insight into the mechanism underlying the stimulation of cytokine responses during AR by S. salivarius, we analyzed whether S. salivarius can stimulate expression of cytokines ex vivo in allergen-exposed monolayers of airway epithelial (A549) cells. For this experiment, we used five randomly selected S. salivarius nasal isolates from AR patients and five randomly selected S. epidermidis nasal isolates as controls. We found that all S. salivarius, but not S. epidermidis isolates stimulated expression of the pro-inflammatory cytokines IL-630, IL-834 and TNF-α31, the epithelial cytokines IL-3335 and TSLP36, which trigger the Th2 cell-mediated allergic cascade, and the chemoattractant eotaxin-1 (CCL11)37, which is a specific chemoattractant for eosinophils, the leukocyte type characteristically associated with allergic reactions38 (Fig. 3a). All these changes were significant when compared as a group to the S. epidermidis or control group and only with stimulation by A. alternata antigen. These data show that S. salivarius nasal isolates have specific capacity to induce cytokine expression in allergen-exposed nasal epithelial cells.
Fig. 3. S. salivarius promotes cytokine gene expression in allergen-induced epithelial cells.
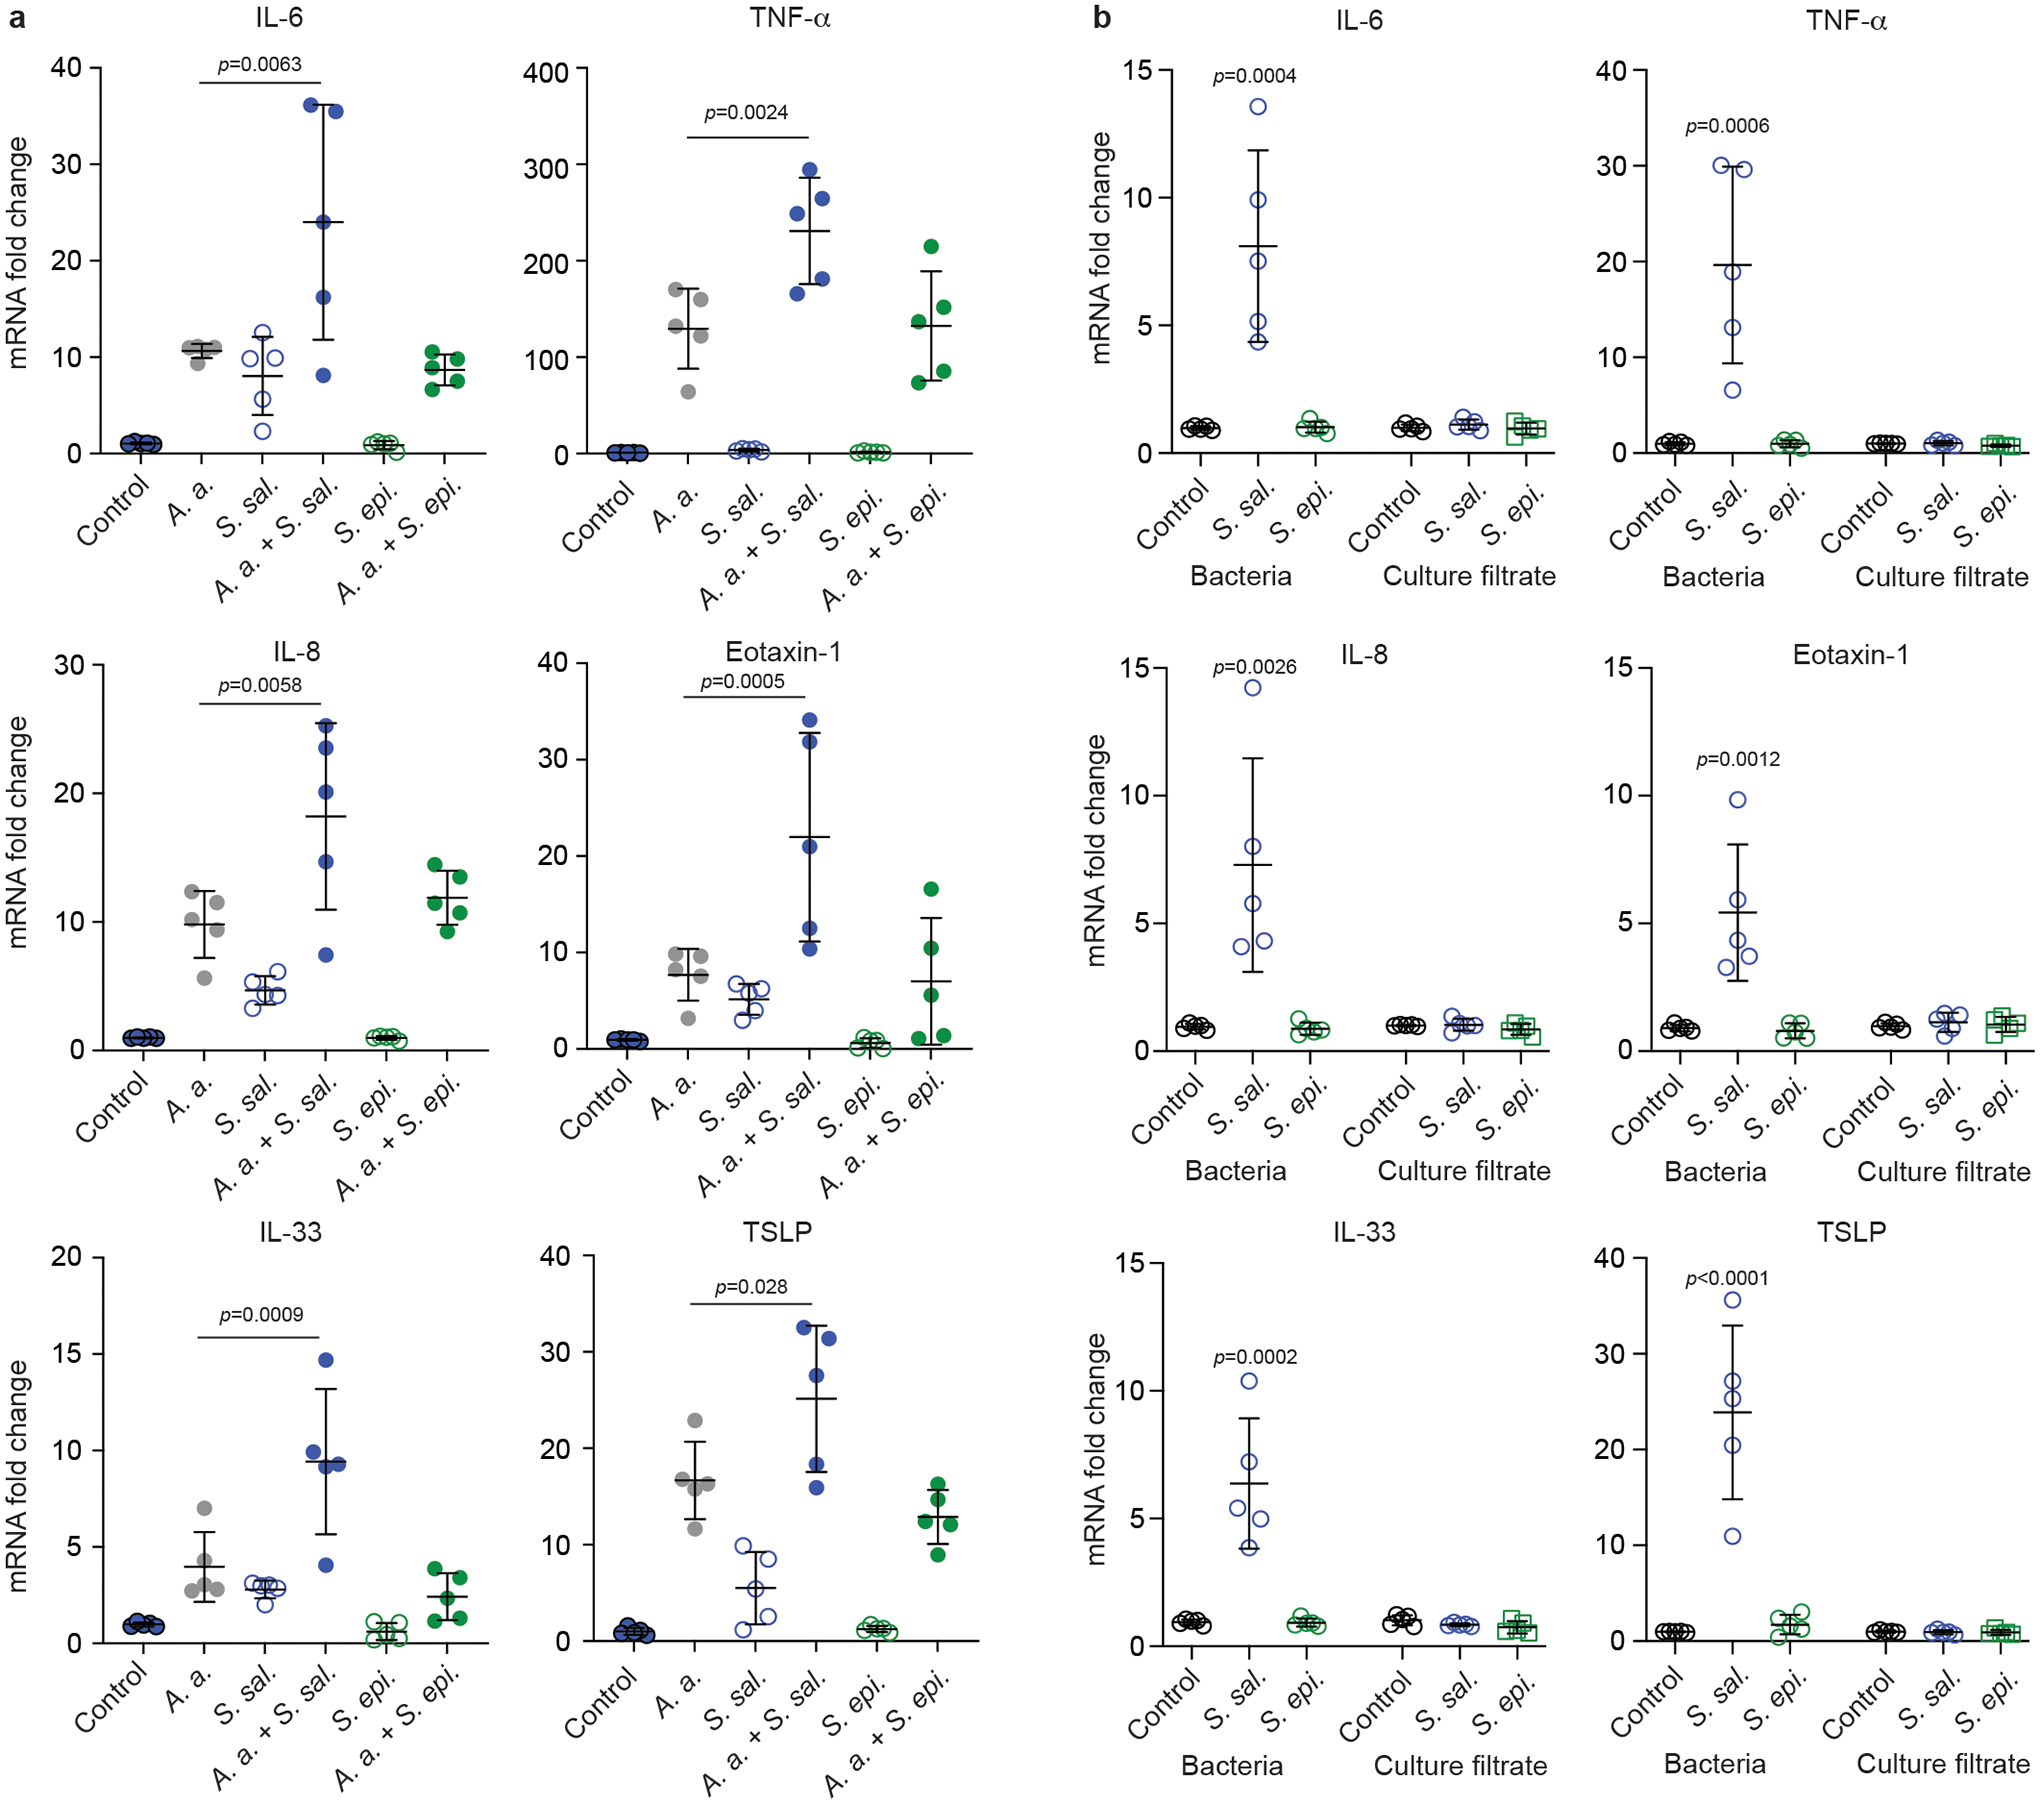
a, A549 epithelial cells were exposed to 1 × 10⁴ CFU of S. salivarius (S. sal.) or S. epidermidis (S. epi.) isolates (n=5/group) for 24 h with and without stimulation by A. alternata (A. a.) and cytokine expression was determined by qRT-PCR. Statistical analysis is by 1-way ANOVAs with Tukey’s post-tests. Results for the comparisons of A. a. versus A. a. + S. sal. and A. a. + S. epi and of control versus S. sal and S. epi are shown. Not specified comparisons were not significant (p ≥ 0.05). b, Comparison of effects exerted by culture filtrate and bacteria of the same isolates. “Bacteria” values were obtained as in a. For “culture filtrate” values, 1 × 10⁴ CFU of S. salivarius or S. epidermidis were incubated in 10% DMEM for 24 h, then culture filtrates were collected and added to the monolayer of A549 cells for another 24 h and cytokine expression was determined by qRT-PCR. Statistical analysis is by 1-way ANOVA with Dunnett’s post-test versus control within the culture filtrate and bacteria groups. Not specified comparisons were not significant (p ≥ 0.05). Error bars show the mean ± SD.
To test whether the S. salivarius factors that are responsible for cytokine induction are secreted into the surrounding media, we performed the same experiment using culture filtrates. However, we did not detect any cytokine induction by S. salivarius culture filtrates that was significantly higher than that by controls or S. epidermidis isolates, in clear contrast to results obtained with whole bacteria (Fig. 3b). These data indicate that the pro-inflammatory S. salivarius factors that induce cytokine expression in epithelial cells are attached to the bacterial surface.
Adherence of S. salivarius to allergen-exposed epithelium
S. salivarius is not known to produce specific secreted or surface-attached pro-inflammatory molecules that would result in increased capacity for cytokine induction as compared to other nasal colonizers. Especially given the extensive research on S. salivarius as a probiotic24,39,40, that such factors would have remained unnoticed is unlikely. Furthermore, species-specific pro-inflammatory factors are often toxins or toxin-like molecules41, which are released to the surrounding environment, while our results point to surface-attached factors. However, the main surface-attached bacterial factors that are pro-inflammatory are common to large groups of bacteria (despite being termed pathogen-associated molecular patterns, PAMPs), with major differences between Gram-negative and Gram-positive bacteria42. Thus, to explain the exceptional capacity of S. salivarius for cytokine induction in the nasal epithelium one would have to postulate that these structures come into closer contact with the epithelium, such as by increased adhesion. This hypothesis is supported by the fact that the nasal epithelium in AR shows distinct characteristics, such as most notably mucus hypersecretion43, that may explain differential capacity of bacteria to adhere to the diseased versus healthy epithelium.
We therefore investigated whether the five randomly selected S. salivarius nasal isolates showed altered adhesion to airway epithelial cells and the nasal epithelium in vivo upon allergen exposure. We again used A. alternata as allergen to induce AR. After treatment with A. alternata, we observed significantly increased expression in the epithelia cells of the gene encoding mucin5AC (MUC5AC), a hallmark of AR that is pathologically and functionally linked to allergic airway hyper-reactivity44 (Fig. 4a), indicating that this characteristic development of nasal epithelial cells upon allergen exposure was present in our setup. Despite considerable strain-to-strain variation, as a group, S. salivarius isolates showed significantly increased adhesion to RPMI 2650 and A549 airway epithelial cell lines when exposed to allergen as compared to controls without allergen exposure (Fig. 4b). Without allergen exposure, adhesion was not significantly different from that by a group of five randomly selected S. epidermidis nasal isolates (Fig. 4b). Furthermore, S. epidermidis isolates, in contrast to S. salivarius isolates, did not show allergen-induced alteration of adhesion (Fig. 4b).
Fig. 4. S. salivarius shows strong adhesion to nasal epithelia under allergen-induced conditions.
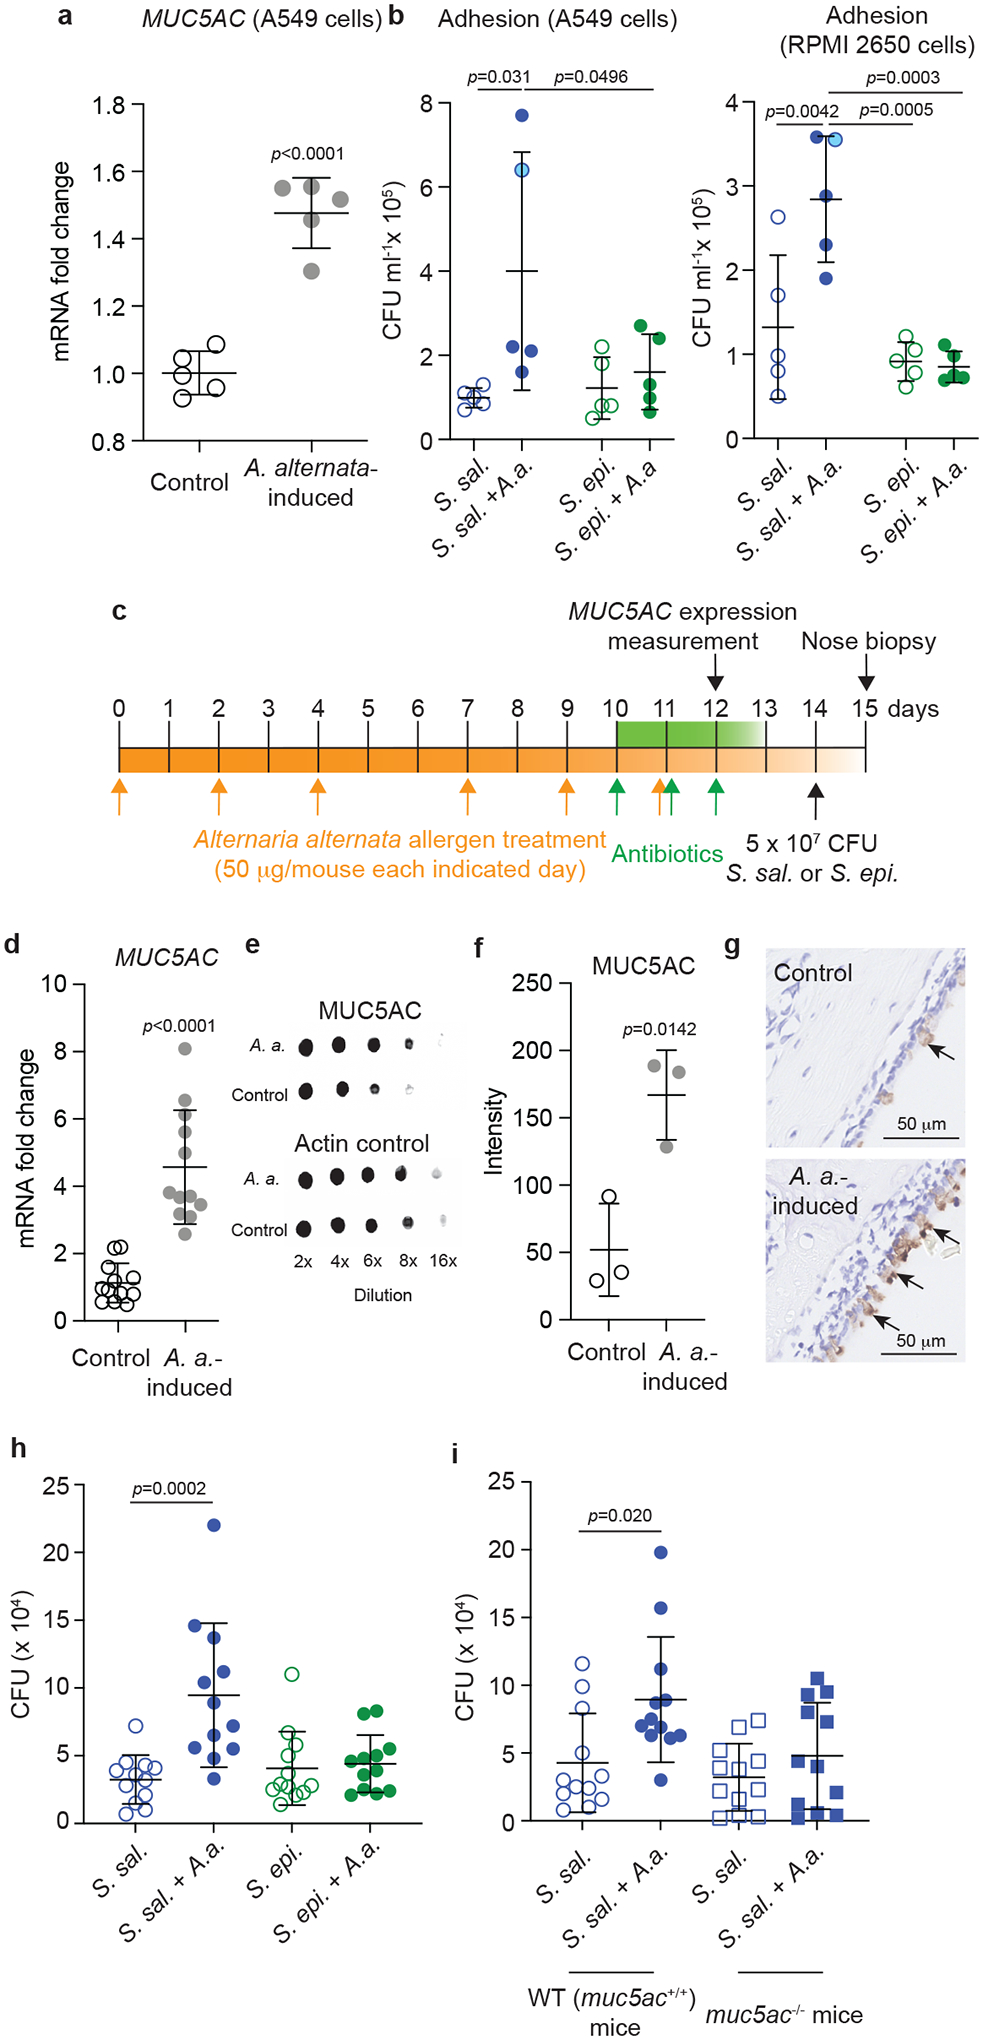
a, Expression of the MUC5AC gene in control and A. alternata-induced A549 epithelial cells. n=5/group (same isolates as in Fig. 3). b, Adhesion of S. salivarius (S. sal.) or S. epidermidis (S. epi) isolates (same isolates as in Fig. 3), with and without A. alternata (A.a.) induction, to A549 and RPMI 2650 epithelial cells. Values shown are averages of n=3 independent replicates per isolate. Statistical analysis is by 1-way ANOVAs with Tukey’s post-tests. Blue circle symbols with light blue filling are used for the values of the S. salivarius isolate chosen for the in vivo experiment in panels c-i. c, Mouse colonization model under allergen-induced conditions. C57BL/6J (or C57BL/6NCrl mice in the experiment comparing to C57BL/6NCrl MUC5AC−/− mice) were inoculated intranasally with 50 μg in 5 μl A. alternata extract on days 0, 2, 4, 7, 9, and 11, while mice in the control group received PBS instead (n=12/group for MUC5AC expression and nose biopsies; n=3 for MUC5AC protein level assays). From day 10, the mice received antibiotics to eradicate the preexisting microbiota once daily for 3 days. On day 14, 5 × 10⁷ CFU of S. salivarius or S. epidermidis in 10 μl PBS were instilled intranasally (5 μl per nostril). 24 hours later, the mice were euthanized, noses were homogenized, and CFU were counted. d, Expression of the MUC5AC gene in nasal epithelia at day 12 (one day after the end of the A. alternata treatment). e,f, Analysis of MUC5AC protein expression by immuno-dot blots (e, example pictures, f, densitometry of dots obtained at 8 × dilution). g, Immunohistochemical detection of MUC5AC protein in the nasal epithelium. Arrows point to positive reaction (brown color). A picture representative of pictures taken in three mice is shown. h, Determination of CFU in the nose after biopsy in the experiment comparing S. salivarius and S. epidermidis. i, Determination of CFU in the nose after biopsy in the experiment with S. salivarius comparing control (MUC5AC+/+) to MUC5AC−/− mice. a,d,f, Statistical analysis is by unpaired, two-tailed t-tests. b,h,i, Statistical analysis is by 1-way ANOVAs with Tukey’s post-tests. a,b,d,f,h,i, Error bars show the mean ± SD.
We then set up a mouse model of AR, in which mice received pre-treatment with A. alternata followed by topical antibiotic treatment to eradicate the pre-existing nasal microbiota, after which the nares of the mice were instilled with S. salivarius bacteria. Control mice received the same amount of S. epidermidis or PBS (Fig. 4c). For this model, we used the same S. salivarius isolate we had used for the experiment shown in Fig. 2. We confirmed that there was significantly increased expression of MUC5AC after the A. alternata treatment also in this in vivo setup both on the transcriptional and protein level (Fig. 4d–g). We observed significantly increased S. salivarius but not S. epidermidis CFU in the nares of allergen-exposed as compared to control mice in nose biopsies obtained one day after administration of the bacteria (Fig. 4h). Finally, the significantly increased adhesion of S. salivarius to the nasal epithelium in mice was abolished in MUC5AC −/− mice (Fig. 4i). Together, these ex vivo and in vivo results indicate that allergen-induced conditions in the nasal epithelium lead to specifically increased adherence of S. salivarius by increased adhesion to mucin5AC.
Discussion
In recent years, many pathologies and conditions have been associated with alterations in the composition of the human microbiome45. However, it has remained challenging to provide evidence for underlying causal relationships as well as identify the specific bacteria and associated mechanisms that are involved46.
AR is a widespread disease, which is characterized by inflammatory reactions in the nasal epithelium that are triggered by allergens2,3. Some studies have reported bacterial dysbiosis in AR patients14,15. However, findings were quite inconsistent, a situation potentially due to low numbers of study participants. In our present, larger-scale study, we observed with remarkable consistency strongly reduced heterogeneity of the nasal microbiome in AR patients, with two bacterial genera dominating, Subdoligranulum and Streptococcus.
Subdoligranulum is a barely characterized genus with only one isolate of an obligatory anaerobic species obtained from the intestinal tract47. There have been multiple microbiome studies reporting high abundance of Subdoligranulum under specific conditions; however, a recent mouse study indicated absence of an underlying causal relationship48. While the abundance of Subdoligranulum in AR patients that we observed in the present study is certainly of interest, the limited information that is available on this genus and the fact that it is not clear whether nasal isolates belong to the same species as that isolated from the gut, precluded further experimental analysis of its relationship with AR. We attempted isolation of Subdoligranulum from nasal samples of AR patients, but these attempts were not successful.
Species of the genus Streptococcus have been intensely studied for over a century and range from strongly pathogenic species, such as Streptococcus pyogenes or Streptococcus pneumoniae, to commensal species for example of the viridans group of streptococci. This group contains species that are much less pathogenic and for which roles in disease have only rarely been described49. S. salivarius in particular has even been attributed potential as a probiotic microorganism24. Importantly, our analysis of specific OTUs revealed that by far the most abundant single species that was elevated in abundance in the nasal microbiome of AR patients was S. salivarius, and this species accounted for virtually the entire increase that we observed for the genus Streptococcus.
To the best of our knowledge, there is currently no available direct evidence suggesting an involvement of bacteria in promoting symptoms of AR. The remarkable association of S. salivarius nasal abundance with AR that we detected in our nasal microbiome study prompted us to investigate whether S. salivarius might contribute to AR development. We found that S. salivarius, but not the frequent nasal colonizer S. epidermidis20,50, which we studied as a control, significantly increased hallmark phenotypes of AR, including cytokine gene expression in allergen-induced nasal epithelial cells in vitro as well as cytokine gene expression and epithelial thickness in vivo in a mouse model of AR. Our findings thus not only indicate an association between abundance of nasal S. salivarius and AR but a direct contribution of that specific commensal to AR pathogenesis.
As for a potential mechanism underlying that contribution, our data suggest that the role of S. salivarius in AR development is associated with an exceptional capacity of this commensal to adhere to the nasal epithelium under AR conditions. This notion is strongly supported by the facts that (i) we observed strong adhesion of S. salivarius (but not S. epidermidis) to nasal epithelial cells only under allergen-induced conditions, (ii) we found significantly increased adhesion of S. salivarius to the nasal epithelium in vivo when exposed to allergen, and (iii) S. salivarius is known to produce a specific set of surface proteins that adhere to mucins, particularly mucin 5A51, which is the main mucin associated with AR pathophysiology44 and also showed increased expression in our AR models. Notably, we provide evidence using MUC5AC−/− mice that MUC5AC is crucial for the observed adhesion phenotype. Our data are in accordance with a model in which increased adhesion leads to the observed enhanced inflammatory reactions by facilitating contact between the common pro-inflammatory factors located on the surface of bacteria and their receptors on the nasal epithelium.
In conclusion, our study reveals a distinct bacterial dysbiosis in AR that is characterized by decreased bacterial heterogeneity, dominance of only a few genera, and a remarkable increase in abundance of one species. Our discovery that one defined bacterial species, S. salivarius, exacerbates AR development indicates potential for future development of target-oriented therapeutic options to limit AR pathophysiology without interference with the other, in part beneficial, constituents of the nasal microbiome.
Methods
Human participants.
Healthy volunteers were recruited from the medical center of Renji hospital, Shanghai, China. AR patients were recruited from the ENT clinic of Renji hospital and Shanghai Ninth People’s hospital. All were between 20 and 50 years of age (Table 1). The study physician administered to each subject a detailed written questionnaire. Diagnostic criteria for AR were: (i) typical rhinitis symptoms including rhinorrhea, nasal obstruction and itching, and sneezing, and (ii) a positive skin prick test (SPT, wheal diameter ≥ 3 mm larger than that of negative control after 15 min) to at least one allergen, or instead of a positive SPT, serologic evidence (> 0.35 kU/l) of sensitivity to at least one of 12 aeroallergens as determined by presence of specific IgE using ImmunoCap IgE assays (Thermo-Scientific). Healthy controls did not self-report or were diagnosed by a physician with past or current rhinitis. Further exclusion criteria included receiving immunotherapy, chronic rhinosinusitis, other allergic disease (allergic skin diseases and allergic asthma), or respiratory infection within 6 weeks, or antibiotic use within one month before enrollment.
Sample collection.
Nasal swabs were collected from HC and AR patients with sterile gloves and instrumentation. Specimens were obtained from the bilateral middle meatus for each patient under direct endoscopic guidance using a sterilized cotton swab (COPAN LQ Stuart Transport Swab; COPAN Italia S.p.A, Brescia, Italy). No topical sprays were used prior to sample collection. After sampling, the swabs were immediately placed back in the collection tube and stored at −80°C until retrieval for analysis.
Sample DNA extraction.
DNA was extracted using the QIAGEN DNA Mini Kit 51306. Nasal swabs were vortexed for 2 min in 1 ml of modified liquid Amies transport medium52. 500-μl samples from each swab were centrifuged at 13,000 × g at 4°C for 10 min, upon which the pellets were dissolved in Buffer ALT with lysozyme (1.25 mg/ml, Sigma L6876) and lysostaphin (25 mg/ml, Sigma L4402) and incubated for 30 min at 37°C. Then, DNA extraction was performed according to the manufacturer’s protocol. All extractions yielded more than 20 ng/μl of total DNA, as determined using a NanoDrop 2000 (ThermoFisher, CA). The V3–V4 region of the 16S ribosomal RNA (rRNA) gene was amplified using the primer pair 341F (5’-CCTACGGGNBGCASCAG-3’) and 805R (5’-GACTACHVGGGTATCTAATCC-3’). The amplicons were further amplified and sequenced in a single run on the Illumina Hiseq 2500 sequencing platform.
16S rRNA gene sequence processing.
Fast Length Adjustment of Short reads (FLASH) was used to merge paired-end reads (PE reads) from sequencing53. Chimeric sequences were detected and filtrated by USEARCH 8.0 implemented in Quantitative Insights Into Microbial Ecology (QIIME)54. Sequencing reads with a Phred base quality above 25 and read length longer than 30 were kept for analysis.
Microbiome analyses.
Quality-trimmed sequences were clustered into operational taxonomic units (OTUs) at a similarity level of 97% using the Ucluster algorithm implemented in the QIIME software pipeline. Taxonomic classification from the phylum to genus level was performed based on the Silva database (https://www.arb-silva.de/documentation/release-128/). To determine species that best characterized each study group, we first identified the OTUs associated with those genera, filtered low abundance OTUs (<50 copies), and used the Basic Local Alignment Search Tool (BLAST) (https://blast.ncbi.nlm.nih.gov) to align the sequences of these OTUs against the SILVA database, retaining species with an identity match of >97%.
Determination of abundance by quantitative polymerase chain reaction (qPCR).
To determine the total bacterial load, we used qPCR with the universal primers for 16S RNA as described above. To measure the abundance of S. salivarius and S. epidermidis, we used qPCR with species-specific primers and probes (using sequences of the gfp and tpi genes, respectively)55,56. Samples were loaded into wells of a 96-well plate and analyzed using the ABI 7500 Real-Time PCR system (Applied Biosystems, Foster City, CA).
Isolation of bacteria.
To isolate bacteria from AR patients’ nasal samples, nostril swabs were submerged in 1 ml of modified liquid Amies transport medium and vortexed for 2 min. 100-μl samples from each swab were serially diluted and plated on 5% sheep blood agar and incubated at 37°C for 24 h. Colonies were randomly selected and subjected to species identification. Species identification was performed using a Microflex Biotyper MALDI-TOF-MS system (Bruker Daltonics, Bremen, Germany).
Sequencing and analysis of genomes.
Total DNA of each of the obtained 14 S. salivarius isolates was used for whole-genome sequencing, which was performed using the Illumina Hiseq 4000 sequencing platform (Majorbio Bio-pharm Technology, Shanghai, China). Read quality control, trimming, and de novo assembly were performed with the CLC Genomics Workbench 12.0 (Qiagen) with the default options. Then, the generated de novo assembled contigs were submitted to the AntiSMASH5.0 web server (https://antismash.secondarymetabolites.org/) to detect biosynthetic gene clusters57. STRs were separated on an ABI 3730XL Genetic Analyzer. The signals were then analyzed by GeneMapper ID v3.2 software.
Cell line cultures.
The human epidermal cell lines RPMI 2650 (a nasal septum carcinoma cell line, obtained from FuHeng Biology Co. Ltd., catalog number FH1293) and A549 (an adenocarcinomic human alveolar basal epithelial cell line, obtained from FuHeng Biology Co. Ltd., catalog number FH0045) were cultured in DMEM (Dulbecco’s modified eagle medium, GIBCO 11965- 084) with 10% fetal bovine serum (FBS, GIBCO 10100147). Cells were incubated at 37°C in an atmosphere of 5 % (v/v) CO2 and split 1: 3 every 3 to 4 days.
Measurement of antimicrobial activity by agar diffusion.
S. epidermidis, M. luteus, C. accolens, and C. acnes were used as to assess the production of bacteriocins. Culture filtrates of Staphylococcus hominis S34–158 and 50 μg/ml vancomycin were used as positive controls. Bacteria were cultivated in tryptic soy broth (TSB, Oxoid) at 37 °C with shaking at 200 rpm overnight. Overnight cultures were diluted in melted tryptic soy agar (TSA) to an OD600 of 0.001 (S. epidermidis), 0.01 (C. accolens), or 0.001 (M. luteus), and then poured into Petri dishes. For C. acnes, the test was performed after first applying a lawn with C. acnes prepared to reach an OD600 of 0.1 to the surface of the TSA plate. To obtain concentrated supernatant of S. hominis S34–1 and the 14 S. salivarius isolates, overnight cultures were diluted to an OD600 of 0.03 in tubes containing 10 ml fresh TSB. After shaking for 8 h at 200 rpm and 37 °C, the tubes were centrifuged at 2,500 × g for 10 min. The supernatant was sterile-filtered twice using 0.22-μm filters (Millipore) and put in a freeze dryer at −110 °C for 48 h. This resulted in yellowish powder, which was then dissolved in 1 ml PBS and stored at 4 °C. 5-μl spots of this solution were applied to each bacterial lawn. The plates were incubated at 37 °C for 16 – 24 h (except for C. acnes, which was cultured anaerobically at 37 °C for 48 h) and evaluated for inhibition zones.
Measurement of bacterial adhesion to airway epithelial cells.
To measure adhesion to airway epithelial cells, A549 or RPMI 2650 cells were stimulated with a filtrate of A. alternata (Greer Laboratories), a saprophytic fungus of the family Pleosporaceae. For adhesion assays, isolates of S. salivarius or S. epidermidis were grown in TSB at 37°C overnight. Bacteria were harvested by centrifugation at 4,000 × g for 10 min, washed twice in sterile PBS, and suspended in PBS. A549 and RPMI 2650 cells were seeded in 24-well plates for 48 h to develop confluent monolayers. Then, cells were incubated with 100 ng/ml A. alternata for 2 hours, washed 2 times, and 5 × 10⁶ CFU of S. salivarius or S. epidermidis was added, after which the bacteria/cell mixtures were incubated for another 2 hours. Cell monolayers were then washed vigorously five times to remove the nonadherent bacteria. Cells were lysed with ice-cold sterile distilled water. Serial lysate dilutions were plated on TSB agar containing 5% sheep blood, and CFU per milliliter were assessed.
Measurement of cytokine gene expression in airway epithelial cells.
For measurement of gene expression of inflammatory cytokines, monolayers of A549 cells grown in DMEM with 10% FBS were exposed to 1 × 10⁴ CFU of S. salivarius or S. epidermidis isolates for 24 h with or without addition of A. alternata at a final concentration of 35 ng/ml, and cells were washed and harvested. Alternatively, DMEM with 10% FBS was inoculated with 1 × 10⁴ CFU of S. salivarius or S. epidermidis and incubated for 24 h, then culture filtrates were collected and added to the monolayer of A549 cells for another 24 h. Real-time quantitative PCR (qRT-PCR) was used to measure gene expression. To that end, total RNA was isolated from cells using a QIAGEN RNeasy kit (QIAGEN 74106) according to the manufacturer’s instructions. After treatment with genomic DNA wipeout buffer (QIAGEN 205311), approximately 1 μg of total RNA was reverse-transcribed with a Reverse Transcription Kit (QIAGEN 205311), and the obtained cDNA was used as a template for qRT-PCR using SYBR-green PCR reagent (Roche). The primers used are listed in Supporting Information Table 1. The gapdh gene was used as a housekeeping gene control. Reactions were performed in MicroAmp Optical 96-well reaction plates using a 7500 Sequence Detector (Applied Biosystems).
MUC5AC gene expression in airway epithelial cells.
A549 cells were seeded in confluent monolayers in 24-well plates. 48 h later, cells were incubated with 100 ng/ml A. alternata for 2 hours, washed 2 times, and total RNA was isolated from the cells using a QIAGEN RNeasy kit. The expression of the MUC5AC gene was tested by qRT-PCR (see Supporting Information Table 1 for primers).
Mucin5AC (MUC5AC) immunohistochemistry (IHC) staining.
To assess MUC5AC protein levels, mouse noses were fixed by 4% paraformaldehyde at 4 °C for 3 days and decalcified in 0.12 mol/l EDTA solution (pH 7.4) for 7 −14 days at room temperature. Tissues were embedded in paraffin, sectioned coronally (4-μm thickness). Heat-induced antigen retrieval was performed using 10 mmol/l of citrate buffer (pH 6.0) in a pressure cooker. MUC5AC was detected using horse radish peroxidase (HRP)-coupled IgG secondary antibodies specific for the mucin5AC primary antibody (1:100, Cell Signaling Technology, CST), followed by staining with 3, 3’-diaminobenzidine.
Dot blot assay for MUC5AC detection.
Tissue samples of the nasal mucosa were collected and lysed using radioimmunoprecipitation assay (RIPA) buffer (Yeasen Biotechnology) containing 1 mmol/l phenylmethylsulfonyl fluoride. The supernatants were gathered and diluted. Two μl of each sample was dropped on a nitrocellulose membrane and dried at room temperature. The membranes were then blocked by soaking in 5% skim milk in Tris-buffered saline with 0.1% Tween 20. They were next incubated with mouse anti-MUC5AC antibody (Thermo) or anti-beta actin antibody (CST) at a final dilution of 1:1,000, followed by incubation with an anti-mouse HRP-conjugated antibody at a final dilution of 1:5000. The membranes were incubated with ECL reagent and images of dot blots were acquired using a Tanon-5200 system.
Cytokine concentration assessment in patient sera.
Cytokine concentrations in patient serum samples were determined with the Twelve Cytokine test kit (Jiangxi Saiji Biotechnology Co., Ltd.) by fluorescence-activated cell sorting (FACS) using a BD FACSCanto II instrument in accordance with the manufacturer’s instructions. Cytokine concentrations were analyzed by FACP Array v3.0.1 and BD FACSDiva v8.0.1 software.
Mouse experiments.
C57BL/6J certified pathogen-free (SPF) mice were purchased from GemPharmatech and bred in-house under SPF conditions. Littermates of female mice were randomly assigned to experimental groups, except for the experiment using MUC5AC −/− mice (see below). For the experiment with MUC5AC −/− mice and control mice, age-and gender-matched numbers of mice were used and wild-type or MUC5AC −/− mice were randomly assigned to experimental groups. Mice were housed under environment enrichment and SPF conditions with corncob bedding and received autoclaved food and water ad libitum. Mice were housed at 19 – 26 °C at a humidity of 40–70% and experienced a cycle of 12 hours of light and 12 hours of darkness.
Mouse AR model.
Mice were anesthetized by intraperitoneal injection with avertin (Sigma T48402), and 20 μl PBS containing 2 × 10⁶ CFU S. salivarius or PBS only as control was instilled intranasally (equally split between the two nostrils) once daily for 3 days. One hour later, 20 μl A. alternata extract (50 μg per mouse) or vehicle (20 μl of 0.1% BSA in PBS) was instilled (equally split between the two nostrils). Control animals were sham infected with PBS alone. All mice were sacrificed one hour after their last intranasal treatment. The nasal mucosa was collected, homogenized and used for RNA extraction.
Mouse colonization model under allergen-induced conditions.
6-week-old female C57BL/6J mice under avertin anesthesia were inoculated intranasally with 5 μl A. alternata extract, with 50 μg per mouse administered at a strict intranasal does of 2.5 μl per nostril as described59, on days 0, 2, 4, 7, 9, and 11, while mice in the control group received PBS instead. From day 10, the mice received 10 μl of ddH2O containing vancomycin (1 mg/ml), metronidazole (0.7 mg/ml), and polymyxin B sulfate (80 mg/ml) by intranasal instillation once daily for 3 days. Absence of culturable bacteria after that treatment was confirmed by plating nasal swabs. On day 14, 5 × 10⁷ CFU of S. salivarius in 10 μl PBS were instilled intranasally (5 μl per nostril). 24 hours later, the mice were euthanized. For determination of nose CFU by biopsy, noses were homogenized using a Fastprep-24 instrument (MP-Bio), and CFU were counted.
Generation of MUC5AC−/− mice.
The C57BL/6NCrl wild-type mice used for CRISPR/Cas9-based genome editing were purchased from Beijing Vital River Laboratory Animal Technology (China), a distributor of Charles River Laboratories. Genome editing was performed at the Laboratory of Genetic Regulators in the Immune System, Xinxiang Medical University, Xinxiang, China as described previously60,61. In brief, in vitro fertilization and microinjection of the CRISPR/Cas9 system involving Cas9 nuclease mRNA and synthesized sgRNAs were performed following superovulation of wildtype 6-week-old female mice. The exon 5 of MUC5AC (Transcript: ENSMUST00000155534.9) was deleted by sgRNAs that were designed to target flanking intronic sequences. The MUC5AC−/− mice were isolated by genomic DNA genotyping. The colony of MUC5AC−/− mice has been maintained by intercrossing of the mutant mice. Primers for construction and analysis of the MUC5AC deletion are shown in Supporting Information Table 1.
Histological analysis.
Nasal tissue specimens were generated as previously described62. Briefly, nasal tissues were fixed in 4% paraformaldehyde at 4°C for 3 days and decalcified in 0.12 mol l−1 EDTA solution (pH 7.4) for 7 days at room temperature. Tissues were embedded in paraffin, sectioned coronally (4-μm thickness), and then stained with hematoxylin/eosin (H&E). To measure epithelial thickness, bilateral nasal mucosae on posterior lateral meatus were measured at three random unilateral points using cellSens imaging software and AX80/DP72 (Olympus, Tokyo, Japan), and the mean values of the mucosal thickness were calculated.
Study approval.
The human clinical study was approved by the ethics committee of Renji Hospital, Shanghai Jiao Tong University School of Medicine, Shanghai, China (approval number KY2019–003). All subjects provided written informed consent. Participants did not receive any compensation. All animal procedures complied with the guidelines of the Shanghai Medical Experimental Animal Care committee or the NIAID’s Division of Intramural Research Animal Care and Use Committee (DIR ACUC). Protocols of animal studies performed in China were approved by the Institutional Animal Care and Use Committee of Renji Hospital, Shanghai Jiao Tong University School of Medicine, Shanghai, China (approval number RA-2021–58). Protocols of animal studies performed in the U.S. were approved by the NIAID DIR ACUC (study protocol LB3E).
Statistics.
Taxonomic α diversity (describing the richness of a sample in terms of the diversity of OTUs) was estimated using Shannon indices63. β-diversity (describing the distance between samples based on differences in OTUs present in each sample) was measured using phylogenetic weighted UniFrac64. β-diversity indices (Principal Coordinate Analysis, PCoA) were calculated with QIIME and compared using permutational multivariate analysis of variance (Adonis) in the R Vegan package63.
Other statistical analyses were performed using GraphPad Prism version 8.4.3. Unpaired, two-tailed t-tests were used for the comparison of two groups, and 1-way ANOVAs for the comparison of more than two groups. For microbiome-associated analyses (data in Fig. 1 and Supplementary Figures 1, 3–6), two-sided Mann-Whitney instead of t-tests were used due to non-normal distribution as apparent in QQ plots.
Randomization was performed using a random number generator [Rand function of Perl5 (http://www.perl.org)]. No statistical methods were used to pre-determine sample sizes, but our sample sizes are similar to those reported in previous publications (see Reporting Summary). Data collection and analysis were not performed blind to the conditions of the experiments. All replicates in the study are biological.
Extended Data
Extended Data Fig. 1. Analysis of group composition.
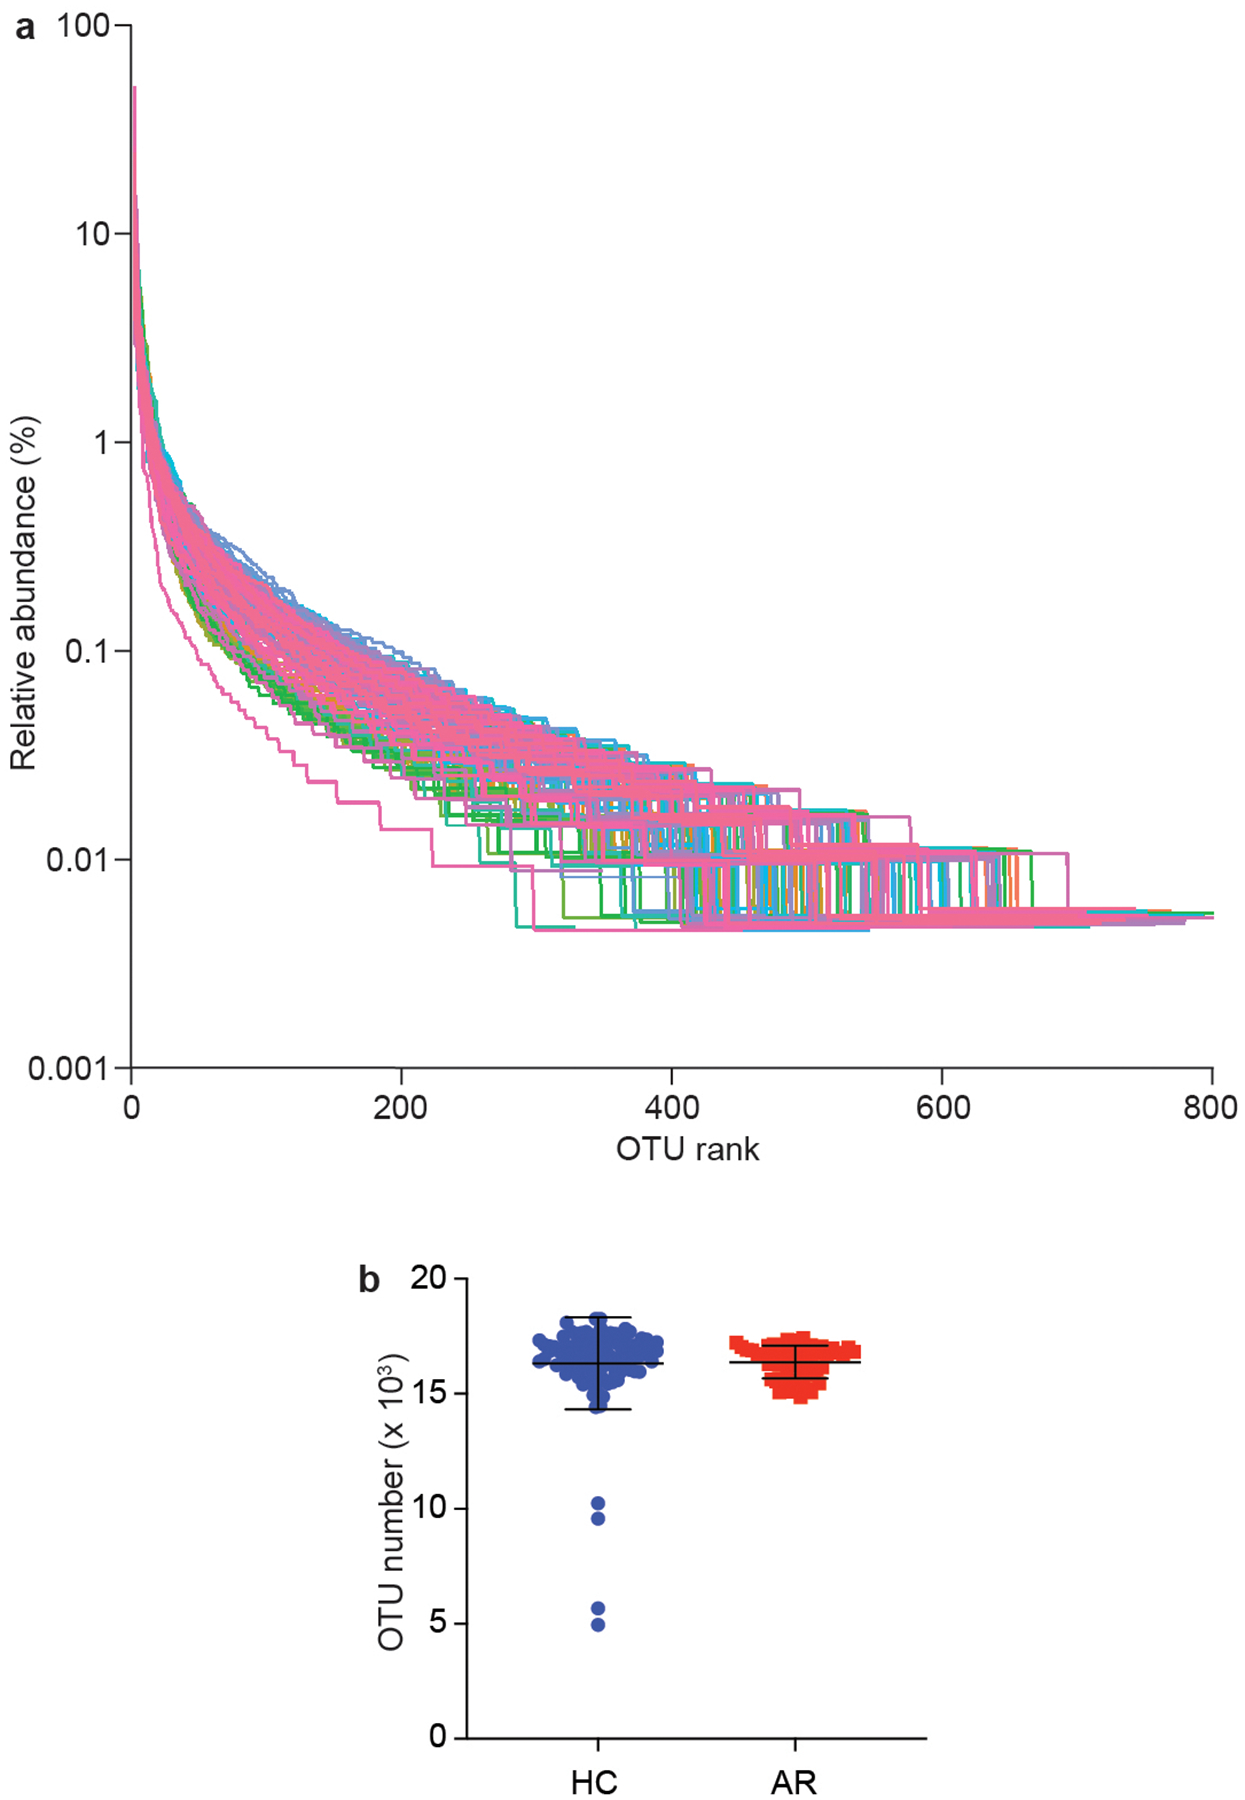
a, Relative species abundance and evenness by rank abundance (Whittaker) plots. b, Total OTU in HR and AC groups. Statistical analysis is by two-tailed Mann-Whitney test. Error bars show the mean ± SD. n=55 (AR), n=102 (HC).
Extended Data Fig. 2. Relative abundance in single individuals of main detected phyla in AR patients versus HC.
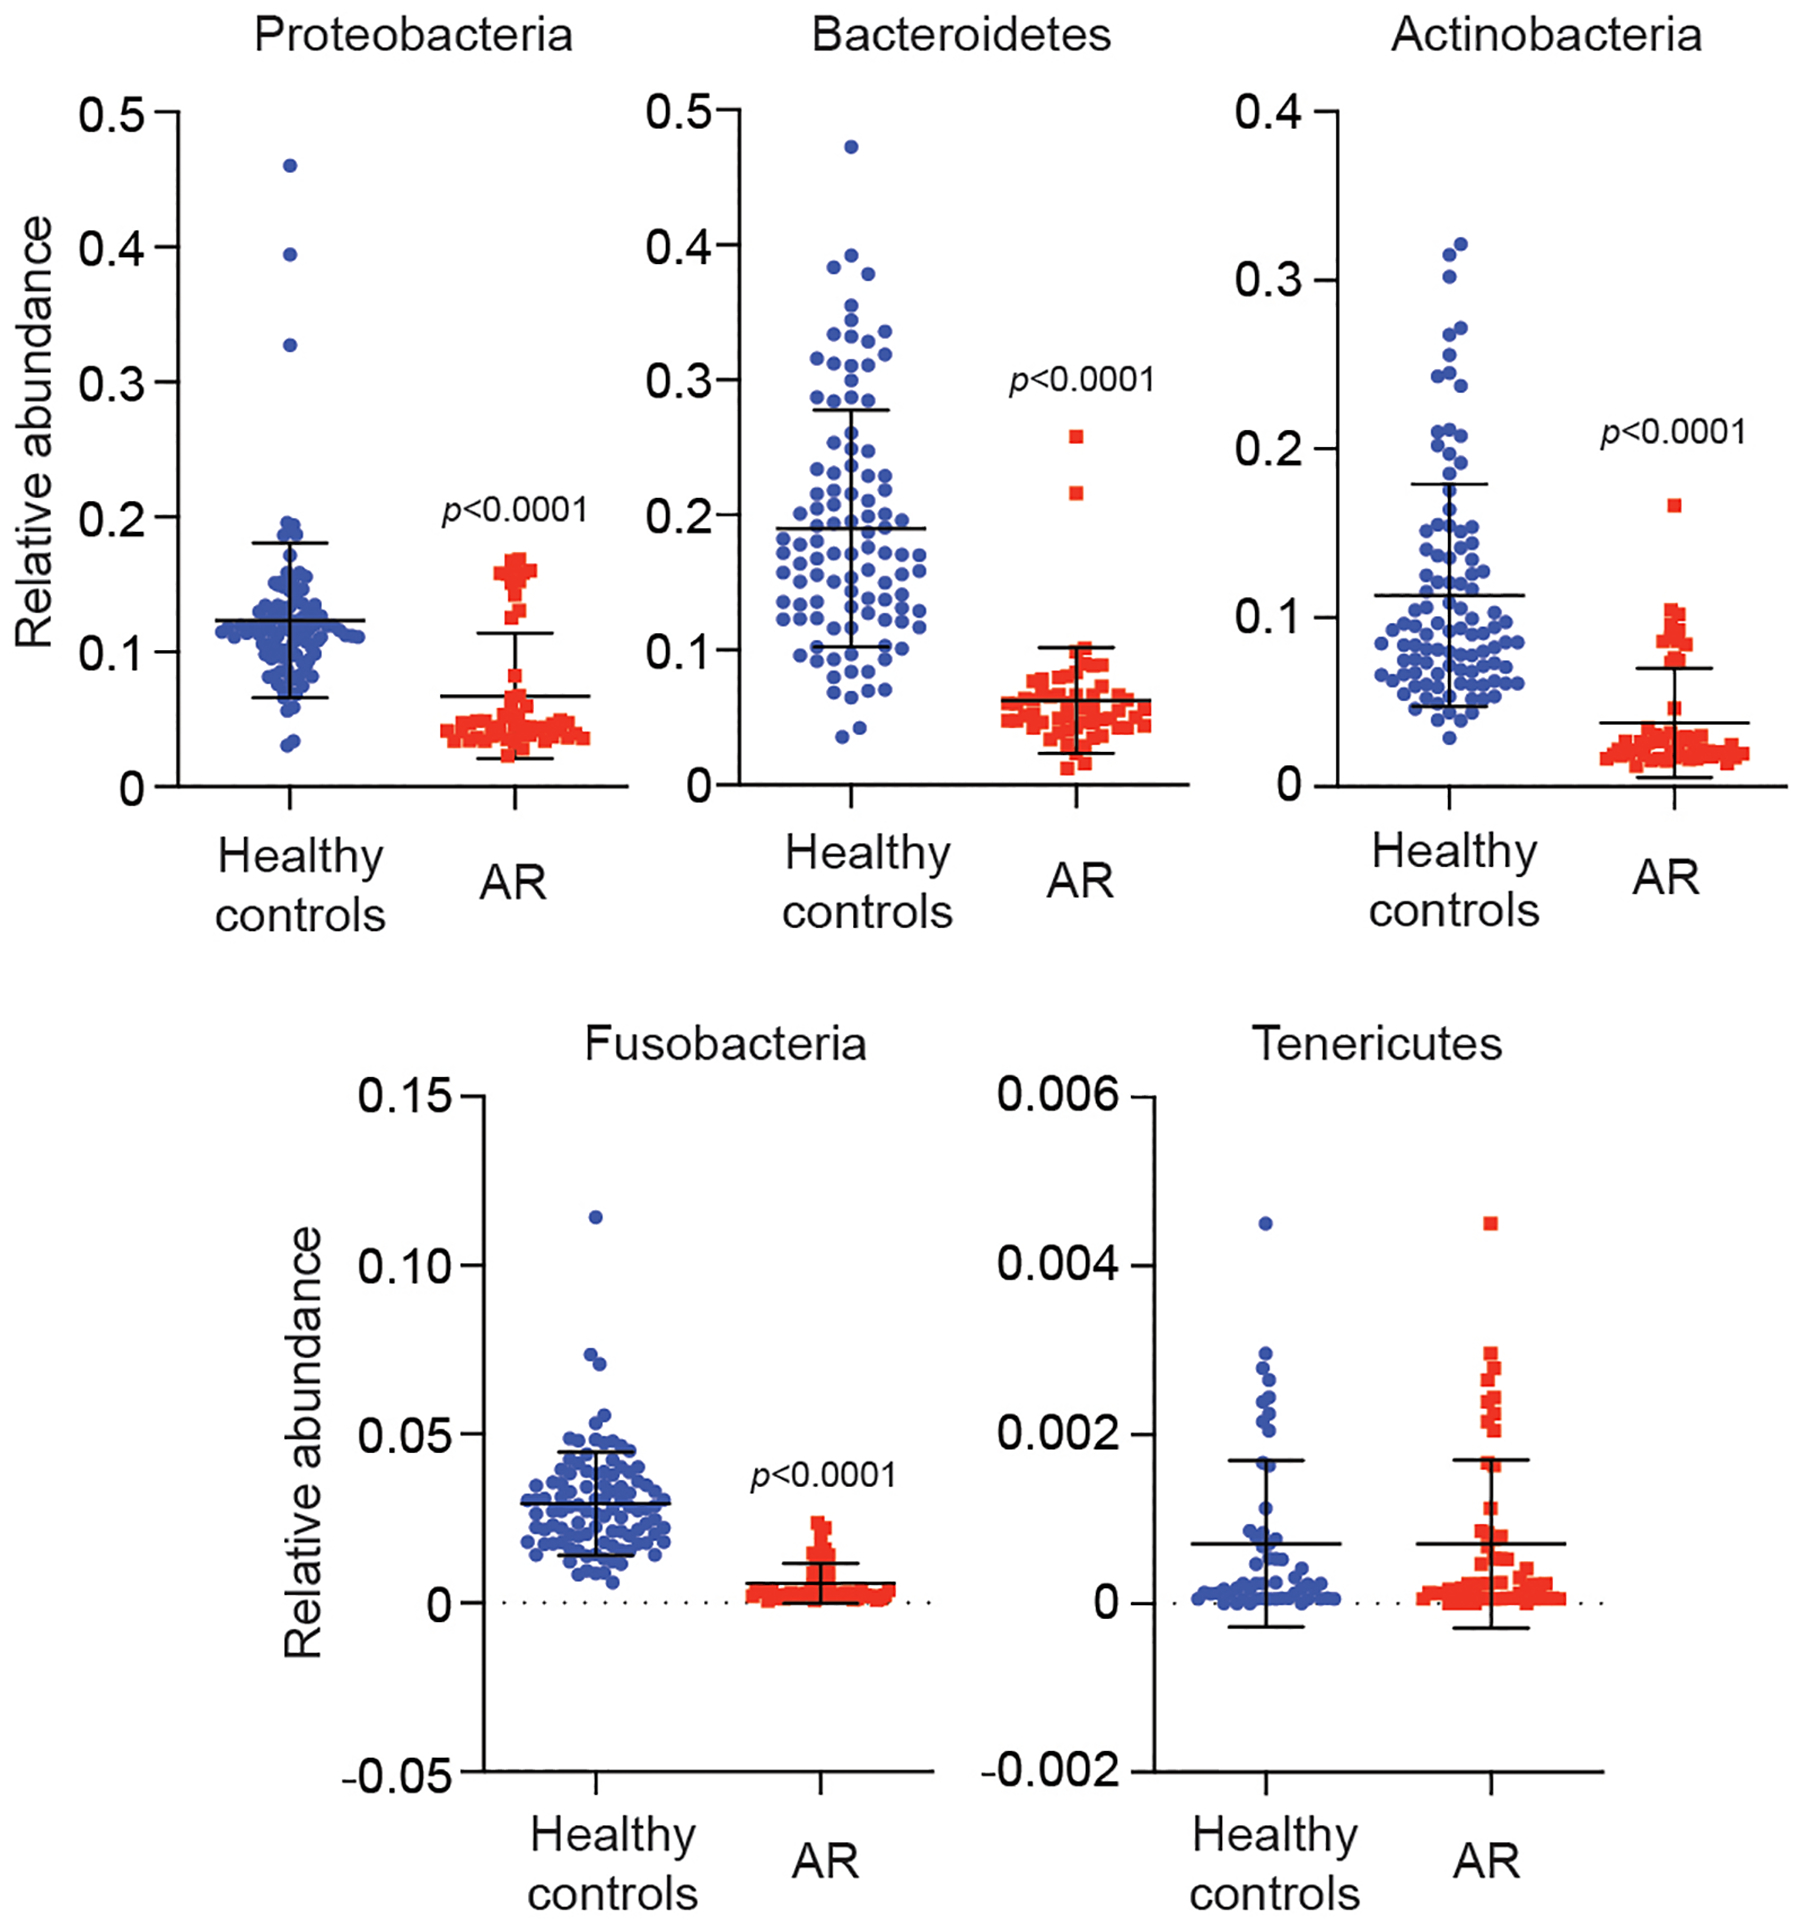
Statistical analysis is by two-tailed Mann-Whitney tests. Error bars show the mean ± SD. n=55 (AR), n=102 (HC).
Extended Data Fig. 3. Analysis of absolute bacterial abundance.
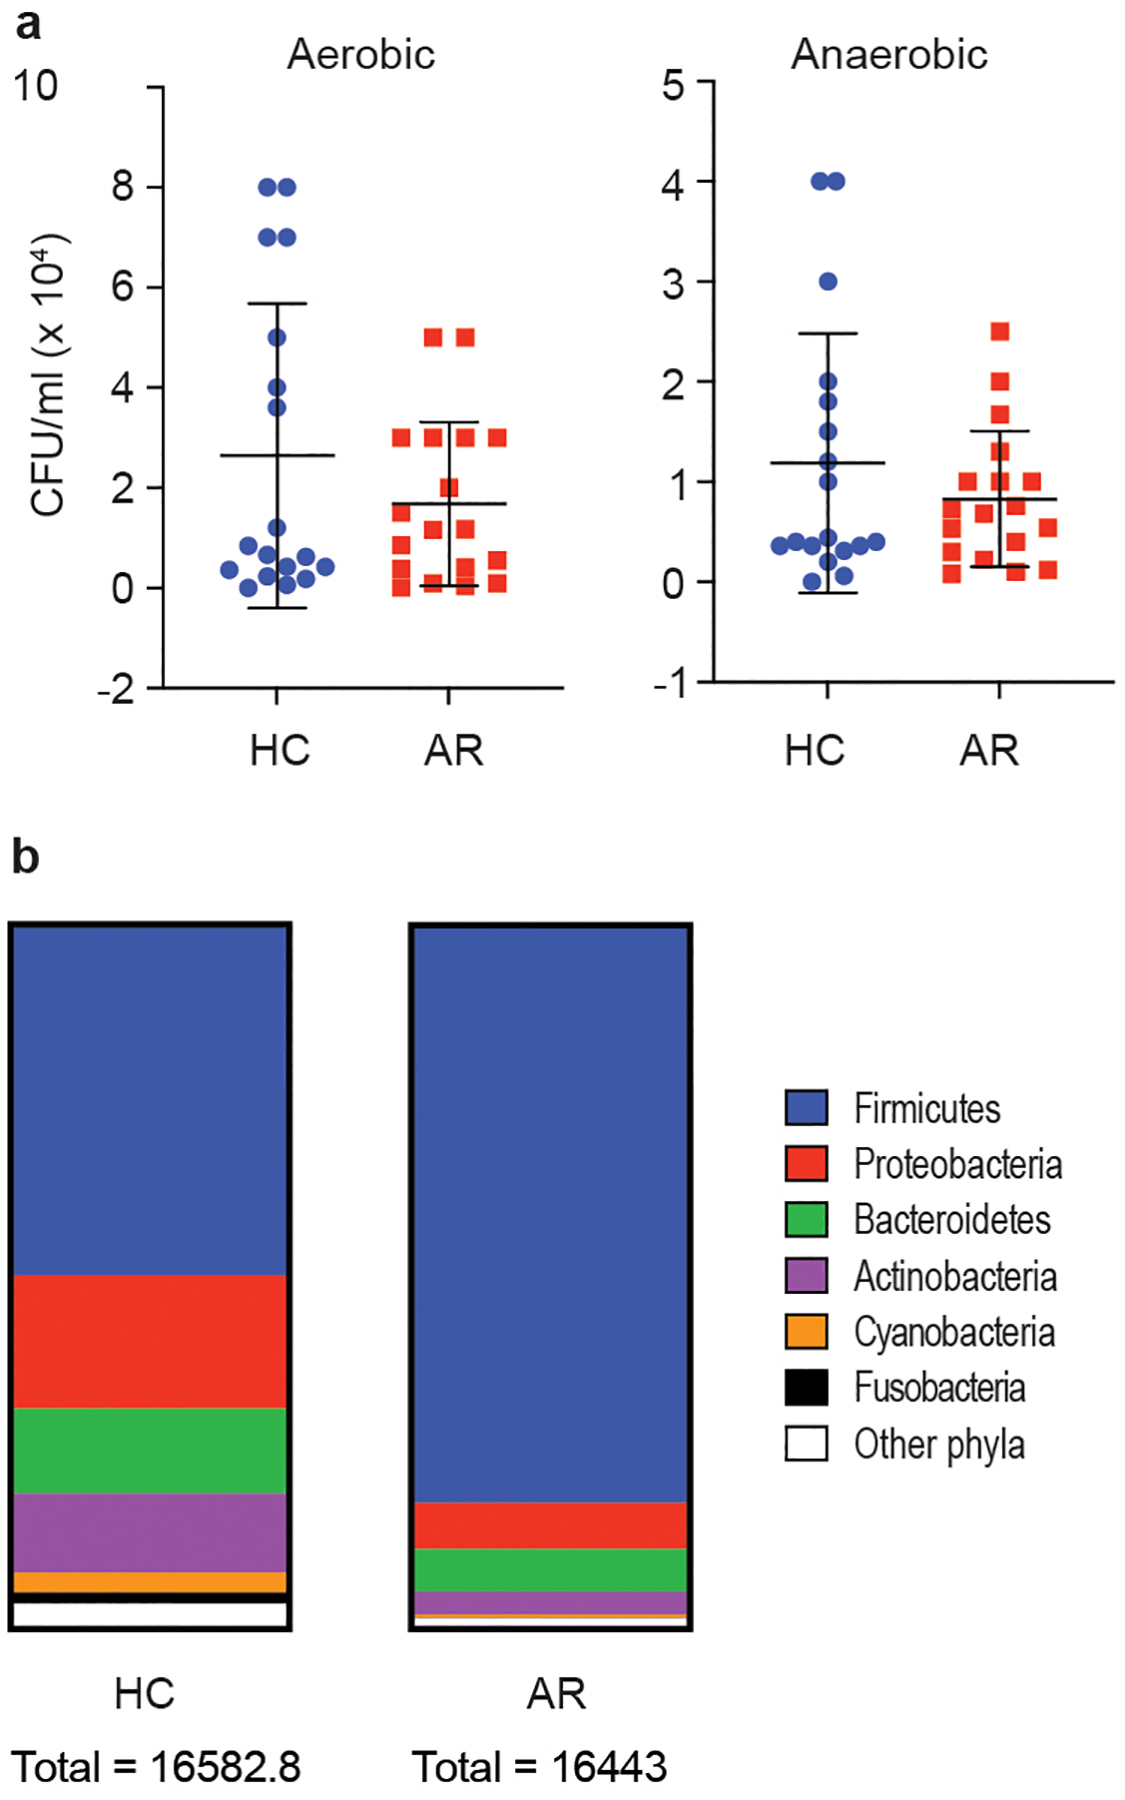
a, Bacterial CFU obtained from nasal swabs from n=18 individuals/group, grown in aerobic and anaerobic conditions. Error bars show the mean ± SD. Statistical analysis is by two-tailed Mann-Whitney tests. All comparisons were not significant (p≥0.05). b, Absolute abundance according to 16S rRNA sequencing analysis.
Extended Data Fig. 4. Relative abundance in single individuals of main detected genera in AR patients versus HC.
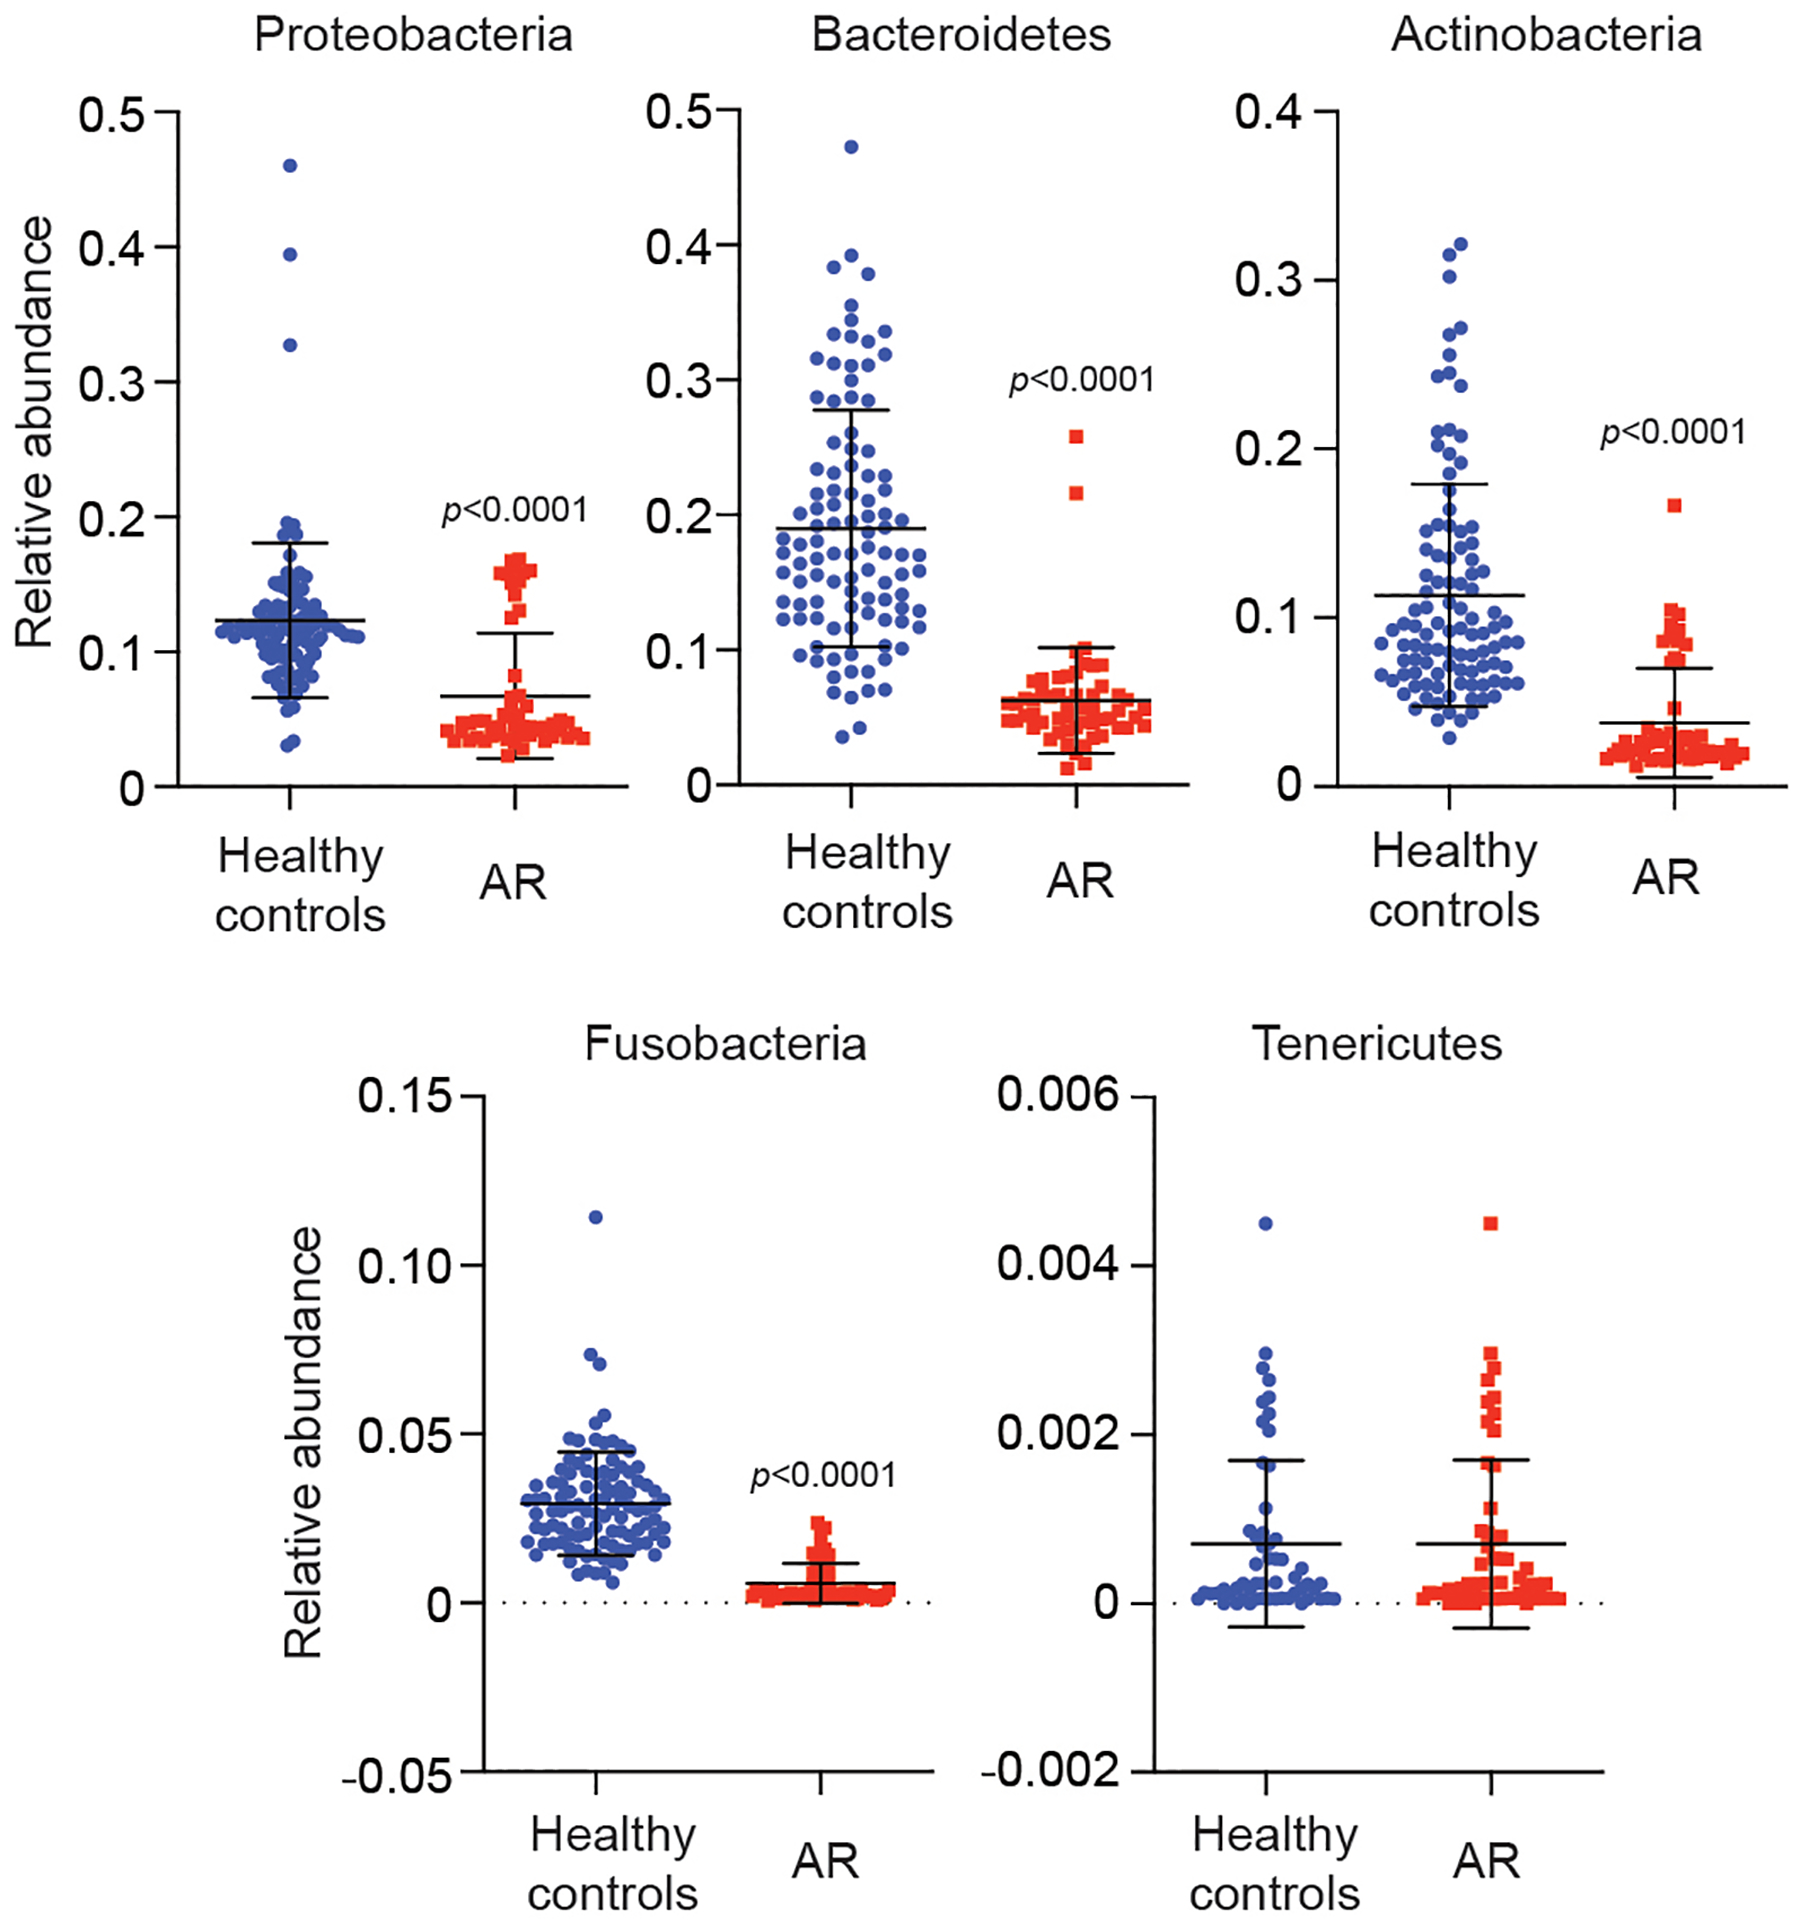
Statistical analysis is by two-tailed Mann-Whitney tests. Error bars show the mean ± SD. n=55 (AR), n=102 (HC).
Extended Data Fig. 5. Microbiome analysis by type of AR (severity, seasonality, frequency).
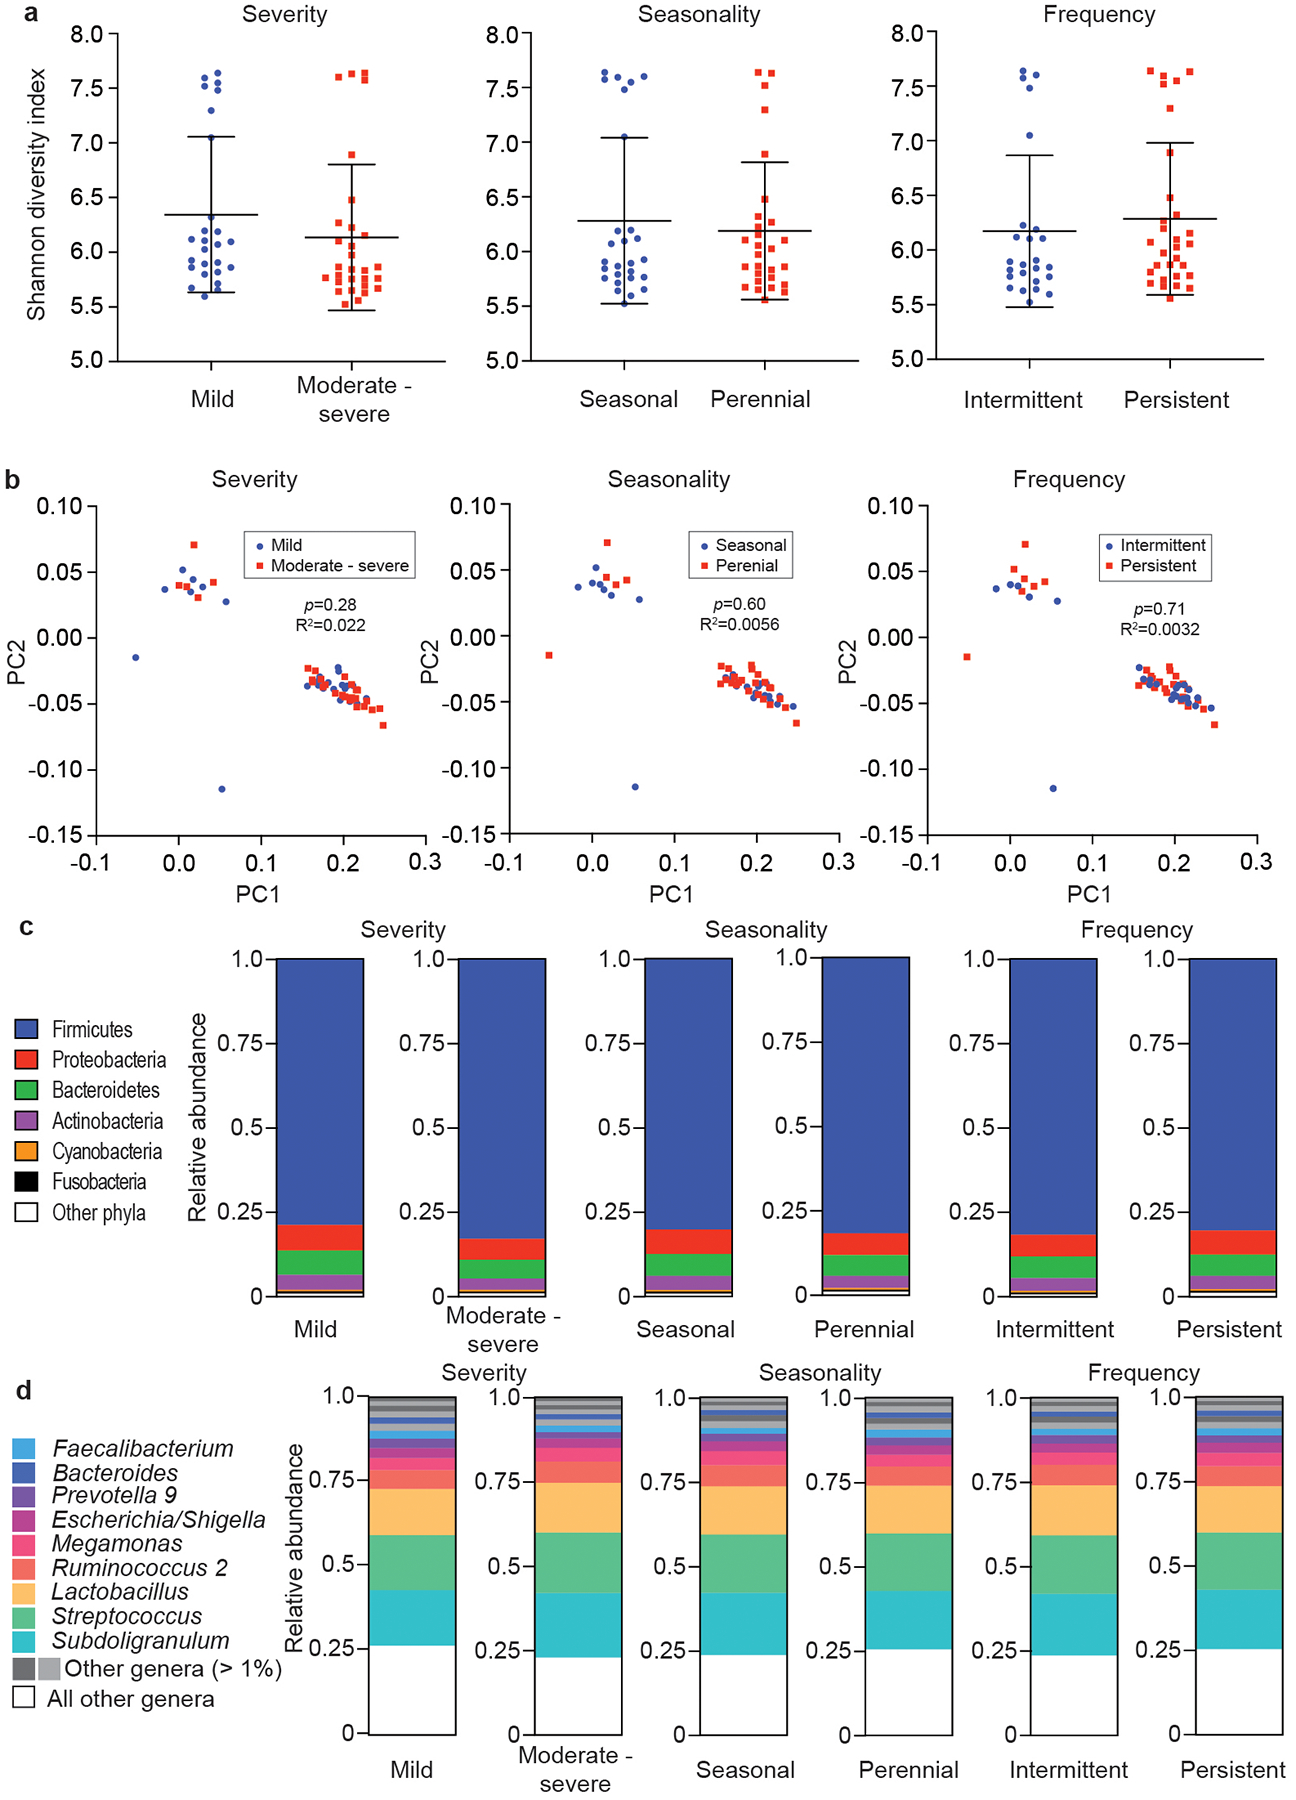
a, α-diversity (Shannon indices). Statistical analysis is by Mann-Whitney tests. Error bars show the mean ± SD. b, β-diversity (PCoA analyses). Statistical analysis is by Adonis. c, Relative abundances on the phylum level. d, Relative abundances on the genus level. a-d, n=55 (all AR).
Extended Data Fig. 6. Microbiome analysis by sex and age of participants.
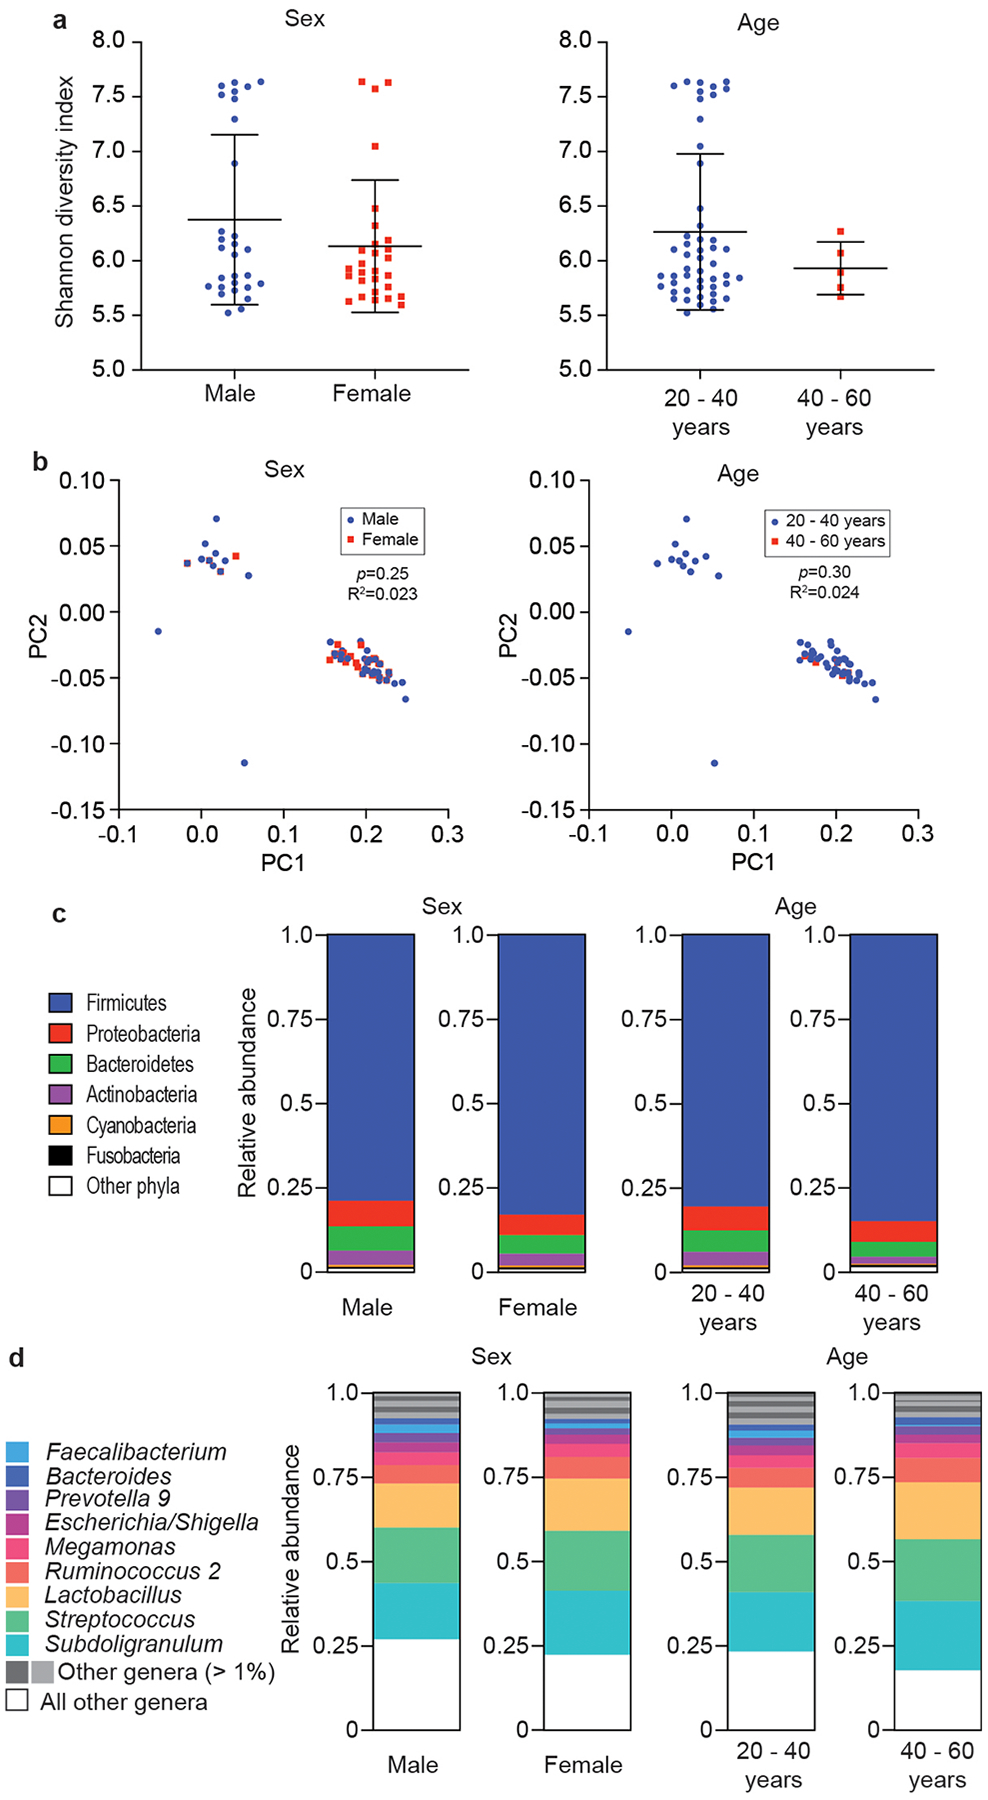
a, α-diversity (Shannon indices). Statistical analysis is by two-tailed Mann-Whitney tests. Error bars show the mean ± SD. b, β-diversity (PCoA analyses). Statistical analysis is by Adonis. c, Relative abundances on the phylum level. d, Relative abundances on the genus level. a-d, n=55 (all AR).
Extended Data Fig. 7. Absolute abundance of Staphylococcus and S. epidermidis in AR patients versus HC.
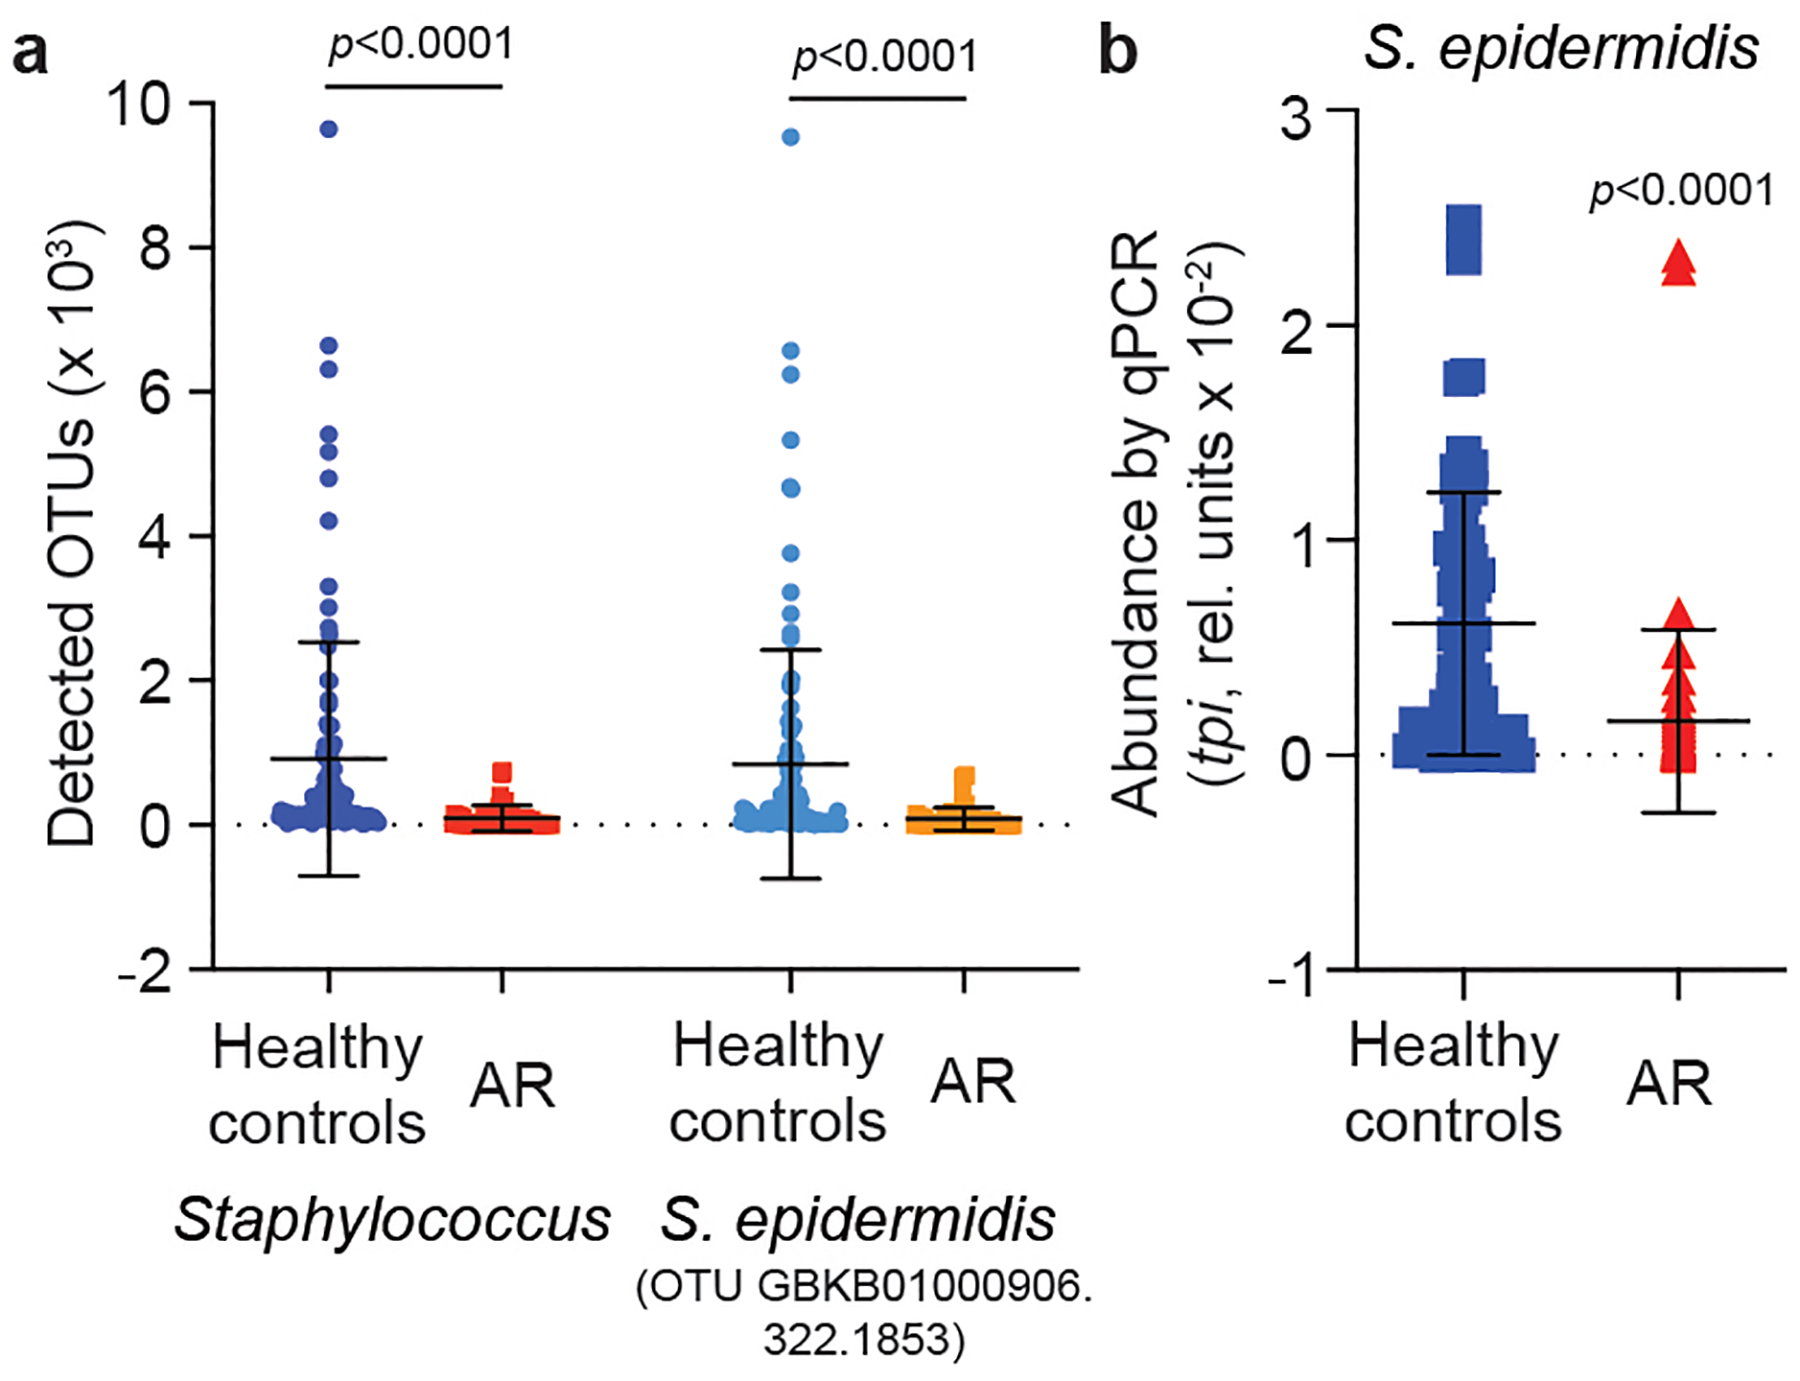
a, Absolute abundance by OTUs. b, Abundance by qPCR. n=52 (AR), n=58 (HR) (all samples with sufficient DNA for qRT-PCR analysis). a,b, Statistical analysis is by two-tailed Mann-Whitney tests. Error bars show the mean ± SD.
Extended Data Fig. 8. Agar diffusion test of antibacterial activity of S. salivarius nasal isolates obtained from AR patients.
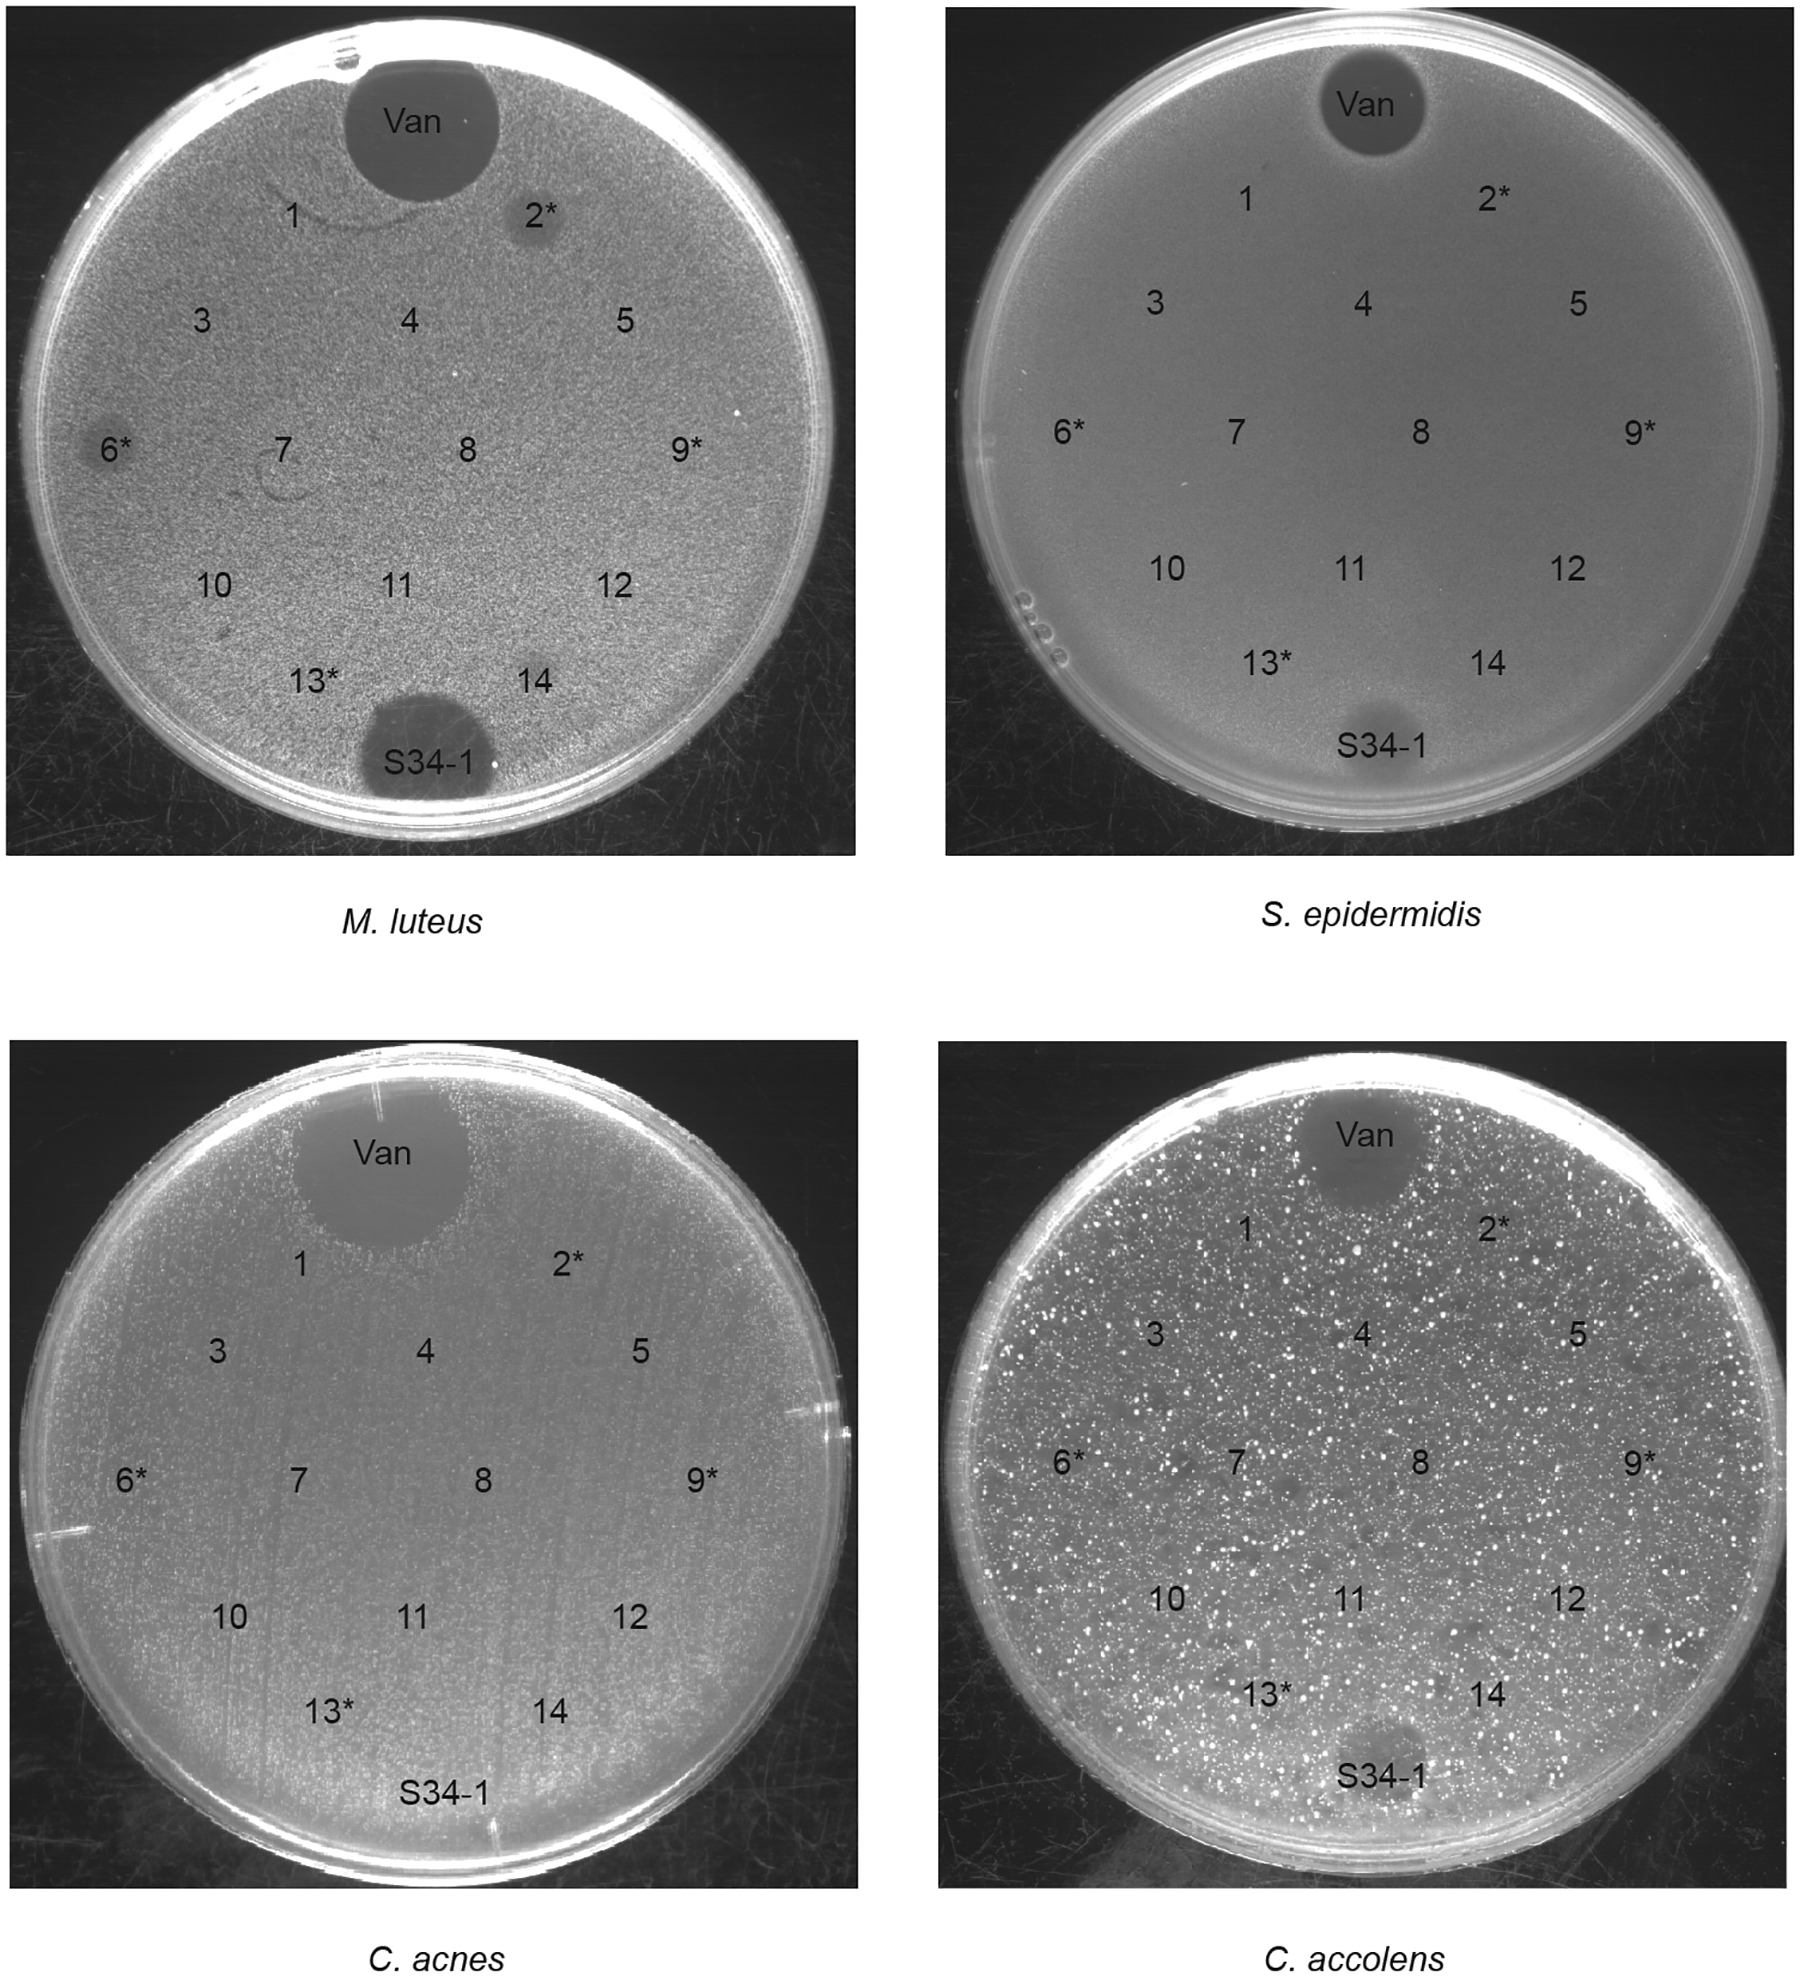
All obtained 14 nasal isolates from AR patients were spotted on agar plates with embedded M. luteus, S. epidermidis, C. acnes, or C. accolens. Asterisks designate strains with detected bacteriocin genes in the genome. Vancomycin (Van) and supernatant obtained from the micrococcin MP1 producer S. hominis S34–1 were used as positive controls.
Extended Data Fig. 9. Repeat of experiment shown in Fig. 2 of the main manuscript.
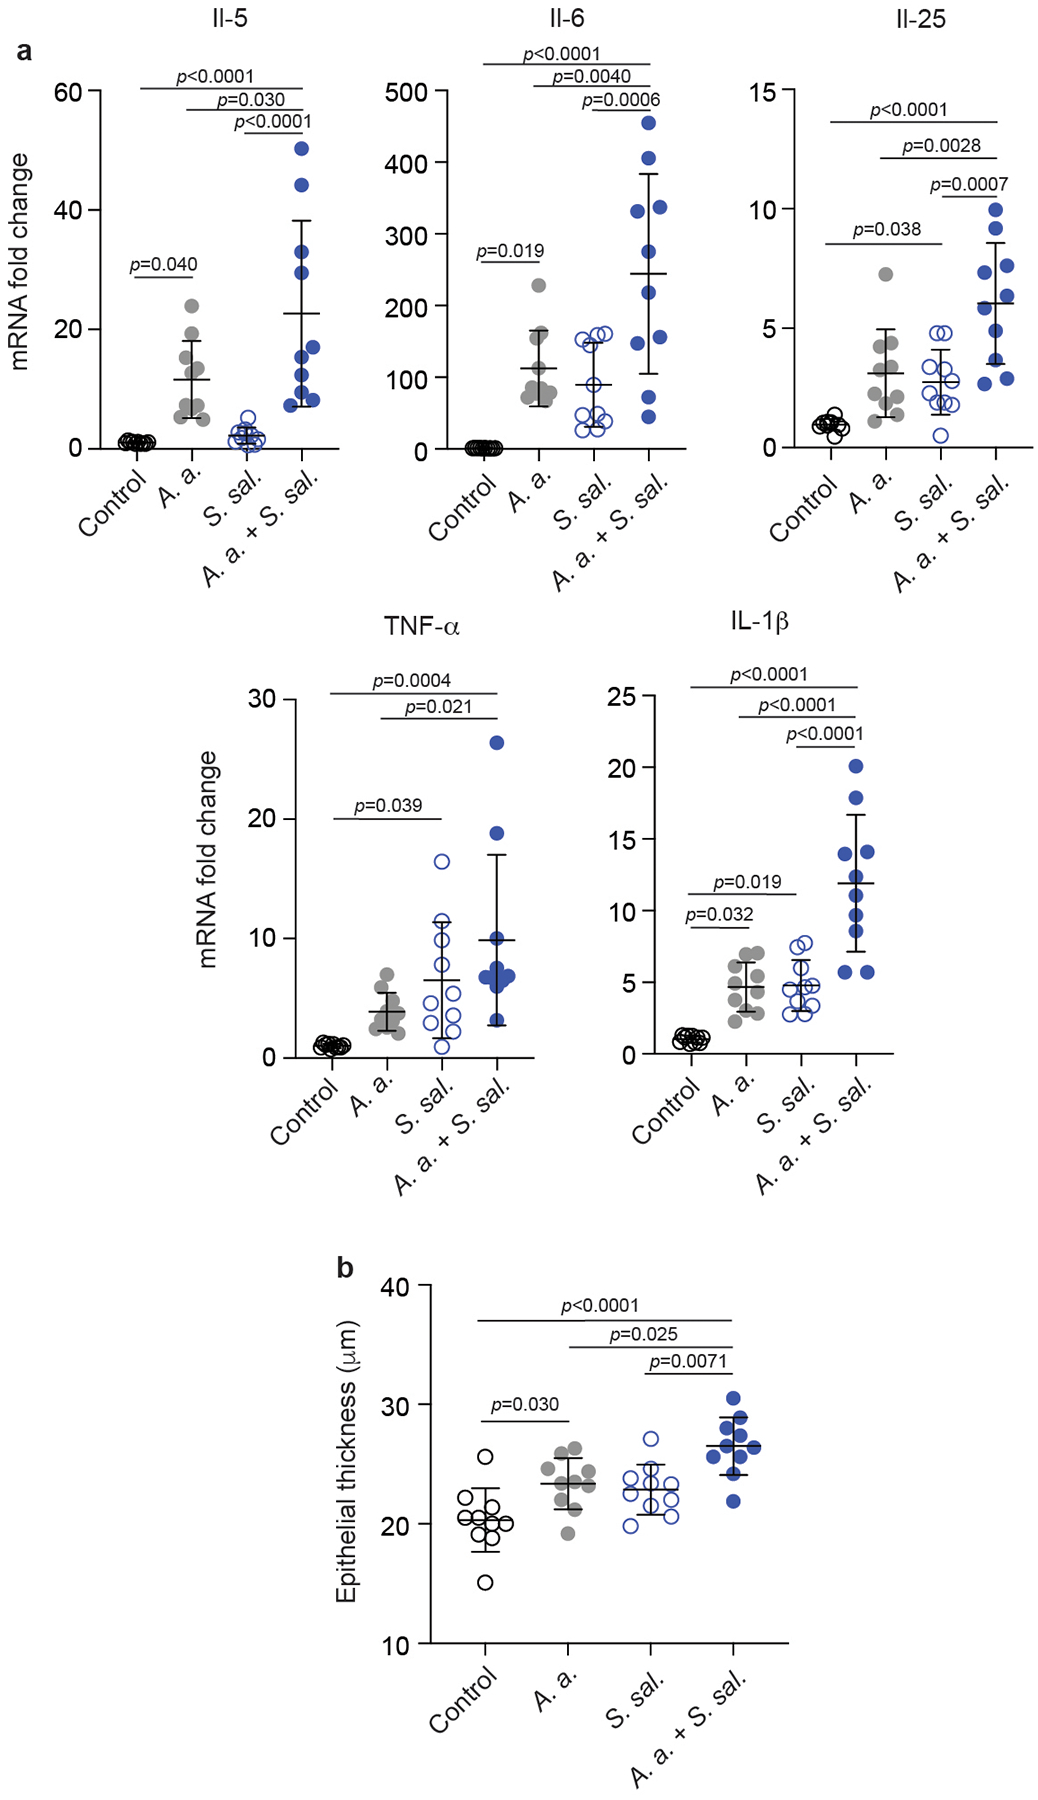
a, Cytokine expression data. b, Epithelial thickness. n=10. See legend to Fig. 2 for further details. Statistical analysis is by 1-way ANOVAs with Tukey’s post-tests. Error bars show the mean ± SD.
Extended Data Table 1.
Cytokines in the blood of AR patients.
| Healthy controls | AR patients | p value2 | |
|---|---|---|---|
| Sample number | n=17 | n=17 | |
| IL-4 | 3.221 ± 0.62 | 8.93 ± 2.67 | 0.069 |
| IL-5 | 1.60 ± 0.088 | 2.27 ± 0.38 | 0.15 |
| 11–6 | 4.49 ± 0.41 | 32.42 ± 12.22 | 0.026 |
| IL-1β | 1.59 ± 0.19 | 6.95 ± 1.52 | 0.0005 |
| TNF-α | 2.052 ± 0.38 | 4.61 ± 1.46 | 0.059 |
| IL-2 | 1.54 ± 0.18 | 4.28 ± 1.60 | 0.51 |
| IL-17A | 6.15 ± 1.16 | 27.06 ± 10.97 | 0.38 |
| IFN-α | 2.28 ± 0.33 | 15.33 ± 5.73 | 0.013 |
| IFN-γ | 2.98 ± 0.24 | 7.75 ± 3.28 | 0.47 |
Supplementary Material
Acknowledgements
This work was supported by the Clinical Research Plan of the Shanghai Shenkang Hospital Development Center (SHDC, grant number SHDC2020CR3006A to M.L.), the National Natural Science Foundation of China (grant numbers 81873957, 82172325, to M.L.), and the Intramural Research Program of Allergy and Infectious Diseases (NIAID), U.S. National Institutes of Health (NIH) (project number ZIA AI000904, to M.O.).
Footnotes
Competing interest statement
The authors have no competing interests to report.
Data availability
Raw microbiome sequencing data (related to data shown in Fig. 1, Table 1, and Extended Data Figs. 1–6) and genome sequencing data have been deposited in NCBI’s Sequencing Read Archive (SRA) database under Bioproject numbers PRJNA796497 and PRJNA874865, respectively. All other data are presented in this manuscript. Source data files (see Supporting Material) contain detailed results for all figures with quantitative data. Bacterial strains are available from Min Li (rjlimin@shsmu.edu.cn).
References
- 1.Agnihotri NT & McGrath KG Allergic and nonallergic rhinitis. Allergy Asthma Proc 40, 376–379, doi: 10.2500/aap.2019.40.4251 (2019). [DOI] [PubMed] [Google Scholar]
- 2.Greiner AN, Hellings PW, Rotiroti G & Scadding GK Allergic rhinitis. Lancet 378, 2112–2122, doi: 10.1016/S0140-6736(11)60130-X (2011). [DOI] [PubMed] [Google Scholar]
- 3.Skoner DP Allergic rhinitis: definition, epidemiology, pathophysiology, detection, and diagnosis. J Allergy Clin Immunol 108, S2–8, doi: 10.1067/mai.2001.115569 (2001). [DOI] [PubMed] [Google Scholar]
- 4.Wheatley LM & Togias A Clinical practice. Allergic rhinitis. N Engl J Med 372, 456–463, doi: 10.1056/NEJMcp1412282 (2015). [DOI] [PMC free article] [PubMed] [Google Scholar]
- 5.Cheng L et al. Chinese Society of Allergy Guidelines for Diagnosis and Treatment of Allergic Rhinitis. Allergy Asthma Immunol Res 10, 300–353, doi: 10.4168/aair.2018.10.4.300 (2018). [DOI] [PMC free article] [PubMed] [Google Scholar]
- 6.Corren J Allergic rhinitis and asthma: how important is the link? J Allergy Clin Immunol 99, S781–786, doi: 10.1016/s0091-6749(97)70127-1 (1997). [DOI] [PubMed] [Google Scholar]
- 7.Brozek JL et al. Allergic Rhinitis and its Impact on Asthma (ARIA) guidelines-2016 revision. J Allergy Clin Immunol 140, 950–958, doi: 10.1016/j.jaci.2017.03.050 (2017). [DOI] [PubMed] [Google Scholar]
- 8.Small P, Keith PK & Kim H Allergic rhinitis. Allergy Asthma Clin Immunol 14, 51, doi: 10.1186/s13223-018-0280-7 (2018). [DOI] [PMC free article] [PubMed] [Google Scholar]
- 9.Cho DY, Hunter RC & Ramakrishnan VR The Microbiome and Chronic Rhinosinusitis. Immunol Allergy Clin North Am 40, 251–263, doi: 10.1016/j.iac.2019.12.009 (2020). [DOI] [PMC free article] [PubMed] [Google Scholar]
- 10.Koeller K et al. Microbiome and Culture Based Analysis of Chronic Rhinosinusitis Compared to Healthy Sinus Mucosa. Front Microbiol 9, 643, doi: 10.3389/fmicb.2018.00643 (2018). [DOI] [PMC free article] [PubMed] [Google Scholar]
- 11.Gan W et al. The difference in nasal bacterial microbiome diversity between chronic rhinosinusitis patients with polyps and a control population. Int Forum Allergy Rhinol 9, 582–592, doi: 10.1002/alr.22297 (2019). [DOI] [PubMed] [Google Scholar]
- 12.Rom D et al. The Association Between Disease Severity and Microbiome in Chronic Rhinosinusitis. Laryngoscope 129, 1265–1273, doi: 10.1002/lary.27726 (2019). [DOI] [PubMed] [Google Scholar]
- 13.Hoggard M et al. Evidence of microbiota dysbiosis in chronic rhinosinusitis. Int Forum Allergy Rhinol 7, 230–239, doi: 10.1002/alr.21871 (2017). [DOI] [PubMed] [Google Scholar]
- 14.Lal D et al. Mapping and comparing bacterial microbiota in the sinonasal cavity of healthy, allergic rhinitis, and chronic rhinosinusitis subjects. Int Forum Allergy Rhinol 7, 561–569, doi: 10.1002/alr.21934 (2017). [DOI] [PubMed] [Google Scholar]
- 15.Gan W et al. Comparing the nasal bacterial microbiome diversity of allergic rhinitis, chronic rhinosinusitis and control subjects. Eur Arch Otorhinolaryngol 278, 711–718, doi: 10.1007/s00405-020-06311-1 (2021). [DOI] [PubMed] [Google Scholar]
- 16.Choi CH et al. Seasonal allergic rhinitis affects sinonasal microbiota. Am J Rhinol Allergy 28, 281–286, doi: 10.2500/ajra.2014.28.4050 (2014). [DOI] [PMC free article] [PubMed] [Google Scholar]
- 17.Hyun DW et al. Dysbiosis of Inferior Turbinate Microbiota Is Associated with High Total IgE Levels in Patients with Allergic Rhinitis. Infect Immun 86, doi: 10.1128/IAI.00934-17 (2018). [DOI] [PMC free article] [PubMed] [Google Scholar]
- 18.Quillen DM & Feller DB Diagnosing rhinitis: allergic vs. nonallergic. Am Fam Physician 73, 1583–1590 (2006). [PubMed] [Google Scholar]
- 19.Borish LC & Steinke JW 2. Cytokines and chemokines. J Allergy Clin Immunol 111, S460–475, doi: 10.1067/mai.2003.108 (2003). [DOI] [PubMed] [Google Scholar]
- 20.Liu Q et al. Staphylococcus epidermidis Contributes to Healthy Maturation of the Nasal Microbiome by Stimulating Antimicrobial Peptide Production. Cell Host Microbe 27, 68–78 e65, doi: 10.1016/j.chom.2019.11.003 (2020). [DOI] [PMC free article] [PubMed] [Google Scholar]
- 21.Nakajima T et al. Population structure and characterization of viridans group streptococci (VGS) isolated from the upper respiratory tract of patients in the community. Ulster Med J 82, 164–168 (2013). [PMC free article] [PubMed] [Google Scholar]
- 22.Pearce C et al. Identification of pioneer viridans streptococci in the oral cavity of human neonates. J Med Microbiol 42, 67–72, doi: 10.1099/00222615-42-1-67 (1995). [DOI] [PubMed] [Google Scholar]
- 23.Wilson M et al. Clinical and laboratory features of Streptococcus salivarius meningitis: a case report and literature review. Clin Med Res 10, 15–25, doi: 10.3121/cmr.2011.1001 (2012). [DOI] [PMC free article] [PubMed] [Google Scholar]
- 24.Wescombe PA, Hale JD, Heng NC & Tagg JR Developing oral probiotics from Streptococcus salivarius. Future Microbiol 7, 1355–1371, doi: 10.2217/fmb.12.113 (2012). [DOI] [PubMed] [Google Scholar]
- 25.Ramakrishnan VR et al. The microbiome of the middle meatus in healthy adults. PLoS One 8, e85507, doi: 10.1371/journal.pone.0085507 (2013). [DOI] [PMC free article] [PubMed] [Google Scholar]
- 26.Bowman FW Test organisms for antibiotic microbial assays. Antibiot Chemother (Northfield) 7, 639–640 (1957). [PubMed] [Google Scholar]
- 27.Salo PM et al. Exposure to multiple indoor allergens in US homes and its relationship to asthma. J Allergy Clin Immunol 121, 678–684.e672, doi: 10.1016/j.jaci.2007.12.1164 (2008). [DOI] [PMC free article] [PubMed] [Google Scholar]
- 28.Gabriel MF, Postigo I, Tomaz CT & Martinez J Alternaria alternata allergens: Markers of exposure, phylogeny and risk of fungi-induced respiratory allergy. Environ Int 89–90, 71–80, doi: 10.1016/j.envint.2016.01.003 (2016). [DOI] [PubMed] [Google Scholar]
- 29.Dinarello CA A clinical perspective of IL-1beta as the gatekeeper of inflammation. Eur J Immunol 41, 1203–1217, doi: 10.1002/eji.201141550 (2011). [DOI] [PubMed] [Google Scholar]
- 30.Heinrich PC et al. Principles of interleukin (IL)-6-type cytokine signalling and its regulation. Biochem J 374, 1–20, doi: 10.1042/BJ20030407 (2003). [DOI] [PMC free article] [PubMed] [Google Scholar]
- 31.Akdis M et al. Interleukins (from IL-1 to IL-38), interferons, transforming growth factor beta, and TNF-alpha: Receptors, functions, and roles in diseases. J Allergy Clin Immunol 138, 984–1010, doi: 10.1016/j.jaci.2016.06.033 (2016). [DOI] [PubMed] [Google Scholar]
- 32.Xu M & Dong C IL-25 in allergic inflammation. Immunol Rev 278, 185–191, doi: 10.1111/imr.12558 (2017). [DOI] [PubMed] [Google Scholar]
- 33.Martinez-Moczygemba M & Huston DP Biology of common beta receptor-signaling cytokines: IL-3, IL-5, and GM-CSF. J Allergy Clin Immunol 112, 653–665; quiz 666, doi: 10.1016/S0091 (2003). [DOI] [PubMed] [Google Scholar]
- 34.Russo RC, Garcia CC, Teixeira MM & Amaral FA The CXCL8/IL-8 chemokine family and its receptors in inflammatory diseases. Expert Rev Clin Immu 10, 593–619, doi: 10.1586/1744666x.2014.894886 (2014). [DOI] [PubMed] [Google Scholar]
- 35.Schmitz J et al. IL-33, an interleukin-1-like cytokine that signals via the IL-1 receptor-related protein ST2 and induces T helper type 2-associated cytokines. Immunity 23, 479–490, doi: 10.1016/j.immuni.2005.09.015 (2005). [DOI] [PubMed] [Google Scholar]
- 36.Cianferoni A & Spergel J The importance of TSLP in allergic disease and its role as a potential therapeutic target. Expert Rev Clin Immunol 10, 1463–1474, doi: 10.1586/1744666X.2014.967684 (2014). [DOI] [PMC free article] [PubMed] [Google Scholar]
- 37.Rankin SM, Conroy DM & Williams TJ Eotaxin and eosinophil recruitment: implications for human disease. Mol Med Today 6, 20–27, doi: 10.1016/s1357-4310(99)01635-4 (2000). [DOI] [PubMed] [Google Scholar]
- 38.Martin LB, Kita H, Leiferman KM & Gleich GJ Eosinophils in allergy: role in disease, degranulation, and cytokines. Int Arch Allergy Immunol 109, 207–215, doi: 10.1159/000237239 (1996). [DOI] [PubMed] [Google Scholar]
- 39.Bidossi A et al. Probiotics Streptococcus salivarius 24SMB and Streptococcus oralis 89a interfere with biofilm formation of pathogens of the upper respiratory tract. BMC Infect Dis 18, 653, doi: 10.1186/s12879-018-3576-9 (2018). [DOI] [PMC free article] [PubMed] [Google Scholar]
- 40.Srikham K, Daengprok W, Niamsup P & Thirabunyanon M Characterization of Streptococcus salivarius as New Probiotics Derived From Human Breast Milk and Their Potential on Proliferative Inhibition of Liver and Breast Cancer Cells and Antioxidant Activity. Front Microbiol 12, 797445, doi: 10.3389/fmicb.2021.797445 (2021). [DOI] [PMC free article] [PubMed] [Google Scholar]
- 41.Henderson B, Poole S & Wilson M Microbial/host interactions in health and disease: who controls the cytokine network? Immunopharmacology 35, 1–21, doi: 10.1016/0162-3109(96)00144-0 (1996). [DOI] [PubMed] [Google Scholar]
- 42.Kumar H, Kawai T & Akira S Pathogen recognition by the innate immune system. Int Rev Immunol 30, 16–34, doi: 10.3109/08830185.2010.529976 (2011). [DOI] [PubMed] [Google Scholar]
- 43.Rogers DF Airway hypersecretion in allergic rhinitis and asthma: new pharmacotherapy. Curr Allergy Asthma Rep 3, 238–248, doi: 10.1007/s11882-003-0046-1 (2003). [DOI] [PubMed] [Google Scholar]
- 44.Evans CM et al. The polymeric mucin Muc5ac is required for allergic airway hyperreactivity. Nat Commun 6, 6281, doi: 10.1038/ncomms7281 (2015). [DOI] [PMC free article] [PubMed] [Google Scholar]
- 45.Dominguez-Bello MG, Godoy-Vitorino F, Knight R & Blaser MJ Role of the microbiome in human development. Gut 68, 1108–1114, doi: 10.1136/gutjnl-2018-317503 (2019). [DOI] [PMC free article] [PubMed] [Google Scholar]
- 46.Zhao L The gut microbiota and obesity: from correlation to causality. Nat Rev Microbiol 11, 639–647, doi: 10.1038/nrmicro3089 (2013). [DOI] [PubMed] [Google Scholar]
- 47.Holmstrom K, Collins MD, Moller T, Falsen E & Lawson PA Subdoligranulum variabile gen. nov., sp. nov. from human feces. Anaerobe 10, 197–203, doi: 10.1016/j.anaerobe.2004.01.004 (2004). [DOI] [PubMed] [Google Scholar]
- 48.Van Hul M et al. From correlation to causality: the case of Subdoligranulum. Gut Microbes 12, 1–13, doi: 10.1080/19490976.2020.1849998 (2020). [DOI] [PMC free article] [PubMed] [Google Scholar]
- 49.Doern CD & Burnham CA It’s not easy being green: the viridans group streptococci, with a focus on pediatric clinical manifestations. J Clin Microbiol 48, 3829–3835, doi: 10.1128/JCM.01563-10 (2010). [DOI] [PMC free article] [PubMed] [Google Scholar]
- 50.Escapa IF et al. New Insights into Human Nostril Microbiome from the Expanded Human Oral Microbiome Database (eHOMD): a Resource for the Microbiome of the Human Aerodigestive Tract. mSystems 3, doi: 10.1128/mSystems.00187-18 (2018). [DOI] [PMC free article] [PubMed] [Google Scholar]
- 51.Couvigny B et al. Three glycosylated serine-rich repeat proteins play a pivotal role in adhesion and colonization of the pioneer commensal bacterium, Streptococcus salivarius. Environ Microbiol 19, 3579–3594, doi: 10.1111/1462-2920.13853 (2017). [DOI] [PubMed] [Google Scholar]
- 52.Amies CR A modified formula for the preparation of Stuart’s Transport Medium. Can J Public Health 58, 296–300 (1967). [PubMed] [Google Scholar]
- 53.Magoc T & Salzberg SL FLASH: fast length adjustment of short reads to improve genome assemblies. Bioinformatics 27, 2957–2963, doi: 10.1093/bioinformatics/btr507 (2011). [DOI] [PMC free article] [PubMed] [Google Scholar]
- 54.Caporaso JG et al. QIIME allows analysis of high-throughput community sequencing data. Nat Methods 7, 335–336, doi: 10.1038/nmeth.f.303 (2010). [DOI] [PMC free article] [PubMed] [Google Scholar]
- 55.Seow WK, Lam JH, Tsang AK, Holcombe T & Bird PS Oral Streptococcus species in pre-term and full-term children - a longitudinal study. Int J Paediatr Dent 19, 406–411, doi: 10.1111/j.1365-263X.2009.01003.x (2009). [DOI] [PubMed] [Google Scholar]
- 56.Vandecasteele SJ, Peetermans WE, Merckx R & Van Eldere J Quantification of expression of Staphylococcus epidermidis housekeeping genes with Taqman quantitative PCR during in vitro growth and under different conditions. J Bacteriol 183, 7094–7101, doi: 10.1128/JB.183.24.7094-7101.2001 (2001). [DOI] [PMC free article] [PubMed] [Google Scholar]
- 57.Blin K et al. antiSMASH 6.0: improving cluster detection and comparison capabilities. Nucleic Acids Res 49, W29–W35, doi: 10.1093/nar/gkab335 (2021). [DOI] [PMC free article] [PubMed] [Google Scholar]
- 58.Liu Y et al. Skin microbiota analysis-inspired development of novel anti-infectives. Microbiome 8, 85, doi: 10.1186/s40168-020-00866-1 (2020). [DOI] [PMC free article] [PubMed] [Google Scholar]
- 59.Ma M, Redes JL, Percopo CM, Druey KM & Rosenberg HF Alternaria alternata challenge at the nasal mucosa results in eosinophilic inflammation and increased susceptibility to influenza virus infection. Clin Exp Allergy 48, 691–702, doi: 10.1111/cea.13123 (2018). [DOI] [PMC free article] [PubMed] [Google Scholar]
- 60.Lu L et al. Loss of natural resistance to schistosome in T cell deficient rat. PLoS Negl Trop Dis 14, e0008909, doi: 10.1371/journal.pntd.0008909 (2020). [DOI] [PMC free article] [PubMed] [Google Scholar]
- 61.Lu L et al. Excessive immunosuppression by regulatory T cells antagonizes T cell response to schistosome infection in PD-1-deficient mice. PLoS Pathog 18, e1010596, doi: 10.1371/journal.ppat.1010596 (2022). [DOI] [PMC free article] [PubMed] [Google Scholar]
- 62.Chamanza R & Wright JA A Review of the Comparative Anatomy, Histology, Physiology and Pathology of the Nasal Cavity of Rats, Mice, Dogs and Non-human Primates. Relevance to Inhalation Toxicology and Human Health Risk Assessment. J Comp Pathol 153, 287–314, doi: 10.1016/j.jcpa.2015.08.009 (2015). [DOI] [PubMed] [Google Scholar]
- 63.Dixon P VEGAN, a package of R functions for community ecology. J Veg Sci 14, 927–930, doi: 10.1111/j.1654-1103.2003.tb02228.x (2003). [DOI] [Google Scholar]
- 64.Lozupone C & Knight R UniFrac: a new phylogenetic method for comparing microbial communities. Appl Environ Microbiol 71, 8228–8235, doi: 10.1128/AEM.71.12.8228-8235.2005 (2005). [DOI] [PMC free article] [PubMed] [Google Scholar]
Associated Data
This section collects any data citations, data availability statements, or supplementary materials included in this article.
Supplementary Materials
Data Availability Statement
Raw microbiome sequencing data (related to data shown in Fig. 1, Table 1, and Extended Data Figs. 1–6) and genome sequencing data have been deposited in NCBI’s Sequencing Read Archive (SRA) database under Bioproject numbers PRJNA796497 and PRJNA874865, respectively. All other data are presented in this manuscript. Source data files (see Supporting Material) contain detailed results for all figures with quantitative data. Bacterial strains are available from Min Li (rjlimin@shsmu.edu.cn).


