Abstract
Serum contains proteins that possess important information about diseases and their progression. Unfortunately, these proteins, which carry the information in the serum are in low abundance and are masked by other serum proteins that are in high abundance. Such masking prevents their identification and quantification. Therefore, removal of high abundance proteins is required to enrich, identify, and quantify the low abundance proteins. Immunodepletion methods are often used for this purpose, but there are limitations in their use because of off-target effects and high costs. Here we presented a robust, reproducible and cost-effective experimental workflow to remove immunoglobulins and albumin from serum with high efficiency. The workflow did not suffer from such limitations and enabled identification of 681 low abundance proteins that were otherwise undetectable in the serum. The identified low abundance proteins belonged to 21 different protein classes, namely the immunity-related proteins, modulators of protein-binding activity, and protein-modifying enzymes. They also played roles in various metabolic events, such as integrin signalling, inflammation-mediated signalling, and cadherin signalling. The presented workflow can be adapted to remove abundant proteins from other types of biological material and to provide considerable enrichment for low-abundance proteins.
Keywords: Albumin reduction, IgG removal, Biomarker discovery, Serum proteomics
INTRODUCTION
Serum is an easily accessible biological material, which provides important information about a person’s past, current, and future health status [1]. Compared to the other medically important biological materials, collecting serum is practical and ethically convenient. For this reason, there may be more than 150 FDA-approved laboratory tests that use serum as a starting material for the diagnosis or prognosis of various diseases [2]. However, the need for more clinically useful serum biomarkers is still ongoing and far from over.
A recent detailed serum proteome study showed that there are at least 4826 proteins in human serum, underlining its capacity as a biomarker source [3]. However, discovering novel serum biomarkers is a challenge for researchers primarily because proteins leak from tissues that are the potential disease biomarkers could not be detected unless immunoglobulins, albumin and other abundant proteins are removed [4]. Among the abundant proteins, removal of albumin is the most important but also the most challenging since albumin accounts for more than 55% of the total serum protein mass by weight. The second highly abundant group of proteins present in the serum are immunoglobulins which account for more than 35% of the total protein content. Therefore, when albumin is efficiently removed from the serum together with immunoglobulins, then most of the high abundant protein content is removed [5].
Numerous strategies have been developed and applied to remove albumin from serum [6,7]. Some of these strategies employed chemical depletion methods while others used affinity-based approaches. The use of chemical depletion methods did not provide strict selectivity between albumin and the other serum proteins [7]. Similarly, an affinity-based depletion method failed to remove albumin selectively [7]. In contrast, immunoaffinity-based methods using antibody-coupled resins are more successful in removing albumin and also other abundance proteins from serum [5,6]. Another commonly used method to reduce high abundance proteins involves a large, highly diverse bead-based library of combinatorial peptide ligands [8-10]. In this approach, complex biological samples are mixed with the beads and high abundance proteins saturate their high affinity ligands and the excess is washed away. In contrast, the medium and low abundance proteins are concentrated on their specific affinity ligands, resulting in a reduction in the dynamic range of protein concentrations while maintaining representatives of all proteins within the original sample [11,12].
Despite the success demonstrated, there are significant limitations regarding to the use of immunoaffinity-based approaches and bead-based library of combinatorial peptide ligands. Some of these limitations include extreme costs, inter-assay variations, carry-over problems and most importantly the off-target effects most of which are caused by serum albumin [7,13,14]. Experimental evidence shows that a significant number of proteins are eluted from immunoaffinity columns along with albumin [15]. This off-target effect of albumin, called “the sponge effect”, creates a protein pool known as “albuminome” [16,17]. Albumin’s sponge effect occurs because the pI of albumin differs significantly from that of other serum proteins, making it a highly negatively charged and sticky protein at physiological pH. To prevent the off-target effect caused by albumin, treatment of the bound proteins with mild solvents, salt-out precipitation, molecular sieve filtration, and the design of non-protein binding resins have been tried with limited success [18].
One of the most effective ways to prevent the interactions between albumin and low abundant proteins is to use strong ionic detergents in binding buffers during immunoaffinity chromatography. However, strong ionic detergents prevent protein-antibody interactions resulting in inefficient removal of abundant proteins by immunocapture. Therefore, if a fractionation system is developed without binding concerns, then abundant proteins can be removed in the presence of a strong ionic detergent without having off-target effects. Denaturing preparative gel electrophoresis is a well-suited experimental approach to perform fractionation in the presence of a strong ionic detergent. Therefore, in this study, we used preparative gel electrophoresis to localize and remove albumin from serum samples in the presence of SDS, a strong ionic detergent. The albumin-reduced serum was then analysed by nHPLC coupled to LC-MS/MS. A total of 681 low abundance proteins were identified. The identified low abundance serum proteins play roles in various metabolic pathways, including integrin signalling, inflammation-mediated signalling, and cadherin signalling.
MATERIALS AND METHODS
Ethics Approval
This study was approved by the Local Ethics Committee of Kocaeli University under the approval number of KOU GOKAEK 2020/18.19
Procurement of a serum sample
Blood samples were collected from a healthy 49-year-old male volunteered three times at different dates and kept at room temperature for 30 minutes before centrifugation at 1500 xg for 15 minutes. The serum was separated from the blood, aliquoted and stored at −80°C until use. For depletion of IgG and reduction of albumin, three serum samples were separately processed and analysed as biological replicates. Following reduction by preparative gel electrophoresis, protein samples were pooled for nLC-MS/MS analyses.
Depletion of serum IgG
A protein G column with 1mL bed volume (GE HiTrap® Uppsala, Sweden) connected to a fully automated NGC chromatography system (BioRad, CA) was used to deplete lgG from the serum samples. The column was first equilibrated with five volumes of binding buffer composed of 20 mM sodium phosphate, pH 7.0 at a flow rate of 1 mL/min. Then a 5-fold diluted serum sample of 0.2 mL was loaded onto the column at a flow rate of 1 mL/min. lgG-depleted serum was collected in flow through. IgG bound to the column were eluted with 2 mL of elution buffer and labeled as an IgG-containing fraction. Bradford assay (BioRad, CA) with BSA as the standard was used to measure protein concentrations in the serum, lgG-depleted serum and the lgG-containing fraction.
Evaluation of the reproducibility of lgG depletion
The IgG depletion procedure was repeated three times using serum samples collected from the same individual at different dates. For each experiment, SDS-PAGE gels were run to visually examine reproducibility of the depletion. Briefly, 20 μg protein from the serum, the IgG-depleted serum and the IgG-containing fraction was loaded into the wells of a 12% SDS-polyacrylamide gel and the gel was run at 180 V for 50 minutes before staining with Colloidal Coomassie blue (Bio-Rad, CA). Images of the gels were captured by VersaDoc MP 4000 imaging system (BioRad, CA) and analysed with Quantity One software (BioRad, CA).
Denaturing preparative gel electrophoresis
Denaturing preparative gel electrophoresis was performed with PrepCell Model 491 instrument (BioRad, CA) to separate albumin from other serum proteins. For separation, three different gel formats were tested; (1) a stepwise gel that was composed of 1.5 cm 15%, 3 cm 12% and 1.5 cm 10% polyacrylamide gel layers and (2) an 8% – 15% gradient gel and (3) a 12% polyacrylamide gel. Total length of each separating gel was kept at 6 cm. Each separating gel was also topped with 1 cm, 4% stacking gel. The bottom of PrepCell instrument was sealed with a dialysis membrane that had a molecular weight cut-off limit of 5 kDa. For each run, 15 mg protein from an lgG-depleted serum sample was mixed with 6X loading dye and incubated at 62°C for 20 minutes. After incubation and a brief cooling on ice, the sample was loaded onto a preparative gel and run at 25 mA for 20 minutes. The current was then raised to 45 mA and the gel was run with this constant current till the experiment was completed. The collection of the fractions was started right after the front blue dye eluted off the column. Three hundred fractions (0.5 mL/fraction) were collected using an automated fraction collector (BioRad, CA) to which a peristaltic pump (EP-1 Econo, BioRad, CA) was attached. The pump was set to a speed of 0.5 mL/min. Three independent experiments were carried out to assess reproducibility.
Locating albumin-reduced preparative gel electrophoresis fractions
To locate the exact position of the albumin-reduced PrepCell fractions, 20 μL of each fraction were loaded into the wells of 15% SDS-PAGE gels and the gels were run at 180 V for 60 minutes before silver staining. The images of the stained gels were then captured with VersaDoc MP 4000 and the albumin-reduced fractions were located and pooled. The pools were concentrated and buffer-exchanged with 20 mM phosphate buffer at pH 7.0 using a stirred cell (Millipore, CA) equipped with a cut-off limit of 5 kDa PM membrane (Millipore PBCC02510; Millipore Sigma, MA).
In-solution tryptic digestion and nHPLC LC-MS/MS analysis
In-solution digestion was performed using in-solution tryptic digestion and guanidination kit (Cat #89895, Thermo Fisher Scientific, MA) following the instructions provided by the manufacturer. The protocol can be summarized as follow: 10 μg protein sample was added to 15 μL 50 mM ammonium bicarbonate containing 100 mM DTT solution. The volume was completed to 27 μL and incubated at 95°C for 5 minutes. Iodoacetamide (IAA) was added to the heated sample to a 10 mM final concentration and incubated in the dark for 20 minutes. Then, 1 μL of 100 ng/μl trypsin solution was added and incubated for 3 hours at 37°C. Another 1 μL of 100 ng/μL trypsin was added to the peptide mixture and incubated overnight at 30°C. After incubation, the solution was concentrated with a SpeedVac centrifuge (Eppendorf, CT) to dryness and the peptides were resuspended in 0.1% Formic Acid solution (FA) for the nLC-MS/MS analysis.
Nano-liquid chromatography mass spectrometry (nLC-MS/MS)
For analysis of peptides Ultimate 3000 RSLC nano system (Dionex, Thermo Scientific, CA) coupled to a Q-Exactive mass spectrometer (Thermo Scientific, CA) was used. The entire system was controlled by Xcalibur 4.0 software (Thermo Fisher Scientific, CA). High performance liquid chromatography (HPLC) separation was performed using mobile phases of A (0.1% Formic Acid) and B (80% Acetonitrile + 0.1% Formic Acid). Digested peptides were pre-concentrated and desalted on a trap column. The peptides were then transferred to an Acclaim PepMap RSLC C18 analytical column (75 μm × 15 cm × 2 μm, 100 Å diameter, Thermo Scientific, CA). The gradient for separation was 6% for 8 minutes, 6% – 10% B for 12 minutes, 10% – 30% B for 160 minutes, 30% – 50% B for 25 minutes, 50% – 90% for 10 minutes, 90% for 15 minutes, 90% – 96% B for 5 minutes and 6% B for 5 minutes with the flow rate of 300 nL/min in a 240-minute total run time. Full scan MS1 spectra were acquired with the following parameters: resolution 70.000, scan range 400 – 2000 m/z, target automatic gain control (AGC) 3×E6, maximum injection time 60 ms, spray voltage 2.3 kV. MS/MS analysis was performed by data dependent acquisition selecting the top ten precursor ions. The MS2 analysis composed of collision-induced dissociation (higher-energy collisional dissociation [HCD]) with the following parameters:
resolution 17.500;
AGC 1E6;
maximum injection time 100 ms;
isolation window 2.0 m/z normalized;
collision energy (NCE) 27.
The instrument was calibrated using a standard positive calibrant (LTQ Velos ESI Positive Ion Calibration Solution 88323, Pierce, FL) prior to each analysis.
nHPLC LC-MS/MS data analysis
Analysis of the raw data was performed with Proteom Discoverer 2.2 software (Thermo Scientific, MA) for protein identification and the following parameters were used; peptide mass tolerance 10 ppm, MS/MS mass tolerance 0.2 Da, mass accuracy 2 ppm, tolerant miscarriage 1, minimum peptide length 6 amino acids, fixed changes cysteine carbamidomethylation, unstable changes methionine oxidation and asparagine deamination. The minimum number of peptides identified for each protein was 1 and obtained data were searched against Uniprot/Swissprot database.
Bioinformatics analysis
The PANTHER Protein Analysis THrough Evolutionary Relationships, http://PANTHERdb.org/) and STRING analyses were carried out using the Uniprot accession numbers of the identified proteins. The organism was specified as Homo sapiens and functional classifications were viewed as bar charts. Selected ontologies included molecular function, biological process, cellular function, cellular component, protein class and pathway. For each of the ontology, manual analysis was performed by listing the selected proteins and cross-checking their given properties with Uniprot entries.
RESULTS
Depletion of IgG and removal of albumin from the serum samples
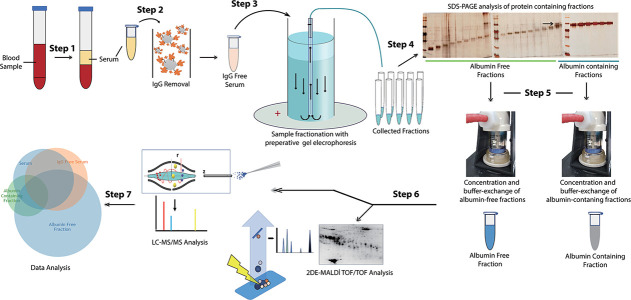
An experimental workflow was designed to deplete IgG and reduce albumin from the serum samples to enrich low abundance proteins, which were then identified by nHPLC coupled to LC-MS/MS (Fig. 1).
Figure 1.
Schematic representation of the experimental workflow used in this study. Serum samples were processed to deplete IgG and reduce albumin before being subjected to nHPLC coupled LC-MS/MS analysis. The identified proteins were then grouped based on their presence in the processed samples.
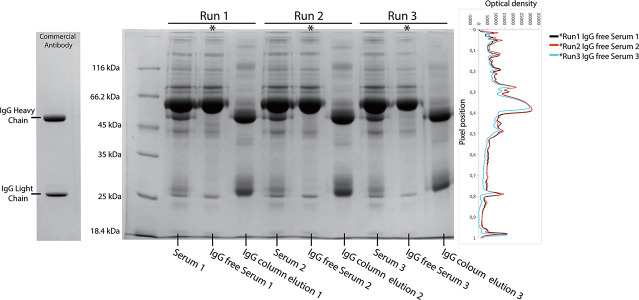
A 49-year-old healthy male with no known chronic or acute medical condition volunteered to donate blood samples for this study. His blood tests revealed nothing unusual about his current health. Blood was collected from this person for three times at different dates and serum samples were prepared and stored. IgG was depleted from the serum samples using a prepacked Protein G column. To prevent run-to run variation, each depletion was performed with an automated protein purification system using the recommended conditions. SDS-PAGE analysis of the IgG-depleted serum samples from three independent runs showed that the two protein bands belonging to the heavy and light chains were absent in the flow-through fractions while they were clearly visible in the bound fractions (Fig. 2). There were other minor bands observed in addition to the major two IgG bands in the eluted fractions. This is a common phenomenon observed on SDS-PAGE gels of IgG runs. These bands might have been caused by the dimers/oligomers of heavy and light IgG chains. Moreover, isomers of IgG appear as separate bands in SDS-PAGE gels [19]. Last but not least incomplete denaturation of IgG bands might have caused appearance of minor protein bands on the gels.
Figure 2.
SDS-PAGE analysis of IgG-depleted serum samples from three independent runs. The same amount of protein was loaded into each well and a commercial 1 μg antibody (Santa Cruz: sc-69879) was used as the standard for the IgG profiling. The IgG-depleted serum samples lacked the immunoglobulin heavy and light chains, while the eluted fractions contained both chains. Analysis of each lane showed a consistent banding pattern in the corresponding protein loadings.
The IgG-depleted flow-through fractions from the protein-G column were pooled and loaded onto denaturing preparative gels for reduction of albumin. Three different preparative gel types, namely a stepwise gradient gel, a linear gradient gel and a straight 12% gel, were used. All three gel types separated albumin from the other serum proteins (Fig. 3). Although there are a few advantages of using gradient gels such as resolution of a broader range of proteins on a single gel, production of sharper bands and better separation of similar-sized proteins, gradient gels require more nuanced preparation than standard single concertation gels [20]. As to the stepwise gels, they are easier to prepare than gradient gels and provide better resolution than standard single concentration gels. However, in our case all three gel types used served the purpose and separated albumin from the other proteins. Therefore, due to the convenience in gel casting, 12% gels were used in subsequent experiments.
Figure 3.
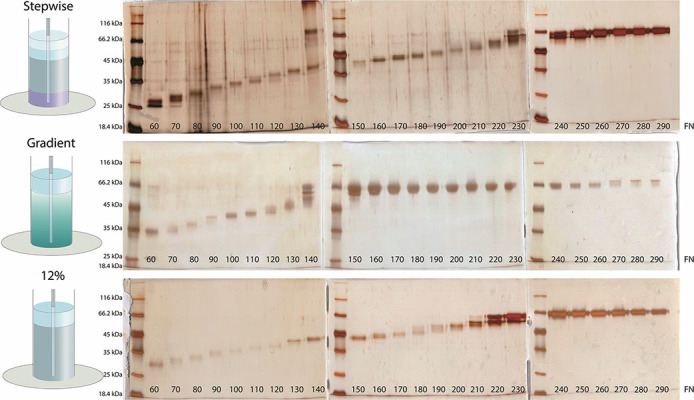
SDS-PAGE analysis of fractions collected from preparative gels. The experiments were carried out to optimize the gel concentration to achieve sufficient resolution for the separation of albumin from other proteins. Three different separating gel formats were tested; a stepwise gel composed of 1.5 cm 15%, 3 cm 12% and 1.5 cm 10% polyacrylamide gel layers and an 8% – 15% gradient gel and a 12% polyacrylamide gel. The total length of each separating gel was kept at 6 cm. Each separating gel was also topped with 1 cm, 4% stacking gel. The bottom of the preparative gel electrophoresis instrument was sealed with a dialysis membrane that had a molecular weight cut-off limit of 5 kDa. A total of 300 fractions, 0.5 mL of each, were collected. SDS-PAGE gels were silver stained and visualized with VersaDoc MP4000 imaging system.
Three separate runs were performed to demonstrate reproducibility. A total of 300 fractions were collected in each run. To locate albumin-containing fractions, samples from every tenth fraction were subjected to SDS-PAGE analysis using silver staining. Analysis showed that albumin was eluted from the columns after Fraction 200. Fractions 210 and above contained distinct bands of albumin and were therefore considered albumin-containing fractions. To determine the exact location of albumin, each protein fraction between Fractions 201 and 209 was subjected to SDS-PAGE analysis (Fig. 4).
Figure 4.
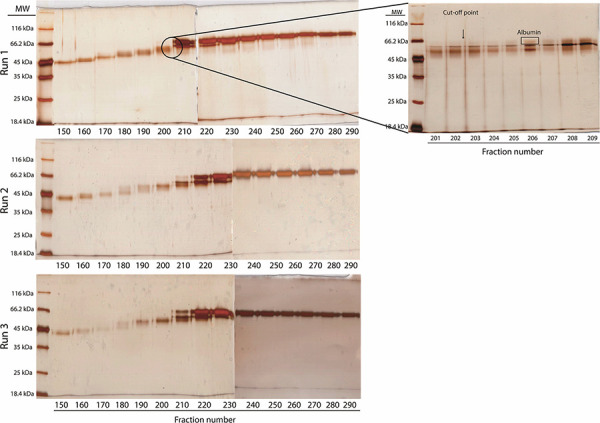
SDS-PAGE analysis of fractions from three independent preparative gel electrophoresis runs. Three hundred fractions were collected and every tenth fraction was subjected to SDS-PAGE analysis to roughly determine the albumin-containing fractions. Fraction 210 and above contained distinct bands of albumin. The exact location of the albumin-containing fractions was determined by SDS-PAGE analysis of each protein fraction between 201 and 209 (the outlet gel image). SDS-PAGE gels were silver stained and visualized with VersaDoc MP4000 imaging system.
Fractions up to 202 were not only depleted in IgG but also significantly reduced in albumin and were thus combined to generate IgG-depleted and albumin-reduced protein pools. The protein pools, although depleted in IgG and reduced in albumin, contained SDS carried over from the 12% preparative denaturing gels. SDS is an ionic detergent that could interfere with LC-MS/MS experiments. To overcome this interference, the protein pools were concentrated and buffer exchanged. An SDS-PAGE gel was then run to analyse the success of the whole process (Fig. 5). Analysis of the gel images revealed that IgG-depleted and albumin-reduced protein pools were enriched and reproducibly showed similar protein band patterns.
Figure 5.
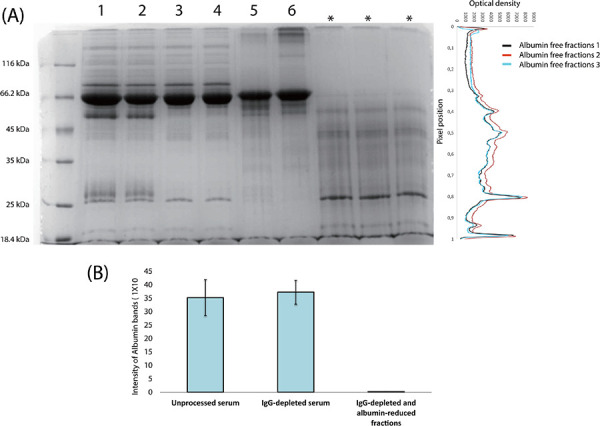
(A) SDS-PAGE analysis of the proteins from unprocessed serum samples (Lanes 1 and 2), IgG-depleted flow-through fractions from the protein G column (Lanes 3 and 4) and albumin-containing fractions eluted from preparative gel fractions (Lanes 5 and 6). The last three lanes marked with asterisks were run to demonstrate the absence of IgG and albumin bands in IgG-depleted and albumin-reduced serum samples. (B) Graphic representation of the albumin reduction. The graph was generated by measuring the intensities of albumin bands on the gels using Quantity One software.
Identification of low abundance proteins by nHPLC- LC-MS/MS
nHPLC- LC-MS/MS analyses were performed using (1) an unprocessed serum sample (2) an IgG-depleted serum sample (3) albumin-containing fractions and (4) IgG-depleted and albumin-reduced protein fractions to assess the level of enrichment (Fig. 6). A total of 358 proteins were identified in the unprocessed serum. Among these proteins, 194 were high abundance proteins (Table S1). As for IgG-depleted and albumin-reduced serum samples, there was at least a 2.7-fold increase in the number of identified low abundance proteins compared to the unprocessed serum samples. A total of 979 proteins was identified, among which, 681 were classified as low-abundance proteins (Table S2). IgG-depletion itself did not provide much enrichment. Approximately 50% of the proteins identified after depletion of IgG were high abundance proteins (Table S3). We also analysed the albumin-rich protein fractions and detected a few high and low abundance proteins carried by the albumin (Table S4).
Figure 6.
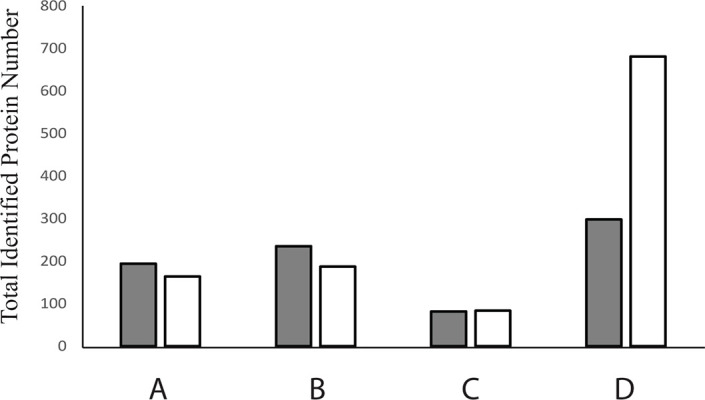
Graphical representation of low and high abundant proteins in the samples throughout the process. Proteins were identified by nHPLC coupled to LC-MS/MS. (A) un-processed serum; (B) IgG-depleted serum sample; (C) albumin-containing fractions eluted from preparative gels and (D) IgG-depleted and albumin-reduced protein fractions collected from preparative gels. White bars represent low abundance proteins and grey bars represent high abundance proteins.
Bioinformatic analyses of low abundance proteins
Bioinformatic analyses was performed to assess the characteristics of low abundance proteins identified throughout the enrichment process. Differences after each enrichment step were elucidated by comparisons. Unique low abundance proteins were identified in each enrichment step (Fig. 7A). When these low abundance proteins were subjected to PANTHER analysis, the proteins from IgG-depleted and albumin-reduced serum samples displayed the most versatile biological process and pathway involvement followed by the low abundant proteins from unprocessed serum, IgG-depleted serum and albumin-containing serum samples (Fig. 7B). A similar analysis was also performed with STRING. Low-abundance proteins from unprocessed serum samples were associated with immune response, complement activation and transport, while the proteins unique to IgG-depleted serum samples were involved in RNA splicing and binding. Interestingly, proteins associated with DNA replication, haemoglobin binding and displaying oxygen carrier activity were found in the albumin-containing fractions. In the IgG-depleted and albumin-reduced serum samples, due to the large number of low-abundance proteins, a complex protein interaction network connecting various metabolic events and biological processes was detected (Fig. S1).
Figure 7.
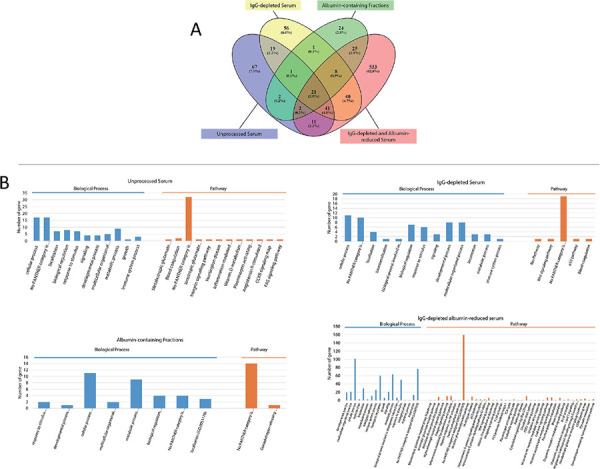
(A) Venn diagram of low abundant proteins. (B) PANTHER analyses of group specific low abundant proteins which was presented as biological processes and pathways.
DISCUSSION
Serum is a valuable source of biomarkers with a rich repertoire of biomolecules [21]. However, analysing serum to discover novel biomarkers is a difficult task and many serum-based proteomics studies have not provided satisfactory results [22]. This deficiency is due to the fact that the sought-after biomarkers in the serum are present in low concentrations and are overshadowed by the presence of proteins with high abundance [23]. Albumin is the most abundant protein in serum accounting for more than 50% – 55% of the total protein content (the normal concentration range is 35 – 50 mg/mL) [24,25]. If it can be removed from the serum along with immunoglobulins, then more than 75% – 85% of the abundant protein content is removed. Scientists have worked on this task using various approaches. Some of these approaches such as immuno-depletion have been successful in removing high abundance proteins and enriching low abundance proteins [26]. However, the off-target effect which is the ability of albumin to non-specifically carry proteins with biomarker value is problematic [13]. It was determined that albumin can carry over 100 or more low abundance proteins when removed from serum [15]. Therefore, a novel technology, approach or an experimental workflow that could eliminate the off-target effect of albumin is required to further advance serum-based biomarker studies. Here, we, aimed to develop an experimental workflow that is affordable, reproducible, and compatible with downstream applications while preventing the off-target effect of albumin during enrichment of low abundance proteins.
In previous studies, serum proteins were fractionated using ion exchange chromatography, IEF, HIC and HILIC to reduce high abundance proteins [18]. These approaches have met with limited success because their resolution was limited. In addition, the off-target effect of albumin in chromatographic separations could not be avoided. Our workflow also relied on fractionation of the serum proteins but involved the use of Protein G column along with preparative gel electrophoresis system. The protein G column effectively depleted serum IgG while the preparative gel electrophoresis system reduced albumin. In particular, the use of preparative gel electrophoresis provided two benefits over classical fractionation approaches; (1) By utilizing the strong separating power of polyacrylamide gels, high resolution was achieved with the ability to collect proteins into fractions. During the runs, proteins were separated into sharp bands and were collected from the bottom of the gel. (2) The use of SDS in polyacrylamide gels reduced the sponge effect of albumin.
The IgG-depleted and albumin reduced fractions collected from the preparative gels were pooled, concentrated, buffer exchanged and analysed by nHPLC coupled to LC-MS/MS. A total of 681 low abundance proteins were identified, accounting for 69.7% of the total identified proteins. This is a significant improvement in coverage of the low abundance proteins.
Several studies analysed the methods of depleting high abundance proteins and enriching low abundance proteins [6,7,14,15,27,28]. One of the points of contention among these studies is their definition of proteins of high abundance in serum. There does not appear to be a universally accepted list of high abundance proteins that can be used to assess serum proteome data. Therefore, we established a criterion using the calculated concentrations from human proteome database. Proteins with concentrations more than 10 ng/mL were accepted as high abundance (Table S5) [14]. A total of 162 proteins were classified as high abundance. This is one of the most exclusive lists provided in the literature for high abundance proteins.
In the presented study, the denaturing power of SDS was used during fractionation. Despite this, the fractionated albumin still contained some proteins and created an albuminome. We believe that some of these proteins were the fragments of albumin itself since in human serum, albumin fragments with molecular weights of 45, 28 and 19 kDa can account for more than 2% of total albumin [18]. The SDS-PAGE concentration that was used can be increased gradually to prevent binding of albumin with low abundance proteins. In other words, further optimization of the workflow may allow significant elimination of albumin’s off-target effect.
A disadvantage of the presented workflow was the lack of proteins, which can have higher molecular weights higher than albumin. While this appears to be a disadvantage, it is important to note that the proteins that have biomarker value in serum are those that can leak from tissues into serum. These proteins generally do have molecular weights less than 40 kDa [29]. Therefore, the search for high molecular weight biomarkers may not worth the effort and the investment. Low abundance proteins detected in the IgG-depleted and albumin-reduced serum samples created a complex protein interaction network connecting various metabolic events and biological processes. More than 40 different pathways and 18 biological processes were detected. When all of the low abundant proteins were subjected to bioinformatics analysis, more than 150 different pathways were revealed reflecting complexity of the serum proteome. When low-abundant proteins from IgG-depleted serum samples were analysed, pathways associated with neurotransmitter receptor complex, complement system and spliceosome were highlighted. Specifically, neurotransmitter receptor complex members such as kinesin, spliceosome proteins such as CDC5L, and some of the complement system-related proteins were underlined. In addition, surprisingly, quite number of low abundant proteins were detected in albumin containing fractions and they were found to be associated with oxygen transport and haemoglobin binding. Apparently, haemoglobin or haemoglobin-based oxygen carriers covalently bind to albumin and were not separated during fractionation [30]. This explains the fact that even under strong denaturing conditions, albumin-containing fractions still contained low-abundance proteins.
Twenty-one different protein classes have been detected. The top three protein classes were formed by defence /immunity proteins, modulators of protein-binding activity and protein-modifying enzymes. The identified proteins played roles in various metabolic processes. Proteins related to integrin signalling were the prominent ones, but proteins related to inflammation mediated signalling and cadherin signalling were also evident. It was surprising to detect proteins associated with two neurodegenerative disorders, namely Alzheimer’s and Huntington.
CONCLUSION
Serum has a high dynamic range of proteins reaching over 10 orders of magnitude [6]. The complexity of the serum proteome is not fully captured and resolution needs to be improved in proteomics studies. Any attempt in this direction should be applauded. One way to reduce this complexity is to reduce the number and amount of high abundance proteins so that low abundance proteins become enriched and detectable. In this study, we presented an experimental workflow to deplete and reduce two of the most abundant proteins, namely IgG and albumin from serum. The depletion of IgG and reduction of albumin enabled us to detect and identify many of the proteins that are low in abundance and otherwise undetectable. In addition, the presented approach was affordable, reproducible and compatible with downstream applications. We predict that it can also adapted to remove other abundant proteins from other biological sources, e.g., removal of Ribulose bisphosphate carboxylase (Rubisco) from plant protein extracts. If necessary, further optimization of the presented work is possible to increase the resolution of the separation power and reduce the sponge effect of albumin.
Legend for supplementary Figures
Supplementary Figure S1. String analyses of low abundant proteins from samples of unprocessed serum, IgG-depleted serum, albumin-containing fractions and IgG-depleted and albumin-reduced serum samples.
Supplementary information of this article can be found online at
https://polscientific.com/jbm/index.php/jbm/article/view/394/474.
https://polscientific.com/jbm/index.php/jbm/article/view/394/475.
https://polscientific.com/jbm/index.php/jbm/article/view/394/477.
https://polscientific.com/jbm/index.php/jbm/article/view/394/478.
https://polscientific.com/jbm/index.php/jbm/article/view/394/479.
https://polscientific.com/jbm/index.php/jbm/article/view/394/480.
ACKNOWLEDGEMENT
This study was supported by Kocaeli University Scientific Research and Project Unit (KOÜ-BAP Birimi) under the grant number of TSA-2021-2311.
References
- 1.Lamb JR, Jennings LL, Gudmundsdottir V, Gudnason V, Emilsson V. It’s in Our Blood: A Glimpse of Personalized Medicine. Trends Mol Med. 2021. Jan;27(1):20–30. https://doi.org/10.1016/j.molmed.2020.09.003 10.1016/j.molmed.2020.09.003 PMID: [DOI] [PMC free article] [PubMed] [Google Scholar]
- 2.Ignjatovic V, Geyer PE, Palaniappan KK, Chaaban JE, Omenn GS, Baker MS, et al. Mass Spectrometry-Based Plasma Proteomics: Considerations from Sample Collection to Achieving Translational Data. J Proteome Res. 2019. Dec;18(12):4085–97. https://doi.org/10.1021/acs.jproteome.9b00503 10.1021/acs.jproteome.9b00503 PMID: [DOI] [PMC free article] [PubMed] [Google Scholar]
- 3.Dey KK, Wang H, Niu M, Bai B, Wang X, Li Y, et al. Deep undepleted human serum proteome profiling toward biomarker discovery for Alzheimer’s disease. Clin Proteomics. 2019. Apr;16(1):16. https://doi.org/10.1186/s12014-019-9237-1 10.1186/s12014-019-9237-1 PMID: [DOI] [PMC free article] [PubMed] [Google Scholar]
- 4.Sun BB, Maranville JC, Peters JE, Stacey D, Staley JR, Blackshaw J, et al. Genomic atlas of the human plasma proteome. Nature. 2018. Jun;558(7708):73–9. https://doi.org/10.1038/s41586-018-0175-2 10.1038/s41586-018-0175-2 PMID: [DOI] [PMC free article] [PubMed] [Google Scholar]
- 5.Jaros JA, Guest PC, Bahn S, Martins-de-Souza D. Affinity depletion of plasma and serum for mass spectrometry-based proteome analysis. Methods Mol Biol. 2013;1002:1–11. https://doi.org/10.1007/978-1-62703-360-2_1 10.1007/978-1-62703-360-2_1 PMID: [DOI] [PubMed] [Google Scholar]
- 6.Polaskova V, Kapur A, Khan A, Molloy MP, Baker MS. High-abundance protein depletion: comparison of methods for human plasma biomarker discovery. Electrophoresis. 2010. Jan;31(3):471–82. https://doi.org/10.1002/elps.200900286 10.1002/elps.200900286 PMID: [DOI] [PubMed] [Google Scholar]
- 7.Zolotarjova N, Martosella J, Nicol G, Bailey J, Boyes BE, Barrett WC. Differences among techniques for high-abundant protein depletion. Proteomics. 2005. Aug;5(13):3304–13. https://doi.org/10.1002/pmic.200402021 10.1002/pmic.200402021 PMID: [DOI] [PubMed] [Google Scholar]
- 8.Candiano G, Dimuccio V, Bruschi M, Santucci L, Gusmano R, Boschetti E, et al. Combinatorial peptide ligand libraries for urine proteome analysis: investigation of different elution systems. Electrophoresis. 2009. Jul;30(14):2405–11. https://doi.org/10.1002/elps.200800762 10.1002/elps.200800762 PMID: [DOI] [PubMed] [Google Scholar]
- 9.Boschetti E, Giorgio Righetti P. Hexapeptide combinatorial ligand libraries: the march for the detection of the low-abundance proteome continues. Biotechniques. 2008. Apr;44(5):663–5. https://doi.org/10.2144/000112762 10.2144/000112762 PMID: [DOI] [PubMed] [Google Scholar]
- 10.Beseme O, Fertin M, Drobecq H, Amouyel P, Pinet F. Combinatorial peptide ligand library plasma treatment: advantages for accessing low-abundance proteins. Electrophoresis. 2010. Aug;31(16):2697–704. https://doi.org/10.1002/elps.201000188 10.1002/elps.201000188 PMID: [DOI] [PubMed] [Google Scholar]
- 11.Boschetti E, Righetti PG. The ProteoMiner in the proteomic arena: a non-depleting tool for discovering low-abundance species. J Proteomics. 2008. Aug;71(3):255–64. https://doi.org/10.1016/j.jprot.2008.05.002 10.1016/j.jprot.2008.05.002 PMID: [DOI] [PubMed] [Google Scholar]
- 12.Righetti PG, Boschetti E. The ProteoMiner and the FortyNiners: searching for gold nuggets in the proteomic arena. Mass Spectrom Rev. 2008;27(6):596–608. https://doi.org/10.1002/mas.20178 10.1002/mas.20178 PMID: [DOI] [PubMed] [Google Scholar]
- 13.Lee HJ, Lee EY, Kwon MS, Paik YK. Biomarker discovery from the plasma proteome using multidimensional fractionation proteomics. Curr Opin Chem Biol. 2006. Feb;10(1):42–9. https://doi.org/10.1016/j.cbpa.2006.01.007 10.1016/j.cbpa.2006.01.007 PMID: [DOI] [PubMed] [Google Scholar]
- 14.Tu C, Rudnick PA, Martinez MY, Cheek KL, Stein SE, Slebos RJ, et al. Depletion of abundant plasma proteins and limitations of plasma proteomics. J Proteome Res. 2010. Oct;9(10):4982–91. https://doi.org/10.1021/pr100646w 10.1021/pr100646w PMID: [DOI] [PMC free article] [PubMed] [Google Scholar]
- 15.Licia C. Silva-Costa, Sheila Garcia-Rosa, Bardley J. Smith, Paulo A. Baldasso, Johann Steiner, Daniel Martins-de-Souza. Blood plasma high abundant protein depletion unintentionally carries over 100 proteins. SSC Plus. 2019. Dec;2(12):449-456. https://doi:10.1002/sscp.201900057. 10.1002/sscp.201900057 [DOI] [Google Scholar]
- 16.Gundry RL, Fu Q, Jelinek CA, Van Eyk JE, Cotter RJ. Investigation of an albumin-enriched fraction of human serum and its albuminome. Proteomics Clin Appl. 2007. Jan;1(1):73–88. https://doi.org/10.1002/prca.200600276 10.1002/prca.200600276 PMID: [DOI] [PMC free article] [PubMed] [Google Scholar]
- 17.Liu Z, Li S, Wang H, Tang M, Zhou M, Yu J, et al. Proteomic and network analysis of human serum albuminome by integrated use of quick crosslinking and two-step precipitation. Sci Rep. 2017. Aug;7(1):9856. https://doi.org/10.1038/s41598-017-09563-w 10.1038/s41598-017-09563-w PMID: [DOI] [PMC free article] [PubMed] [Google Scholar]
- 18.Gianazza E, Miller I, Palazzolo L, Parravicini C, Eberini I. With or without you - Proteomics with or without major plasma/serum proteins. J Proteomics. 2016. May;140:62–80. https://doi.org/10.1016/j.jprot.2016.04.002 10.1016/j.jprot.2016.04.002 PMID: [DOI] [PubMed] [Google Scholar]
- 19.Qian J, El Khoury G, Issa H, Al-Qaoud K, Shihab P, Lowe CR. A synthetic Protein G adsorbent based on the multi-component Ugi reaction for the purification of mammalian immunoglobulins. J Chromatogr B Analyt Technol Biomed Life Sci. 2012. Apr 21;898:15-23. https://doi:10.1016/j.jchromb.2012.03.043 10.1016/j.jchromb.2012.03.043 PMID:. [DOI] [PubMed] [Google Scholar]
- 20.Walker JM. Gradient SDS Polyacrylamide Gel Electrophoresis of Proteins. Methods in Mol Biol. 1994;32:35-8. https://doi.org/10.1385/0-89603-268-X:35 10.1385/0-89603-268-X:35 PMID: [DOI] [PubMed] [Google Scholar]
- 21.Hu S, Loo JA, Wong DT. Human body fluid proteome analysis. Proteomics. 2006. Dec;6(23):6326–53. https://doi.org/10.1002/pmic.200600284 10.1002/pmic.200600284 PMID: [DOI] [PMC free article] [PubMed] [Google Scholar]
- 22.Veenstra TD. Where are all the biomarkers? Expert Rev Proteomics. 2011. Dec;8(6):681-3. https://doi:10.1586/epr.11.60 10.1586/epr.11.60 PMID: [DOI] [PubMed] [Google Scholar]
- 23.Anderson NL, Anderson NG, Pearson TW, Borchers CH, Paulovich AG, Patterson SD, et al. A human proteome detection and quantitation project. Mol Cell Proteomics. 2009. May;8(5):883–6. https://doi.org/10.1074/mcp.R800015-MCP200 10.1074/mcp.R800015-MCP200 PMID: [DOI] [PMC free article] [PubMed] [Google Scholar]
- 24.Rengarajan K, de Smet MD, Wiggert B. Removal of albumin from multiple human serum samples. Biotechniques. 1996. Jan;20(1):30-2. http://doi:10.2144/96201bm05 10.2144/96201bm05 PMID: [DOI] [PubMed] [Google Scholar]
- 25.Anderson NL, Anderson NG. The human plasma proteome: history, character, and diagnostic prospects. Mol Cell Proteomics. 2002. Nov;1(11):845–67. https://doi.org/10.1074/mcp.R200007-MCP200 10.1074/mcp.R200007-MCP200 PMID: [DOI] [PubMed] [Google Scholar]
- 26.Brand J, Haslberger T, Zolg W, Pestlin G, Palme S. Depletion efficiency and recovery of trace markers from a multiparameter immunodepletion column. Proteomics. 2006. Jun;6(11):3236–42. https://doi.org/10.1002/pmic.200500864 10.1002/pmic.200500864 PMID: [DOI] [PubMed] [Google Scholar]
- 27.Liu B, Qiu FH, Voss C, Xu Y, Zhao MZ, Wu YX, et al. Evaluation of three high abundance protein depletion kits for umbilical cord serum proteomics. Proteome Sci. 2011. May;9(1):24. https://doi.org/10.1186/1477-5956-9-24 10.1186/1477-5956-9-24 PMID: [DOI] [PMC free article] [PubMed] [Google Scholar]
- 28.Lee PY, Osman J, Low TY, Jamal R. Plasma/serum proteomics: depletion strategies for reducing high-abundance proteins for biomarker discovery. Bioanalysis. 2019. Oct;11(19):1799–812. https://doi.org/10.4155/bio-2019-0145 10.4155/bio-2019-0145 PMID: [DOI] [PubMed] [Google Scholar]
- 29.Shen Y LL, Liao J. Assay: Proteomics Technology for Plasma and Serum. GEN. 2006. May;26(10). Accessed September 18, 2014. https://www.genengnews.com/magazine/50/assay-proteomics-technology-for-plasma-serum/ [Google Scholar]
- 30.Gekka M, Abumiya T, Komatsu T, Funaki R, Kurisu K, Shimbo D, et al. Novel Hemoglobin-Based Oxygen Carrier Bound With Albumin Shows Neuroprotection With Possible Antioxidant Effects. Stroke. 2018. Aug;49(8):1960-1968. https://doi:10.1161/STROKEAHA.118.021467 10.1161/STROKEAHA.118.021467 PMID:. [DOI] [PubMed] [Google Scholar]
Associated Data
This section collects any data citations, data availability statements, or supplementary materials included in this article.
Supplementary Materials
Supplementary Figure S1. String analyses of low abundant proteins from samples of unprocessed serum, IgG-depleted serum, albumin-containing fractions and IgG-depleted and albumin-reduced serum samples.


