Abstract
T lymphocytes migrate to barrier sites after exposure to pathogens providing localized immunity and long-term protection. Here, we obtained tissues from human organ donors to examine T cells across major barrier sites (skin, lung, jejunum), associated lymph nodes, lymphoid organs (spleen, bone marrow), and in circulation. By integrating single-cell protein and transcriptome profiling, we demonstrate that human barrier sites contain tissue-resident memory T cells (TRM) that exhibit site-adapted profiles for residency, homing, and function distinct from circulating memory T cells. Incorporating T cell receptor and transcriptome analysis, we show that circulating memory T cells are highly expanded, display extensive overlap between sites, and exhibit effector and cytolytic functional profiles, while TRM clones exhibit site-specific expansions and distinct functional capacities. Together, our findings indicate that circulating T cells are more disseminated and differentiated, while TRM exhibit tissue-specific adaptation and clonal segregation, suggesting that strategies to promote barrier immunity require tissue-targeting.
Keywords: Immune memory, Tissue resident memory T cells, T cell receptor, mucosal immunity
Immune cells situated in barrier sites, such as skin, lung, and intestines, provide localized defense against pathogens at their main entry points and form a protective shield between the body and the environment. Innate immune cells, such as macrophages and dendritic cells, seed directly into barrier tissues during their development, while T cells, which coordinate adaptive immunity, populate barrier sites in response to antigen exposure. A subset persists as tissue resident memory T cells (TRM), which can be generated following site-specific infection by diverse pathogens including viruses, bacteria, parasites, and fungi, as demonstrated in mouse models1,2. Mouse TRM mediate efficacious protection in the skin, lung, and intestines through in situ functional responses, proliferation, and recruitment3–5. Understanding how TRM become adapted to and persist in barrier sites in humans is important for promoting protective immunity.
In humans, TRM are found in practically all tissues including barrier sites, primary and secondary lymphoid organs, and exocrine organs (e.g., liver, pancreas)2,6. The frequency of TRM is a feature of the tissue: intestines contain predominantly TRM with negligible circulating T cells, lung and skin have majority TRM along with circulating subsets, while lymphoid organs have lower frequencies of TRM compared to circulating subsets7–9. Human TRM exhibit core gene and protein signatures that distinguish them from circulating memory T cells8,10 and can exhibit site-specific expression of differentiation and functional markers11–13. However, the extent to which TRM become adapted to specific tissue types remains unclear and requires a comprehensive assessment of multiple sites within the same individual.
There is evidence that human TRM may play functional roles in protective immunity in barrier sites. TRM specific to acute respiratory viruses, such as influenza and SARS-CoV-2, are preferentially maintained in the lungs relative to other sites14,15, suggesting generation of site-specific immunity. TRM specific for intestinal microbiome and pathogens are maintained in the intestines16, while in skin, TRM are generated to cutaneous infection and associated with protection17,18. Whether these site-specific responses are maintained within barrier sites or shared in circulation is unclear. Our recent analysis of T cell receptor (TCR) sequences across subsets in blood, lymphoid organs, and lungs of individual organ donors revealed sharing of highly expanded memory T clones across multiple sites19. Assessing how T cell clones within the major portals for pathogen entry are maintained requires sampling of multiple barrier sites along with lymphoid organs and blood for monitoring and tracking immune responses.
In this study, we integrated multiple single-cell technologies to investigate the clonal overlap and tissue adaptations of T cells in human barrier sites relative to diverse lymphoid organs and blood of individual organ donors, using our well-validated tissue resource9,20,21. Investigating protein expression profiles by cytometry by time-of-flight (CyTOF) and transcriptional profiles by single-cell RNA sequencing (scRNA-seq), we identified distinct tissue-specific populations conserved across individuals and TRM protein and gene expression signatures unique to each barrier site, which are associated with distinct functions. TCR clonal analysis by DNA sequencing and scRNA-seq shows tissue-restricted expansion and segregation of TRM clones in barrier tissues, and highly expanded TEM and TEMRA clones dispersed across sites with cytolytic functions. These findings demonstrate the heterogeneity of tissue-adapted T cell lineages and the landscape of clonal networks across barrier sites, their associated lymphoid tissues, and circulation, with important implications for targeting and monitoring site-specific immunity.
RESULTS
Acquisition of human tissues for single-cell profiling
We have established a human tissue resource for obtaining blood and multiple lymphoid and barrier sites from individual organ donors, which enables investigation of immune responses across the body. Mononuclear cells were isolated from nine sites – blood, barrier tissues (lung, jejunum, and abdominal skin), their associated lymph nodes (lung lymph node (LN), mesenteric lymph node (MN), and inguinal lymph node (IN), respectively), and systemic lymphoid organs (bone marrow (BM), spleen) – obtained from seven donors ages 22–74 yrs (Supplementary Table 1), using well-validated protocols (see Methods)14,20,21. With this cohort, we performed single-cell profiling, CyTOF, high-throughput T cell receptor sequencing (TCR-seq), and 10X Genomics 5’ scRNA-seq along with V region sequencing of TCRA and TCRB genes of T cells isolated from multiple tissue sites of individual donors.
Barrier sites contain tissue-adapted T cell populations
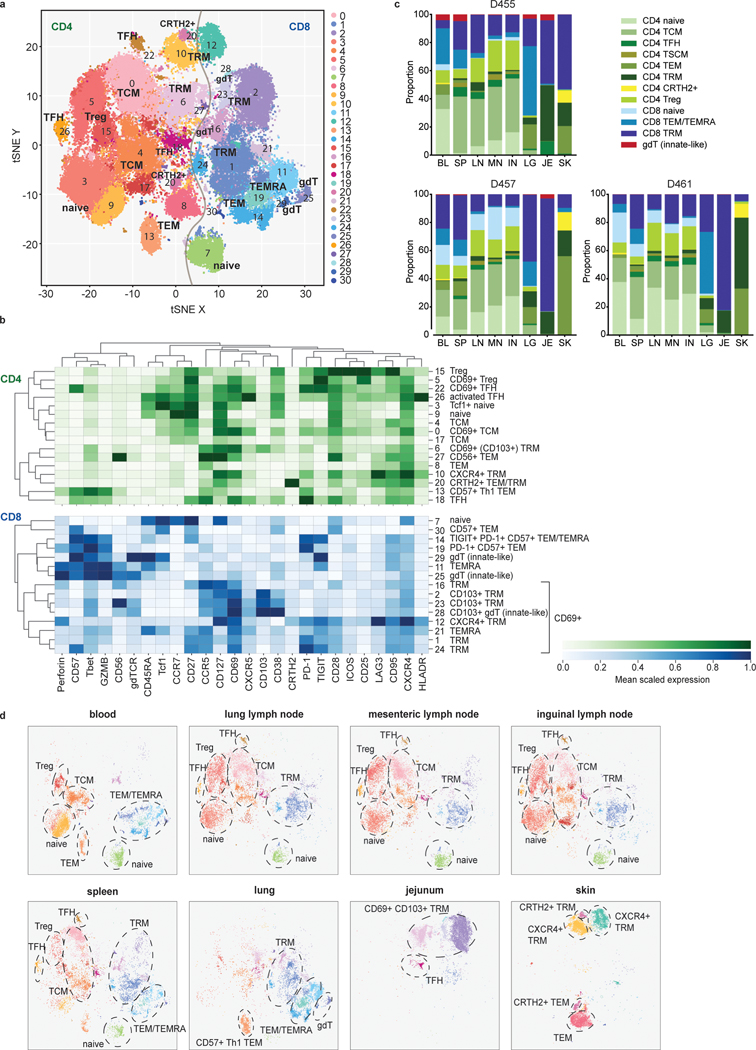
To examine subset composition and phenotypic heterogeneity of T cells maintained across the body, we used a high-dimensional CyTOF panel incorporating multiple markers of T cell differentiation, function, and migration to analyze CD3+T cells obtained from blood and tissues of three donors ages 22, 40, and 70 yrs (Fig. 1, Supplementary Tables 1 and 2). Unsupervised clustering based on marker expression identified 31 clusters, representing heterogeneous populations of CD4+ and CD8+T cell subsets (Fig. 1a, Extended Data Fig. 1a). Subsets included naïve (CCR7+CD45RA+CD95−), central memory T cells (TCM; CCR7+CD45RA−CD28+), effector memory T cells (TEM; CCR7−CD45RA−), terminally-differentiated effector T cells (TEMRA; CCR7−CD45RA+), and TRM (CCR7−CD45RA−CD69+). Functional subsets included T-follicular helper cells (TFH; CD4+CXCR5+PD-1+ICOS+)22, regulatory T cells (Treg; CD4+CD25+CD127−)23, T-helper 1 (Th1) cells defined by the transcription factor T-bet24, and T-helper type 2 (Th2) with enhanced expression of CRTH225. Innate-like T cells were mostly represented by γδ T cells (gdTCR+; Fig. 1a,b).
Figure 1: Site-specific T cell subset distribution in human barrier and lymphoid tissues.
T cells were isolated from blood, spleen, lung lymph node (LN), inguinal lymph node (IN), mesenteric lymph node (MN), lung, skin, and jejunum from three donors, stained with a 37-marker panel (Supplementary Table 2) and analyzed by cytometry by time-of-flight (CyTOF). a, The full complement of CD4+ and CD8+ T cell subsets from blood and 7 tissue sites of three donors, as defined by marker expression (see Extended Data Fig. 1), represented in a t-distributed stochastic neighbor embedding (t-SNE) plot. Cluster numbers correspond to T cell subsets defined in (b). b, Marker expression by CD4+ (top, green) and CD8+ (bottom, blue) T cell clusters in (a) defined by unsupervised clustering. The color intensity of each cell denotes the column-normalized mean scaled expression of each indicated marker within each cluster. c, Stacked bar chart of the proportion of T cell subsets in each site for each of the three donors. d, Composition of T cell subsets stratified by site compiled from three donors, represented as t-SNE plots. Prominent T cell subsets are highlighted by a dashed ellipse for each site. TFH, follicular helper T cell; TRM, tissue-resident memory T cell; gdT, gamma-delta T cell; Treg, regulatory T cell; TCM, central memory T cell; TEMRA, terminally-differentiated effector memory T cell; TEM, effector memory T cell; Th1, type-1 helper T cell; BL, blood; IN, inguinal lymph node; JE, jejunum; LG, lung; LN, lung lymph node; MN, mesenteric lymph node; SK, skin; SP, spleen.
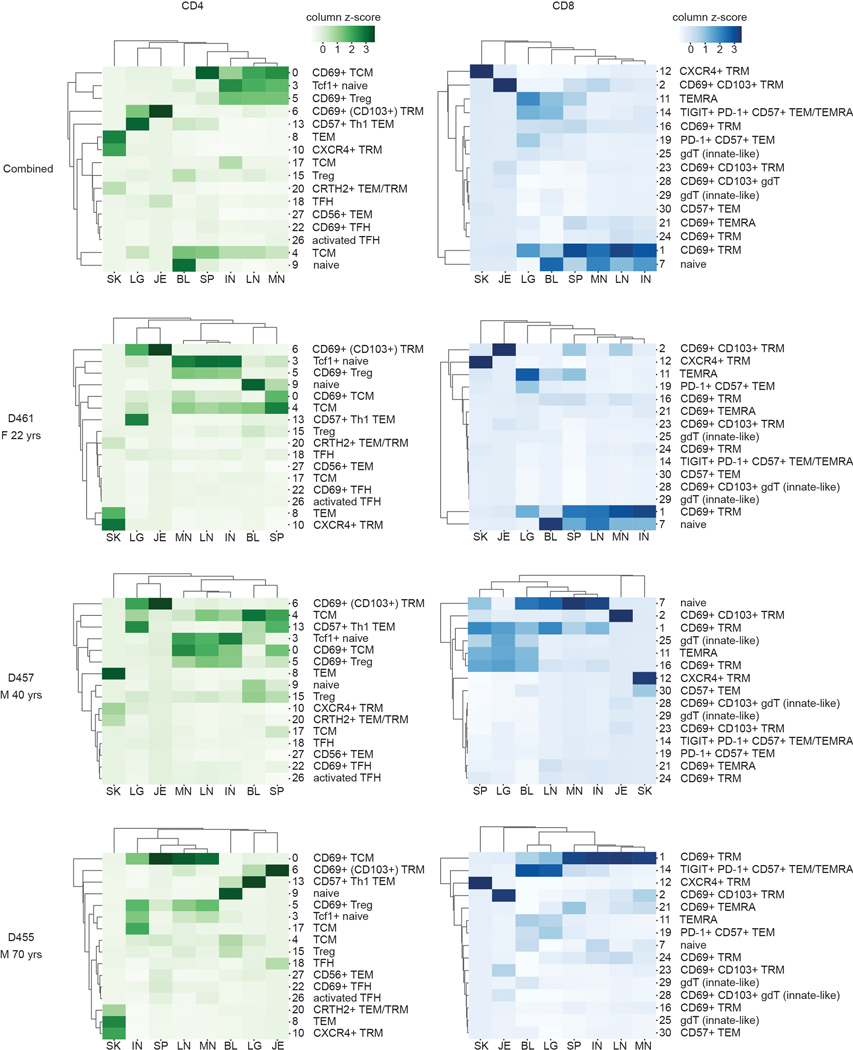
The composition of CD4+ and CD8+T cell subsets was similar between individuals, despite their broad age range (Fig. 1c, Extended Data Fig. 1b). CD4+T cells comprised subsets of naïve, TCM, TFH, Treg, TRM subsets expressing CD69 and to a lesser extent CD103, Th1-like cells expressing T-bet and the senescent marker CD57 (cluster 13) and Th2-like CRTH2+ cells (cluster 20; Fig. 1a–c). CD8+T cells comprised naïve and memory subsets, along with higher frequencies of TEMRA cells and γδ T cells compared to CD4+T cells (Fig. 1a–c). CD8+TEM and TEMRA cells were further subdivided based on differential expression of CD57, inhibitory molecules (PD-1, TIGIT), and cytotoxic mediators (granzyme B, perforin) (Fig. 1a,b). Between donors, the oldest donor had the lowest frequency of naïve CD8+T cells and a distinct TEM/TEMRA population expressing CD57, TIGIT, and PD-1 (cluster 14; Extended Data Fig. 1b,2).
For all donors, the composition and distribution of T cell subsets were site-specific, consistent with previous findings for naïve and memory T cells assessed by flow cytometry7–9,11. However, this high-dimensional profiling revealed which subpopulations were similar between sites and which had site-specific adaptations. Blood contained CD4+ naïve, TCM, TEM, Treg, as well as CD8+ naïve and TEM/TEMRA populations (Fig. 1c,d, Extended Data Fig. 2), while all three lymph node sites contained a distinct composition from blood consisting of mostly CD4+ subsets (naïve TCM, TFH, TRM, and Tregs) and lower frequencies of CD8+ naïve and TRM cells (Fig. 1c,d, Extended Data Fig. 2). The spleen contained subsets found in both blood and lymph nodes along with additional CD8+TEM/TEMRA and TRM populations (Fig. 1c,d, Extended Data Fig. 2). Each barrier site, however, contained a unique composition of T cells compared to all the other sites (Fig. 1c,d, Extended Data Fig. 2). Lungs contained CD4+ and CD8+TRM, distinct CD57+TEM (clusters 13 and 19), TEMRA, and γδ T cells (cluster 25). Jejunum contained predominantly CD69+CD103+TRM, a Tbet+CCR5+TFH population (cluster 18); while skin contained CD4+ and CD8+TRM expressing CXCR4 (clusters 10,12) implicated in skin T cell homing26, TEM (cluster 8), and CRTH2+ Th2- and Tc2-like cells (cluster 20) (Fig. 1d, Extended Data Fig. 1a,2). Together, these results demonstrate that T cells within each barrier tissue exhibit site-specific compositions and TRM with site-specific profiles.
T cell clonal networks differentially involve barrier sites
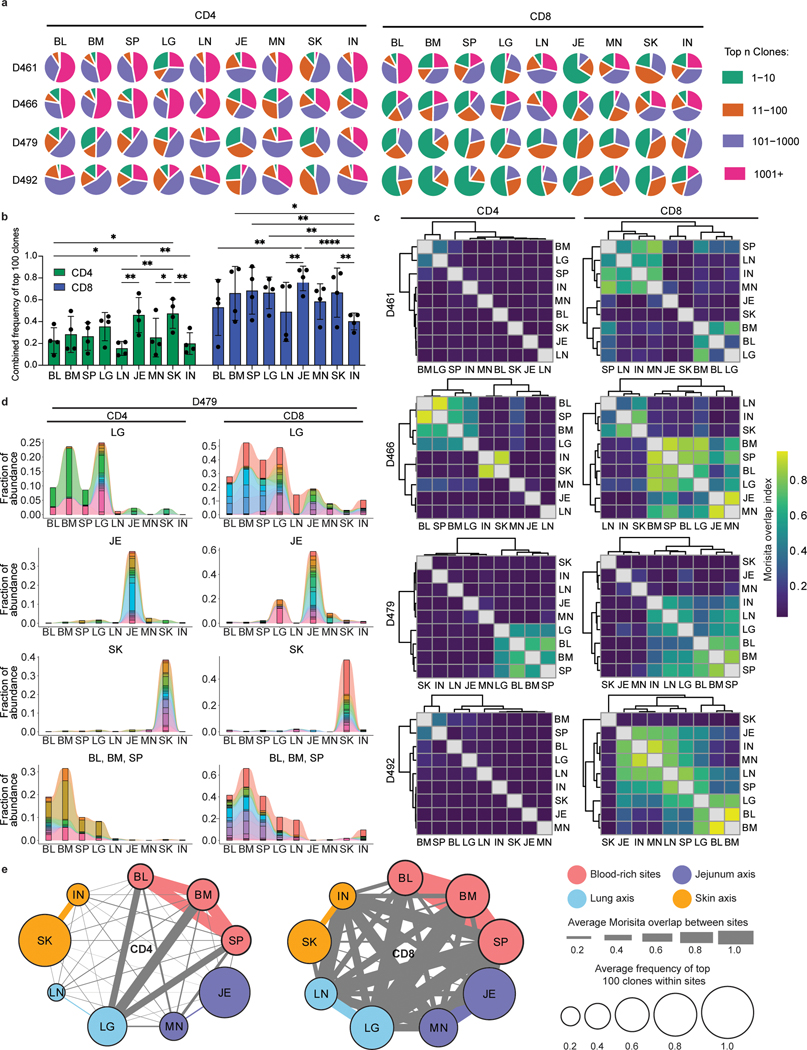
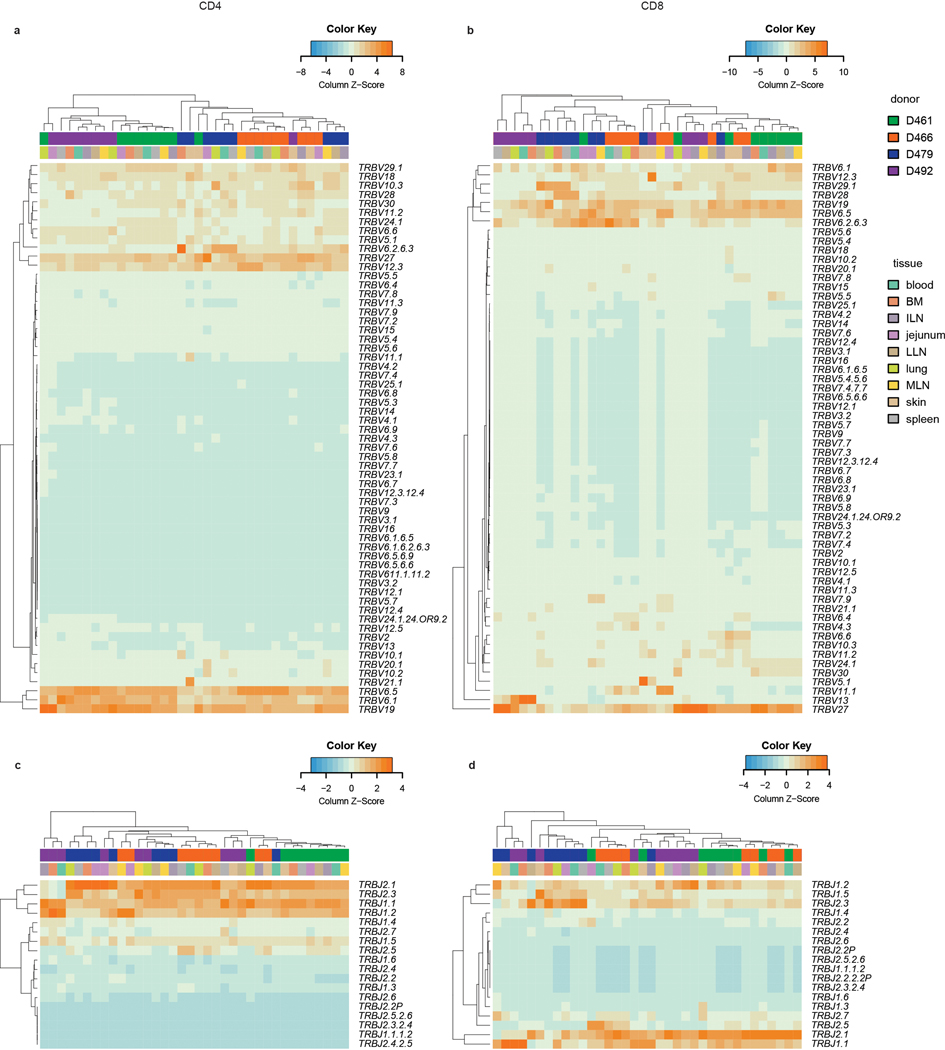
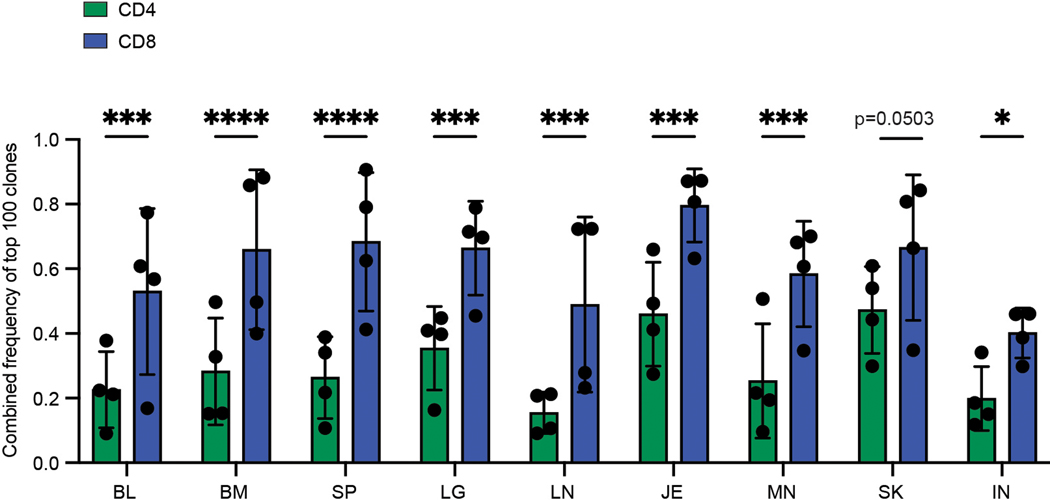
We next sought to evaluate the degree of clonal expansion and overlap of CD4+ and CD8+T cells in barrier sites relative to cells in blood and lymphoid tissues by next generation sequencing (NGS) of genes encoding the CDR3β chain (TCR-seq) (Supplementary Table 1,3,4). TCR-seq from 4 donors showed that CD4+ and CD8+T cells displayed distinct clonal expansion and TRBV and TRBJ gene usage across tissues and donors, with CD8+T cells more clonally expanded than CD4+T cells, consistent with previous studies19,27 (Fig. 2a, Extended Data Fig. 3). To assess potential differences in clonal expansion between sites, we normalized for different sampling depths by calculating the proportion of the total repertoire occupied by the top 100 clones in each site. There was an increase in expanded CD4+ and CD8+T cell clones in the lungs, jejunum, and skin compared to clones in tissue-associated lymph nodes (Fig. 2b, Extended Data Fig. 4). CD8+T cells also exhibited significant clonal expansion in the blood, spleen, and BM compared to CD4+T cells (Fig. 2b), consistent with a proportion of human T cells being widely disseminated19.
Figure 2: Distinct clonal connections define T cells in barrier sites.
CD4+ and CD8+ T cells were isolated from nine tissue sites four individual donors (D461, D466, D479, D492) for TCRB sequencing. a, Pie charts showing relative clonal abundance for CD4+ (left) and CD8+ (right) T cells from each sample showing the proportion of the repertoire occupied by the top 10, 100, 1000, or 1000+ clones. b, Combined frequency of top 100 clones among CD4+ (left, green) and CD8+ (right, blue) T cells. Bar height represents frequencies averaged across four donors. Statistical significance was calculated using two-way ANOVA matching tissue and CD4+/CD8+ subset and comparing tissues within each subset, followed by Tukey’s multiple comparisons test, and indicated by ****, p ≤ 0.0001; ***, p ≤ 0.001; **, p ≤ 0.01; *, p ≤ 0.05. Error bars represent standard deviation (n=4 independent human donors for each tissue-site). For raw data and individual p-values, see source data. c, Morisita overlap index between pairwise cell populations of CD4+ (left) or CD8+ (right) T cells. Color intensity is based on Morisita overlap index. d, Clone tracking plots illustrating overlap of top 20 clones across sites for representative donor D479. Bar height indicates the fraction of the repertoire occupied by the top 20 clones within each tissue site. Each color represents a unique clone. e, Network representation of CD4+ (left) and CD8+ (right) T cell clones in blood, lymphoid, and barrier sites across the body. The diameter of each circle is proportional to the average frequency of the top 100 clones in that tissue; line thickness is proportional to the Morisita overlap index between populations within the two connecting tissue sites; and specific networks of overlap for groups of tissues are indicated by color. BL, blood; BM, bone marrow; IN, inguinal lymph node; JE, jejunum; LG, lung; LN, lung lymph node; MN, mesenteric lymph node; SK, skin; SP, spleen.
T cell clonal distribution and overlap across sites was calculated based on clonal abundance (see Methods). For each donor, there was a broader clonal overlap of CD8+ compared to CD4+T cells across sites (Fig. 2c). Despite some variations between donors, BM, spleen, lung, and blood were sites of extensive clone sharing for CD8+T cells in all donors and for CD4+T cells in 2/4 donors, with the other two donors showing extensive sharing between BM and spleen (Fig. 2c). By contrast, skin and jejunum T cells showed negligible overlap with other sites for CD4+T cells (all donors) and CD8+T cells (3/4 donors), except for overlap with their associated lymph node in some donors (Fig. 2c). A proportion of CD8+T cells in the oldest donor (D492) showed extensive overlap in all sites (Fig. 2c), consistent with the presence of increased TEMRA cells with age —a largely circulating subset19. This overlap analysis reveals that CD4+T cell clones are less disseminated and more site-specific compared to CD8+T cells and that T cells in barrier sites are more clonally segregated from T cells in blood-rich and lymphoid sites.
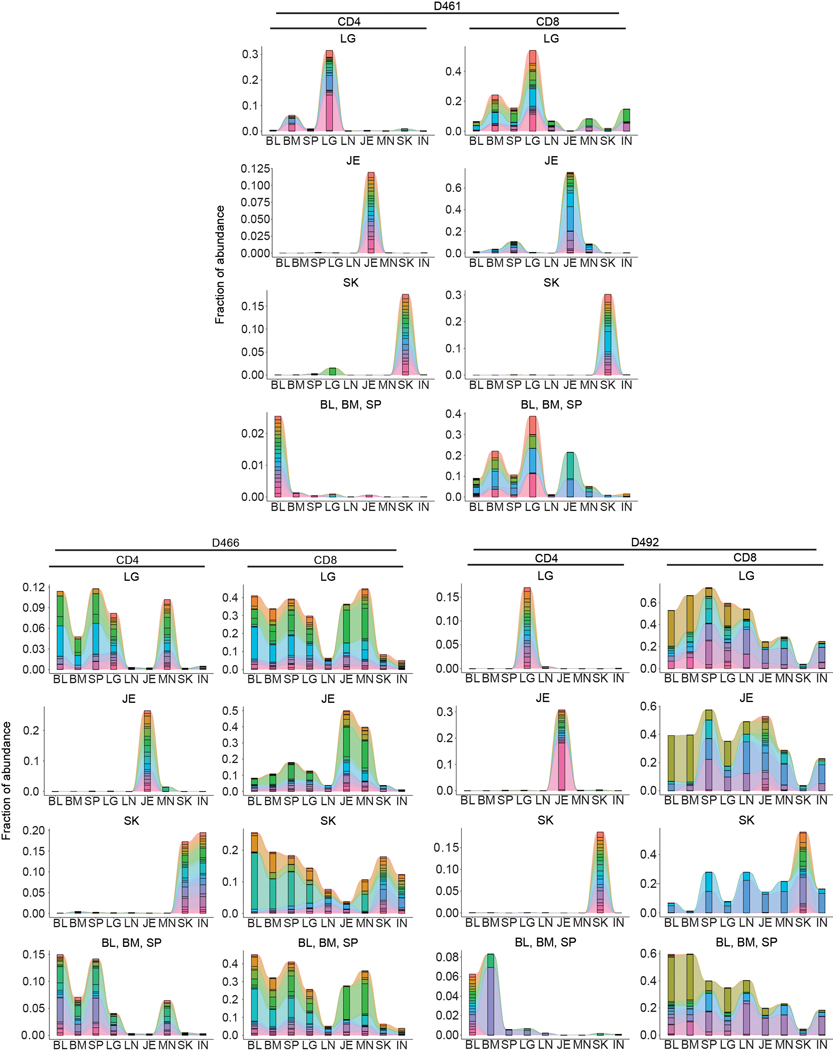
Clone tracking plots of the top 20 clones within barrier or other sites provides additional insight into clonal maintenance and/or migration. Abundant CD4+ and CD8+T cell clones identified within barrier sites are mostly confined to that site for jejunum and skin, while clones abundant in the lungs are shared with lymphoid and blood-rich sites (Fig. 2c,d, Extended Data Fig. 5). The most expanded clones in the jejunum or skin exhibited variable overlap with other sites in some donors, which was not associated with age or EBV/CMV serostatus (Fig. 2d, Extended Data Fig. 5; Supplementary Table 1). By integrating clonal overlap and expansion, we generated a model of CD4+ and CD8+ clonal networks across human organs and circulation showing major connections among clones in lungs, blood, BM, and spleen, relative segregation of clones in skin and intestines together with their associated lymph node, and greater dissemination of CD8+ compared to CD4+T cells (Fig. 2e).
Site-specific profiles for barrier site TRM by scRNA-seq
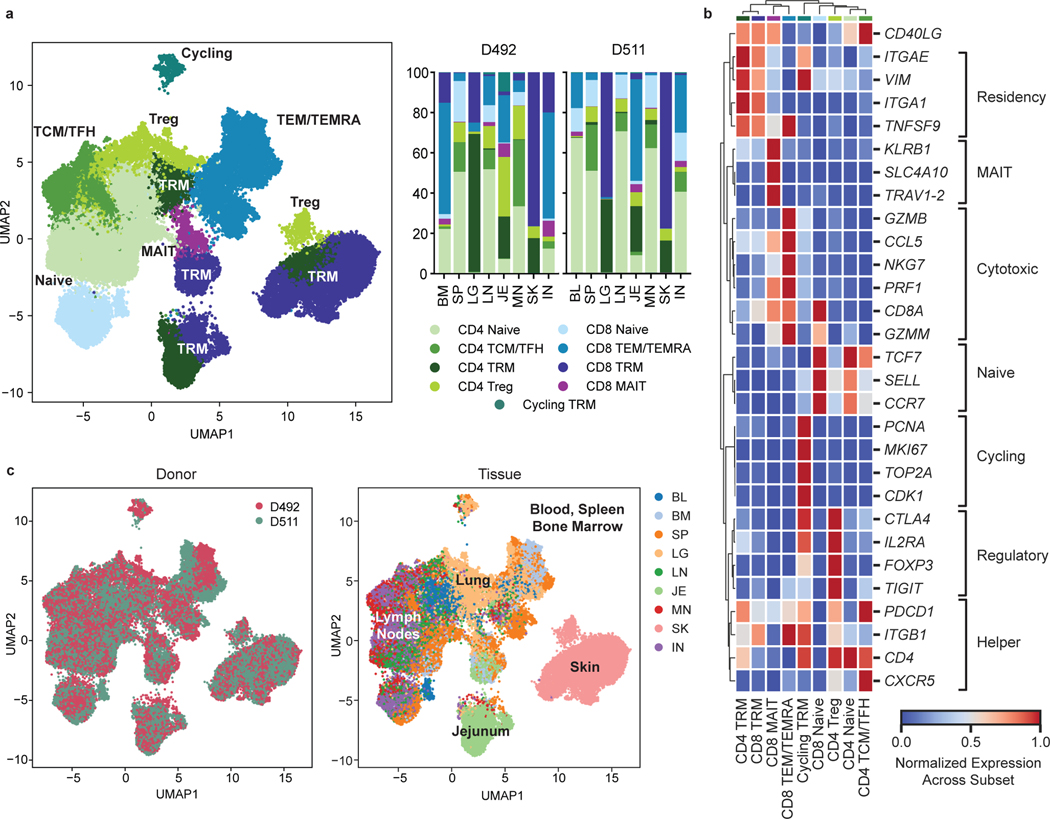
To integrate analysis of tissue specificity with clonal origin, we performed single-cell transcriptome profiling by scRNA-seq with paired TCR (TRB and TRA) sequencing of CD3+T cells from 8 sites of two donors (Supplementary Table 1). Clustering analysis based on highly variable genes resulted in 43 clusters that were manually grouped by average expression of marker genes into eight known T cell subsets for CD4+ and CD8+ lineages (Fig. 3a,b, Extended Data Fig. 6, Supplementary Tables 5,6). Subset composition and their tissue distribution were consistent between the two donors (Fig. 3a,c). Naïve CD4+ and CD8+T cells expressing the stem cell factor TCF728, SELL, and CCR7 localized primarily in the blood, spleen, BM, and lymph nodes (Fig. 3a,b). CD4+ subsets included Tregs expressing FOXP3, TIGIT, CTLA4, and IL2RA in the lung, skin, and lymph nodes, and TCM/TFH subsets expressing TCF7, PDCD1 and CXCR5 in lymph nodes and spleen (Fig. 3a,b, Extended Data Fig. 6). TEM/TEMRA (CCL5, NKG7, GZMB, PRF1) cells were enriched in blood-rich sites and lungs and were predominantly CD8+ (Fig. 3a,b, Extended Data Fig. 6). Clusters dominated by CD8+ mucosal-associated invariant T (MAIT) cells identified by expression of TRAV1–2, SLC4A10, and KLRB129 were primarily localized to blood, BM, spleen, and lung (Fig. 3a,b, Extended Data Fig. 6). CD4+ and CD8+TRM defined by expression of residency markers (ITGA1, ITGAE, VIM, CXCR6)8,10 localized primarily in the lung, jejunum, and skin (Fig. 3a,b, Extended Data Fig. 6). A distinct cluster designated “Cycling TRM” expressed TRM and proliferation-associated genes (MKI67, PCNA, TOP2A, CDK1) and was enriched in the lungs (Fig. 3a,b, Extended Data Fig. 6). Overall, the tissue distribution of T cell subsets was similar to that identified in different donors by CyTOF (Fig. 1) and confirms that distinct clustering of T cells in barrier sites is largely due to TRM.
Figure 3: Single-cell transcriptome profiling reveals subset and tissue-specific signatures for T cells.
Total (CD3+) T cells were isolated from 9 sites of two donors for 5’single cell RNA sequencing (scRNA-seq, see Methods). a, UMAP embedding of scRNA-seq data based on highly variable genes and integrated across donor, colored by T cell subset (left). The proportion of T cell subsets in each tissue for each donor is depicted in a stacked bar chart (right). b, Clustered heatmap displaying normalized log-transformed expression of selected markers that were used to inform cluster and subset annotation. Marker genes are annotated by functional groups. c, UMAP embedding as in (a) colored by donor (left) or tissue (right) of origin. TCM, central memory T cell; TFH, follicular helper T cell; TRM, tissue-resident memory T cell; Treg, regulatory T cell; TEM, effector memory T cell; TEMRA, terminally-differentiated effector memory T cell; MAIT, mucosal-associated invariant T cell; BL, blood; IN, inguinal lymph node; JE, jejunum; LG, lung; LN, lung lymph node; MN, mesenteric lymph node; SK, skin; SP, spleen.
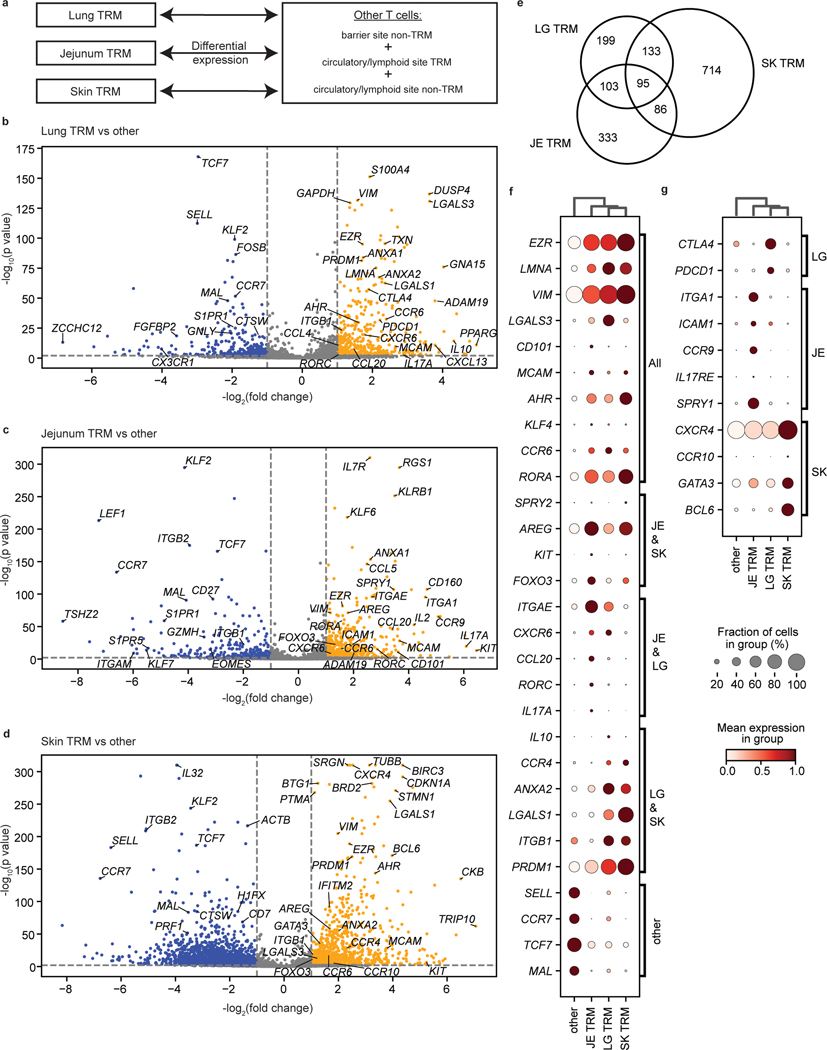
We examined the basis for TRM segregation by differential expression analysis between barrier site-specific TRM and other T cells from all sites (Fig. 4a, Supplementary Table 7), revealing upregulated expression of tissue-associated genes specific to one, two, or all barrier sites (Fig. 4b–g). Compared to nonresident T cells, TRM in all barrier sites downregulate genes associated with naïve T cells and quiescence including SELL, CCR7, and TCF7, along with MAL, a gene encoding a T cell maturation factor consistently expressed by naïve T cells (Fig. 4b–f). Conversely, T cells from all three barrier sites upregulated genes associated with TRM, tissue signatures, and residency in non-lymphoid sites8,10, including cell matrix and adhesion molecules (EZR, VIM, LGALS3), transcription factors (AHR, KLF4), chemokine receptors (CCR6), and the inhibitory marker CD101 (Fig. 4, Extended Data Fig. 7a,b).
Figure 4: TRM in barrier sites exhibit site-specific gene signatures.
a, Schematic depicting differential expression between barrier site TRM and other T cells. b-d, Volcano plots showing the differential expression of TRM in the indicated barrier site compared to nonresident T cells in all sites and TRM in non-barrier sites. Genes enriched in lung (b), jejunum (c), and skin (d) TRM are shown. Significantly upregulated genes (p < 0.05, lfc > 1) are depicted in yellow, and significantly downregulated genes (p < 0.05, lfc < −1) are depicted in blue. Selected genes of interest were annotated. e, Venn diagram showing the overlap of significantly upregulated genes (p < 0.05, lfc > 1) between jejunum, skin, and lung TRM. f, g, Differential expression of key markers of tissue residency and genes shared between sites (f) or specific to single barrier sites (g). The fraction of cells within the group that expressed any amount of the marker is displayed as dot size, and increased color intensity of the dots indicates higher row-normalized mean expression level across cells from these groups. Cells are grouped as belonging to skin-, jejunum-, or lung-TRM, or other (representing nonresident T cells in all sites and TRM in non-barrier sites). JE, jejunum; LG, lung; SK, skin. Statistical significance was calculated using a two-sided Wilcoxon with tie correction, followed by a Benjamini-Hochberg adjustment for multiple comparisons.
We also found upregulation of genes specifically shared between pairs of barrier sites (Fig. 4f, Extended Data Fig. 7a,b). In both jejunum and skin TRM, we found upregulation of AREG associated with tissue maintenance and repair30, as well as KIT and FOXO3 involved in T cell differentiation and memory formation31,32 (Fig. 4f). TRM in jejunum and lung expressed CXCR6, shown to regulate TRM localization33, and Th17 signature genes (CCL20, RORA, RORC, IL17A)34, while TRM in lung and skin upregulated matrix and adhesion genes (ANXA2, LGALS1, ITGB1) and PRDM1 encoding transcription factor Blimp 1 associated with tissue residency35 (Fig. 4f). These results show that signatures for residency, localization, and function are shared by one or more barrier sites and are distinct from lymphoid sites.
We also identified site-specific gene expression profile for each barrier site for which skin had the highest number of site-specific DEGs (Fig. 4e). Lung TRM expressed genes associated with immune regulation (CTLA4, IL10, PDCD1) (Fig. 4b,f,g), while jejunum TRM upregulated genes encoding epithelial-, immune cell-, and collagen-binding integrins (ITGAE, ITGA1, ICAM1)8,10 and the gut-associated chemokine receptor CCR936 (Fig. 4c,f,g). By contrast, skin TRM upregulated genes encoding chemokine receptors (CCR4, CCR10, CXCR4) with roles in skin homing26,37,38, and the Th2 transcription factor GATA3 (Fig. 4d,g). These site-specific profiles are consistent with the CyTOF results showing upregulated CD103 expression by gut TRM, and enhanced CXCR4 and CRTH2 expression by skin T cells (Fig. 1). Many of the genes driving barrier TRM signatures were expressed in both CD4+ and CD8+TRM (Extended Data Fig. 7), indicating that site-specific signatures were not due to lineage composition.
Given the large number of DEGs unique to skin, we investigated potential heterogeneity among skin TRM. While skin TRM all exhibit elevated expression GATA3 relative to its expression in other sites (Fig. 4, Extended Data Fig. 6), there was variable expression of other functional markers and transcription factors (Extended Data Fig. 8). We identified six skin TRM sub-clusters associated with different functions, including Th1-like (TBX21), Th17-like (RORA), and cytotoxic (GZMA, GZMK, NKG7, PRF1, IFNG) profiles (Extended Data Fig. 8b,c, Supplementary Table 8). These results are consistent with heterogeneity of human skin T cells found in previous studies18,39, and show that integration of multiple gene expression signatures may define functional capacity.
Disseminated TEM clones and site-specific TRM clones
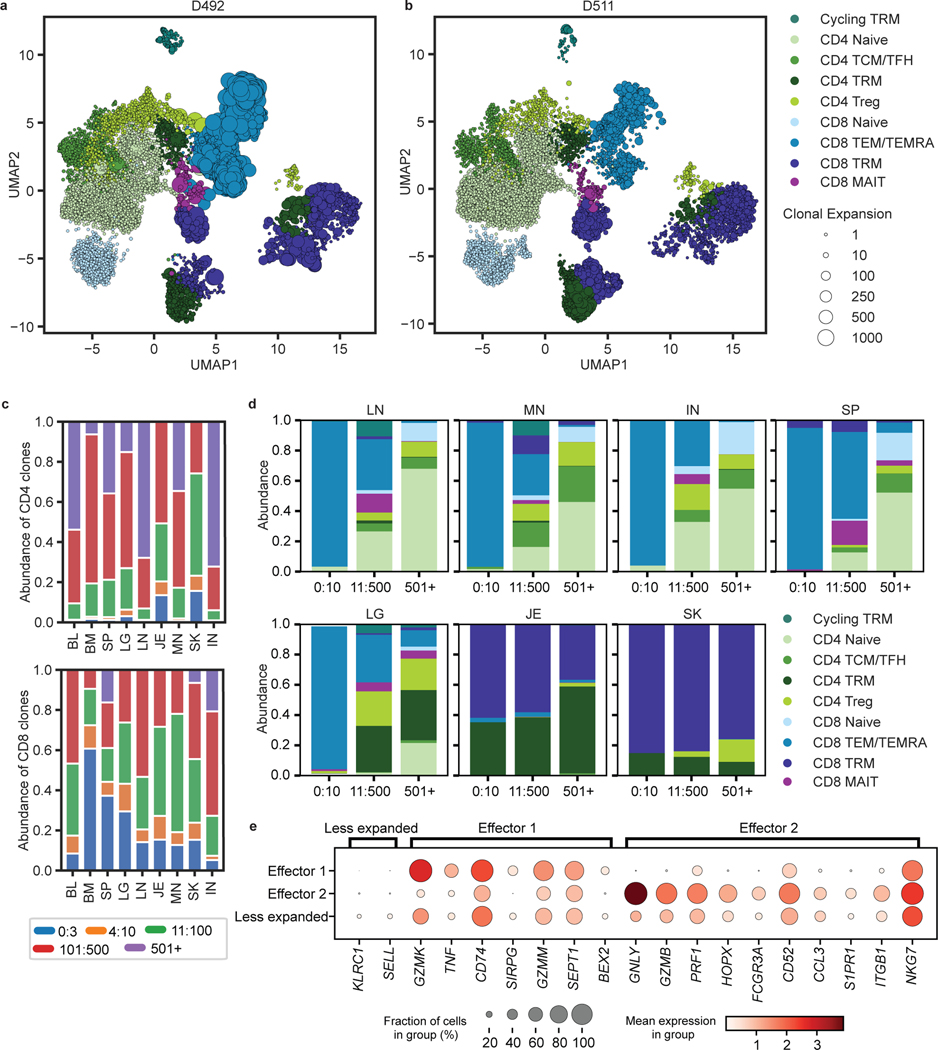
By sequencing TRA and TRB transcripts for each T cell from the scRNA-seq analysis above, we defined TCR clones expressing paired α and β chains. We mapped the TCR clone information to the UMAP to visualize clone size and distribution across subsets and tissues for each donor (Fig. 5a,b). TCRs within CD8+MAIT clusters contained known TRAV1–2, TRAJ12/20/33, TRBV6/20 sequences (Extended Data Fig. 6, see Methods). Consistent with results from TCR-seq (Fig. 2), CD8+T cell clones were more expanded than CD4+T cell clones (Fig. 5a–c). CD8+T cells contained large expansions across most sites, while expanded CD4+ clones were observed in the jejunum, skin, and to a lesser degree, the lung (Fig. 5c). Individualized and subsampled data mirror these observations across donors (Supplementary Table 9). In terms of subset delineation, the top 10 most expanded clones within the lymphoid sites and lung were comprised of TEM/TEMRA subsets, while those within the jejunum and skin were mostly TRM (Fig. 5d). By contrast, clones with the lowest level of clonal expansion (i.e., the most diverse) were largely naïve (CD4+ and CD8+), CD4+TCM, and CD4+Treg in the lymphoid organs (Fig. 5d). In barrier sites, the majority of clones were TRM, including highly expanded and less expanded clones (Fig. 5d).
Figure 5: Differential clonal expansion associated with T cell subset, tissue, and functional capacity.
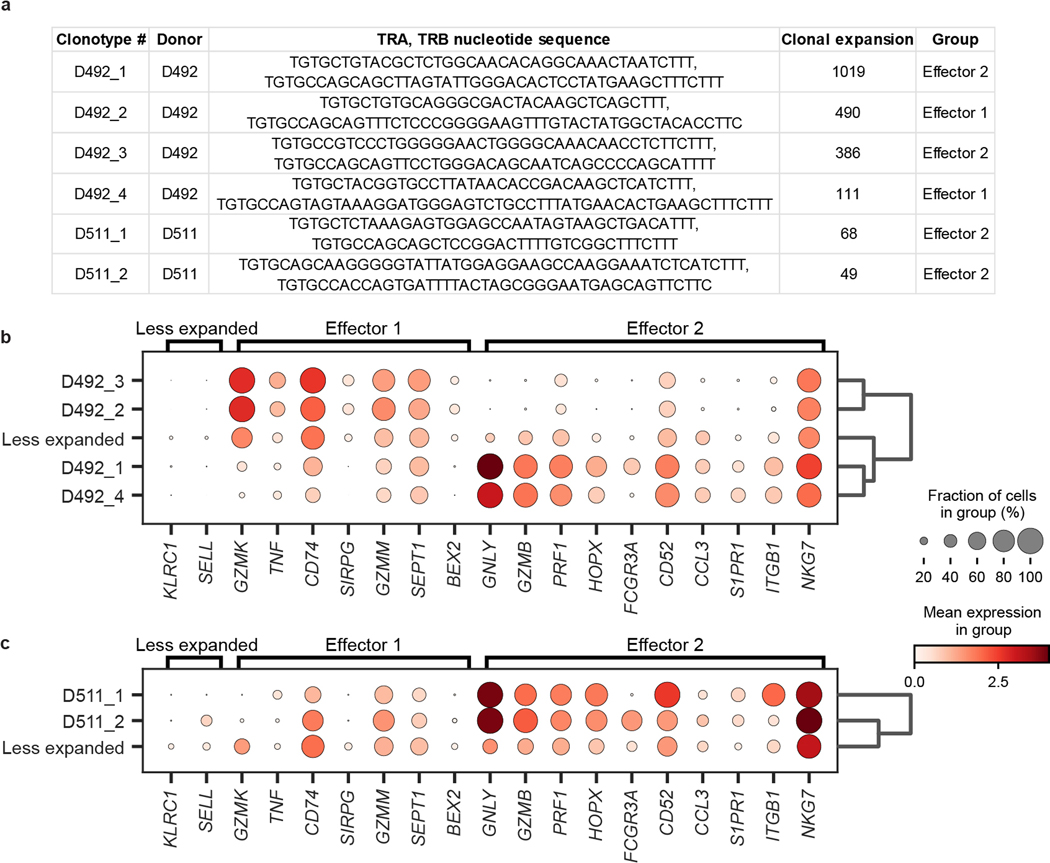
a, b, UMAP embedding of scRNA-seq of T cells successfully mapped to TCR clone information, colored by subset, for donor D492 (a) and D511 (b). Clonal expansion, defined by shared CDR3 nucleotide sequence, V and J gene usage, is depicted by marker size. c, Clonal abundance of the top 3, 10, 100, and 500 clones within the CD4+ (top) and CD8+ (bottom) clusters in each tissue site. d, Subset composition of the top 10, 500, and 500+ clones in the indicated tissue sites averaged across both donors. e, Differential expression of key markers by unexpanded vs. expanded TEM/TEMRA cells in both donors shown as a dot plot, grouped by effector function signatures. The fraction of cells within the group that expressed any amount of the marker is displayed as dot size, and increased color intensity of the dots indicates higher mean expression level across cells from these groups. Cells are grouped as belonging to expanded (>45 clones) TEM/TEMRAs displaying distinct effector function labeled “Effector 1” and “Effector 2”, and less expanded (< 5 clones) TEM/TEMRA. BL, blood; BM, bone marrow; IN, inguinal lymph node; JE, jejunum; LG, lung; LN, lung lymph node; MN, mesenteric lymph node; SK, skin; SP, spleen.
In both donors, a small set of TEM/TEMRA clones made up the largest clonal expansions in lymphoid and circulating sites (Fig. 5a,b,d, Extended Data Fig. 9). To determine whether the extent of clonal expansion was associated with distinct functions, we compared gene expression of hyperexpanded TEM/TEMRA clones to less expanded TEM/TEMRA clones using hierarchical clustering on highly variable genes, revealing two distinct effector profiles for expanded clones (Extended Data Fig. 9). One profile included genes for cytotoxic mediators (GZMK, GZMM), chemokine receptors (CD74), and cytokines (TNF), while the second profile included elevated expression of genes for multiple cytotoxic mediators (GNLY, GZMB, PRF1, NKG7) (Fig. 5e, Supplementary Table 10). Together, these results show that expanded T cell populations within differentiated TEM and TEMRA cells exhibit different functional capacities.
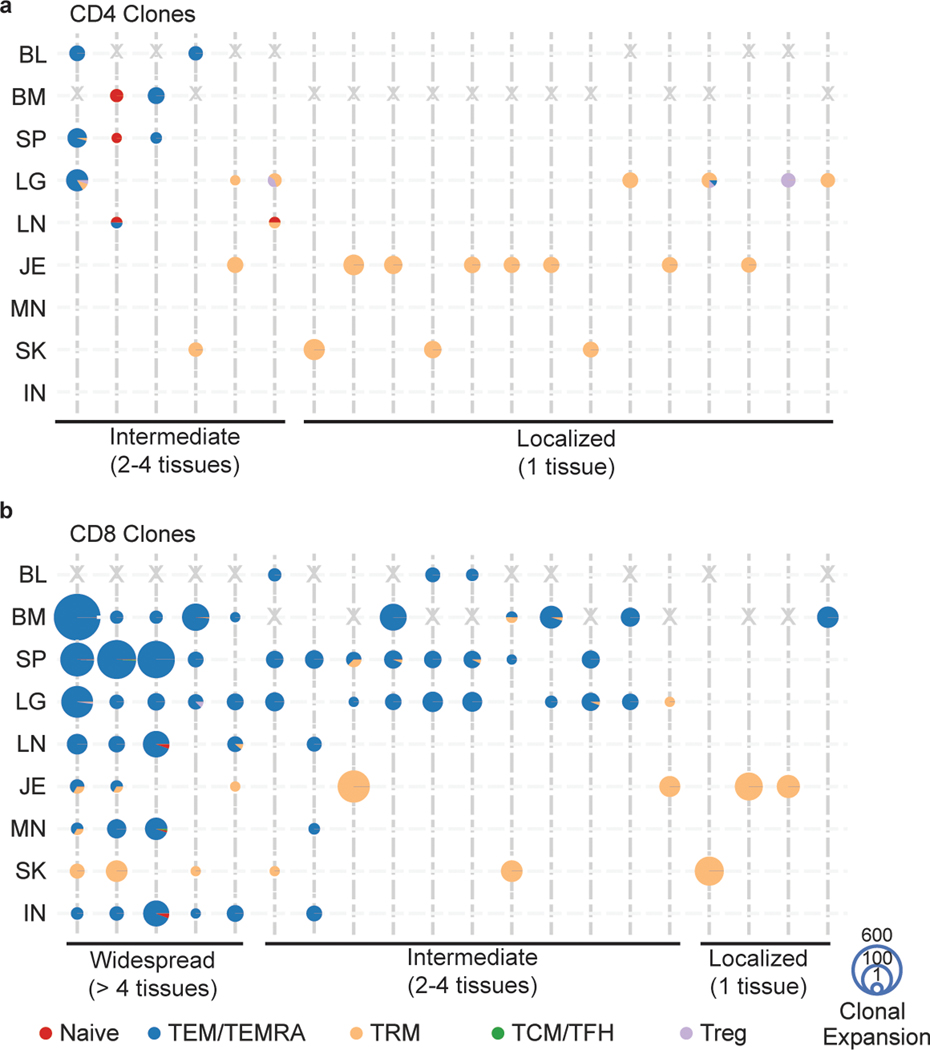
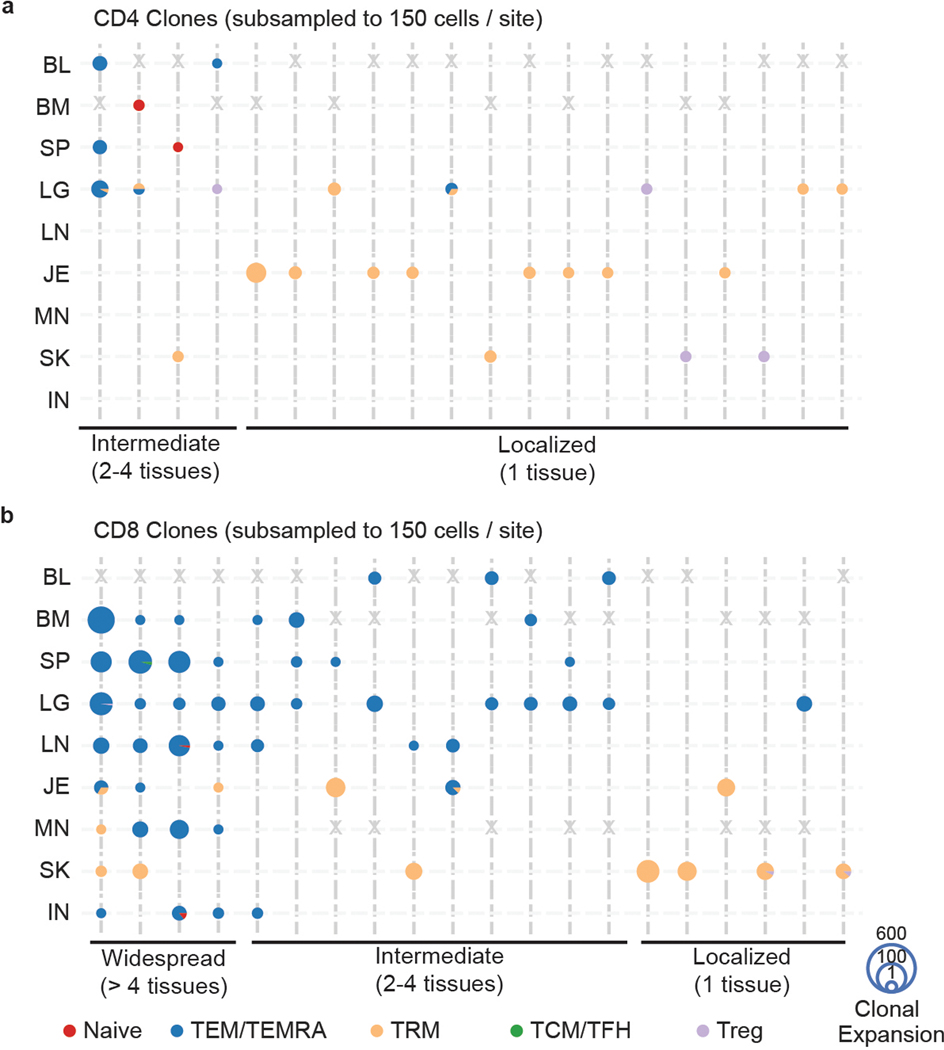
Lastly, we assessed the extent of sharing of expanded clones across tissues. We tracked the most expanded CD4+ and CD8+T cell clones across sites based on all the cells in each sample, or from a subsampled population of the same number of cells to control for sampling biases; both methods yielded similar findings (Fig. 6, Extended Data Fig. 10, see Methods). The majority of CD4+T cell clones identified by paired TRB and TRA sequences were TRM localized to single barrier sites (Fig. 6a, Extended Data Fig. 10a). Several CD4+TEM clones overlapped across blood-rich sites (blood, spleen, lung) and a naïve T cell clone was shared among lymphoid sites, though we found no CD4+ clones shared by >3 sites (Fig. 6a, Extended Data Fig. 10a). By contrast, numerous CD8+TEM/TEMRA clones were detected across multiple sites including two clones detected in all eight sites (Fig. 6b, Extended Data Fig. 10b). Some of these disseminated clones overlapped with TRM clones in barrier or lymph node sites (Fig. 6b, Extended Data Fig. 10b). Notably, localized CD8+ clones were TRM within single barrier sites, similar to localized CD4+ clones. Our findings showing clonal segregation of barrier site TRM are consistent with results from single-chain analysis of a greater number of clones in Fig. 2 and are therefore robust to different sampling depths.
Figure 6: TEM/TEMRA clones are disseminated while TRM clones exhibit localized expansions.
a, b, Tissue distribution, T cell subset, and clonal expansion of CD4+ (a) and CD8+ (b) clones. CD4+ and CD8+ clones were defined by expression of CD4 or CD8A within cells sharing the same clone. Individual clones are represented across vertical lines, and pie charts are used to show the subset makeup of T cells that share that clonotype within each tissue. Size of each pie chart depicts the clonal expansion of each clone within that tissue site. The top 20 highly expanded CD4+ and CD8+ clones for both donors were selected, and grouped by their tissue distribution (widespread, intermediate, or localized). Gray X’s mark the spaces where tissues were not sampled for one donor. BL, blood; BM, bone marrow; IN, inguinal lymph node; JE, jejunum; LG, lung; LN, lung lymph node; MN, mesenteric lymph node; SK, skin; SP, spleen.
DISCUSSION
In this study, we integrated single-cell protein, transcriptome, and TCR profiling for a comprehensive analysis of T cell immunity across human barrier sites, lymphoid organs, and circulation. We demonstrate that barrier sites contain predominant TRM populations that are transcriptionally and clonally segregated from memory T cells in lymphoid sites and blood; barrier TRM express core TRM signatures, along with site-specific functional and homing properties. By contrast, memory T cells in blood-rich and lymphoid organs are largely TEM or TEMRA cells, which share similar transcriptome and clonal profiles across sites. Our findings reveal that T cell immunity to previously encountered antigens are maintained via distinct networks—locally through tissue-adapted resident T cells and systemically through networks of disseminated clones that are differentiated for robust effector functions.
Our study extends and unifies the scope and depth of previous studies of human TRM by integrating multiple single-cell approaches in diverse barrier and lymphoid sites within an individual. Among all barrier TRM, we identified a core residency signature consistent with previously described TRM signatures8,10, along with site-specific profiles involving expression of homing receptors, functional molecules, and transcription factors. Lung TRM express higher levels of regulatory genes (CTLA4 and IL10) compared to other sites, jejunum TRM express increased levels of TRM markers, such as CD103, along with gut homing receptors, while skin TRM upregulated skin homing receptors (CCR4, CCR10, CXCR4)38 and specific transcription factors (GATA3, BCL6)40. These results indicate that maintenance within a barrier site requires tissue interactions and responses to local factors, which may, in turn affect function. The extent to which other immune cells in these sites acquire tissue adaptations remains to be determined. Recent single-cell profiling efforts for human immune cells combined with advanced computational tools for annotation initiated by our group and others41 will enable a precise dissection of the effects of tissue, lineage, and age on resident immune cells.
Barrier site T cells exhibit distinct effector capacities depending on the tissue and subset. Both lung and intestinal T cells were enriched in Th17 gene expression profiles compared to other sites consistent with previous functional studies34,42, while skin TRM cells expressed genes associated with Th2, Th17, and to a lesser extent Th1 profiles consistent with their known heterogeneity39. Defining tissue T cell functions in steady state can provide insights into the origin of protective or pathological responses in tissues. For example, skin T cells can manifest as a Th17 response in cutaneous candidiasis43 and psoriasis44, consistent with a TRM-mediated response. Conversely, Th1 and cytotoxic responses are associated with rejection of facial transplants45, suggesting potential infiltration from circulation. In the lung where TRM are Th1-like or regulatory, an overactive Th2 response promotes allergic airway disease46, suggesting aberrant TRM, consistent with mouse studies47. In this way, prolonged alteration of tissue environments can promote pathological TRM functions.
We identified the clonal organization of T cells across sites using bulk and single-cell approaches. TRM clones in lungs, skin, and intestines exhibiting tissue-specific gene expression were largely confined to each barrier site, while the overlapping clones were largely TEM and TEMRA cells. Clonal segregation in the barrier supports tissue-driven generation of TRM; T cells that home to these sites during infection develop TRM in situ as suggested from recent mouse studies48. The presence of circulating TEM clones that overlapped with TRM supports this model in humans. Moreover, human memory T cells specific for respiratory pathogens, such as influenza and SARS-CoV-2, exhibit TRM phenotypes in the lung, and TEM in other sites14,15,49. Tissue-segregated TRM may derive from previous exposures months to years prior. We previously found that human infant intestines contain TRM phenotype cells50, and memory T cells can even be found in fetal intestines51, suggesting an early origin for intestinal TRM development.
The most highly expanded clones comprised circulating CD8+TEM/TEMRA subsets with effector and cytolytic function that were widely disseminated across sites, especially in blood, spleen, BM, and lung. These disseminated clones likely play roles in controlling systemic and persisting pathogens, such as CMV and EBV, as we previously showed that CMV-specific T cells are largely TEM and TEMRA with few TRM14. Interestingly, these highly expanded clones displayed two types of effector profiles, differing in cytolytic capacity and cytokine production, suggesting that widely dispersed clones play important and broader roles in immunosurveillance through tissues.
Our results have important implications for generation and monitoring of protective immunity within barrier tissues. The clonal and phenotypic enrichment of TRM within the barrier tissue suggests that vaccinations targeted to barrier and mucosal sites may be more effective in generating durable immunity at the site of infection. In mice, site-specific vaccination promotes lung TRM, as shown with live-attenuated influenza or pertussis vaccines administered intranasally52,53. The difficulty in detecting expanded TRM clones in the blood further suggests that monitoring barrier immunity may require sampling specific sites. Additionally, unique barrier TRM signatures can inform future design of tissue-targeted immune modulation.
METHODS
Human samples
Human organ tissues were obtained from deceased (brain-dead) organ donors at the time of organ acquisition for clinical lifesaving transplantation through an approved protocol and material transfer agreement with LiveOnNY, the organ procurement organization for the New York metropolitan area, as previously described8,9,20,54. Donors were free of cancer and seronegative for hepatitis B, hepatitis C, and HIV. A list of donors from which tissues were used in this study, including donor characteristics and the assays performed with samples from each donor, is presented in Supplementary Table 1. This study does not qualify as human subjects research, as confirmed by the Columbia University IRB, as tissues samples were obtained from deceased individuals.
Isolation of single-cell suspensions from tissue samples
Tissue samples were maintained in cold saline or media and transported to the laboratory within 2–4 hrs of organ procurement. Tissue processing protocols were adapted from protocols previously described14,20,54, and processed in a timely manner, resulting in high yields of live leukocytes. Briefly, mononuclear cells were isolated from the blood and BM samples by density centrifugation using Lymphocyte Separation Medium (Corning, cat# 25-072-CI) or Ficoll-Paque PLUS (GE, cat# 17-1440-03)55. Spleen was processed using mechanical dissociation, followed by density centrifugation, as above and described56. Lung, jejunum, and lymph node samples were processed using mechanical and enzymatic digestion, followed by density centrifugation, as previously described8,14,20,57,58. Skin samples obtained from the abdomen near the incision site were carefully washed using cell culture medium, cleaned by scraping the subcutaneous fat with a scalpel, and washed with cell culture medium again. Then, skin samples were cut into pieces of approximately 4mm in width and digested overnight at 37°C using the Human Skin Dissociation Kit (Miltenyi). The following day, mononuclear cells were washed and isolated. For samples undergoing T cell receptor sequencing or cytometry by time of flight, single cell suspensions were then cultured at 37°C overnight to recover cleaved surface proteins. This was not done for samples undergoing single-cell RNA sequencing.
Cytometry by time-of-flight (CyTOF)
Single cell suspensions from each tissue site were labeled with viability marker – Rh103 intercalator. Then, cells from each tissue were barcoded using a unique combinatorial barcode of CD45 antibodies conjugated to monoisotopic cisplatin. Barcoded cells from each tissue site were pooled, stained with a panel of cell surface marker antibodies, and then washed, fixed, and permeabilized (eBioscience Transcription Factor Staining Kit, cat# 00-5532-00). Afterwards, pooled cells were stained with additional antibodies against intracellular targets. Samples were then washed and incubated in 0.125nM Ir intercalator (Fluidigm) diluted in PBS containing 2% formaldehyde. A complete list of antibodies is included in Supplementary Table 2.
Data acquisition was performed by the Human Immune Monitoring Core at Icahn School of Medicine at Mount Sinai. Prior to data acquisition, samples were washed once with PBS, washed once with de-ionized water, and resuspended at a concentration of 1 million cells/mL in deionized water containing a 1:20 dilution of EQ 4 Element Beads (Fluidigm, cat# 201078). Samples were acquired on a CyTOF2 (Fluidigm) equipped with a SuperSampler fluidics system (Victorian Airships) at an event rate of <500 events/second. Data were normalized using bead-based normalization in the CyTOF software and uploaded to Cytobank for initial data processing.
For analysis, the data were first gated to exclude normalization beads, dead cells, doublets, and debris. Cells derived from each tissue were then deconvolved by Boolean gating on CD45 barcodes, leaving DNA+CD45+Rh103− live single cells for subsequent analysis. FCS express software was used to gate CD3+ cells, which were then inputted to downstream analysis and visualization performed using custom Python script. Specifically, dimensionality reduction was performed using Python implementation openTSNE v0.3.11 to generate tSNE (t-Distributed Stochastic Neighbor Embedding) plots. Then, clustering was performed using Python implementation PhenoGraph v1.5.2. Heatmaps of normalized and scaled marker expression were generated using the mean scaled expression with samples clustered by unsupervised hierarchical clustering using clustermap function of data visualization library Seaborn v0.9.1.
Fluorescence-activated cell sorting (FACS)
For FACS, cells were stained while protected from light using antibodies listed in Supplementary Table 3. Briefly, cells were washed with FACS-buffer (PBS with 2% heat-inactivated FBS), then resuspended in Human TruStain FcX (BioLegend, cat# 422302), followed by surface staining with fluorochrome-conjugated antibodies in FACS-buffer (20 min. at 25°C). Cells were sorted using BD Influx Cell Sorter using the strategies shown in Supplementary Fig. 1. T lymphocytes for single-cell RNA sequencing were sorted into sterile filtered heat-inactivated FBS. T lymphocytes for high-throughput bulk TCR sequencing were sorted directly into cell lysis solution (Qiagen, cat# 158906).
High-throughput T Cell Receptor (TCR) sequencing
For TCR-seq, DNA was isolated from FACS-sorted T cells using the Gentra Puregene Kit (Qiagen, cat# 159667). Input DNA and numbers of replicates per sample are listed in Supplementary Table 4. Targeted PCR was used for amplification of TRB sequences from genomic DNA, using a cocktail of forward primers specific for framework region 2 (FR2) sequences of 23 TRBV subgroups (gene families), and reverse primer in 13 TRBJ regions; primers were adapted from the BIOMED2 primer series (Supplementary Table 11; IDT)59. Libraries were sequenced using an Illumina MiSeq in the Human Immunology Core Facility at the University of Pennsylvania. 2×300 bp paired end kits were used for all experiments (Illumina MiSeq Reagent Kit v3, 600 cycle, Illumina, cat# MS102-3003).
Raw reads are first processed using pRESTO v0.7.0 and filtered as previously described11,19,60. Briefly, sequences are trimmed of poor-quality bases, paired reads are aligned into full length contiguous sequences, short sequences are filtered out, bases with low quality scores are replaced with Ns, and any sequence containing more than 10 such bases is removed from further analysis. Filtered sequences were further processed by ImmuneDB v0.29.961–63 with identical TRBV and TRBJ gene segments and CDR3 amino acid sequences grouped into clones19,64. We required that a unique sequence be detected at least twice (within an individual) to be designated a clone, to reduce over estimation of clones due to sequencing errors. Clones with only 1 sequence copy were discarded.
For analysis of TRBV and TRBJ gene usage, heatmap visualization was generated using CalcSegmentUsage function of VDJtools v1.2.161. Principal component analysis was visualized using the factoextra package v1.0.7 in R65. For clonal overlap analysis, using the immunarch v0.6.7 package in R. Clonality was calculated using the “top” method of the repClonality function, with user-defined breaks at 1:10, 11:100, 101:1000, and 1000+, and quantified for statistical analysis by abundance of the top 100 clones. Overlap analysis was performed using the “morisita” method of the repOverlap function, which calculates extent of sharing based on clonal abundance and is robust across different sample sizes66,67. This index was then averaged across donors and plotted in a clustermap using heatmap2. Network representations of this data were generated using the network and ggnet2 functions of the GGally v2.1.2 and network v1.17.1 packages in R, with edge weights of the average morisita overlap, and node sizes of clonal expansion (measured by the proportion of the repertoire represented within the top 100 clones). Clone tracking plots were generated using the top clones from the jejunum, skin, lung, and blood rich sites (spleen, blood, bone marrow), using the TrackClonotypes function.
scRNA-seq workflow and analysis
Using the Chromium Next GEM single cell 5’ Reagent kit v2 (10X Genomics), sorted T cells from each tissue site were loaded onto separate lanes of the Next GEM Chromium Controller (10X Genomics) for encapsulation (target recovery of 5,000 cells for each sample). Single cell libraries were constructed using manufacturer’s protocols. Libraries were sequenced on a NovaSeq 6000 (Illumina) platform. TCR sequencing libraries for TCRαβ were prepared with the V(D)J enrichment kit from 10X Genomics, following manufacturer’s protocols. These TCR libraries were sequenced on a NextSeq 500 (Illumina) platform. Pseudoalignment of the scRNA-seq reads to the GRCh38/Gencode v24 transcriptome was performed using kallisto v0.45.2 in “BUS” mode68,69. A raw count matrix was generated using bustools v0.40.070and filtered for high-confidence cell-associated barcodes using the EmptyDrops algorithm71. The scTCR-Seq data was uploaded to the 10x Genomics cloud-based analysis framework CellRanger pipeline v6.0.1 to define clonotypes, which are based on CDR3 nucleotide sequences of both TCR alpha and beta chains. Single Cell TCR sequencing libraries were aligned to the vdj_GRCh38_alts_ensembl-5.0.0 reference using Single Cell V(D)J R2-only chemistry and quantified. Using the CellRanger pipeline, clonotypes associated with invariant T cell populations (MAIT cells; mucosal-associated invariant T cells) were identified by TRA gene usage (TRAV1-2, and any of TRAJ33, TRAJ20, TRAJ12), TRB gene usage (TRBV20 or TRBV6) and previously published CDR3 junction amino acid sequences for human MAIT T cells72.
Count matrices were then processed in the Python scanpy package v1.9.0. Events between 1000 and 25000 total counts, between 700 and 4000 genes, and less than 25% mitochondrial counts were kept. Highly variable genes (HVGs) were calculated using a minimum dispersion of 0.25 and batches for tissue and donor. The gene expressions were scaled without zero center and a max value of 10, and the regress_out function was used to reduce the influence of the total counts per cell on the PCA. The top 40 PCs were used to calculate the 10 nearest neighbors, which was used to generate a UMAP and run Leiden clustering, with scanpy package default settings. Differential gene expression for the Leiden clusters was calculated using the Wilcoxon mode and tie correction in the rank_genes_groups function. To exclude non-T cell contaminants, clusters identified without CD3E or PTPRC (CD45) expression, or enrichment of one of the following lineage markers: CD19, CD1A, SDC1, FCGR1A, CD14 were removed. HVGs were then recalculated on cleaned T cell dataset, and scaling, regressing out total counts, and PCA were calculated as described above. The PCA was harmonized by donor using the Python harmonypy package, then nearest neighbors and UMAP were calculated as described above.
Leiden clustering was performed at a resolution of 3, differential expression was calculated, and clusters enriched for specific CD4+ and CD8+T cell subsets were annotated. To investigate barrier-site TRM signatures, TRM from jejunum, skin, and lung were each compared to all other T cells. Groups were subsampled to equal cell counts, then the count matrices were down sampled to equal total counts. To eliminate noise, differential expression was run using only the top 7000 highly variable genes using rank_genes_groups with the same parameters above. Volcano plots were created using the bioinfokit package v2.0.8. Overlap of significantly upregulated genes (log-fold change > 1, adjusted p-value < 0.05) was plotted using the matplotlib_venn package v0.11.6. Clustermaps of the shared significantly differentially expressed genes with a minimum log-fold change of 2 and clustermaps of the top 30 differentially expressed genes unique to each site were created using the rank_genes_groups_heatmap function in scanpy. Dot plots of selected genes were created using the rank_genes_groups_dotplot function in scanpy. UMAP calculation, sub-clustering, and differential expression across Leiden clusters of skin TRM were all performed similarly to above, with Leiden clustering run at a resolution of 0.3.
Clonal expansion was defined by cells sharing CDR3 nucleotide sequences, V gene, and J gene usage. CD4+ and CD8+T cell clonal expansion were calculated using the frequencies of clones across each tissue site. Expansion over donor was calculated using the frequencies of all clones across each donor. To identify unique transcriptional signatures of hyperexpanded TEM/TEMRAs (> 45 cells sharing a clonotype), donors were analyzed separately. After isolating hyperexpanded and less expanded (< 5 cells sharing a clonotype) TEM/TEMRAs from each donor, the top 1000 highly variable genes were identified, and PCA was rerun. A dendrogram was generated using 30 PCs, the ward method, and optimal ordering, and we identified two clusters of hyperexpanded clones. These groups and less expanded TEM/TEMRAs were subsampled, the count matrices down sampled, and differential expression was performed with the settings described above. Genes were selected as the intersection of differentially expressed genes across both donors. Dot plots of selected genes were created using the rank_genes_groups_dotplot function in scanpy.
Because there was no overlap between CD4+ and CD8+T cell clones, as expected19 and to account for CD4+ and CD8+T cells that may have been misclustered, clones dominated by expression of either CD4 or CD8A (> 2-fold enrichment of CD4 or CD8A) were labelled as CD4+ or CD8+ associated clones for analysis of clonal overlap across tissues from the total number of cells in each site. Similarly, because MAIT cells are clonally restricted, cells co-clustering with CD8+MAIT T cells, but with clones lacking MAIT evidence by TRA, TRB, or CDR3 junction (see above), were reannotated as CD8 TEM/TEMRA for clonal overlap analysis. Where appropriate, analyses were repeated with a subsampled fraction of the dataset (150 CD4+ or CD8+T cells per site) to normalize cell numbers across sites. Clonality for each subsampled site was calculated as described14,19: given a clone, denoted x, frequency denoted p(x), and total set size of unique clones denoted L, .
Statistical analysis
Statistical analysis was performed using Prism software (GraphPad v8.4.3). Results are shown with SD unless otherwise indicated. Statistical significance was determined using two-way repeated measure ANOVA with multiple comparison testing using Tukey’s multiple comparison test. P-values below 0.05 were considered as statistically significant. For all figures, **** denotes p ≤ 0.0001, *** denotes p ≤ 0.001, ** denotes p ≤ 0.01, and * denotes p ≤ 0.05. Statistical significance for differential expression analysis was calculated using a two-sided Wilcoxon with tie correction, followed by a Benjamini-Hochberg adjustment for multiple comparisons.
All statistical analyses were performed using distinct samples.
DATA AVAILABILITY
High-throughput TCR sequence data generated in this study are available in NCBI SRA with the accession code PRJNA861254. Paired scRNA and scTCR data generated in this study are available in NCBI GEO with the accession code GSE206507.
CODE AVAILABILITY
Code for the analysis of CyTOF data is available at https://github.com/donnafarberlab/CyTOFScript
Extended Data
Extended Data Fig. 1. T cell subsets across sites as measured by CyTOF.
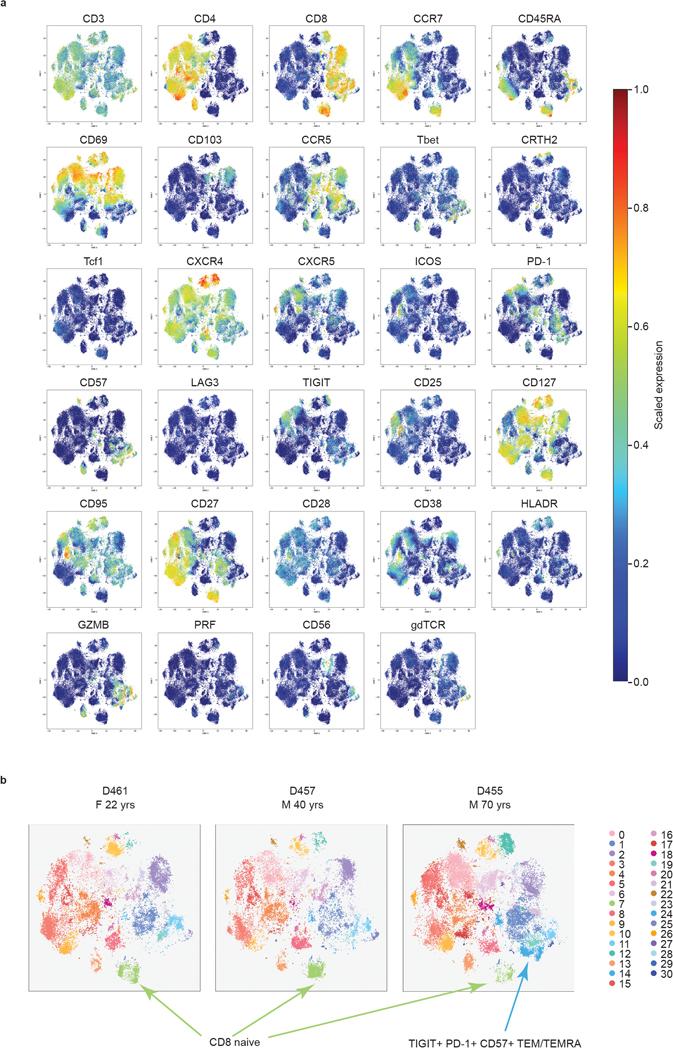
(a) Scaled marker expression by T cells across sites as measured by CyTOF. Expression of the indicated surface and intracellular markers, as measured by CyTOF, used for unsupervised hierarchical clustering of T cells across tissue sites in Figure 1. Color intensity of individual cells denotes scaled expression of the indicated marker. (b) CyTOF analysis of T cells in circulation and in lymphoid and barrier sites shown in a t-SNE plot as in Fig. 1a stratified by individual donors. Arrows indicate clusters that differ between the younger and older donors. TEM, effector memory T cell; TEMRA, terminally-differentiated effector memory T cell.
Extended Data Fig. 2. T cell subset distribution across tissues and between donors.
Heatmaps illustrating frequency of CD4+ (a) and CD8+ (b) T cell subsets present in each tissue site for all three donors combined and for each individual donor. Color intensity of each cell is based on column z-score values. M, male; F, female; TFH, follicular helper T cell; TRM, tissue-resident memory T cell; gdT, gamma-delta T cell; Treg, regulatory T cell; TCM, central memory T cell; TEMRA, terminally-differentiated effector memory T cell; TEM, effector memory T cell; Th1, type-1 helper T cell; BL, blood; IN, inguinal lymph node; JE, jejunum; LG, lung; LN, lung lymph node; MN, mesenteric lymph node; SK, skin; SP, spleen.
Extended Data Fig. 3. TRBV and TRBJ gene usage of CD4+ and CD8+ T cell clones across multiple tissue sites and donors.
Heat maps show TRBV usage by site and donor for CD4+ T cells (a) and CD8+ T cells (b) and TRBJ usage by site and donor for CD4+ T cells (c) and CD8+ T cells (d). Donor and tissue are indicated by color bars above each heatmap. Color intensity of each cell is based on column z-score and indicated by the color key accompanying each heatmap. Each unique clone is counted once per donor.
Extended Data Fig. 4. Clonal expansion of CD4+ and CD8+ T cells across sites.
Combined frequency of top 100 clones among CD4+ and CD8+ T cells from nine tissue sites. The height of each bar represents mean frequencies averaged across four donors. Statistical significance was calculated using two-way ANOVA matching tissue and CD4+/CD8+ subset and comparing each subset with the other subset in that tissue, followed by Tukey’s multiple comparisons test and indicated by ****, p ≤ 0.0001; ***, p ≤ 0.001; *, p ≤ 0.05. Error bars represent standard deviation. (n=4 independent human donors from each site). For raw data and individual p-values, see source data.
Extended Data Fig. 5. Clone tracking plots for individual donors.
Clone tracking plots illustrating overlap of top 20 clones within tissues or tissue grouping across nine tissue sites from donors D461 (top), D466 (bottom left), and D492 (bottom right), as presented in Figure 2. Height of each bar indicates fraction of the top 20 clones within each tissue site. Each color represents a unique clone tracked across all tissue sites.
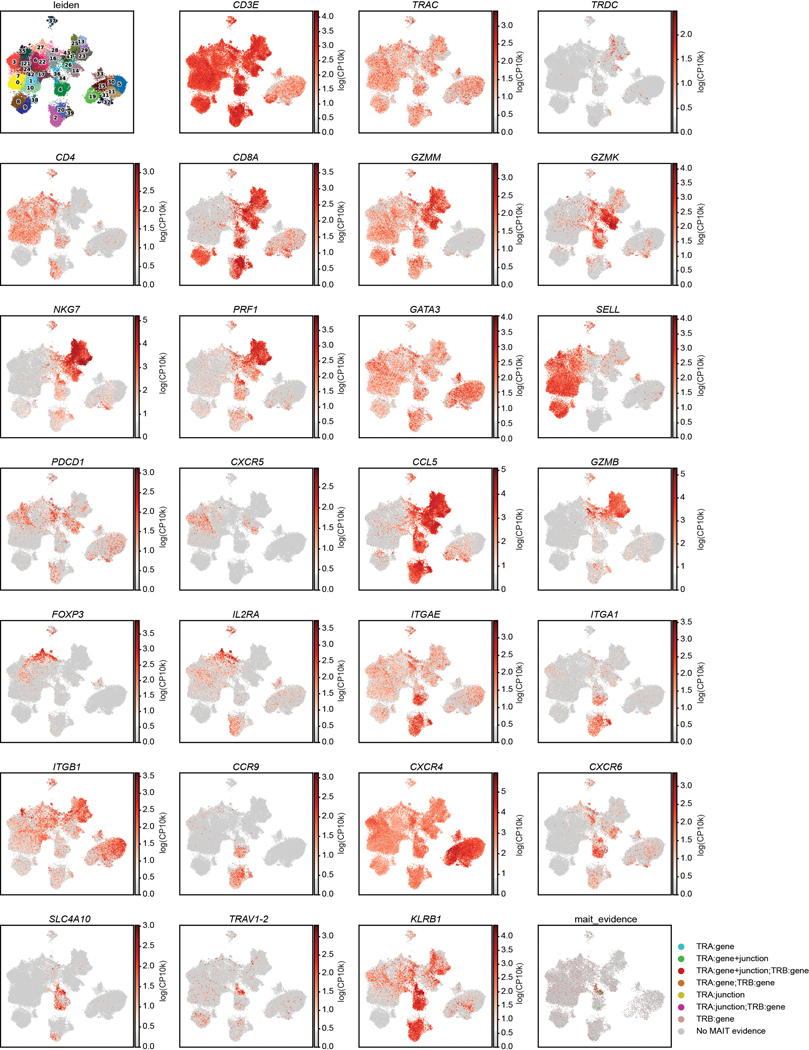
Extended Data Fig. 6. Scaled gene expression by T cells as measured by scRNA-seq.
UMAP embeddings as in Fig. 3 colored by Leiden clusters (top left), expression of selected gene markers as indicated which were used in annotation of clusters (Rows 1–7), and by MAIT evidence (bottom right plot). Color intensity on the gene expression plots is based on scaled log (normalized count per ten thousand (CP10k)+1) for each marker. MAIT evidence indicates whether scTCR-Seq revealed TRA gene usage, TRB gene usage, CDR3 sequence (junction) aligned to a database of known MAIT clones, a combination of these factors, or none (No MAIT evidence) (see Methods). Events lacking paired scTCR data are not plotted.
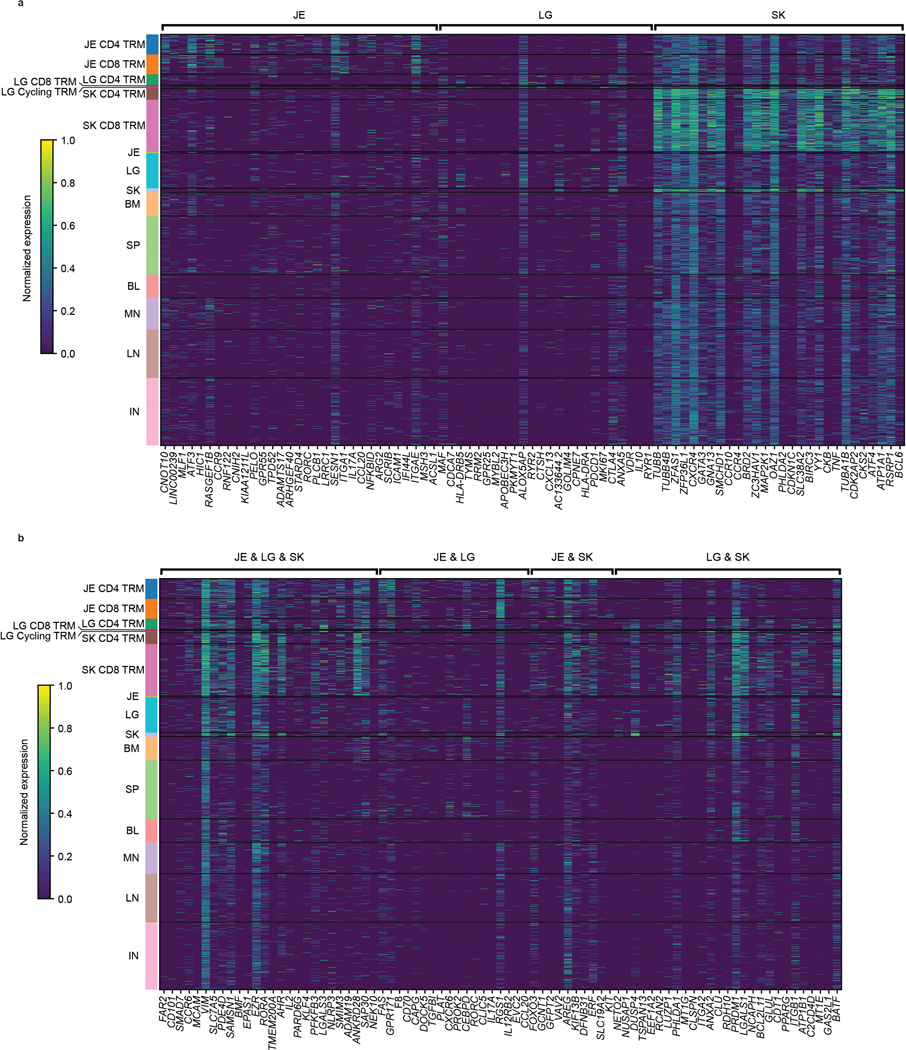
Extended Data Fig. 7. Expression of top shared and unique genes in barrier site-specific signatures.
(a, b) Heatmaps depicting top 10–25 and selected differentially expressed protein coding genes (p-value < 0.05, log-fold change > 2) in barrier TRM cells versus nonresident T cells across all tissues of both donors. Statistical significance was calculated using a two-sided Wilcoxon with tie correction, followed by a Benjamini-Hochberg adjustment for multiple comparisons. Genes are grouped by their differential expression being unique to (a) or shared between (b) barrier sites. Intensity represents column-normalized log (normalized count per ten thousand (CP10k)+1). Cells are grouped by their tissue site of origin and cell type: CD4 TRM, CD8 TRM, Cycling TRM, or other (including both all cells from non-barrier sites and non-TRM from barrier sites). TRM, tissue-resident memory T cell; BL, blood; BM, bone marrow; IN, inguinal lymph node; JE, jejunum; LG, lung; LN, lung lymph node; MN, mesenteric lymph node; SK, skin; SP, spleen.
Extended Data Fig. 8. Transcriptional heterogeneity of skin TRM.
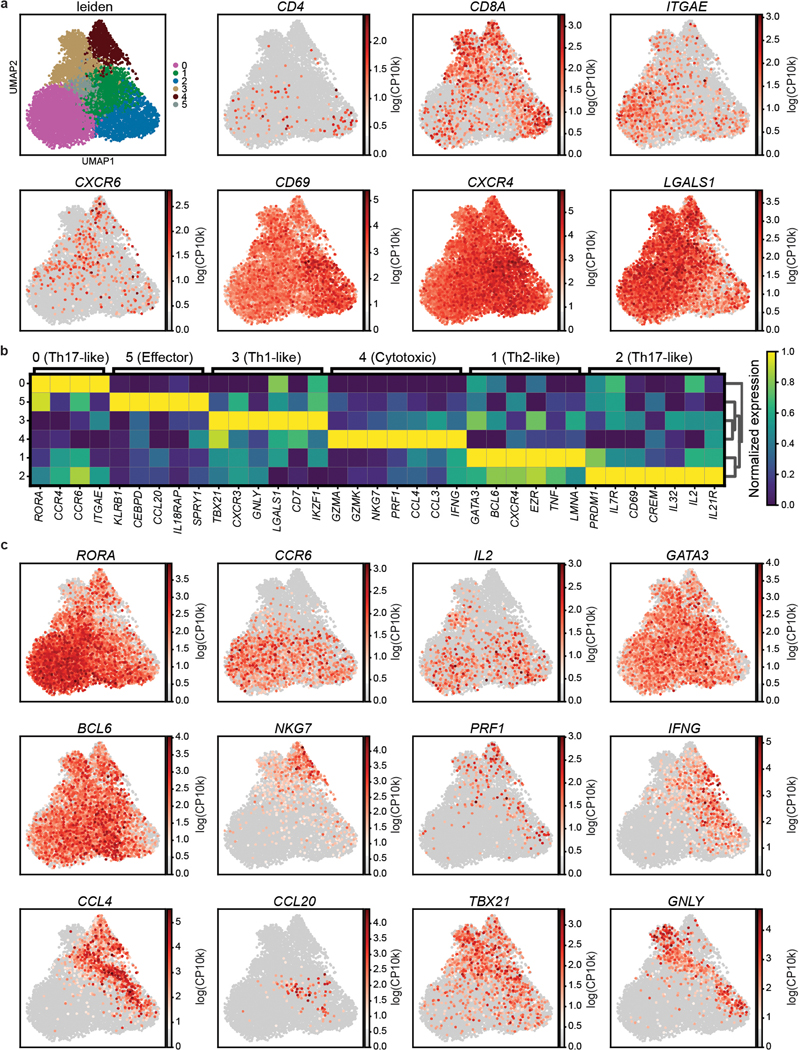
(a) UMAP embedding of skin TRM colored by Leiden cluster (top left), or gene expression. Color intensity of individual cells is based on scaled log (normalized count per ten thousand (CP10k)+1) of the indicated markers. (b) Heatmap depicting average expression of genes associated with T cell function upregulated (p-value < 0.05, log-fold change > 0.3) in each Leiden cluster. Intensity represents the mean column-normalized expression for the indicated gene. Statistical significance was calculated using a two-sided Wilcoxon with tie correction, followed by a Benjamini-Hochberg adjustment for multiple comparisons. (c) UMAP embeddings of skin TRM colored by expression of differentially expressed genes, as in (a).
Extended Data Fig. 9. Effector function of expanded vs. unexpanded TEM/TEMRA clones.
(a) Table of expanded TEM/TEMRA clonotypes (>45 clonal cells) with their donor of origin, CDR3 nucleotide sequence for TRA and TRB, clonal expansion, and grouped effector function. (b, c) Dot plots depicting the differential expression of key markers by less expanded vs. expanded TEM/TEMRA cells from D492 (b) and D511 (c), grouped by effector function signatures “Effector 1” and “Effector 2”. The fraction of cells comprising expanded unique clones and collective less expanded clones that expressed any amount of the marker is displayed as dot size, and increased color intensity of the dots indicates higher mean expression level across cells from these groups. For each donor, expanded (>45 clones) TEM/TEMRA populations of the same clone are labeled uniquely, while less expanded (< 5 clones) TEM/TEMRA clones are grouped together.
Extended Data Fig. 10. Clonal connections across tissues and subsets determined by normalizing cell numbers across sites.
To control for cell number differences across tissues for each donor, we picked a random selection of 150 CD4+ and CD8+ T cells for each sample and mapped the clonal connections across tissues and subsets as in Fig. 6 on the top 20 clones. a, b, Tissue distribution, T cell subset, and clonal expansion of CD4+ (a) and CD8+ (b) clones. CD4+ and CD8+ clones were defined by expression of CD4 or CD8A within cells sharing the same clone. Individual clones are represented across vertical lines, and pie charts are used to show the subset makeup of T cells that share that clonotype within each tissue. Size of each pie chart depicts the clonal expansion of each clone within that tissue site. The clones are grouped by their tissue distribution patterns (widespread, intermediate, or localized). Gray X’s mark the spaces where tissues were not sampled for one donor, or samples below the subset threshold (CD8+ MN in one donor only). TEM, effector memory T cell; TEMRA, terminally-differentiated effector memory T cell; TRM, tissue-resident memory T cell; TCM, central memory T cell; TFH, follicular helper T cell; Treg, regulatory T cell; BL, blood; BM, bone marrow; IN, inguinal lymph node; JE, jejunum; LG, lung; LN, lung lymph node; MN, mesenteric lymph node; SK, skin; SP, spleen.
Supplementary Material
Abbreviations:
- TRM
tissue-resident memory T cell
- TCM
central memory T cell
- TEM
effector memory T cell
- TEMRA
terminally-differentiated effector memory T cell
- CyTOF
cytometry by time-of-flight
- TCR
T cell receptor
- TCR-seq
high-throughput TCR gene sequencing
- scRNA-seq
single-cell RNA sequencing
- NGS
next generation sequencing
REFERENCES
- 1.Masopust D. & Soerens AG Tissue-Resident T Cells and Other Resident Leukocytes. Annu Rev Immunol 37, 521–546 (2019). [DOI] [PMC free article] [PubMed] [Google Scholar]
- 2.Szabo PA, Miron M. & Farber DL Location, location, location: Tissue resident memory T cells in mice and humans. Sci Immunol 4, eaas9673. (2019). [DOI] [PMC free article] [PubMed] [Google Scholar]
- 3.Paik DH & Farber DL Influenza infection fortifies local lymph nodes to promote lung-resident heterosubtypic immunity. J Exp Med 218, e20200218 (2021). [DOI] [PMC free article] [PubMed] [Google Scholar]
- 4.Beura LK, Mitchell JS, Thompson EA, Schenkel JM, Mohammed J, Wijeyesinghe S, Fonseca R, Burbach BJ, Hickman HD, Vezys V, Fife BT & Masopust D. Intravital mucosal imaging of CD8(+) resident memory T cells shows tissue-autonomous recall responses that amplify secondary memory. Nat Immunol 19, 173–182 (2018). [DOI] [PMC free article] [PubMed] [Google Scholar]
- 5.Park SL, Zaid A, Hor JL, Christo SN, Prier JE, Davies B, Alexandre YO, Gregory JL, Russell TA, Gebhardt T, Carbone FR, Tscharke DC, Heath WR, Mueller SN & Mackay LK Local proliferation maintains a stable pool of tissue-resident memory T cells after antiviral recall responses. Nat Immunol 19, 183–191 (2018). [DOI] [PubMed] [Google Scholar]
- 6.Gray JI & Farber DL Tissue-Resident Immune Cells in Humans. Annu Rev Immunol 40, 195–220 (2022). [DOI] [PMC free article] [PubMed] [Google Scholar]
- 7.Kumar BV, Connors TJ & Farber DL Human T Cell Development, Localization, and Function throughout Life. Immunity 48, 202–213 (2018). [DOI] [PMC free article] [PubMed] [Google Scholar]
- 8.Kumar BV, Ma W, Miron M, Granot T, Guyer RS, Carpenter DJ, Senda T, Sun X, Ho SH, Lerner H, Friedman AL, Shen Y. & Farber DL Human Tissue-Resident Memory T Cells Are Defined by Core Transcriptional and Functional Signatures in Lymphoid and Mucosal Sites. Cell Rep 20, 2921–2934 (2017). [DOI] [PMC free article] [PubMed] [Google Scholar]
- 9.Thome JJ, Yudanin N, Ohmura Y, Kubota M, Grinshpun B, Sathaliyawala T, Kato T, Lerner H, Shen Y. & Farber DL Spatial map of human T cell compartmentalization and maintenance over decades of life. Cell 159, 814–828 (2014). [DOI] [PMC free article] [PubMed] [Google Scholar]
- 10.Szabo PA, Levitin HM, Miron M, Snyder ME, Senda T, Yuan J, Cheng YL, Bush EC, Dogra P, Thapa P, Farber DL & Sims PA Single-cell transcriptomics of human T cells reveals tissue and activation signatures in health and disease. Nat Commun 10, 4706 (2019). [DOI] [PMC free article] [PubMed] [Google Scholar]
- 11.Miron M, Kumar BV, Meng W, Granot T, Carpenter DJ, Senda T, Chen D, Rosenfeld AM, Zhang B, Lerner H, Friedman AL, Hershberg U, Shen Y, Rahman A, Luning Prak ET & Farber DL Human Lymph Nodes Maintain TCF-1(hi) Memory T Cells with High Functional Potential and Clonal Diversity throughout Life. J Immunol 201, 2132–2140 (2018). [DOI] [PMC free article] [PubMed] [Google Scholar]
- 12.Pallett LJ, Davies J, Colbeck EJ, Robertson F, Hansi N, Easom NJW, Burton AR, Stegmann KA, Schurich A, Swadling L, Gill US, Male V, Luong T, Gander A, Davidson BR, Kennedy PTF & Maini MK IL-2high tissue-resident T cells in the human liver: Sentinels for hepatotropic infection. J Exp Med 214, 1567–1580 (2017). [DOI] [PMC free article] [PubMed] [Google Scholar]
- 13.Weisberg SP, Carpenter DJ, Chait M, Dogra P, Gartrell-Corrado RD, Chen AX, Campbell S, Liu W, Saraf P, Snyder ME, Kubota M, Danzl NM, Schrope BA, Rabadan R, Saenger Y, Chen X. & Farber DL Tissue-Resident Memory T Cells Mediate Immune Homeostasis in the Human Pancreas through the PD-1/PD-L1 Pathway. Cell Rep 29, 3916–3932 e3915 (2019). [DOI] [PMC free article] [PubMed] [Google Scholar]
- 14.Poon MML, Byington E, Meng W, Kubota M, Matsumoto R, Grifoni A, Weiskopf D, Dogra P, Lam N, Szabo PA, Ural BB, Wells SB, Rosenfeld AM, Brusko MA, Brusko TM, Connors TJ, Sette A, Sims PA, Luning Prak ET, Shen Y. & Farber DL Heterogeneity of human anti-viral immunity shaped by virus, tissue, age, and sex. Cell Rep 37, 110071 (2021). [DOI] [PMC free article] [PubMed] [Google Scholar]
- 15.Poon MML, Rybkina K, Kato Y, Kubota M, Matsumoto R, Bloom NI, Zhang Z, Hastie KM, Grifoni A, Weiskopf D, Wells SB, Ural BB, Lam N, Szabo PA, Dogra P, Lee YS, Gray JI, Bradley MC, Brusko MA, Brusko TM, Saphire EO, Connors TJ, Sette A, Crotty S. & Farber DL SARS-CoV-2 infection generates tissue-localized immunological memory in humans. Sci Immunol, eabl9105 (2021). [DOI] [PMC free article] [PubMed] [Google Scholar]
- 16.Hegazy AN, West NR, Stubbington MJT, Wendt E, Suijker KIM, Datsi A, This S, Danne C, Campion S, Duncan SH, Owens BMJ, Uhlig HH, McMichael A, Oxford IBDCI, Bergthaler A, Teichmann SA, Keshav S. & Powrie F. Circulating and Tissue-Resident CD4(+) T Cells With Reactivity to Intestinal Microbiota Are Abundant in Healthy Individuals and Function Is Altered During Inflammation. Gastroenterology 153, 1320–1337 e1316 (2017). [DOI] [PMC free article] [PubMed] [Google Scholar]
- 17.Clark RA Resident memory T cells in human health and disease. Sci Transl Med 7, 269rv261 (2015). [DOI] [PMC free article] [PubMed] [Google Scholar]
- 18.Watanabe R, Gehad A, Yang C, Scott LL, Teague JE, Schlapbach C, Elco CP, Huang V, Matos TR, Kupper TS & Clark RA Human skin is protected by four functionally and phenotypically discrete populations of resident and recirculating memory T cells. Sci Transl Med 7, 279ra239 (2015). [DOI] [PMC free article] [PubMed] [Google Scholar]
- 19.Miron M, Meng W, Rosenfeld AM, Dvorkin S, Poon MML, Lam N, Kumar BV, Louzoun Y, Luning Prak ET & Farber DL Maintenance of the human memory T cell repertoire by subset and tissue site. Genome Med 13, 100 (2021). [DOI] [PMC free article] [PubMed] [Google Scholar]
- 20.Carpenter DJ, Granot T, Matsuoka N, Senda T, Kumar BV, Thome JJC, Gordon CL, Miron M, Weiner J, Connors T, Lerner H, Friedman A, Kato T, Griesemer AD & Farber DL Human immunology studies using organ donors: Impact of clinical variations on immune parameters in tissues and circulation. Am J Transplant 18, 74–88 (2018). [DOI] [PMC free article] [PubMed] [Google Scholar]
- 21.Dogra P, Rancan C, Ma W, Toth M, Senda T, Carpenter DJ, Kubota M, Matsumoto R, Thapa P, Szabo PA, Li Poon MM, Li J, Arakawa-Hoyt J, Shen Y, Fong L, Lanier LL & Farber DL Tissue Determinants of Human NK Cell Development, Function, and Residence. Cell 180, 749–763 e713 (2020). [DOI] [PMC free article] [PubMed] [Google Scholar]
- 22.King C, Tangye SG & Mackay CR T follicular helper (TFH) cells in normal and dysregulated immune responses. Annu Rev Immunol 26, 741–766 (2008). [DOI] [PubMed] [Google Scholar]
- 23.Liu W, Putnam AL, Xu-Yu Z, Szot GL, Lee MR, Zhu S, Gottlieb PA, Kapranov P, Gingeras TR, Fazekas de St Groth B, Clayberger C, Soper DM, Ziegler SF & Bluestone JA CD127 expression inversely correlates with FoxP3 and suppressive function of human CD4+ T reg cells. J Exp Med 203, 1701–1711 (2006). [DOI] [PMC free article] [PubMed] [Google Scholar]
- 24.Szabo SJ, Kim ST, Costa GL, Zhang X, Fathman CG & Glimcher LH A novel transcription factor, T-bet, directs Th1 lineage commitment. Cell 100, 655–669 (2000). [DOI] [PubMed] [Google Scholar]
- 25.Cosmi L, Annunziato F, Galli MIG, Maggi RME, Nagata K. & Romagnani S. CRTH2 is the most reliable marker for the detection of circulating human type 2 Th and type 2 T cytotoxic cells in health and disease. Eur J Immunol 30, 2972–2979 (2000). [DOI] [PubMed] [Google Scholar]
- 26.Zgraggen S, Huggenberger R, Kerl K. & Detmar M. An important role of the SDF-1/CXCR4 axis in chronic skin inflammation. PLoS One 9, e93665 (2014). [DOI] [PMC free article] [PubMed] [Google Scholar]
- 27.Qi Q, Liu Y, Cheng Y, Glanville J, Zhang D, Lee JY, Olshen RA, Weyand CM, Boyd SD & Goronzy JJ Diversity and clonal selection in the human T-cell repertoire. Proc Natl Acad Sci U S A 111, 13139–13144 (2014). [DOI] [PMC free article] [PubMed] [Google Scholar]
- 28.Kuo CT & Leiden JM Transcriptional regulation of T lymphocyte development and function. Annu Rev Immunol 17, 149–187 (1999). [DOI] [PubMed] [Google Scholar]
- 29.Sharma PK, Wong EB, Napier RJ, Bishai WR, Ndung’u T, Kasprowicz VO, Lewinsohn DA, Lewinsohn DM & Gold MC High expression of CD26 accurately identifies human bacteria-reactive MR1-restricted MAIT cells. Immunology 145, 443–453 (2015). [DOI] [PMC free article] [PubMed] [Google Scholar]
- 30.Zaiss DMW, Gause WC, Osborne LC & Artis D. Emerging functions of amphiregulin in orchestrating immunity, inflammation, and tissue repair. Immunity 42, 216–226 (2015). [DOI] [PMC free article] [PubMed] [Google Scholar]
- 31.Frumento G, Zuo J, Verma K, Croft W, Ramagiri P, Chen FE & Moss P. CD117 (c-Kit) Is Expressed During CD8(+) T Cell Priming and Stratifies Sensitivity to Apoptosis According to Strength of TCR Engagement. Front Immunol 10, 468 (2019). [DOI] [PMC free article] [PubMed] [Google Scholar]
- 32.Sullivan JA, Kim EH, Plisch EH & Suresh M. FOXO3 regulates the CD8 T cell response to a chronic viral infection. J Virol 86, 9025–9034 (2012). [DOI] [PMC free article] [PubMed] [Google Scholar]
- 33.Wein AN, McMaster SR, Takamura S, Dunbar PR, Cartwright EK, Hayward SL, McManus DT, Shimaoka T, Ueha S, Tsukui T, Masumoto T, Kurachi M, Matsushima K. & Kohlmeier JE CXCR6 regulates localization of tissue-resident memory CD8 T cells to the airways. J Exp Med 216, 2748–2762 (2019). [DOI] [PMC free article] [PubMed] [Google Scholar]
- 34.Castro G, Liu X, Ngo K, De Leon-Tabaldo A, Zhao S, Luna-Roman R, Yu J, Cao T, Kuhn R, Wilkinson P, Herman K, Nelen MI, Blevitt J, Xue X, Fourie A. & Fung-Leung WP RORgammat and RORalpha signature genes in human Th17 cells. PLoS One 12, e0181868 (2017). [DOI] [PMC free article] [PubMed] [Google Scholar]
- 35.Mackay LK, Minnich M, Kragten NA, Liao Y, Nota B, Seillet C, Zaid A, Man K, Preston S, Freestone D, Braun A, Wynne-Jones E, Behr FM, Stark R, Pellicci DG, Godfrey DI, Belz GT, Pellegrini M, Gebhardt T, Busslinger M, Shi W, Carbone FR, van Lier RA, Kallies A. & van Gisbergen KP Hobit and Blimp1 instruct a universal transcriptional program of tissue residency in lymphocytes. Science 352, 459–463 (2016). [DOI] [PubMed] [Google Scholar]
- 36.Svensson M, Marsal J, Ericsson A, Carramolino L, Broden T, Marquez G. & Agace WW CCL25 mediates the localization of recently activated CD8alphabeta(+) lymphocytes to the small-intestinal mucosa. J Clin Invest 110, 1113–1121 (2002). [DOI] [PMC free article] [PubMed] [Google Scholar]
- 37.Clark RA, Chong B, Mirchandani N, Brinster NK, Yamanaka K, Dowgiert RK & Kupper TS The vast majority of CLA+ T cells are resident in normal skin. J Immunol 176, 4431–4439 (2006). [DOI] [PubMed] [Google Scholar]
- 38.Reiss Y, Proudfoot AE, Power CA, Campbell JJ & Butcher EC CC chemokine receptor (CCR)4 and the CCR10 ligand cutaneous T cell-attracting chemokine (CTACK) in lymphocyte trafficking to inflamed skin. J Exp Med 194, 1541–1547 (2001). [DOI] [PMC free article] [PubMed] [Google Scholar]
- 39.Koguchi-Yoshioka H, Hoffer E, Cheuk S, Matsumura Y, Vo S, Kjellman P, Grema L, Ishitsuka Y, Nakamura Y, Okiyama N, Fujisawa Y, Fujimoto M, Eidsmo L, Clark RA & Watanabe R. Skin T cells maintain their diversity and functionality in the elderly. Commun Biol 4, 13 (2021). [DOI] [PMC free article] [PubMed] [Google Scholar]
- 40.Ogasawara T, Hatano M, Satake H, Ikari J, Taniguchi T, Tsuruoka N, Watanabe-Takano H, Fujimura L, Sakamoto A, Hirata H, Sugiyama K, Fukushima Y, Nakae S, Matsumoto K, Saito H, Fukuda T, Kurasawa K, Tatsumi K, Tokuhisa T. & Arima M. Development of chronic allergic responses by dampening Bcl6-mediated suppressor activity in memory T helper 2 cells. Proc Natl Acad Sci U S A 114, E741–E750 (2017). [DOI] [PMC free article] [PubMed] [Google Scholar]
- 41.Dominguez Conde C, Xu C, Jarvis LB, Rainbow DB, Wells SB, Gomes T, Howlett SK, Suchanek O, Polanski K, King HW, Mamanova L, Huang N, Szabo PA, Richardson L, Bolt L, Fasouli ES, Mahbubani KT, Prete M, Tuck L, Richoz N, Tuong ZK, Campos L, Mousa HS, Needham EJ, Pritchard S, Li T, Elmentaite R, Park J, Rahmani E, Chen D, Menon DK, Bayraktar OA, James LK, Meyer KB, Yosef N, Clatworthy MR, Sims PA, Farber DL, Saeb-Parsy K, Jones JL & Teichmann SA Cross-tissue immune cell analysis reveals tissue-specific features in humans. Science 376, eabl5197 (2022). [DOI] [PMC free article] [PubMed] [Google Scholar]
- 42.Sathaliyawala T, Kubota M, Yudanin N, Turner D, Camp P, Thome JJ, Bickham KL, Lerner H, Goldstein M, Sykes M, Kato T. & Farber DL Distribution and compartmentalization of human circulating and tissue-resident memory T cell subsets. Immunity 38, 187–197 (2013). [DOI] [PMC free article] [PubMed] [Google Scholar]
- 43.Park CO, Fu X, Jiang X, Pan Y, Teague JE, Collins N, Tian T, O’Malley JT, Emerson RO, Kim JH, Jung Y, Watanabe R, Fuhlbrigge RC, Carbone FR, Gebhardt T, Clark RA, Lin CP & Kupper TS Staged development of long-lived T-cell receptor alphabeta TH17 resident memory T-cell population to Candida albicans after skin infection. J Allergy Clin Immunol 142, 647–662 (2018). [DOI] [PMC free article] [PubMed] [Google Scholar]
- 44.Matos TR, O’Malley JT, Lowry EL, Hamm D, Kirsch IR, Robins HS, Kupper TS, Krueger JG & Clark RA Clinically resolved psoriatic lesions contain psoriasis-specific IL-17-producing alphabeta T cell clones. J Clin Invest 127, 4031–4041 (2017). [DOI] [PMC free article] [PubMed] [Google Scholar]
- 45.Win TS, Crisler WJ, Dyring-Andersen B, Lopdrup R, Teague JE, Zhan Q, Barrera V, Ho Sui S, Tasigiorgos S, Murakami N, Chandraker A, Tullius SG, Pomahac B, Riella LV & Clark RA Immunoregulatory and lipid presentation pathways are upregulated in human face transplant rejection. J Clin Invest 131, e135166 (2021). [DOI] [PMC free article] [PubMed] [Google Scholar]
- 46.Rahimi RA, Nepal K, Cetinbas M, Sadreyev RI & Luster AD Distinct functions of tissue-resident and circulating memory Th2 cells in allergic airway disease. J Exp Med 217, e20190865 (2020). [DOI] [PMC free article] [PubMed] [Google Scholar]
- 47.Hondowicz BD, An D, Schenkel JM, Kim KS, Steach HR, Krishnamurty AT, Keitany GJ, Garza EN, Fraser KA, Moon JJ, Altemeier WA, Masopust D. & Pepper M. Interleukin-2-Dependent Allergen-Specific Tissue-Resident Memory Cells Drive Asthma. Immunity 44, 155–166 (2016). [DOI] [PMC free article] [PubMed] [Google Scholar]
- 48.Crowl JT, Heeg M, Ferry A, Milner JJ, Omilusik KD, Toma C, He Z, Chang JT & Goldrath AW Tissue-resident memory CD8(+) T cells possess unique transcriptional, epigenetic and functional adaptations to different tissue environments. Nat Immunol 23, 1121–1131 (2022). [DOI] [PMC free article] [PubMed] [Google Scholar]
- 49.Pizzolla A, Nguyen TH, Sant S, Jaffar J, Loudovaris T, Mannering SI, Thomas PG, Westall GP, Kedzierska K. & Wakim LM Influenza-specific lung-resident memory T cells are proliferative and polyfunctional and maintain diverse TCR profiles. J Clin Invest 128, 721–733 (2018). [DOI] [PMC free article] [PubMed] [Google Scholar]
- 50.Thome JJ, Bickham KL, Ohmura Y, Kubota M, Matsuoka N, Gordon C, Granot T, Griesemer A, Lerner H, Kato T. & Farber DL Early-life compartmentalization of human T cell differentiation and regulatory function in mucosal and lymphoid tissues. Nat Med 22, 72–77 (2016). [DOI] [PMC free article] [PubMed] [Google Scholar]
- 51.Schreurs R, Baumdick ME, Sagebiel AF, Kaufmann M, Mokry M, Klarenbeek PL, Schaltenberg N, Steinert FL, van Rijn JM, Drewniak A, The SML, Bakx R, Derikx JPM, de Vries N, Corpeleijn WE, Pals ST, Gagliani N, Friese MA, Middendorp S, Nieuwenhuis EES, Reinshagen K, Geijtenbeek TBH, van Goudoever JB & Bunders MJ Human Fetal TNF-alpha-Cytokine-Producing CD4(+) Effector Memory T Cells Promote Intestinal Development and Mediate Inflammation Early in Life. Immunity 50, 462–476 e468 (2019). [DOI] [PubMed] [Google Scholar]
- 52.Zens KD, Chen J-K & Farber DL Vaccine-Generated Lung Tissue-Resident Memory T cells Provide Heterosubtypic Protection to Influenza Infection. J. Clin. Invest. Insight 1 e85832 (2016). [DOI] [PMC free article] [PubMed] [Google Scholar]
- 53.Allen AC, Wilk MM, Misiak A, Borkner L, Murphy D. & Mills KHG Sustained protective immunity against Bordetella pertussis nasal colonization by intranasal immunization with a vaccine-adjuvant combination that induces IL-17-secreting TRM cells. Mucosal Immunol 11, 1763–1776 (2018). [DOI] [PubMed] [Google Scholar]
METHODS-ONLY REFERENCES
- 54.Senda T, Dogra P, Granot T, Furuhashi K, Snyder ME, Carpenter DJ, Szabo PA, Thapa P, Miron M. & Farber DL Microanatomical dissection of human intestinal T-cell immunity reveals site-specific changes in gut-associated lymphoid tissues over life. Mucosal Immunol 12, 378–389 (2019). [DOI] [PMC free article] [PubMed] [Google Scholar]
- 55.Wells SB, Szabo PA & Lam N. Isolation of nucleated cells from bone marrow aspirate. protocols.io (2021). 10.17504/protocols.io.bwrupd6w [DOI] [Google Scholar]
- 56.Wells SB & Szabo PA Preparation of single cell suspension from human spleen tissue. protocols.io (2021). 10.17504/protocols.io.bwq4pdyw [DOI] [Google Scholar]
- 57.Wells SB, Szabo PA, Ural B. & Poon MML Preparation of Single Cell Suspension from Human Lung Tissue. protocols.io (2021). 10.17504/protocols.io.bwr9pd96 [DOI] [Google Scholar]
- 58.Wells SB, Szabo PA, Lam N. & Poon MML Preparation of Single Cell Suspension from Human Lymph Node Tissue. protocols.io (2021). 10.17504/protocols.io.bwsapeae [DOI] [Google Scholar]
- 59.Ritz C, Meng W, Stanley NL, Baroja ML, Xu C, Yan P, Huang AC, Hausler R, Nicholas P, Fan JM, Lieberman D, Carreno BM, Luning Prak ET, Olson TS & Babushok DV Postvaccination graft dysfunction/aplastic anemia relapse with massive clonal expansion of autologous CD8+ lymphocytes. Blood Adv 4, 1378–1382 (2020). [DOI] [PMC free article] [PubMed] [Google Scholar]
- 60.Meng W, Zhang B, Schwartz GW, Rosenfeld AM, Ren D, Thome JJC, Carpenter DJ, Matsuoka N, Lerner H, Friedman AL, Granot T, Farber DL, Shlomchik MJ, Hershberg U. & Luning Prak ET An atlas of B-cell clonal distribution in the human body. Nat Biotechnol 35, 879–884 (2017). [DOI] [PMC free article] [PubMed] [Google Scholar]
- 61.Shugay M, Bagaev DV, Turchaninova MA, Bolotin DA, Britanova OV, Putintseva EV, Pogorelyy MV, Nazarov VI, Zvyagin IV, Kirgizova VI, Kirgizov KI, Skorobogatova EV & Chudakov DM VDJtools: Unifying Post-analysis of T Cell Receptor Repertoires. PLoS Comput Biol 11, e1004503 (2015). [DOI] [PMC free article] [PubMed] [Google Scholar]
- 62.Rosenfeld AM, Meng W, Luning Prak ET & Hershberg U. ImmuneDB, a Novel Tool for the Analysis, Storage, and Dissemination of Immune Repertoire Sequencing Data. Front Immunol 9, 2107 (2018). [DOI] [PMC free article] [PubMed] [Google Scholar]
- 63.Rosenfeld AM, Meng W, Luning Prak ET & Hershberg U. ImmuneDB: a system for the analysis and exploration of high-throughput adaptive immune receptor sequencing data. Bioinformatics 33, 292–293 (2017). [DOI] [PMC free article] [PubMed] [Google Scholar]
- 64.Rosenfeld AM, Meng W, Horne KI, Chen EC, Bagnara D, Stervbo U, Luning Prak ET & Community A. Bulk gDNA Sequencing of Antibody Heavy-Chain Gene Rearrangements for Detection and Analysis of B-Cell Clone Distribution: A Method by the AIRR Community. Methods Mol Biol 2453, 317–343 (2022). [DOI] [PMC free article] [PubMed] [Google Scholar]
- 65.Kassambara A. & Mundt F. factoextra: Extract and Visualize the Results of Multivariate Data Analyses. R Package Version (2020). https://CRAN.R-project.org/package=factoextra [Google Scholar]
- 66.Rempala GA & Seweryn M. Methods for diversity and overlap analysis in T-cell receptor populations. J Math Biol 67, 1339–1368 (2013). [DOI] [PMC free article] [PubMed] [Google Scholar]
- 67.Chao A, Chazdon RL, Colwell RK & Shen TJ Abundance-based similarity indices and their estimation when there are unseen species in samples. Biometrics 62, 361–371 (2006). [DOI] [PubMed] [Google Scholar]
- 68.Bray NL, Pimentel H, Melsted P. & Pachter L. Near-optimal probabilistic RNA-seq quantification. Nat Biotechnol 34, 525–527 (2016). [DOI] [PubMed] [Google Scholar]
- 69.Melsted P, Booeshaghi AS, Liu L, Gao F, Lu L, Min KHJ, da Veiga Beltrame E, Hjorleifsson KE, Gehring J. & Pachter L. Modular, efficient and constant-memory single-cell RNA-seq preprocessing. Nat Biotechnol 39, 813–818 (2021). [DOI] [PubMed] [Google Scholar]
- 70.Melsted P, Ntranos V. & Pachter L. The barcode, UMI, set format and BUStools. Bioinformatics 35, 4472–4473 (2019). [DOI] [PubMed] [Google Scholar]
- 71.Lun ATL, Riesenfeld S, Andrews T, Dao TP, Gomes T, participants in the 1st Human Cell Atlas, J. & Marioni, J.C. EmptyDrops: distinguishing cells from empty droplets in droplet-based single-cell RNA sequencing data. Genome Biol 20, 63 (2019). [DOI] [PMC free article] [PubMed] [Google Scholar]
- 72.Gold MC, McLaren JE, Reistetter JA, Smyk-Pearson S, Ladell K, Swarbrick GM, Yu YY, Hansen TH, Lund O, Nielsen M, Gerritsen B, Kesmir C, Miles JJ, Lewinsohn DA, Price DA & Lewinsohn DM MR1-restricted MAIT cells display ligand discrimination and pathogen selectivity through distinct T cell receptor usage. J Exp Med 211, 1601–1610 (2014). [DOI] [PMC free article] [PubMed] [Google Scholar]
Associated Data
This section collects any data citations, data availability statements, or supplementary materials included in this article.
Supplementary Materials
Data Availability Statement
High-throughput TCR sequence data generated in this study are available in NCBI SRA with the accession code PRJNA861254. Paired scRNA and scTCR data generated in this study are available in NCBI GEO with the accession code GSE206507.


