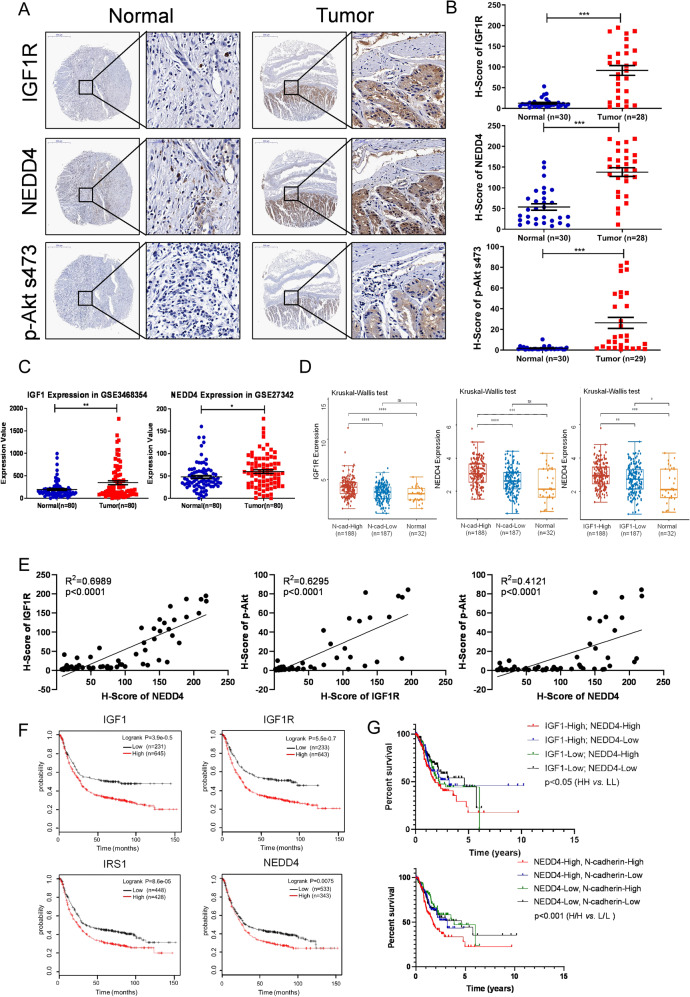
Fig. 7. High levels of the IGF1 pathway and NEDD4 are closely associated with poor prognosis of GC.
A Representative images of IGF1R, NEDD4, and p-Akt s473 expression in adjacent non-tumor tissues and primary GC tissues detected by IHC staining. B IHC scores of IGF1R, NEDD4, and p-Akt S473 expressions in adjacent non-tumor tissues and primary GC tissues. C Analysis of IGF1 and NEDD4 expressions in normal tissue and GC tissues from Gastric datasets (GSE3468354 and GSE27342, N, normal gastric mucosa, n = 80; T, gastric tumor, n = 80). D Analysis of IGF1R expression in GC stratified by N-cadherin expression and normal tissues, NEDD4 expression in GC stratified by N-cadherin expression and normal tissues, and NEDD4 expression in GC stratified by IGF1 expression and normal tissues in TCGA database. E Protein expression correlation of IGF1R, NEDD4, and p-Akt s473 in GC tissues. F Kaplan–Meier plots of OS among GC patients with different expressions of IGF1, IGF1R, IRS1, and NEDD4. G Overall survival rate of STAD from the TCGA database was analyzed according to the mRNA levels of IGF1 and NEDD4, NEDD4 and N-cadherin. IGF1-High/NEDD4-High (n = 103); IGF1-High/NEDD4-Low (n = 82); IGF1-Low/NEDD4-High (n = 82); IGF1-Low/NEDD4-Low (n = 103). NEDD4-High/N-cadherin-High (n = 111); NEDD4-High/N-cadherin-Low (n = 74); NEDD4-Low/N-cadherin-High (n = 74); NEDD4-Low/N-cadherin-Low (n = 111). ***p < 0.001, **p < 0.01, *p < 0.05, ns p > 0.05.

