

Abstract
Introduction
Plantar fasciitis (PFS) is described by an intense pain over medial tubercle of calcaneus, increased with the first step after waking up, after rest and during weightbearing activity. It is the most common cause of plantar heel pain in adults with the prevalence estimated 10% of the general population. Ultrasound imaging is commonly being used to measure the PF thickness, evaluate the efficacy of different treatments and a guide therapeutic technique in patients with PFS. The objective of this study was to systematically review the studies that were previously published to evaluate the role of ultrasound in the assessment of PF in patients with PFS.
Methods
A systematic search was carried out over the last 5 years from 2017 to 2022 on basis the following electronic databases: Science Direct, Scopus, Web of Science, Springer and PubMed. The keywords that used in the searching were: ultrasound, sonography, ultrasonography, plantar fasciitis, imaging of plantar fascia, physiotherapy of plantar fasciitis, interventional treatment of plantar fasciitis, randomized controlled trial of plantar fasciitis and interventional ultrasound. The review focused on the assessment of PF in patients with PFS underwent different interventions using B-mode, shear wave elastography (SWE) and color Doppler ultrasound.
Results
During the search process, 1661 were recorded using the proper keywords from 2017 to 2022 in which 666 original articles were found after removing the review and duplicated articles. Of these, thirty articles met the inclusion criteria and included in this review. The articles have assessed the PF in patients with PFS under different conditions using different ultrasound modes. Twenty-six articles evaluated the effectiveness of different treatment on PF in patients with PFS using different ultrasound modes. In 8 of 26 articles, the ultrasound was used as both an assessment tool of PF and guide therapeutic technique in patients with PFS. In 18 articles, the ultrasound was used as only assessment tool to identify the PF thickness and its observation changes in patients with PFS. Four articles compared the PF thickness and its intrafascial changes between patients with PFS and healthy subjects.
Conclusion
The ultrasound can be a reliable tool in assessment the effect of different interventions on PF by evaluating its thickness, echogenicity and stiffness changes in patients with PFS. There were different methods and treatments were used among the studies.
Graphical abstract
Keywords: Ultrasound, Sonography, Plantar fasciitis, Imaging of plantar fascia, Physiotherapy of plantar fasciitis, Interventional treatment of plantar fasciitis
Introduction
Plantar fascia (PF) is the fibrous layer of connective tissue across the plantar surface of foot that has been an important role in ankle and foot biomechanics [1]. It consists of 3 main bands which are lateral, central and medial. The lateral band extends beneath the plantar surface of the abductor digiti quinti muscle and passes laterally with the posterior fascia and distally with the 5th metatarsophalangeal joint capsule. The central band is thickest and strongest one of the fascia, arising from the medial calcaneal tubercle and extending anteriorly to cover the plantar surface of the flexor digitorum brevis muscle. The medial band is the thinnest section, situated under the plantar surface of the abductor hallucis muscle, passing distally to the 1st metatarsophalangeal joint capsule and proximally to the flexor retinaculum of the foot [2, 3]. PF provides a static and dynamic support of the longitudinal arch foot, being as a dynamic shock absorber [4, 5].
Plantar fasciitis is commonly used to describe a plantar heel pain with inflammation of the PF at its origin, not to pain arising along the course of the fascia. In contrary, a substantial evidence of plantar fasciosis is associated with degenerative changes without inflammation [6]. Ledderhose disease, also known plantar fibromatosis, is a benign condition characterized by proliferation of fibrous tissue in form of nodules or cords in the PF, occasionally located on the medial and central bands of the fascia [7].
Nevertheless, there is a controversy regarding the appropriate term of plantar fasciitis, whether the disease should be referred to as “plantar fasciitis”, “plantar fasciosis” or “plantar heel pain”. Although the nature of plantar fasciitis can be either inflammatory or degenerative, imaging and histological findings confirm the hypothesis that “plantar fasciitis” is actually a degenerative disorder rather than inflammatory [4, 8]. Several studies; therefore, have used “plantar heel pain” as a general term [9–12]. In contrast, the recent trials and reviews [13] have regained to the most common clinical phrase of “plantar fasciitis”. Thus, we will use the term “plantar fasciitis (PFS)” in this review.
PFS is the most common cause of plantar heel pain in adults with the prevalence estimated 10% of the general population [14, 15]. Despite the pathogenesis of PFS is still ambiguous, the intrinsic muscle weakness, prolong standing, longtime walking and running, decreased elasticity of the plantar fascia, increased body mass index, reduced strength of gastrosoleus muscles, reduced dorsiflexion of ankle, leg length discrepancy and longitudinal arch deformity such as pes planus may increase the risk of PFS [16–18].
PFS is characterized by intense pain over the medial plantar aspect of the heel, sharpened with first step in the morning or after rest and increased during weightbearing activity [19–24].
The Cochrane review showed that an efficacy for any type of PFS treatments is not studied well [25]. Furthermore, treatment modalities and options for PFS remain inconsistent as well as the recommended methods of intervention are very limited [11, 13, 18, 26, 27]. There is a little evidence for using conservative treatment such as custom orthoses or prefabricated for long-term improvements in heel pain or disability [13, 28, 29] in spite of a recent trial revealed that short-term improvements in heel pain using full-length silicone insoles is considered as an initial line for PFS treatment [30]. In the light of that, a recent systematic review concluded that manual physiotherapy such as PF stretching and joint mobilization could reduce pain and stiffness, improve function and impairments. However, the optimum dosage of manual physiotherapy is still controversial [31]. In the same context, stretching of intrinsic foot muscle has been shown to be effective for improving heel pain and disability of PFS [32, 33].
As ultrasound is available, low-cost and comfortable for patients, it is superior to MRI in imaging the PF and diagnosis the PFS in many studies and as a guide therapeutic tool in patients with PFS [14]. This study was conducted to systematically review the previous studies using ultrasound as assessment tool in patient with PFS underwent different interventions.
Methodology
A searching was included the original articles published over the last 5 years from 2017 to 2022. The following electronic databases were depended: Science Direct, Scopus, Web of Science, Springer and PubMed. This systematic review was conducted according to the guidelines of the Preferred Reporting Items for Systematic Reviews and Meta-Analysis (PRISMA) [34].
Search strategy
The following keywords: “ultrasound”, “sonography”, “ultrasonography”, “plantar fasciitis”, “imaging of plantar fascia”, “physiotherapy of plantar fasciitis”, “interventional treatment of plantar fasciitis”, “randomized controlled trial of plantar fasciitis” and “interventional ultrasound” were used in the searching.
Inclusion criteria
The papers that have met the following criteria: (1) patients aged over 18 years. (2) patients with PFS, controlled (positive control) or healthy (negative control) groups for comparison. (3) randomized control trial or case–control design. (4) treatment of PFS with ultrasound assessment. (5) ultrasound was used in evaluation PF and surrounding tissues in patients with PFS. (6) the papers were written in English language. (7) original researches.
Data extraction
The articles were first checked based on titles and abstracts. If the title and abstracts were unclear, the full-length article was screened. The articles were chosen according to Critical Appraisal Skills Program (CASP, CASP UK, Oxford, UK) checklist. CASP results were summarized in Table 1. Two reviewers separately extracted the data from the final selected articles. If there was no agreement, the final decision was sought from the third reviewer.
Table 1.
Critical appraisal skills programme results
| 35 | 36 | 37 | 38 | 39 | 40 | 41 | 42 | 43 | 44 | 45 | 46 | 47 | 48 | 49 | |
|---|---|---|---|---|---|---|---|---|---|---|---|---|---|---|---|
| Clearly focused research question | √ | √ | √ | √ | √ | √ | √ | √ | √ | √ | √ | √ | √ | √ | √ |
| Appropriate study designed | √ | √ | √ | √ | √ | √ | √ | √ | × | √ | √ | √ | √ | × | √ |
| Appropriate recruitment and randomization | √ | √ | √ | √ | √ | √ | √ | √ | √ | √ | √ | √ | √ | √ | √ |
| Matched control | √ | × | √ | × | √ | √ | × | × | × | × | × | √ | × | √ | × |
| Test procedure clearly described | × | √ | √ | √ | × | √ | × | √ | √ | √ | √ | × | √ | × | × |
| Appropriate outcomes used | √ | √ | √ | √ | √ | √ | √ | √ | √ | √ | √ | √ | √ | √ | √ |
| Outcomes accurately measured | √ | × | √ | √ | √ | √ | √ | √ | × | √ | √ | × | √ | × | √ |
| Confounding factors accounted | √ | √ | × | × | × | √ | √ | × | × | √ | √ | × | √ | × | √ |
| Appropriate analysis | × | √ | √ | × | √ | √ | √ | × | × | √ | × | √ | √ | √ | √ |
| Accurate statistical results presented | √ | √ | × | × | × | √ | √ | × | × | √ | √ | √ | × | √ | √ |
| Ability to generalized results | √ | × | × | × | √ | √ | √ | × | √ | √ | √ | √ | √ | × | √ |
| Interpretation related to existing evidence | √ | √ | √ | √ | √ | √ | √ | √ | √ | √ | √ | √ | √ | √ | √ |
| Total scores | 10 | 10 | 9 | 8 | 9 | 12 | 11 | 8 | 6 | 12 | 11 | 9 | 11 | 7 | 11 |
| 50 | 51 | 52 | 53 | 54 | 55 | 56 | 57 | 58 | 59 | 60 | 61 | 62 | 63 | 64 | |
|---|---|---|---|---|---|---|---|---|---|---|---|---|---|---|---|
| Clearly focused research question | √ | √ | √ | √ | √ | √ | √ | √ | √ | √ | √ | √ | √ | √ | √ |
| Appropriate study designed | √ | √ | √ | √ | √ | √ | √ | √ | √ | × | √ | √ | √ | × | √ |
| Appropriate recruitment and randomization | √ | √ | √ | √ | √ | √ | √ | √ | √ | √ | √ | √ | √ | √ | √ |
| Matched control | √ | × | × | × | × | × | × | × | × | √ | × | × | × | √ | × |
| Test procedure clearly described | √ | × | × | × | × | √ | × | √ | √ | √ | √ | × | √ | √ | × |
| Appropriate outcomes used | √ | √ | √ | √ | √ | √ | √ | √ | √ | √ | √ | √ | √ | √ | √ |
| Outcomes accurately measured | √ | √ | √ | √ | × | √ | × | √ | √ | √ | √ | √ | √ | √ | √ |
| Confounding factors accounted | × | √ | × | √ | × | √ | √ | × | √ | × | × | √ | √ | √ | × |
| Appropriate analysis | √ | √ | √ | √ | √ | √ | × | √ | × | √ | √ | √ | √ | √ | √ |
| Accurate statistical results presented | × | √ | √ | √ | √ | √ | × | √ | × | √ | √ | √ | √ | √ | √ |
| Ability to generalized results | √ | √ | × | × | √ | √ | √ | × | × | √ | √ | √ | √ | √ | √ |
| Interpretation related to existing evidence | √ | √ | √ | √ | √ | √ | √ | √ | √ | √ | √ | √ | √ | √ | √ |
| Total scores | 10 | 10 | 8 | 9 | 8 | 11 | 7 | 9 | 8 | 10 | 10 | 10 | 11 | 11 | 9 |
Data collection process
During the search process, 4569 articles were found using proper keywords in which 1661 articles were found over the last five years. Of these, 666 articles were identified after removing the review and duplicated articles. Thirty- three of the 666 articles were relevant of this review. Two articles out of 33 articles are required subscribing to be able to download. One article was written in Chinese language except the abstract was written in English-language. Thus, thirty articles were analyzed and included in this search. Twenty-six of the 30 articles have assessed the effect of different treatments on PF in patients with PFS using both clinical examination and ultrasound imaging. Eight of 26 articles used ultrasound as both an assessment tool of PF and guide therapeutic in patients with PFS. Eighteen of the 26 articles used ultrasound as only assessment technique in diagnosis of PFS. The remaining 4 articles have compared PF thickness as well as intrafascial changes using different ultrasound modes between PFS patients and healthy subjects (Fig. 1). Twenty-nine of 30 articles have evaluated the PF thickness and its changes whereas only one article has only assessed the hypoechoic area within PF using B-mode ultrasound. In addition to measuring the thickness of the PF, there were 4 of the 30 articles have assessed the stiffness of PF using sonoelastography. In 3 of the 30 articles, the vascularity of PF was monitored using color Doppler ultrasound. In 7 articles, the echogenicity of PF was separately assessed on real-time B-mode. In one of the 30 articles, the fat pad thickness combined with PF thickness were measured.
Fig. 1.

Flow diagram of the study. PF plantar fascia, PFS plantar fascitiis, US ultrasound
Results
Six hundred sixty-six articles were found by the search process. Of these, thirty original articles [35–64] were closely related and included in this review. The articles have assessed the PF in patients with PFS under different conditions using different ultrasound modes from 2017 to 2022 (Table 2).
Table 2.
Overview of studies conducted on the evaluation of PF under different conditions using US
| References | Sample size | Des | objective | Outcome measures | Position for assessment | Measurement tools | Type of intervention | Site of measurement | Follow-up | Conclusion |
|---|---|---|---|---|---|---|---|---|---|---|
| [35] | 22 pts (10 ESWT vs 12 sham-ESWT) | RCT | To investigate the efficacy and tolerability of ESWT in patients with PFS in axSpA | Pain, foot function, PF thickness and morphology | Prone with full knee extension and 90° dorsiflexion of the ankle | B-mode US, VAS, heel pressure algometry, FFI | ESWT vs sham-ESWT | At 5 mm distal to the calcaneal insertion from the medial aspect | at baseline, 1, 4, 8 weeks after the last therapy | ESWT was a safe and tolerable physical therapy to improve chronic heel pain due to PFS in patients with axSPA with no significant effect on PF |
| [36] | 59 pts (29 rESWT vs 30 DPI) | RCT | To compare the effects of US-guided DPI with rESWT in the treatment of chronic PFS | Pain intensity, daily life and exercise activities, PF thickness | NR | B- mode US, VAS and FAAM | rESWT vs DPI | At the calcaneus insertion | At baseline, 6 weeks and 12 weeks after the treatment | DPI could reduce pain and PF thickness compared to rESWT in patients with PFS |
| [37] |
39 pts (19 PFS pts vs 20 healthy controls) |
CC | To compare stiffness of PF between patients with PFS and healthy subjects using SWE and to correlate SWE values with clinical scores | PF thickness, SWV and stiffness, clinical scores | Prone position with foot hanging over the end of table | B-mode US, SWE, VAS, FFI | NA | 1 cm distally from the calcaneal insertion | NA | SWE allows quantitative evaluation of the elasticity of the PF and can show PFS alterations. SWE shows a strong correlation with clinical scores |
| [38] | 40 pts (20 DPI and 20 CSI) | RCT | To valuate and compare the effect of ultrasound-guided DPI vs CSI in chronic PFS | Pain, foot function, PF thickness and area of hypoechogenic-ity | Prone position with the ankle at 90° | NRS, B-mode US, FAAM-A FAAM-S) | DPI vs CSI | Both PF thickness and area of hypoechogenici-ty at the insertion and 1 cm distal to the insertion zone | At 2 and 12 weeks after injection |
CSI may reduce pain, PF thickness better early, but both CSI and DPI have similar effects for a few months (up to 12 weeks) |
| [39] | 108 pts (87 pts and 21 healthy subjects) | CC | To evaluate the PF between healthy subjects and PFS patients by SWE with correlation to B-mode and CDUS and to establish cut-off values | PF thickness, vascularity grades, SWV and stiffness | NR | B-mode, color Doppler US and SWE | NA | Thickness was measured at calcaneus insertion. ROI was set within the thickest part of the PF. CDUS was applied on whole fascia | NA | SWE was able to Quantitatively assess the PF stiffness, which reduces in patients with PFS. PF was thickened in PFS compared to healthy fascia No correlation of vascularity was found between both groups |
| [40] | 82 pts (39 PFS, 23 unilateral healthy foot and 20 bilateral healthy feet) | CC | To determine the diagnostic potential of SWE and the correlation of clinical scores to SWE values | PF thickness, clinical scores, SWV and stiffness | Prone position with the foot hanging over the edge of table | B-mode, SWE, AOFAS and FFI | NA | At the calcaneus insertion; + 1 cm distal of the calcaneus and central part of the calcaneus | NA | SWE appears to enhance the diagnostic accuracy in patients with PFS as compared with B-mode US |
| [41] | 38 (19 PDRN and 19 CSI) | RCT | To compare the efficacy and safety of PDRN injection and CSI for PFS | Pain, thickness and echogenicity of PF | NR | B-mode US, VAS and MOXFQ | PDRN injection vs CSI | NR | VAS at baseline; 1, 2, 6 and 24 weeks and 6 ms post-treatment MOXFQ at baseline,6 weeks and 6 ms after treatment PF thickness at baseline, 6 ms after treatment | CSI has a positive clinical effect at short-term follow-up as compared to PDRN. No differences between PF thickness and echogenicity was found between two groups |
| [42] | 80 pts (40 ESWT and 40 CSI) | RCT | To compare and evaluate the therapeutic effects of ultrasound-guided CSI vs medium frequency ESWT in the treatment of PFS | Pain, foot function, PF thickness | NR | B-mode US, VAS, FFI and HTI score | ESWT vs CSI | At insertion of the fascia into the calcaneal tubercle | At baseline, 3, and 6 ms after treatment | The patients were not satisfied with the rESWT technique if it was applied as a primary treatment protocol |
| [43] | 22 pts (one group received ESWT) | LF | To evaluate the changes in PF stiffness pre and post ESWT in patients with PFS | Pain, PF thickness and stiffness | Prone position with 90° of knee flexion in the neutral ankle position | VAS, B-mode US and SEG | ESWT | NR | At baseline, at 1 wk, 1 m, 3 m, 6 m, and 12 m after ESWT | The heel pain and PF thickness reduced gradually over 12 ms after ESWT. The PF stiffness reduced during the first wk and increased afterthat; at the 12 ms follow-up, stiffness was higher before ESWT |
| [44] | 75 pts (38 HA and 37 CSI) | RCT | To assess the effectiveness of HA injection in reducing the symptoms of PFS compared to CSI | Pain and PF thickness, foot function and Foot and Ankle Ability | Prone position, 90° knee flexion with ankle in neutral position | B-mode US, VAS, FAAI, PPT and FFI | US-guided injection of HA vs CSI | NR | at baseline, 6 weeks and 24 weeks after the injection | Both CSI and HA resulted a better outcomes for PF as well as reducing pain and improving function |
| [45] | 102 pts (51 HILT and 51 LLLT) | RCT | To evaluate and compare the efficacy of HILT and LLLT for PFS | Pain and PF thickness | Prone position with the feet hanging in end of table | B-mode, VAS and pressure algometry | HILT vs LLLT | At the calcaneus insertion zone | At baseline, 0–3 weeks and 3–4 weeks follow-up | There was no significant effect between both groups |
| [46] | 60 pts (30 DP and 30 controls given saline) | RCT | To evaluate the therapeutic effects of DP in the treatment of PFS compared to control group | Pain, foot disability, PF thickness and echogenicity | Prone with the ankle placed in the neutral position | B-mode, VAS-A, VAS-R and FFI | DP vs control group (given saline) | NR | At baseline, at 7 and 15 weeks post-treatment | Improvement in PF thickness, foot function and pain was significantly higher in DP group than in control group |
| [47] | 44 pts (22 MPC vs 22MPC + SE) | RCT | To assess the effect of MPC and MPC + PF-SE on heel pain and PF thickness in treatment of PFS | Pain and PF thickness | Prone, foot hanging over the edge of table with ankle in neutral position | B-mode US and VAS | MPC only vs MPC + PF-SE | At the calcaneus insertion and within 5 mm from calcaneus insertion | At baseline, 4 weeks post-treatment | MPC can reduce the PF thickness but MPC combined with PF-SE is not better than MCP only in reduction heel pain and PF thickening |
| [48] | 94 (44 pts and 50 healthy controls) | RCT | To determine the efficacy of high-resolution US in the evaluation of PF in patients with heel pain | PF thickness | Prone with foot hanging over the edge of the table with ankle in dorsiflexion | B-mode | NA | Within 1 cm from calcaneal attachment | NA | PFS can be easily diagnosed by US with PF > 4 mm in thickness |
| [49] | 96 pts (49 ESWT vs 47 local CSI) | Block RCT | To evaluate the therapeutic clinical effects of local CSI and ESWT in treatment of PFS | Pain, disability and PF thickness | NR | B-mode, VAS and FFI | local CSI vs ESWT | At point where the PF crosses the anterior aspect of the inferior border of the calcaneus | At baseline, 1 m, 3 ms and 6 ms | Both ESWT and local CSI resulted in clinical improvement and PF thickness at follow-up but foot function have no significant difference between both groups |
| [50] | 120 (60 EA, 30 SA, 30 controls) | RCT | To compare the efficacy of EA and SA versus waitlist control for improving the pain in patients with chronic PFS | Pain, disability, PF thickness | Prone position | B-mode, VAS, PPT, AROM and FAAM | EA vs SA vs non-treatment control | At the thickest portion closest to the calcaneal insertion in its medial tuberosity | At baseline, 4 weeks, with a 12-weeks follow-up | Assessment of PF thickness may detect the anatomical changes that occur in the PF after acupuncture |
| [51] | 78 pts (36 KT vs 42 ESWT) | RCT | To compare the efficacy of KT and ESWT in the management of PFS | Pain, foot function and PF thickness, heel fat pad thickness | Prone position with an ankle in neutral position | B-mode US, VAS and FFI | KT vs ESWT | NR | At baseline and 6 weeks after treatment | Both KT and ESWT reduced the pain levels and improved quality of life in PFS patients. In both groups, the PF thickness has decreased whereas fat pad thickness has increased; however, the differences was not significant |
| [52] | 33 patients | Pivotal clinical trial | To assess the efficacy, safety and tolerability of ITU combined with standard-of-care in the management of chronic PFS | Pain, foot function, level of activity Hypoechoic area changes | NR | B-mode US-SROMs, VAS, FFI and FAAM | standard conservative care alone and Combining with ITU | NR | At baseline and 4, 8, 12 and 26 weeks after treatment |
ITU has reported to be effective, safe, and well tolerated option Hypoechoic areas were gradually decreased in size at follow-up |
| [53] | 40 pts (20 PRP vs 20 CSI) | CNP | To evaluate the efficacy and imaging changes between PRP and CSI in the treatment of PFS | Pain, PF thickness, echogenicity, vascularity and function | NR | VAS, AOFAS, B-mode US, MRI | PRP vs CSI | NR | US was done at baseline, 3 and 6 ms MRI was done at baseline and 6 ms, VAS and AOFAS results was evaluated at baseline, 6 and 12 ms after treatment | The PF thickness has significantly decreased at 3-ms follow-up in both groups. The echogenicity and vascularity have significantly reduced at 3 and 6-ms follow-up in PRP group only. Thus, PRP injection is a safe and more efficient than CSI in treatment of PFS |
| [54] | 60 pts (30 PRP vs 30 CSI) | RCT | To evaluate the effectiveness of local injection of PRP and CSI in the treatment of chronic PFS | Pain, PF thickness and function | NR | B-mode US, VAS and AOFAS score | PRP vs CSI | NR | At baseline, 6 weeks, 3 ms and 6 ms follow-up after injection | Over the time, PRP local injection was an effective treatment in improving the pain levels, foot function and PF thickness compared to CSI |
| [55] | 34 patients (17 ESWT vs 17 LLLT) | RCT | To compare the efficacy of ESWT and LLLT on PF thickness, heel pain, and foot functions in patients with PFS | Pain, foot function and PF thickness | Prone position with knees fully extended and ankles in a neutral position | B-mode US, VAS and FFI | ESWT vs LLLT | At the point where PF is inserted into medial calcaneal tubercle | at baseline, immediate after the treatment, and after 1 m | Both ESWT and LLLT have a clinical improvement such as reducing pain and improving foot functions as well as reducing PF thickness in patients with PFS |
| [56] |
90 patients 30 ST 31 CSI 29 combined ST + CSI |
RCT | To evaluate the effects of ST, local CSI, or combined ST and CSI on chronic PFS | Pain, foot function and PF thickness | Prone with 90º flexed, foot hanging on the edge of table in neutral position | B- mode US, VAS and FFI | ST, CSI and combined ST + CSI | NR | -VAS and FFI at baseline and 6 ms post therapy -US at baseline, 1,2,3,6,12 ms post therapy | The combination of CSI and ST had a superior effect on pain, foot function and PF thickness at all time points in patients with PFS as compared with either CSI or ST treatment |
| [57] | 30 pts (15 ozone injection) vs 15 CSI) | RCT | To determine the effects of ozone injection and CSI in the treatment of chronic PFS | Pain, activity and PF thickness | Prone position with their feet hanging over the edge of the table | VAS, B-mode and FAAM | Ozone (O2- O3) injection vs CSI | At insertion and 1 cm distal to its insertion into the medial calcaneal tubercle | At baseline, 2 and 12 weeks after injection | Ozone injection and CSI were effective in long term and short term, respectively. Both Ozone injection and CSI were observed to reduce pain and PF thickness and enhance foot function |
| [58] | 64 pts (36 PRP injection vs 28 KT) | RCT | To compare the effectiveness of PRP vs KT with phonophoresis in the treatment of chronic PFS | Disability and activity and PF thickness | Prone position with ankle in a neutral position | NRS, FFI and B-mode US | PRP vs KT with phonophores-is | At calcaneal attachment | NRS at baseline, 2,6,12 and 24 weeks FFI and US at baseline, 6,12 and 24 weeks | PRP was better in relief pain in short time follow-up whereas it is better in improving NRS, functional status and PF thickness in long time follow-up compared to KT with phonophoresis |
| [59] | 40 subjects (20 PFS pts vs 20 controls) | CC | To determine the influence of MTP joint extension on PF thickness in healthy subjects compared to those unilateral PFS | PF thickness measured at rest, 30° of MTP joints extension and maximal possible extension | Prone with the examined foot over the edge of the table and the ankle in neutral position | B-mode | NA | At the anterior margin of the calcaneus | NA | MTP joint position was effective in the measurement of PF thickness |
| [60] | 110 pts (55 ESWT vs 55 CSI) | RCT | To assess efficacy of CSI and ESWT in PFS patients to determine the correlation between clinical outcomes and the PF thickness | Pain and PF thickness | NR | VAS, 100-points scoring systems and B-mode US | ESWT vs CSI | At insertion and 5 mm distal to calcaneus tuberosity | At baseline, 4 and 12 wk | The positive changes in PF after ESWT treatment is given better clinical outcomes in PFS patients |
| [61] | 80 pts(40 PRP vs 40 CSI) | RCT | To evaluate the efficacy of local CSI vs PRP in the management of PFS | Pain, activity, foot function and PF thickness | NR | VAS, modified Roles and Maudsley score, FAI, AOFAS, B-mode US | PRP vs CSI | NR | At baseline at 1 m, 3 ms, and 6 ms after treatment | Both CSI or PRP was equally effective on clinical outcomes and PF thickness in patients with PFS |
| [62] | 72 pts (36 rESWT vs 36 CSI) | RCT | To compare the clinical and sonographic effects of rESWT and CSI in patients with PFS | Pain, function and PF thickness and echogenicity | NR | VAS, FFI, HTI score and B-mode US | rESWT vs CSI | At the point where PF inserted into calcaneal tuberosity | at baseline and 1, 3, and 6 ms after treatment | rESWT noted to be superior to CSI in improving clinical outcomes and PF changes due to its long-term action |
| [63] | 60 pts (40 ESWT vs 20 controls) | LF | To evaluate the efficacy of ESWT in the treatment of chronic PFS in patients with calcaneal spur using US | Pain, function and PF thickness | Prone with toes placed over the end of the examination table | VAS, Maudsley score, x-ray and B-mode US | ESWT | At 2 cm distal to the calcaneal insertion | At baseline and 8 weeks after treatment | PF has thickened in calcaneal spur patients. ESWT found to decrease the PF thickness and improve pain and function significantly |
| [64] | 30 pts (15 PRP vs 15 dry needling) | RCT | To compare the treatment effects of PRP and dry needling on chronic PFS | Foot function, PF thickness, echogenicity and vascularity | NR | FFI, B-mode and power Doppler US | PRP vs dry needling of myofascial meridian trigger points | NR | At baseline, 6 and 12 weeks after treatment | A clinical and US improvement were observed in PRP group at 12-weeks follow-up in patients with chronic PFS |
PF plantar fascia, PFS plantar fasciitis, FAAM Foot and Ankle Ability Measure, FAAM-A Foot and Ankle Ability Measure-Activity, FAAM-S Foot and Ankle Ability Measure-Sport, rESWT radial extracorporeal shock wave therapy, VAS visual analog scale, FFI Foot Function Index, RCT Randomized Controlled Trail, DPI Dextrose Prolotherapy Injection, CSI Corticosteroid Injection, NRS Numeric Rating Scale, US ultrasound, PDRN polydeoxyribonucleotide, MOXFQ Manchester-Oxford Foot Questionnaire, HTI Heel Tenderness Index, LF longitudinal follow-up, SEG Strain Elastography, wk(s) week(s), m(s) month(s), HA hyaluronic acid, FAAI Foot Ankle Ability Index, PPT pressure pain threshold, HILT high-intensity laser therapy, LLLT low-level laser therapy, SE stretching exercises, SA sham acupuncture, AROM Ankle Range Of Motion, EA electroacupuncture, KT kinesiotaping, ITU Intense Therapeutic Ultrasound, SROMs subject-reported outcome measure, CNP comparative non-randomized prospective, MRI magnetic resonance imaging, AOFAS American Orthopedic Foot and Ankle Society, ST strength training and stretching, RPS randomized pilot study, FAI foot and ankle outcome instrument, MPC monophasic pulsed current, CC case–control, NR not reported, NA not applicable, SWV shear wave velocity, axSPA Axial spondyloarthritis, ROI region of interest, Pts patients
Twenty-six of the 30 articles [35, 36, 38, 41–58, 60–64] assessed the efficacy of different treatments on PF in patients with PFS using ultrasound (Table 3). As shown in Table 3, in 8 of the 26 articles, ultrasound was used as both an evaluating modality for assessment the PF thickness along with its alterations and a guided-treatment tool in patients with PFS who underwent the different interventions. In 5 of the 8 articles, the PF thickness was assessed alone using B-mode ultrasound. In 2 of the 8 articles, the combining PF thickness and echogenicity were monitored and recorded. In one article, the B-mode and color Doppler ultrasound evaluated the PF thickness, echogenicity and vascularity.
Table 3.
Details of studies using US evaluating the PF in patients with PFS underwent different interventions
| References | Sample size | Des | objective | Outcome measures | Position for assessment | Measurement tools | Type of intervention | Site of measurement | Follow-up | Conclusion |
|---|---|---|---|---|---|---|---|---|---|---|
| [35] | 22 pts (10 ESWT vs 12 sham-ESWT) | RCT | To investigate the efficacy and tolerability of ESWT in patients with PFS in axSpA | Pain, foot function, PF thickness and morphology | Prone with full knee extension and 90° dorsiflexion of the ankle | B-mode US, VAS, heel pressure algometry, FFI | ESWT vs sham-ESWT | At 5 mm distal to the calcaneal insertion from the medial aspect | At baseline, 1, 4, 8 weeks after the last therapy | ESWT was a safe and tolerable physical therapy to improve chronic heel pain due to PFS in patients with axSPA with no significant effect on PF |
| [36] | 59 pts (29 rESWT vs 30 DPI) | RCT | To compare the effects of US-guided DPI with rESWT in the treatment of chronic PFS | Pain intensity, daily life and exercise activities, PF thickness | NR | B- mode US, VAS and FAAM | rESWT vs DPI | At the calcaneus insertion | At baseline, 6 weeks and 12 weeks after the treatment | DPI could reduce pain and PF thickness compared to rESWT in patients with PFS |
| [38] | 40 pts (20 DPI and 20 CSI) | RCT | To valuate and compare the effect of ultrasound-guided DPI vs CSI in chronic PFS | Pain, foot function, PF thickness and area of hypoechogenic-ity | Prone position with the ankle at 90° | NRS, B-mode US, FAAM-A FAAM-S) | DPI vs CSI | Both PF thickness and area of hypoechogenici-ty at the insertion and 1 cm distal to the insertion zone | At 2 and 12 weeks after injection | CSI may reduce pain, PF thickness better early, but both CSI and DPI have similar effects for a few months (up to 12 weeks) |
| [41] | 38 (19 PDRN and 19 CSI) | RCT | To compare the efficacy and safety of PDRN injection and CSI for PFS | Pain, thickness and echogenicity of PF | NR | B-mode US, VAS and MOXFQ | PDRN injection vs CSI | NR | VAS at baseline; 1, 2, 6 and 24 weeks and 6 ms post-treatment MOXFQ at baseline,6 weeks and 6 ms after treatment PF thickness at baseline, 6 ms after treatment | CSI has a positive clinical effect at short-term follow-up as compared to PDRN. No differences between PF thickness and echogenicity was found between two groups |
| [42] | 80 pts (40 ESWT and 40 CSI) | RCT | To compare and evaluate the therapeutic effects of ultrasound-guided CSI vs medium frequency ESWT in the treatment of PFS | Pain, foot function, PF thickness | NR | B-mode US, VAS, FFI and HTI score | ESWT vs CSI | At insertion of the fascia into the calcaneal tubercle | At baseline, 3, and 6 ms after treatment | The patients were not satisfied with the rESWT technique if it was applied as a primary treatment protocol |
| [43] | 22 pts (one group received ESWT) | LF | To evaluate the changes in PF stiffness pre and post ESWT in patients with PFS | Pain, PF thickness and stiffness | Prone position with 90° of knee flexion in the neutral ankle position | VAS, B-mode US and SEG | ESWT | NR | At baseline, at 1 wk, 1 m, 3 m, 6 m, and 12 m after ESWT | The heel pain and PF thickness reduced gradually over 12 ms after ESWT. The PF stiffness reduced during the first wk and increased afterthat; at the 12 ms follow-up, stiffness was higher before ESWT |
| [44] | 75 pts (38 HA and 37 CSI) | RCT | To assess the effectiveness of HA injection in reducing the symptoms of PFS compared to CSI | Pain and PF thickness, foot function and Foot and Ankle Ability | Prone position, 90° knee flexion with ankle in neutral position | B-mode US, VAS, FAAI, PPT and FFI | US-guided injection of HA vs CSI | NR | At baseline, 6 weeks and 24 weeks after the injection | Both CSI and HA resulted a better outcomes for PF as well as reducing pain and improving function |
| [45] | 102 pts (51 HILT and 51 LLLT) | RCT | To evaluate and compare the efficacy of HILT and LLLT for PFS | Pain and PF thickness | Prone position with the feet hanging in end of table | B-mode, VAS and pressure algometry | HILT vs LLLT | At the calcaneus insertion zone | At baseline, 0–3 weeks and 3–4 weeks follow-up | There was no significant effect between both groups |
| [46] | 60 pts (30 DP and 30 controls given saline) | RCT | To evaluate the therapeutic effects of DP in the treatment of PFS compared to control group | Pain, foot disability, PF thickness | Prone with the ankle placed in the neutral position | B-mode, VAS-A, VAS-R and FFI | DP vs control group (given saline) | NR | At baseline, at 7 and 15 weeks post-treatment | Improvement in PF thickness, foot function and pain was significantly higher in DP group than in control group |
| [47] | 44 pts (22 MPC vs 22MPC + SE) | RCT | To assess the effect of MPC and MPC + PF-SE on heel pain and PF thickness in treatment of PFS | Pain and PF thickness | Prone, foot hanging over the edge of table with ankle in neutral position | B-mode US and VAS | MPC only vs MPC + PF-SE | At the calcaneus insertion and within 5 mm from calcaneus insertion | At baseline, 4 weeks post-treatment | MPC can reduce the PF thickness but MPC combined with PF-SE is not better than MCP only in reduction heel pain and PF thickening |
| [48] | 94 (44 pts and 50 healthy controls) | RCT | To determine the efficacy of high-resolution US in the evaluation of PF in patients with heel pain | PF thickness | Prone with foot hanging over the edge of the table with ankle in dorsiflexion | B-mode | NA | Within 1 cm from calcaneal attachment | NA | PFS can be easily diagnosed by US with PF > 4 mm in thickness |
| [49] | 96 pts (49 ESWT vs 47 local CSI) | Block RCT | To evaluate the therapeutic clinical effects of local CSI and ESWT in treatment of PFS | Pain, disability and PF thickness | NR | B-mode, VAS and FFI | local CSI vs ESWT | at point where the PF crosses the anterior aspect of the inferior border of the calcaneus | At baseline, 1 m, 3 ms and 6 ms | Both ESWT and local CSI resulted in clinical improvement and PF thickness at follow-up but foot function have no significant difference between both groups |
| [50] | 120 (60 EA, 30 SA, 30 controls) | RCT | To compare the efficacy of EA and SA versus waitlist control for improving the pain in patients with chronic PFS | Pain, disability, PF thickness | Prone position | B-mode, VAS, PPT, AROM and FAAM | EA vs SA vs non-treatment control | At the thickest portion closest to the calcaneal insertion in its medial tuberosity | At baseline, 4 weeks, with a 12-weeks follow-up | Assessment of PF thickness may detect the anatomical changes that occur in the PF after acupuncture |
| [51] | 78 pts (36 KT vs 42 ESWT) | RCT | To compare the efficacy of KT and ESWT in the management of PFS | Pain, foot function and PF thickness, heel fat pad thickness | Prone position with an ankle in neutral position | B-mode US, VAS and FFI | KT vs ESWT | NR | At baseline and 6 weeks after treatment | Both KT and ESWT reduced the pain levels and improved quality of life in PFS patients. In both groups, the PF thickness has decreased whereas fat pad thickness has increased; however, the differences was not significant |
| [52] | 33 patients | Pivotal clinical trial | To assess the efficacy, safety and tolerability of ITU combined with standard-of-care in the management of chronic PFS | Pain, foot function, level of activity Hypoechoic area changes | NR | B-mode US-SROMs, VAS, FFI and FAAM | standard conservative care alone and Combining with ITU | NR | At baseline and 4, 8, 12 and 26 weeks after treatment | ITU has reported to be effective, safe, and well tolerated option Hypoechoic areas were gradually decreased in size at follow-up |
| [53] | 40 pts (20 PRP vs 20 CSI) | CNP | To evaluate the efficacy and imaging changes between PRP and CSI in the treatment of PFS | Pain, PF thickness, echogenicity, vascularity and function | NR | VAS, AOFAS, B-mode US, MRI | PRP vs CSI | NR | US was done at baseline, 3 and 6 ms MRI was done at baseline and 6 ms, VAS and AOFAS results was evaluated at baseline, 6 and 12 ms after treatment | The PF thickness has significantly decreased at 3-ms follow-up in both groups. The echogenicity and vascularity have significantly reduced at 3 and 6-ms follow-up in PRP group only. Thus, PRP injection is a safe and more efficient than CSI in treatment of PFS |
| [54] | 60 pts (30 PRP vs 30 CSI) | RCT | To evaluate the effectiveness of local injection of PRP and CSI in the treatment of chronic PFS | Pain, PF thickness and function | NR | B-mode US, VAS and AOFAS score | PRP vs CSI | NR | At baseline, 6 weeks, 3 ms and 6 ms follow-up after injection | Over the time, PRP local injection was an effective treatment in improving the pain levels, foot function and PF thickness compared to CSI |
| [55] | 34 patients (17 ESWT vs 17 LLLT) | RCT | To compare the efficacy of ESWT and LLLT on PF thickness, heel pain, and foot functions in patients with PFS | Pain, foot function and PF thickness | Prone position with knees fully extended and ankles in a neutral position | B-mode US, VAS and FFI | ESWT vs LLLT | At the point where PF is inserted into medial calcaneal tubercle | At baseline, immediate after the treatment, and after 1 m | Both ESWT and LLLT have a clinical improvement such as reducing pain and improving foot functions as well as reducing PF thickness in patients with PFS |
| [56] | 90 patients -30 ST - 31 CSI - 29 combined ST + CSI | RCT | To evaluate the effects of ST, local CSI, or combined ST and CSI on chronic PFS | Pain, foot function and PF thickness | Prone with 90º flexed, foot hanging on the edge of table in neutral position | B- mode US, VAS and FFI | ST, CSI and combined ST + CSI | nr | -VAS and FFI at baseline and 6 ms post therapy -US at baseline, 1,2,3,6,12 ms post therapy | the combination of CSI and ST had a superior effect on pain, foot function and PF thickness at all time points in patients with PFS as compared with either CSI or ST treatment |
| [57] | 30 pts (15 ozone injection) vs 15 CSI) | RCT | To determine the effects of ozone injection and CSI in the treatment of chronic PFS | Pain, activity and PF thickness | Prone position with their feet hanging over the edge of the table | VAS, B-mode and FAAM | Ozone (O2–O3) injection vs CSI | At insertion and 1 cm distal to its insertion into the medial calcaneal tubercle | At baseline, 2 and 12 weeks after injection | Ozone injection and CSI were effective in long term and short term, respectively. Both Ozone injection and CSI were observed to reduce pain and PF thickness and enhance foot function |
| [58] | 64 pts (36 PRP injection vs 28 KT) | RCT | to compare the effectiveness of PRP vs KT with phonophoresis in the treatment of chronic PFS | Disability and activity and PF thickness | prone Position with ankle in a neutral position | NRS, FFI and B-mode US | PRP vs KT with phonophores-is | At calcaneal attachment | NRS at baseline, 2,6,12 and 24 weeks FFI and US at baseline, 6,12 and 24 weeks | PRP was better in relief pain in short time follow-up whereas it is better in improving NRS, functional status and PF thickness in long time follow-up compared to KT with phonophoresis |
| [60] | 110 pts (55 ESWT vs 55 CSI) | RCT | To assess efficacy of CSI and ESWT in PFS patients to determine the correlation between clinical outcomes and the PF thickness | Pain and PF thickness | NR | VAS, 100-points scoring systems and B-mode US | ESWT vs CSI | At insertion and 5 mm distal to calcaneus tuberosity | At baseline, 4 and 12 wk | The positive changes in PF after ESWT treatment is given better clinical outcomes in PFS patients |
| [61] | 80 pts(40 PRP vs 40 CSI) | RCT | To evaluate the efficacy of local CSI vs PRP in the management of PFS | Pain, activity, foot function and PF thickness | NR | VAS, modified Roles and Maudsley score, FAI, AOFAS, B-mode US | PRP vs CSI | NR | At baseline at 1 m, 3 ms, and 6 ms after treatment | Both CSI or PRP was equally effective on clinical outcomes and PF thickness in patients with PFS |
| [62] | 72 pts (36 rESWT vs 36 CSI) | RCT | To compare the clinical and sonographic effects of rESWT and CSI in patients with PFS | Pain, function and PF thickness and echogenicity | NR | VAS, FFI, HTI score and B-mode US | rESWT vs CSI | At the point where PF inserted into calcaneal tuberosity | At baseline and 1, 3, and 6 ms after treatment | rESWT noted to be superior to CSI in improving clinical outcomes and PF changes due to its long-term action |
| [63] | 60 pts (40 ESWT vs 20 controls) | LF | To evaluate the efficacy of ESWT in the treatment of chronic PFS in patients with calcaneal spur using US | Pain, function and PF thickness | Prone with toes placed over the end of the examination table | VAS, Maudsley score, x-ray and B-mode US | ESWT | At 2 cm distal to the calcaneal insertion | At baseline and 8 weeks after treatment | PF has thickened in calcaneal spur patients. ESWT found to decrease the PF thickness and improve pain and function significantly |
| [64] | 30 pts (15 PRP vs 15 dry needling) | RCT | To compare the treatment effects of PRP and dry needling on chronic PFS | Foot function, PF thickness, echogenicity and vascularity | NR | FFI, B-mode and power Doppler US | PRP vs dry needling of myofascial meridian trigger points | NR | At baseline, 6 and 12 weeks after treatment | A clinical and US improvement were observed in PRP group at 12-weeks follow-up in patients with chronic PFS |
In other 18 articles, ultrasound was used as only the assessment tool for imaging PF changes in patients with PFS before and after treatment. In 12 of the 18 articles have evaluated the PF thickness alone using B-mode ultrasound. In 4 more articles, the PF thickness along with its observation changes such as echogenicity, stiffness, vascularity or morphology were evaluated using B-mode, color Doppler or SWE. In another article, the heel fat pad thickness combined with PF thickness have been measured and recorded. The remaining one article has only investigated the hypoechoic area changes within and around PF and the size of area was recorded at pre and post intervention.
Four of the 30 articles [37, 39, 40, 59] were carried out to evaluate sonographically the PF thickness as well as fascial alterations between patients with PFS and healthy subjects that have no underwent therapeutic interventions (Table 4). One of the 4 articles has measured the PF thickness without evaluation of the fascial changes. In two more articles, combining the PF thickness and fascial stiffness were assessed using B-mode and SWE, respectively. The remaining one article was carried out to evaluate the PF thickness, stiffness and hyperemia using B-mode, SWE and color Doppler ultrasound, respectively.
Table 4.
Details of studies conducted on the evaluation of PF changes between patients with PFS and healthy subjects using US
| References | Sample size | Des | Objective | Outcome measures | Position for assessment | Measurement tools | Type of intervention | Site of measurement | Follow-up | Conclusion |
|---|---|---|---|---|---|---|---|---|---|---|
| [37] | 38 pts (19 PFS pts vs 21 healthy controls) | CC | To compare stiffness of PF between patients with PFS and healthy subjects using SWE and to correlate SWE values with clinical scores | PF thickness, SWV and stiffness, clinical scores | Prone position with foot hanging over the end of table | B-mode US, SWE, VAS, FFI | NA | 1 cm distally from the calcaneal insertion | NA | SWE allows quantitative evaluation of the elasticity of the PF and can show PFS alterations. SWE shows a strong correlation with clinical scores |
| [39] | 108 pts (87 pts and 21 healthy subjects) | CC | To evaluate the PF between healthy subjects and PFS patients by SWE with correlation to B-mode and CDUS and to establish cut-off values | PF thickness, vascularity grades, SWV and stiffness | NR | B-mode, color Doppler US and SWE | NA | Thickness was measured at calcaneus insertion. ROI was set within the thickest part of the PF. CDUS was applied on whole fascia | NA | SWE was able to quantitatively assess the PF stiffness, which reduces in patients with PFS. PF was thickened in PFS compared to healthy fascia No correlation of vascularity was found between both groups |
| [40] | 82 pts (39 PFS, 23 unilateral healthy foot and 20 bilateral healthy feet) | CC | To determine the diagnostic potential of SWE and the correlation of clinical scores to SWE values | PF thickness, clinical scores, SWV and stiffness | Prone position with the foot hanging over the edge of table | B-mode, SWE, AOFAS and FFI | NA | At the calcaneus insertion; + 1 cm distal of the calcaneus and central part of the calcaneus | NA | SWE appears to enhance the diagnostic accuracy in patients with PFS as compared with B-mode US |
| [59] | 40 subjects (20 PFS pts vs 20 controls) | CC | To determine the influence of MTP joint extension on PF thickness in healthy subjects compared to those unilateral PFS | PF thickness measured at rest, 30° of MTP joints extension and maximalpossible extension | Prone, the foot over the edge of the table and the ankle in neutral position | B-mode | NA | At the anterior margin of the calcaneus | NA | MTP joint position was effective in the measurement of PF thickness |
Nine of the 30 articles [35, 37, 39, 40, 46, 48, 50, 59, 63] have included matched control groups. As outlined in Table 5, 7 of the 9 articles have included healthy subjects with no intervention (negative control). 4 of the 7 articles were carried out as case–control studies design having only two groups; PFS group with no intervention and healthy subjects. Other three were experimental studies as follows: one study included three groups; two of them with PFS received either treatment group or sham-treatment group (positive controls) and one group was healthy. Two studies had two groups in which one group with PFS was subjected to treatment whereas other had no PFS and had no exposure to treatment. The remaining two of the 9 studies were designed as experimental studies having two groups with PFS; one group underwent the treatment “study group” and other was subjected to sham-treatment.
Table 5.
Matching control studies in evaluating the PF changes under different conditions using ultrasound
| References | Sample size | Des | Objective | Outcome measures | Position for assessment | Measurement tools | Type of intervention | Site of measurement | Follow-up | Conclusion |
|---|---|---|---|---|---|---|---|---|---|---|
| [35] | 22 pts (10 ESWT vs 12 sham-ESWT) | RCT | To investigate the efficacy and tolerability of ESWT in patients with PFS in axSpA | Pain, foot function, PF thickness and morphology | Prone with full knee extension and 90° dorsiflexion of the ankle | B-mode US, VAS, heel pressure algometry, FFI | ESWT vs sham-ESWT | At 5 mm distal to the calcaneal insertion from the medial aspect | At baseline, 1, 4, 8 weeks after the last therapy | ESWT was a safe and tolerable physical therapy to improve chronic heel pain due to PFS in patients with axSPA with no significant effect on PF |
| [37] |
38 pts (19 PFS pts vs 21 healthy controls) |
CC | To compare stiffness of PF between patients with PFS and healthy subjects using SWE and to correlate SWE values with clinical scores | PF thickness, SWV and stiffness, clinical scores | Prone position with foot hanging over the end of table | B-mode US, SWE, VAS, FFI | NA | 1 cm distally from the calcaneal insertion | NA | SWE allows quantitative evaluation of the elasticity of the PF and can show PFS alterations. SWE shows a strong correlation with clinical scores |
| [39] | 108 pts (87 pts and 21 healthy subjects) | CC | To evaluate the PF between healthy subjects and PFS patients by SWE with correlation to B-mode and CDUS and to establish cut-off values | PF thickness, vascularity grades, SWV and stiffness | NR | B-mode, color Doppler US and SWE | NA | Thickness was measured at calcaneus insertion. ROI was set within the thickest part of the PF. CDUS was applied on whole fascia | NA | SWE was able to quantitatively assess the PF stiffness, which reduces in patients with PFS. PF was thickened in PFS compared to healthy fascia No correlation of vascularity was found between both groups |
| [40] | 82 pts (39 PFS, 23 unilateral healthy foot and 20 bilateral healthy feet) | CC | To determine the diagnostic potential of SWE and the correlation of clinical scores to SWE values | PF thickness, clinical scores, SWV and stiffness | Prone position with the foot hanging over the edge of table | B-mode, SWE, AOFAS and FFI | NA |
At the calcaneus insertion; + 1 cm distal of the calcaneus and central part of the calcaneus |
NA | SWE appears to enhance the diagnostic accuracy in patients with PFS as compared with B-mode US |
| [46] | 60 pts (30 DP and 30 controls given saline) | RCT | To evaluate the therapeutic effects of DP in the treatment of PFS compared to control group | Pain, foot disability, PF thickness | Prone with the ankle placed in the neutral position | B-mode, VAS-A, VAS-R and FFI | DP vs control group (given saline) | NR | At baseline, at 7 and 15 weeks post-treatment | Improvement in PF thickness, foot function and pain was significantly higher in DP group than in control group |
| [48] | 94 (44 pts and 50 healthy controls) | RCT | To determine the efficacy of high-resolution US in the evaluation of PF in patients with heel pain | PF thickness | Prone with foot hanging over the edge of the table with ankle in dorsiflexion | B-mode | NA | Within 1 cm from calcaneal attachment | NA | PFS can be easily diagnosed by US with PF > 4 mm in thickness |
| [50] | 120 (60 EA, 30 SA, 30 controls) | RCT | To compare the efficacy of EA and SA versus waitlist control for improving the pain in patients with chronic PFS | Pain, disability, PF thickness | Prone position | B-mode, VAS, PPT, AROM and FAAM | EA vs SA vs non-treatment control | At the thickest portion closest to the calcaneal insertion in its medial tuberosity | At baseline, 4 weeks, with a 12-weeks follow-up | Assessment of PF thickness may detect the anatomical changes that occur in the PF after acupuncture |
| [59] | 40 subjects (20 PFS pts vs 20 controls) | CC | to determine the influence of MTP joint extension on PF thickness in healthy subjects compared to those unilateral PFS | PF thickness measured at rest, 30° of MTP joints extension and maximal possible extension | Prone with the examined foot over the edge of the table and the ankle in neutral position | B-mode | NA | At the anterior margin of the calcaneus | NA | MTP joint position was effective in the measurement of PF thickness |
| [63] | 60 pts (40 ESWT vs 20 controls) | LF | To evaluate the efficacy of ESWT in the treatment of chronic PFS in patients with calcaneal spur using US | Pain, function and PF thickness | Prone with toes placed over the end of the examination table | VAS, Maudsley score, x-ray and B-mode US | ESWT | At 2 cm distal to the calcaneal insertion | At baseline and 8 weeks after treatment | PF has thickened in calcaneal spur patients. ESWT found to decrease the PF thickness and improve pain and function significantly |
Discussion
This study was carried out to systematically review published articles that assessed the PF in patients with PFS using ultrasound under different conditions from 2017 to 2022 (Table 2). Thirty studies conducted to evaluate the PF alterations and its thickness in patients with PFS underwent different intervention or compared to those with healthy subjects using different ultrasound modes such as B-mode, color Doppler or SWE. In these studies, ultrasound was used as assessment modality alone or combined with guide therapeutic for evaluation for evaluation the PFS. Based on the results of this systematic review, using ultrasound as assessment tool was available, low cost, safe and reliable in evaluating of PF changes.
In this review, all studies found that the PF thickness and/or fascial alterations was reliable in diagnosis of the PFS. In meanwhile, several differences of methods were observed among the previous studies during this review. The major differences were noted in sample size, study design, type of intervention, measurement tool and methods, sonographic features of PF (thickness, echogenicity, vascularity or stiffness) and follow-up period. In this review, majority of the reviewed articles showed that a monitoring of PF thickness and intrafascial changes are considered as a key role in the assessment of PFS using ultrasound particularly during follow-up treatment.
Assessment of PF thickness and fascial alterations after different interventions
As presented in Table 3, there 26 studies have sonographically assessed the different interventions such as injection, ESWT, manual physiotherapy, high-intensity laser therapy (HILT), low-level laser therapy (LLLT), Electroacupuncture (EA), Kinesiotaping (KT), Intense Therapeutic Ultrasound (ITU) and Monophasic Pulsed Current (MPC) in patients with PFS.
In 8 out of the 26 studies [36, 38, 42, 44, 57, 58, 62, 64], the ultrasound was used as assessment tool combined with guided treatment injection in PFS patients. These studies that were designed as randomized controlled trials showed that the use of ultrasound to guide injection and evaluate the PF changes was an effective modality. The trials assessed the efficacy of ultrasound-guided injection of different treatments in patients with PFS. All outcome measures were assessed at baseline and after treatments. The primary outcomes measured were as follows: pain by visual analog scale (VAS), daily life and exercise activities by Foot and Ankle Ability Measure (FAAM), and foot function by foot function index (FFI). The secondary outcomes measured by ultrasound were PF thickness alone or combined with PF echogenicity or vascularity or both. For example, five studies [36, 42, 44, 57, 58] assessed the PF thickness alone using B-mode ultrasound at baseline and at follow-ups interventions. Other two studies [38, 62] assessed both PF thickness and fascial echogenicity in order to evaluate the effects of treatments in patients with PFS. One study [64] investigated combining PF thickness, echogenicity and vascularity using B-mode and color Doppler ultrasound in patients with PFS at pre and post intervention. All these studies concluded that ultrasound was an effective, safe, tolerable and accurate to use as a guide-therapeutic and assessment tool in evaluation of patients with PFS.
The remaining 18 articles used the ultrasound with different modes as only assessment tool to evaluate the improvements of PF thickness alone or combined with intrafascial or perifascial changes in patients with PFS undergoing different interventions. In which four articles [35, 41, 43, 53] assessed the combining PF thickness and its fascial changes using different ultrasound modes. For example, a longitudinal follow-up study [43] evaluated the PF thickness and stiffness pre and post extracorporeal shockwave therapy (ESWT) in 22 patients with PFS. The PF thickness and stiffness were evaluated by B-mode and strain elastography, respectively. The PF changes was evaluated at baseline and at 1-week, 1-month, 3-month, 6-month, and 12-month e after ESWT. The study concluded that PF stiffness reduced at the first week and then increased at the 12-months after treatment. However, the PF thickness decreased gradually during 12-months follow-up intervention.
In single-center, non-randomized prospective study [53], forty patients with PFS received either platelet-rich plasma (PRP) injection (20 patients) or corticosteroid injection (CSI) (20 patients). The imaging assessment of the outcome measures were performed by ultrasound and magnetic resonance imaging (MRI). However, the ultrasound assessed the following outcome measures at baseline, 3 and 6 months; PF thickness and echogenicity by B-mode and neovascularization by color Doppler. The authors concluded that PF thickness has significantly reduced at 3-months after injection in both groups. The echogenicity and vascularity, however; have significantly reduced at 3- and 6-months after PRP injection only.
A double-blinded, randomized clinical trial [41] included 39 patients with PFS divided into two groups: 39 patients received polydeoxyribonucleotide (PDRN) versus 39 patients CSI. The outcomes measured by ultrasound included PF thickness and fascial echogenicity. The sonographic outcomes were evaluated at baseline and 6 months after injection. The studies concluded that PF echogenicity was significantly different within CSI group during follow-up injection whereas PF thickness did not differ intragroups. However, there were no significant different of PF thickness and echogenicity between both groups.
A prospective double-blinded randomized controlled [35] investigated the PF thickness and morphology of 22 patients divided into two groups: ESWT group and sham-ESWT group. The PF thickness and morphology of PF included (echogenicity, convexity and perifascial fluid) were assessed at baseline, 1, 4, 8 weeks after treatment. The trial revealed no changes in PF thickness pre and post intervention in both groups. However, the authors showed that alterations in the PF morphology such as decreased hypoechogenicity, increased convexity and presence perifascial fluid are considered as sonographic features of PFS.
A single-center, single-blinded, randomized clinical trial [51] conducted on 78 patients with PFS divided into two groups; 36 patients were subjected to Kinesiotaping (KT) and 42 patients were exposure to ESWT. The outcomes measured by ultrasound were PF thickness and heel fat pad thickness. The findings were monitored at baseline and 6-weeks after treatments. In both groups, the study concluded that PF thickness decreased after treatment whereas heel fat pad thickness increased.
A another single-blinded, pivotal clinical trial study [52] conducted on 33 patients with chronic PFS. The patients were exposure to intense therapeutic ultrasound (ITU) combined with standard conservative treatment at 0 (baseline), 4, 8, 12 and 26 weeks after treatments. The hypoechoic areas were only outcome measured by ultrasound. Perifascial and intrafascial hypoechoic areas/lesions were diagnosed in all patients and the size of area/lesion was measured at each follow-up visit. The study findings revealed that hypoechoic areas decreased gradually during follow-up period.
In the remaining 12 studies [45–50, 54–56, 60, 61, 63], different interventions were applied on different trials and different follow-up periods. In all these trials, the outcome measured by ultrasound was only PF thickness. The changes in PF thickness were different among the studies. For example, Naruseviciute and Kubilius [45], showed that the difference of PF thickness between groups after intervention was not significant. Mansiz-Kaplan et al. [46] concluded that there were improvements in PF thickness in intra – and intergroups after treatments. Xu et al. [49] found a significant improvement of PF thickness at 3- months in one group and 3- and 6- months in other group compared to the baseline values. Furthermore, a significant reduction in PF thickness was found between groups at 6-months follow-up. The remaining 8 articles stated that PF thickness was significantly improved between groups after treatments in PFS patients.
Evaluating of PF thickness and its alterations between PFS patients and healthy controls with no intervention
As shown in Table 4, Four studies [37, 39, 40, 59] compared the PF changes including thickness, stiffness and neovascularization between patients with and without PFS. Baur et al. [39] evaluated 108 unilateral PF including 87 with PFS and 21 healthy. The PF thickness, stiffness and vascularity were assessed in all subjects using B-mode, SWE and color Doppler, respectively. The study showed that shear wave velocity (SWV) and stiffness were significantly higher in healthy subjects than in patients. SWV and stiffness had sensitivity 79.31% and 80.46%, respectively; whereas had specificity 80.95% for both. The PF thickness was observed to be thicker in PFS patients than in healthy controls. There was no correlation between color Doppler and PF thickness with SWE measurements. Therefore, the study concluded that SWE represents an independent parameter in detecting PFS.
Two studies conducted by Schillizzi et al. [37] and Gatz et al. [40] compared the PF thickness and stiffness features between patients with PFS and healthy subjects and correlated the SWE values with clinical scores. The studies showed that SWE can be quantitatively assessed the stiffness of PF and can diagnose PFS changes. SWE was strongly correlated with clinical scores. The SWE measured the PF stiffness and SWV and B-mode measured the PF thickness can improve the diagnostic accuracy of ultrasound in diagnosis the PFS.
Granado et al. [59] investigated and compared the effectiveness of metatarsal phalangeal (MTP) joints extension on PF thickness in 40 subjects divided into two groups (20 unilateral PFS and 20 healthy subjects). The PF thickness was evaluated at rest, 30 degrees of extension from the plantar aspect, and maximal extension as much as possible. The study found that PF thickness reduced significantly with MTP joints extension in both PFS and healthy groups. Therefore, the study concluded that PF thickness could be influenced by MTP joints extension. Thus, the researchers recommended that PF thickness should be measured with toes at rest.
Comparing the PF changes between study group and matching control
As outlined in Table 5, 9 studies with different designs [35, 37, 39, 40, 46, 48, 50, 59, 63] evaluated PF changes in patients with PFS and control groups with or without interventions. Two randomized controlled trials [35, 46] conducted to evaluate the PF changes in patients with PFS underwent different interventions for different intervals. The PFS patients were divided into two groups: treatment group and placebo group. Caner et al. [35] observed no changes in PF thickness pre and post intervention in treatment group and placebo group. However, Mansiz-Kaplan et al. [46] stated that PF was significantly thicker in treatment group than in placebo group. Four case–control studies [37, 39, 40, 59] evaluated the PF thickness and its observation changes in patients with PFS and healthy subjects with no interventions using different ultrasound modes. Three more experimental studies [48, 50, 63] investigated PF thickness alone using ultrasound in patients with PFS received a treatment and healthy volunteers. In the latter three studies, PF thickness increased in patients with PFS as well as responded to the treatment as compared to healthy subjects.
Conclusion
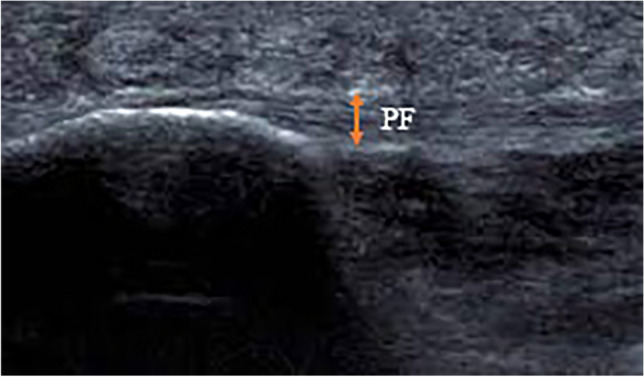
This study was designed to systematically review published articles from 2017 to 2022 regarding the application of the ultrasound in evaluating the PF changes in patients with PFS. When the published articles have been reviewed, many differences were noted in methodology, sample size, study design, intervention and duration of follow-up. The findings revealed that ultrasound is reliable, accurate, safe, and non-invasive imaging tool in the assessment of PF changes, therapeutic guiding and observing different treatments in patients with PFS. The most suitable site to evaluate the PFS is at the point where PF is inserted into medial calcaneal tubercle and 1 cm distal to its insertion. The longitudinal scan is considered as the best scan for imaging the PF in which the probe is placed on the line between medial tuberosity of the calcaneus and the second finger over the PF. The thickness, echogenicity, vascularization and stiffness of the PF are the most sonographic outcome measures used in the evaluation of the PFS using B-mode, color doppler and SWE (Figs. 2, 3, 4, 5 and 6).
Fig. 2.
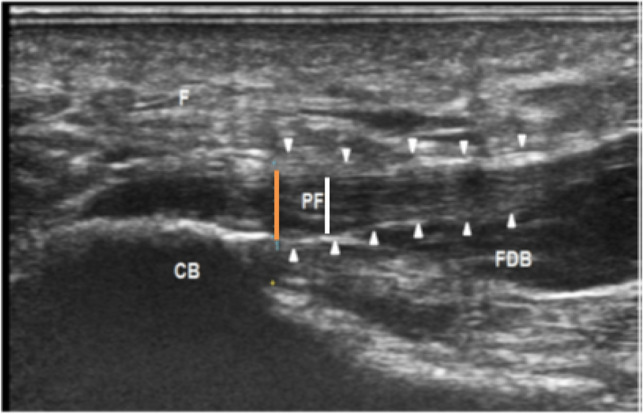
A longitudinal sonographic scan of a patient with PFS, showing the measurement of the PF thickness (arrowhead) at calcaneal insertion (orange line) and 1 cm distal to the insertion (white line). CB calcaneus bone, F fat pad, FDB flexor digitorum brevis muscle, PF plantar fascia (adopted from Ref. [36])
Fig. 3.
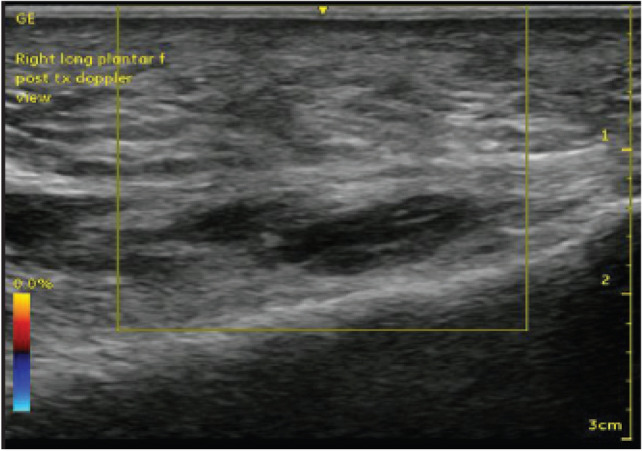
Color Doppler ultrasound images of the PF, showing no neovascularization in PF (adopted from Ref. [65])
Fig. 4.
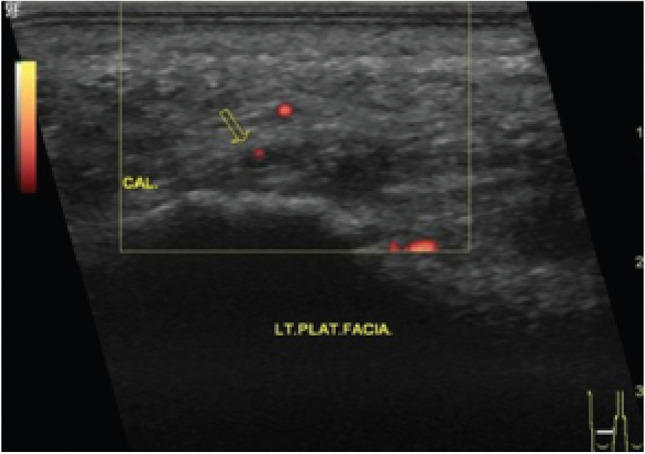
Power Doppler ultrasound of PF showing one single vessel (adopted from Ref. [64])
Fig. 5.

A longitudinal SWE and B-mode ultrasound images of normal PF shows stiffness of 98.8 kPa and SWV value of 5.7 m/s (adopted from Ref. [39])
Fig. 6.

A longitudinal ultrasound images of PF. Normal appearance of asymptomatic plantar fascia (left) and chronic PFS with hypoechoic lesion (right) (adopted from Ref. [52])
Acknowledgements
We thank Sarah Qahtan Mohammed Salih at Faculty of Computer Science and Information Technology/Department of Software Engineering, University Putra Malaysia for her help in performance this review.
Authors’ contributions
All authors contributed to this review. The review was written by Abdul Sattar Arif Khammas. The supervision of conducting this research was performed by Rozi Mahmud. The full article was reviewed by Hasyma Abu Hassan. The articles which included in the review was selected by Idris Ibrahim. The proofreading was done Safwan Saeed Mohammed.
Funding
The authors declare that no funds, grants, or other support were received during the preparation of this manuscript.
Declarations
Conflict of interest
The authors declare that they have no conflict of interest.
Ethical approval
There no ethical approval has applicable for this review article
Human rights and informed consent
This review does not include any study with human subjects conducted by any of the authors.
Consent to Participant
There are no participants included.
Footnotes
Publisher's Note
Springer Nature remains neutral with regard to jurisdictional claims in published maps and institutional affiliations.
References
- 1.Angin S, Crofts G, Mickle KJ, Nester CJ. Ultrasound evaluation of foot muscles and plantar fascia in pes planus. Gait Posture. 2014;40(1):48–52. doi: 10.1016/j.gaitpost.2014.02.008. [DOI] [PubMed] [Google Scholar]
- 2.Cocco G, Ricci V, Boccatonda A, Abate M, Guagnano MT, Schiavone C. Ultrasound follow-up of spontaneous tears of the plantar fascia treated with conservative therapies: two case reports. Medicine. 2019;98(52):e18428. doi: 10.1097/MD.0000000000018428. [DOI] [PMC free article] [PubMed] [Google Scholar]
- 3.Ehrmann C, Maier M, Mengiardi B, Pfirrmann CW, Sutter R. Calcaneal attachment of the plantar fascia: MR findings in asymptomatic volunteers. Radiology. 2014;272(3):807–814. doi: 10.1148/radiol.14131410. [DOI] [PubMed] [Google Scholar]
- 4.Lemont H, Ammirati KM, Usen N. Plantar fasciitis: a degenerative process (fasciosis) without inflammation. J Am Podiatr Med Assoc. 2003;93(3):234–237. doi: 10.7547/87507315-93-3-234. [DOI] [PubMed] [Google Scholar]
- 5.Fuiano M, Mosca M, Caravelli S, Massimi S, Benedetti MG, Di Caprio F, et al. Current concepts about treatment options of plantar fibromatosis: a systematic review of the literature. Foot Ankle Surg. 2019;25(5):559–564. doi: 10.1016/j.fas.2018.06.001. [DOI] [PubMed] [Google Scholar]
- 6.Oatis CA. Kinesiology: the mechanics and pathomechanics of human movement. Lippincott Williams & Wilkins; 2009. [Google Scholar]
- 7.Aldridge T. Diagnosing heel pain in adults. Am Fam Phys. 2004;70(2):332–338. [PubMed] [Google Scholar]
- 8.Grasel R, Schweitzer M, Kovalovich A, Karasick D, Wapner K, Hecht P, et al. MR imaging of plantar fasciitis: edema, tears, and occult marrow abnormalities correlated with outcome. AJR Am J Roentgenol. 1999;173(3):699–701. doi: 10.2214/ajr.173.3.10470906. [DOI] [PubMed] [Google Scholar]
- 9.Cleland JA, Abbott JH, Kidd MO, Stockwell S, Cheney S, Gerrard DF, et al. Manual physical therapy and exercise versus electrophysical agents and exercise in the management of plantar heel pain: a multicenter randomized clinical trial. J Orthop Sports Phys Ther. 2009;39(8):573–585. doi: 10.2519/jospt.2009.3036. [DOI] [PubMed] [Google Scholar]
- 10.Renan-Ordine R, Alburquerque-SendÍn F, Rodrigues De Souza DP, Cleland JA, Fernández-De-Las-Penas C. Effectiveness of myofascial trigger point manual therapy combined with a self-stretching protocol for the management of plantar heel pain: a randomized controlled trial. J Orthop Sports Phys Ther. 2011;41(2):43–50. doi: 10.2519/jospt.2011.3504. [DOI] [PubMed] [Google Scholar]
- 11.Thomas JL, Christensen JC, Kravitz SR, Mendicino RW, Schuberth JM, Vanore JV, et al. The diagnosis and treatment of heel pain: a clinical practice guideline–revision 2010. J Foot Ankle Surg. 2010;49(3):S1–S19. doi: 10.1053/j.jfas.2010.01.001. [DOI] [PubMed] [Google Scholar]
- 12.Cotchett MP, Munteanu SE, Landorf KB. Effectiveness of trigger point dry needling for plantar heel pain: a randomized controlled trial. Phys Ther. 2014;94(8):1083–1094. doi: 10.2522/ptj.20130255. [DOI] [PubMed] [Google Scholar]
- 13.Martin RL, Davenport TE, Reischl SF, McPoil TG, Matheson JW, Wukich DK, et al. Heel pain—plantar fasciitis: revision 2014. J Orthop Sports Phys Ther. 2014;44(11):A1–A33. doi: 10.2519/jospt.2014.0303. [DOI] [PubMed] [Google Scholar]
- 14.Gordon R, Wong C, Crawford EJ. Ultrasonographic evaluation of low energy extracorporeal pulse activated therapy (EPAT) for chronic plantar fasciitis. Foot Ankle Int. 2012;33(3):202–207. doi: 10.3113/FAI.2012.0202. [DOI] [PubMed] [Google Scholar]
- 15.Urse GN. Plantar fasciitis: a review. Osteopathic Family Phys. 2012;4(3):68–71. doi: 10.1016/j.osfp.2011.10.003. [DOI] [Google Scholar]
- 16.Li S, Wang K, Sun H, Luo X, Wang P, Fang S, et al. Clinical effects of extracorporeal shock-wave therapy and ultrasound-guided local corticosteroid injections for plantar fasciitis in adults: a meta-analysis of randomized controlled trials. Medicine. 2018;97(50):e13687. doi: 10.1097/MD.0000000000013687. [DOI] [PMC free article] [PubMed] [Google Scholar]
- 17.Cole C, Seto CK, Gazewood JD. Plantar fasciitis: evidence-based review of diagnosis and therapy. Am Fam Phys. 2005;72(11):2237–2242. [PubMed] [Google Scholar]
- 18.Grieve R, Palmer S. Physiotherapy for plantar fasciitis: a UK-wide survey of current practice. Physiotherapy. 2017;103(2):193–200. doi: 10.1016/j.physio.2016.02.002. [DOI] [PubMed] [Google Scholar]
- 19.Barrett SL, O'Malley R. Plantar fasciitis and other causes of heel pain. Am Fam Phys. 1999;59(8):2200. [PubMed] [Google Scholar]
- 20.Rachelle BM. Plantar fasciitis. N Engl J Med. 2004;350(21):2159. doi: 10.1056/NEJMcp032745. [DOI] [PubMed] [Google Scholar]
- 21.Dubin J (2007) Evidence based treatment for plantar fasciitis. Sports Therapy. Available at http://www.docstoc.com/docs/104555757/Evidence-Based-Treatment-for-Plantar-Fasciitis. Accessed 26 Sept 2013
- 22.Roxas M. Plantar fasciitis: diagnosis and therapeutic considerations. Altern Med Rev. 2005;10(2). [PubMed]
- 23.Schwartz EN, Su J. Plantar fasciitis: a concise review. Perm J. 2014;18(1):e105. doi: 10.7812/TPP/13-113. [DOI] [PMC free article] [PubMed] [Google Scholar]
- 24.Young CC, Rutherford DS, Niedfeldt MW. Treatment of plantar fasciitis. Am Fam Physician. 2001;63(3):467. [PubMed] [Google Scholar]
- 25.Crawford F, Thomson CE. Interventions for treating plantar heel pain. Cochrane Database Syst Rev. 2003; 3. [DOI] [PubMed]
- 26.Orchard J. Plantar fasciitis. BMJ. 2012;345:e6003. doi: 10.1136/bmj.e6603. [DOI] [PubMed] [Google Scholar]
- 27.Myburgh C, Larsen AH, Hartvigsen J. A systematic, critical review of manual palpation for identifying myofascial trigger points: evidence and clinical significance. Arch Phys Med Rehabil. 2008;89(6):1169–1176. doi: 10.1016/j.apmr.2007.12.033. [DOI] [PubMed] [Google Scholar]
- 28.Association APT. Heel pain–plantar fasciitis: clinical practice guildelines linked to the international classification of function, disability, and health from the orthopaedic section of the American Physical Therapy Association. J Orthop Sports Phys Ther. 2008;38(4):A1–A18. doi: 10.2519/jospt.2008.0302. [DOI] [PubMed] [Google Scholar]
- 29.Hawke F, Burns J, Radford JA, Du Toit V. Custom‐made foot orthoses for the treatment of foot pain. Cochrane Database Syst Rev. 2008; 3. [DOI] [PubMed]
- 30.Yucel U, Kucuksen S, Cingoz HT, Anlıacik E, Ozbek O, Salli A, et al. Full-length silicone insoles versus ultrasound-guided corticosteroid injection in the management of plantar fasciitis: a randomized clinical trial. Prosthet Orthot Int. 2013;37(6):471–476. doi: 10.1177/0309364613478328. [DOI] [PubMed] [Google Scholar]
- 31.Mischke JJ, Jayaseelan DJ, Sault JD, Emerson Kavchak AJ. The symptomatic and functional effects of manual physical therapy on plantar heel pain: a systematic review. J Man Manip Ther. 2017;25(1):3–10. doi: 10.1080/10669817.2015.1106818. [DOI] [PMC free article] [PubMed] [Google Scholar]
- 32.Huffer D, Hing W, Newton R, Clair M. Strength training for plantar fasciitis and the intrinsic foot musculature: A systematic review. Phys Ther Sport. 2017;24:44–52. doi: 10.1016/j.ptsp.2016.08.008. [DOI] [PubMed] [Google Scholar]
- 33.Hyland MR, Webber-Gaffney A, Cohen L, Lichtman SW. Randomized controlled trial of calcaneal taping, sham taping, and plantar fascia stretching for the short-term management of plantar heel pain. J Orthop Sports Phys Ther. 2006;36(6):364–371. doi: 10.2519/jospt.2006.2078. [DOI] [PubMed] [Google Scholar]
- 34.Liberati A, Altman DG, Tetzlaff J, Mulrow C, Gøtzsche PC, Ioannidis JP, et al. The PRISMA statement for reporting systematic reviews and meta-analyses of studies that evaluate health care interventions: explanation and elaboration. J Clin Epidemiol. 2009;62(10):e1–e34. doi: 10.1016/j.jclinepi.2009.06.006. [DOI] [PubMed] [Google Scholar]
- 35.Caner ÖC, Güneş S, Gökmen D, Ataman Ş, Kutlay Ş. The efficacy and safety of extracorporeal shock wave therapy on plantar fasciitis in patients with axial spondyloarthritis: a double-blind, randomized controlled trial. Rheumatol Int. 2022;42(4):581–589. doi: 10.1007/s00296-022-05098-0. [DOI] [PubMed] [Google Scholar]
- 36.Asheghan M, Hashemi SE, Hollisaz MT, Roumizade P, Hosseini SM, Ghanjal A. Dextrose prolotherapy versus radial extracorporeal shock wave therapy in the treatment of chronic plantar fasciitis: a randomized, controlled clinical trial. Foot Ankle Surg. 2021;27(6):643–649. doi: 10.1016/j.fas.2020.08.008. [DOI] [PubMed] [Google Scholar]
- 37.Schillizzi G, Alviti F, D’Ercole C, Elia D, Agostini F, Mangone M, et al. Evaluation of plantar fasciopathy shear wave elastography: a comparison between patients and healthy subjects. J Ultrasound. 2021;24(4):417–422. doi: 10.1007/s40477-020-00474-7. [DOI] [PMC free article] [PubMed] [Google Scholar]
- 38.Schillizzi G, Alviti F, D’Ercole C, Elia D, Agostini F, Mangone M, et al. Evaluation of plantar fasciopathy shear wave elastography: a comparison between patients and healthy subjects. J Ultrasound. 2021;24(4):417–422. doi: 10.1007/s40477-020-00474-7. [DOI] [PMC free article] [PubMed] [Google Scholar]
- 39.Baur D, Schwabl C, Kremser C, Taljanovic MS, Widmann G, Sconfienza LM, et al. Shear wave elastography of the plantar fascia: Comparison between patients with plantar fasciitis and healthy control subjects. J Clin Med. 2021;10(11):2351. doi: 10.3390/jcm10112351. [DOI] [PMC free article] [PubMed] [Google Scholar]
- 40.Gatz M, Bejder L, Quack V, Schrading S, Dirrichs T, Tingart M, et al. Shear wave elastography (SWE) for the evaluation of patients with plantar fasciitis. Acad Radiol. 2020;27(3):363–370. doi: 10.1016/j.acra.2019.04.009. [DOI] [PubMed] [Google Scholar]
- 41.Lee D-O, Yoo J-H, Cho H-I, Cho S, Cho HR. Comparing effectiveness of polydeoxyribonucleotide injection and corticosteroid injection in plantar fasciitis treatment: A prospective randomized clinical study. Foot Ankle Surg. 2020;26(6):657–661. doi: 10.1016/j.fas.2019.08.005. [DOI] [PubMed] [Google Scholar]
- 42.Zhao J, Luo WM, Li T. Extracorporeal shock wave therapy versus corticosteroid injection for chronic plantar fasciitis: a protocol of randomized controlled trial. Medicine. 2020;99(19):e19920. doi: 10.1097/MD.0000000000019920. [DOI] [PMC free article] [PubMed] [Google Scholar]
- 43.Wu C-H, Lin Y-Y, Chen W-S, Wang T-G. Sonoelastographic evaluation of plantar fascia after shock wave therapy for recalcitrant plantar fasciitis: a 12-month longitudinal follow-up study. Sci Rep. 2020;10(1):1–6. doi: 10.1038/s41598-020-59464-8. [DOI] [PMC free article] [PubMed] [Google Scholar]
- 44.Raeissadat SA, Nouri F, Darvish M, Esmaily H, Ghazihosseini P. Ultrasound-guided injection of high molecular weight hyaluronic acid versus corticosteroid in management of plantar fasciitis: a 24-week randomized clinical trial. J Pain Res. 2020;13:109. doi: 10.2147/JPR.S217419. [DOI] [PMC free article] [PubMed] [Google Scholar]
- 45.Naruseviciute D, Kubilius R. The effect of high-intensity versus low-level laser therapy in the management of plantar fasciitis: randomized participant blind controlled trial. Clin Rehabil. 2020;34(8):1072–1082. doi: 10.1177/0269215520929073. [DOI] [PMC free article] [PubMed] [Google Scholar]
- 46.Mansiz-Kaplan B, Nacir B, Pervane-Vural S, Duyur-Cakit B, Genc H. Effect of dextrose prolotherapy on pain intensity, disability, and plantar fascia thickness in unilateral plantar fasciitis: a randomized, controlled, double-blind study. Am J Phys Med Rehabil. 2020;99(4):318–324. doi: 10.1097/PHM.0000000000001330. [DOI] [PubMed] [Google Scholar]
- 47.Mansiz-Kaplan B, Nacir B, Pervane-Vural S, Duyur-Cakit B, Genc H. Effect of dextrose prolotherapy on pain intensity, disability, and plantar fascia thickness in unilateral plantar fasciitis: a randomized, controlled, double-blind study. Am J Phys Med Rehabil. 2020;99(4):318–324. doi: 10.1097/PHM.0000000000001330. [DOI] [PubMed] [Google Scholar]
- 48.Aggarwal P, Jirankali V, Garg SK. Evaluation of plantar fascia using high-resolution ultrasonography in clinically diagnosed cases of plantar fasciitis. Pol J Radiol. 2020;85:e375. doi: 10.5114/pjr.2020.97955. [DOI] [PMC free article] [PubMed] [Google Scholar]
- 49.Xu D, Jiang W, Huang D, Hu X, Wang Y, Li H, et al. Comparison between extracorporeal shock wave therapy and local corticosteroid injection for plantar fasciitis. Foot Ankle Int. 2020;41(2):200–205. doi: 10.1177/1071100719891111. [DOI] [PubMed] [Google Scholar]
- 50.Wang W, Liu S, Liu Y, Zang Z, Zhang W, Li L, et al. Efficacy of acupuncture versus sham acupuncture or waitlist control for patients with chronic plantar fasciitis: study protocol for a two-centre randomised controlled trial. BMJ Open. 2020;10(9):e036773. doi: 10.1136/bmjopen-2020-036773. [DOI] [PMC free article] [PubMed] [Google Scholar]
- 51.Tezel N, Umay E, Bulut M, Cakci A. Short-term efficacy of Kinesiotaping versus extracorporeal shockwave therapy for plantar fasciitis: a randomized study. Saudi J Med Med Sci. 2020;8(3):181. doi: 10.4103/sjmms.sjmms_624_19. [DOI] [PMC free article] [PubMed] [Google Scholar]
- 52.Heigh E, Bohman L, Briskin G, Slayton M, Amodei R, Compton K, et al. Intense therapeutic ultrasound for treatment of chronic plantar fasciitis: a pivotal study exploring efficacy, safety, and patient tolerance. J Foot Ankle Surg. 2019;58(3):519–527. doi: 10.1053/j.jfas.2018.10.002. [DOI] [PubMed] [Google Scholar]
- 53.Jiménez-Pérez AE, Gonzalez-Arabio D, Diaz AS, Maderuelo JA, Ramos-Pascua LR. Clinical and imaging effects of corticosteroids and platelet-rich plasma for the treatment of chronic plantar fasciitis: a comparative non randomized prospective study. Foot Ankle Surg. 2019;25(3):354–360. doi: 10.1016/j.fas.2018.01.005. [DOI] [PubMed] [Google Scholar]
- 54.Soraganvi P, Nagakiran K, Raghavendra-Raju R, Anilkumar D, Wooly S, Basti B, et al. Is platelet-rich plasma injection more effective than steroid injection in the treatment of chronic plantar fasciitis in achieving long-term relief? Malays Orthopaedic j. 2019;13(3):8. doi: 10.5704/MOJ.1911.002. [DOI] [PMC free article] [PubMed] [Google Scholar]
- 55.Sanmak ÖDY, Külcü DG, Mesci N, Altunok EÇ. Comparison of effects of low-level laser therapy and extracorporeal shock wave therapy in plantar fasciitis treatment: a randomized, prospective, single-blind clinical study. Turk J Phys Med Rehabil. 2019;65(2):184. doi: 10.5606/tftrd.2019.3528. [DOI] [PMC free article] [PubMed] [Google Scholar]
- 56.Johannsen FE, Herzog RB, Malmgaard-Clausen NM, Hoegberget-Kalisz M, Magnusson SP, Kjaer M. Corticosteroid injection is the best treatment in plantar fasciitis if combined with controlled training. Knee Surg Sports Traumatol Arthrosc. 2019;27(1):5–12. doi: 10.1007/s00167-018-5234-6. [DOI] [PubMed] [Google Scholar]
- 57.Babaei-Ghazani A, Karimi N, Forogh B, Madani SP, Ebadi S, Fadavi HR, et al. Comparison of ultrasound-guided local ozone (O2–O3) injection vs corticosteroid injection in the treatment of chronic plantar fasciitis: a randomized clinical trial. Pain Med. 2019;20(2):314–322. doi: 10.1093/pm/pny066. [DOI] [PubMed] [Google Scholar]
- 58.Gonnade N, Bajpayee A, Elhence A, Lokhande V, Mehta N, Mishra M, et al. Regenerative efficacy of therapeutic quality platelet-rich plasma injections versus phonophoresis with kinesiotaping for the treatment of chronic plantar fasciitis: a prospective randomized pilot study. Asian J Transfus Sci. 2018;12(2):105. doi: 10.4103/ajts.AJTS_48_17. [DOI] [PMC free article] [PubMed] [Google Scholar]
- 59.Granado MJ, Lohman EB, Gordon KE, Daher NS. Metatarsophalangeal joint extension changes ultrasound measurements for plantar fascia thickness. J Foot Ankle Res. 2018;11(1):1–7. doi: 10.1186/s13047-018-0267-0. [DOI] [PMC free article] [PubMed] [Google Scholar]
- 60.Lai T-W, Ma H-L, Lee M-S, Chen P-M, Ku M-C. Ultrasonography and clinical outcome comparison of extracorporeal shock wave therapy and corticosteroid injections for chronic plantar fasciitis: a randomized controlled trial. J Musculoskelet Neuronal Interact. 2018;18(1):47. [PMC free article] [PubMed] [Google Scholar]
- 61.Jain SK, Suprashant K, Kumar S, Yadav A, Kearns SR. Comparison of plantar fasciitis injected with platelet-rich plasma vs corticosteroids. Foot Ankle Int. 2018;39(7):780–786. doi: 10.1177/1071100718762406. [DOI] [PubMed] [Google Scholar]
- 62.Hocaoglu S, Vurdem UE, Cebicci MA, Sutbeyaz ST, Guldeste Z, Yunsuroglu SG. Comparative effectiveness of radial extracorporeal shockwave therapy and ultrasound-guided local corticosteroid injection treatment for plantar fasciitis. J Am Podiatr Med Assoc. 2017;107(3):192–199. doi: 10.7547/14-114. [DOI] [PubMed] [Google Scholar]
- 63.El Molla SS, Fahmy AM, Gamil AM, Ibrahim RA, Kamel MM. Evaluation of plantar fasciitis improvement after shock wave therapy in calcaneal spur patients by musculoskeletal ultrasonography. Egypt Rheumatol Rehabil. 2021;48(1):1–7. doi: 10.1186/s43166-021-00085-y. [DOI] [Google Scholar]
- 64.El Mallah RM, Elattar EA, Zidan HF. Platelet-rich plasma versus dry needling of myofascial meridian trigger points in the treatment of plantar fasciitis. Egypt Rheumatol Rehabil. 2017;44(2):58–68. doi: 10.4103/1110-161X.205661. [DOI] [Google Scholar]
- 65.Sillevis R, Shamus E, Mouttet B. The management of plantar fasciitis with a musculoskeletal ultrasound imaging guided approach for instrument assisted soft tissue mobilization in a runner: a case report. Int J Sports Phys Ther. 2020;15(2):274. doi: 10.26603/ijspt20200274. [DOI] [PMC free article] [PubMed] [Google Scholar]