Abstract
Purpose
Although the function of subjects with chronic ankle instability (CAI) has been examined, structural analysis by ultrasound scanning of the structures surrounding the ankle is limited. Before such structural comparisons between injured and uninjured people can be made it is important to investigate a reliable measurement protocol of structures possibly related to CAI. The aim of this study was to investigate the inter-intra examiner reliability of ultrasonic characteristics of selected structures in healthy subjects.
Methods
Eleven healthy participants were assessed by an experienced sonographer and inexperienced certificated examiner. Ultrasound images were collected of the ATFL length and ankle muscles of gastrocnemius medialis (GM), tibialis anterior (TA) and peroneals. Thickness was measured for the muscles, whilst cross-sectional area (CSA) was measured for the peroneals. Inexperienced examiner repeated the measurements a week later.
Results
Inter-examiner reliability was excellent for all structures (ICC3,1 = 0.91–0.98). Intra-examiner reliability shows excellent agreement for all structures (ICC3,1 = 0.92–0.98) except GM (good agreement) (ICC3,1 = 0.82). LoA, relative to structure size, ranged from 1.38 to 6.88% for inter-reliability and from 0.07 to 5.79% for intra-reliability.
Conclusion
This study shows a high level of inter-intra examiner reliability in measuring the structures possibly related to CAI. Future research has been planned to investigate the structural analysis in CAI by using applied MSUS protocol.
Keywords: Ultrasound imaging, Ankle, Muscle tissue, Ligaments, Cross-sectional anatomy
Introduction
Lateral ankle sprain (LAS) is the most common ankle injury and following their first ankle-sprain, up to 34% of people experience at least 1 re-sprain within 3 years [1]. Up to 74% of people with a prior LAS experience repeated bouts of the joint “giving way” and mechanically laxity of injured ligaments and/or functionally neuromuscular control loss are among the potential risk factors for chronic ankle instability (CAI) [2, 3].
The Anterior Talofibular Ligament (ATFL) is the most frequently injured ligament during an LAS [2] and clinical evaluation of the ATFL provides information on joint instability. This can be elicited using manual joint stress tests, which involve clinicians inducing passive movement of the individual’s ankle, taking it to the end of its range of motion to assess ligament integrity [4]. Indeed, it has been showed that these clinical tests are not reliable nor accurate enough to determine the extent of talocrural joint laxity [5, 6]. Alternatively, stress radiographs measure the amount of talar movement relative to the tibia when the ankle is stressed in an anterior or inversion direction and allows for a more quantitative assessment [7]. However, stress radiography involves ionizing radiation and a suitable facility is not always available [7].
Musculoskeletal ultrasound scanning (MSUS) offers an alternative and can provide static and dynamic images of structures around the ankle [8]. Croy et al. [9] identified greater ATFL length in individuals with CAI compared to uninjured people, and MSUS has similarly been used to evaluate ligament laxity during the manual anterior drawer test and stress radiography [10, 11]. Joint stability has also been quantified using MSUS by measuring the distance between the bony landmarks of lateral malleolus and talus [9].
Muscular structure and neuromuscular functionality also contribute to ankle stability and previous studies showed that tibialis anterior (TA), gastrocnemius medialis (GM) and peroneal longus (PL) differ in those with CAI versus controls [12–14]. Analysis of ankle muscle architecture may help to explain these variations of neuromuscular functionality, such as muscle thickness and cross sectional area (CSA) which are associated with muscle force [15] and muscle weakening/atrophy or strengthening / hypertrophy [16]. The “gold standard” for measuring muscle is magnetic resonance imaging (MRI) and computerized tomography but these are often inaccessible [17]. MSUS has been shown to be valid for assessing muscle CSA [18] and thickness [19] compared to data from MRI.
Additionally, several studies have failed to measure muscle contributions to CAI in a way that reflects the different moment arms and activation patterns that different ankle muscle have, instead measuring the ankle plantar flexors as a whole rather than as separate muscles [19–22]. It follows that reliability of measures of the individual muscles has yet to be shown.
The purpose of the study was to investigate inter and intra-examiner reliability of MSUS of the selected structures around the ankle in uninjured subjects. This was a precursor to study on individuals who have experienced LAS.
Materials and methods
Data collection
A sample of eight females and three males (mean age of 30.50 ± 4.57 years, mean BMI of 23.09 ± 2.63) was recruited from a university students and staff population. Participants who were over 18 years old and had no self-reported lower limb disorders or systemic disease affecting the musculoskeletal system (e.g. diabetes, rheumatoid arthritis) were included. Ethics approval was obtained from the University’s Research Ethics Panel (Reference no: HSR1617-106). Written informed consent was obtained from each participant before data collection.
Ultrasound scanning of participants was performed by an experienced sonographer with 5 years (RA) (examiner 1) and inexperienced certificated physiotherapist (BO) who had attended training in MSUS scanning of the foot and ankle over a six-week period (examiner 2).
Scanning protocol
Ultrasound images were collected by a portable Venue 40 MSUS system (GE Healthcare, UK) with a 5–13 MHz wideband linear array probe. The scanning was performed independently in random order by each examiner within the same session for inter-examiner reliability, and inexperienced examiner repeated the measurements a week later for the intra-examiner reliability. The researchers were blind to any prior measurements during scanning sessions.
Length of ATFL
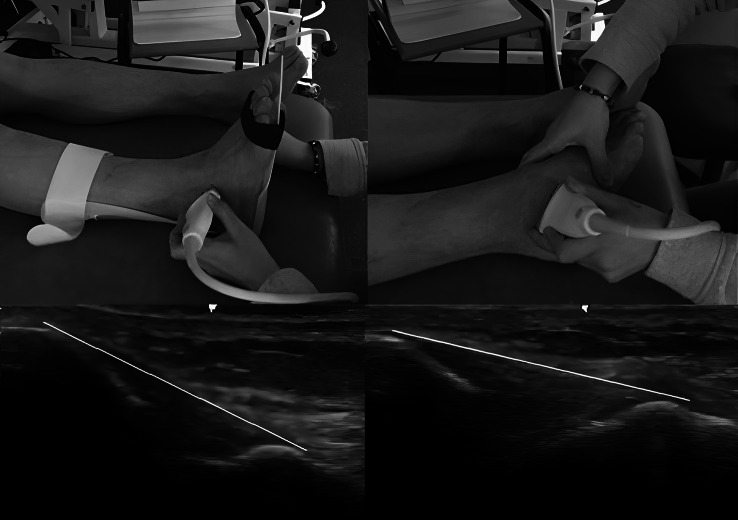
The participant sat on the examination bed with extended legs and a neutral foot position with 0° of dorsiflexion/plantar flexion which was maintained by holding in an ankle by a foot orthosis (AFO) during scanning (Fig. 1). The examiner placed the transducer locating its posterior edge over the distal lateral malleolus to image the ATFL between lateral malleolus and talus. ATFL measurement was taken from the origin at the anterolateral aspect of the lateral malleolus and ends at the peak of the talus representing the site where the talar neck meets the anterior border of the lateral talar articular surface [9]. In the second position, scanner maintained the ankle in maximum plantar flexion and inversion position by holding talus to be sure of extending the ligament maximally during scanning and placed the transducer in the same way as the scanning of ATFL in the neutral position (Fig. 1). The US images of ATFL in two positions are shown in Fig. 1.
Fig. 1.
Probe location and ultrasound images of Anterior Talofibular Ligament in neutral and stressed position
Thickness and CSA of peroneal muscles
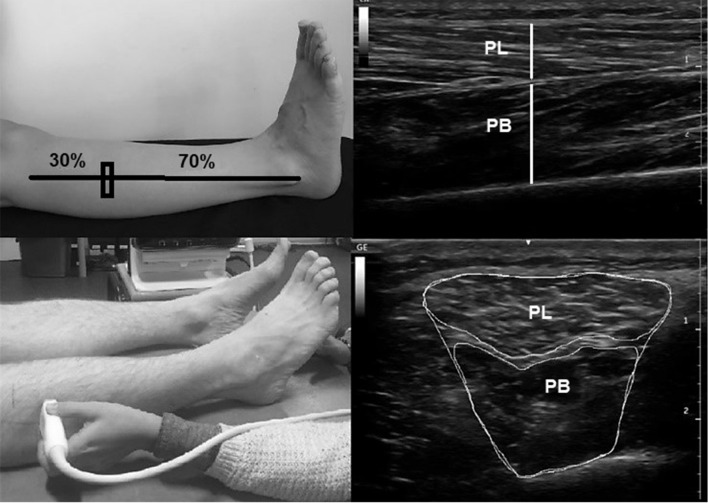
Thickness and CSA of peroneal muscles were measured separately as PL and PB. Previously, MSUS imaging of peroneals were performed at 50% of the distance between fibula head and lateral malleolus, but the structural features of PL and PB was not observed independently [23]. Following pilot testing of this study, we detected that PL was not sufficiently clear at 50% of the distance between fibula head and lateral malleolus and determined that 30% distance from the fibula head to lateral malleolus would be more appropriate location for measures of CSA and thickness of peroneals separately. PL and PB CSA were measured with the transducer in transverse direction and the transducer placed in the longitudinal direction for thickness measurement. Provided that the line between PL and PB was clear, the image was saved for the thickness measurement (Fig. 2). Side and middle boundaries of muscle fibres in the image were used to save the imaging of Peroneals (Fig. 2).
Fig. 2.
Probe location and ultrasound images of Peroneus Longus and Peroneus Brevis
TA thickness
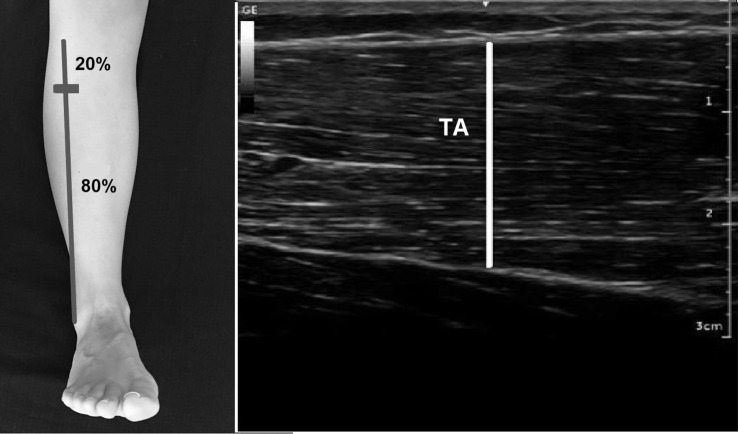
The scanning point of TA thickness was performed at 20% distance between the fibula head and lateral malleolus by using a tape similarly the protocol in [23] and with the probe positioned transversely. The probe was changed to a longitudinal position for measurement of thickness when the maximum achievable end point line of TA was imaged. The thickness of TA was measured as the distance between the superficial and deep boundaries of muscle fibers in the middle of the image (Fig. 3)[23].
Fig. 3.
Probe location and ultrasound images of Tibialis Anterior
GM thickness
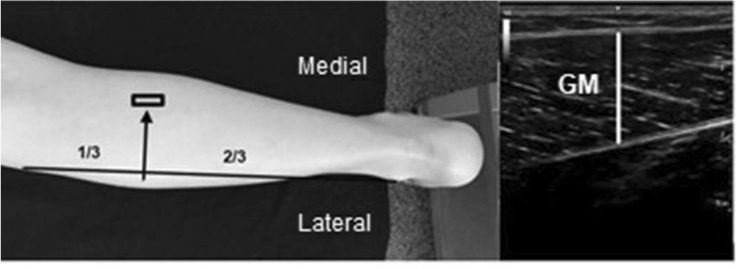
GM thickness was scanned at 1/3 of the distance from the tibial lateral condyle to the lateral malleolus, similar to [24], and the probe moved medially to the GM. At the area, the maximum achievable thickness of GM was searched after the probe was brought into the longitudinal position. The distance between superficial and deep boundaries of muscle fibers in the middle of the image was measured for the GM thickness (Fig. 4).
Fig. 4.
Probe location and ultrasound images of Gastrocnemius Medialis
Data analysis
Each ultrasound image was measured by each examiner using ImageJ software (National Institute for Health, Bethesda, MD, USA). An average of three measurements was calculated for each assessment. Intraclass Correlation Coefficient (ICC) and Limits of Agreement (LoA) were used to analyze reliability. ICC values were interpreted according to the suggestion of Koo et al. [25]. In addition, Bland Altman analyses were showed as graphics.
Results
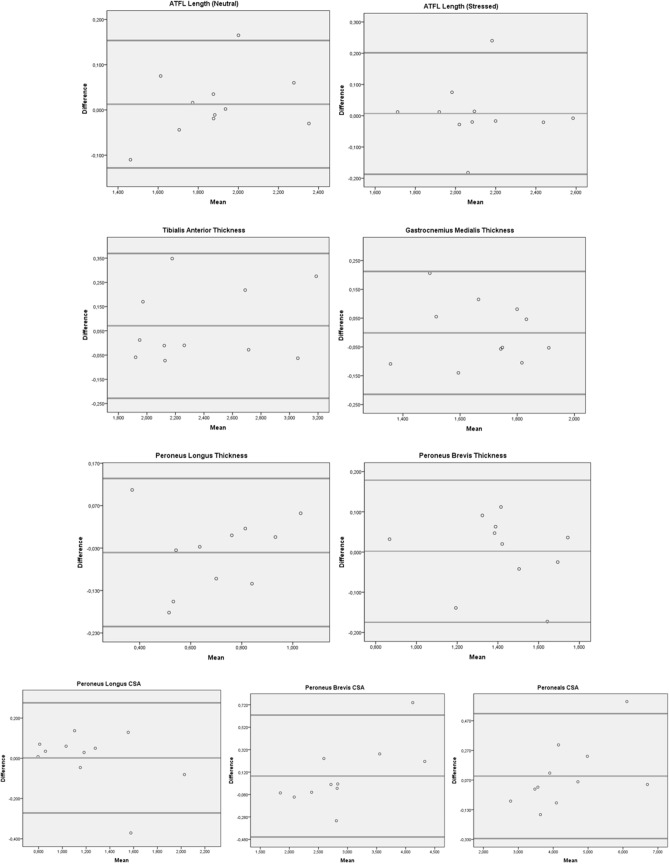
Inter-examiner reliability was excellent for all structures (ICC3,1 = 0.91–0.98). LoA, relative to structure size, ranged from 1.38 to 6.88% for interreliability. PB thickness had the lowest ICC (0.91). The mean thickness measurements were 1.42 cm2 and 1.36 cm2 for examiner 1 and examiner 2, respectively (Table 1). The CSA of peroneals had the highest ICC (0.98) and the mean CSA measurements were 4.42 cm2 and 4.26 cm2 for examiner 1 and examiner 2, respectively (Table 1). Bland Altman Analysis of inter- examiner reliability was shown in Fig. 5.
Table 1.
Interclass correlation coefficient and correlation analysis to show inter- examiner reliability
| Examiner 1 (mean ± SD) |
Examiner 2 (mean ± SD) |
ICC3,1 | 95% CI | 95% LoA (cm or cm2) |
LoA (% average structure size) | Correlation | |||
|---|---|---|---|---|---|---|---|---|---|
| Lower | Upper | Lower | Upper | ||||||
| ATFL L (neutral) | 1.89 ± 0.28 | 1.88 ± 0.25 | 0.96 | 0.86 | 0.99 | – 0.15 | 0.23 | 2.12 | 0.939 |
| ATFL L (stressed) | 2.19 ± 0.26 | 2.12 ± 0.24 | 0.93 | 0.68 | 0.98 | – 0.29 | 0.13 | 3.52 | 0.910 |
| TA T | 2.34 ± 0.45 | 2.42 ± 0.47 | 0.97 | 0.88 | 0.99 | – 0.23 | 0.37 | 2.97 | 0.948 |
| GM T | 1.63 ± 0.20 | 1.68 ± 0.17 | 0.92 | 0.70 | 0.98 | – 0.14 | 0.24 | 2.95 | 0.880 |
| PL T | 0.67 ± 0.17 | 0.68 ± 0.21 | 0.94 | 0.77 | 0.98 | – 0.18 | 0.20 | 1.38 | 0.904 |
| PB T | 1.36 ± 0.24 | 1.42 ± 0.24 | 0.91 | 0.69 | 0.97 | – 0.20 | 0.32 | 4.08 | 0.851 |
| PL CSA | 1.14 ± 0.36 | 1.22 ± 0.35 | 0.97 | 0.81 | 0.99 | – 0.13 | 0.29 | 6.88 | 0.955 |
| PB CSA | 2.82 ± 0.75 | 2.96 ± 0.89 | 0.98 | 0.89 | 0.99 | – 0.24 | 0.53 | 4.95 | 0.985 |
| Peroneals CSA | 4.26 ± 1.11 | 4.42 ± 1.24 | 0.98 | 0.93 | 0.99 | – 0.37 | 0.69 | 3.66 | 0.980 |
ICC3,1 > 0.8 were classed as good, ICC3,1 > 0.9 as excellent
ATFL Anterior Talofibular Ligament, TA Tibialis Anterior, GM Gastrocnemius Medialis, PL Peroneus Longus, PB Peroneus Brevis, L Length, T Thickness, CSA Cross-Sectional Area, Values are mean ± SD in cm
Fig. 5.
Bland Altman Analysis of inter-examiner reliability, respectively: ATFL length in neutral and stressed position, Tibialis Anterior thickness, Gastrocnemius Medialis thickness, Peroneus Longus (PL) and Brevis (PB) thickness, Cross Sectional Area (CSA) of PL, PB and Peroneals
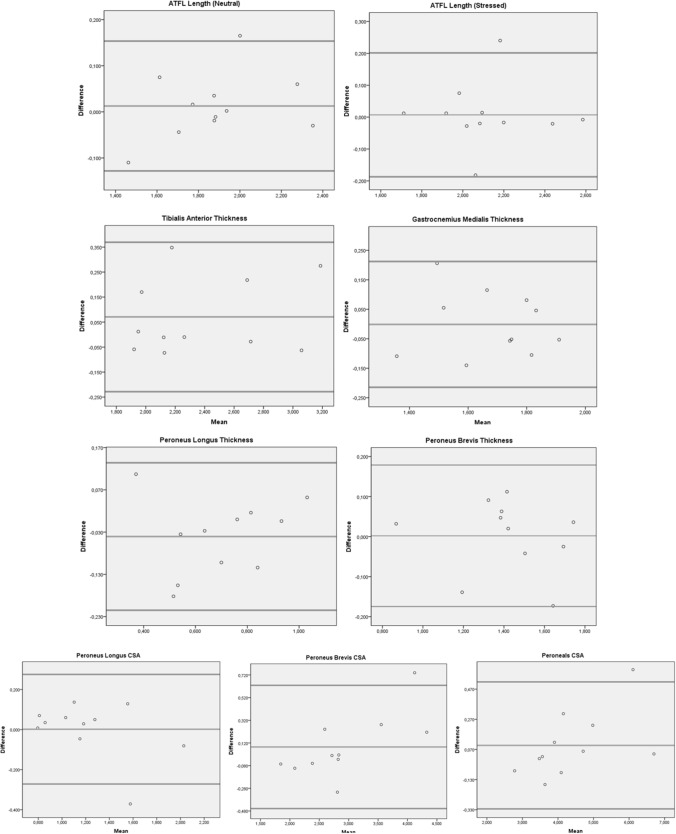
Intra-examiner reliability shows excellent agreement for all structures (ICC3,1 = 0.92–0.98) except GM which showed good agreement (ICC3,1 = 0.82). LoA, relative to structure size, was 0.07–5.79% for selected structures. GM thickness had the lowest ICC (0.82) and the mean thickness measurements were 1.68 cm2 and 1.68 cm2 for test 1 and test 2, respectively (Table 2). The CSA of peroneals had the highest ICC (0.98) and the mean CSA measurements 4.42 cm2 and 4.32 cm2 for test 1 and test 2, respectively (Table 2). Bland Altman Analysis of intra-examiner reliability was shown in Fig. 6.
Table 2.
Intraclass correlation coefficient and correlation analysis to show intra- examiner reliability
| Examiner 1 (mean ± SD) |
Examiner 1 (mean ± SD) |
ICC3,1 | 95% CI | 95% LoA (cm or cm2) |
LoA (% average structure size) | Correlation | |||
|---|---|---|---|---|---|---|---|---|---|
| Lower | Upper | Lower | Upper | ||||||
| ATFL L (neutral) | 1.88 ± 0.25 | 1.85 ± 0.24 | 0.96 | 0.87 | 0.99 | – 0.13 | 0.15 | 0.68 | 0.967 |
| ATFL L (stressed) | 2.12 ± 0.24 | 2.11 ± 0.24 | 0.92 | 0.72 | 0.98 | – 0.19 | 0.20 | 0.33 | 0.917 |
| TA T | 2.42 ± 0.47 | 2.33 ± 0.40 | 0.93 | 0.76 | 0.98 | – 0.24 | 0.41 | 3.48 | 0.942 |
| GM T | 1.68 ± 0.17 | 1.68 ± 0.18 | 0.82 | 0.45 | 0.95 | – 0.22 | 0.21 | 0.07 | 0.817 |
| PL T | 0.68 ± 0.21 | 0.72 ± 0.19 | 0.91 | 0.69 | 0.97 | – 0.22 | 0.13 | 5.79 | 0.908 |
| PB T | 1.42 ± 0.24 | 1.42 ± 0.26 | 0.94 | 0.78 | 0.98 | – 0.18 | 0.18 | 0.14 | 0.936 |
| PL CSA | 1.22 ± 0.35 | 1.21 ± 0.41 | 0.93 | 0.78 | 0.98 | – 0.27 | 0.28 | 0.14 | 0.945 |
| PB CSA | 2.96 ± 0.89 | 2.87 ± 0.70 | 0.94 | 0.79 | 0.98 | – 0.46 | 0.63 | 2.90 | 0.967 |
| Peroneals CSA | 4.42 ± 1.24 | 4.32 ± 1.12 | 0.98 | 0.94 | 0.99 | – 0.32 | 0.52 | 2.21 | 0.988 |
ICC3,1 > 0.8 were classed as good, ICC3,1 > 0.9 as excellent
ATFL Anterior Talofibular Ligament, TA Tibialis Anterior, GM Gastrocnemius Medialis, PL Peroneus Longus, PB Peroneus Brevis, L Length, T Thickness, CSA Cross-Sectional Area, Values are mean ± SD in cm
Fig. 6.
Bland Altman Analysis of intra-examiner reliability, respectively: ATFL length in neutral and stressed position, Tibialis Anterior thickness, Gastrocnemius Medialis thickness, Peroneus Longus (PL) and Brevis (PB) thickness, Cross Sectional Area (CSA) of PL, PB and Peroneals
Discussion
This study showed high inter-examiner reliability when assessing selected ankle ligament and muscles using MSUS. For intra-examiner reliability there was lower reliability but still excellent agreement for all structures except GM thickness, which equated to good rather than excellent agreement.
Clinical assessments such as the anterior drawer and talar tilt test [26] are largely subjective and objective measures such as ATFL length have been used to quantify ankle joint laxity or instability [4, 5]. The high level of inter and intra examiner reliability identified in this study, coupled with greater accessibility of MSUS and reliability of even novice examiners, suggests that MSUS of ATFL is reliable means of evaluating ankle ligaments for clinicians. The high levels of intra examiner reliability of ATFL length is a common thread in the literature [27] and this study indicates that reliability is not sensitive examiner experience (assuming minimum training has occurred, 6 weeks in this case).
There was lower agreement when the ankle was in its stressed position compared to the neutral position. This perhaps reflects the subjective nature of defining “end of range of motion” and indeed Croy et al. [9] sought to address this by using a device to induce ankle motion. We used manual manipulation of the ankle as this better reflects what is possible in a clinical setting and because devices are not easily available, nor validated as being suitable for inducing the correct motion (i.e. direction and range).
Peroneal muscles, specifically the activation of PL as a possible injury mechanism for LASs or the underlying cause of CAI [12, 28–32]. However, both higher and lower PL activation [12, 29–35] has been reported in CAI, albeit during various functional or sport-related tasks. Thus, a structural analysis of PL and PB may offer some additional insights where functional tasks do not. A low level of inter-examiner agreement (large LoA) was observed for the CSA measurements (6.88% and 4.95%). Muscle boundaries between muscles and location variability of PL compared to PB might be factors affecting this. However, CSA of PL and PB had high inter (ICC of 0.97 and 0.98) and intraexaminer agreement (ICC of 0.93 and 0.94). Our data might therefore vary from results employing different measurement locations than the protocol used by Crofts et al. [23].
We have observed excellent inter and good intra-examiner reliability for GM thickness. The result of intra-examiner measurement may be due to the difficulty in detection of the point of maximum GM thickness, due to its geometric nature. Earlier reliability tests of MSUS based measures of GM have included older adults [36], young children [37] and post stroke patients [38], or focused instead on the differences between resting and contracted GM [39]. Some research also focused only on the lower leg [40], posterior lower leg [22] or group of ankle flexors [19], and this is the first to report directly on only the GM.
Some of the limitations of the study were the inclusion uninjured rather than injured ankles, and subject and assessor numbers. Others have advocated that pennation angle of muscle fibres may reflect muscle performance due to its property of being inversely proportional to force and shortening speed [41] and this could be considered in future work to complement CSA and thickness.
Conclusion
This study indicated a high level of inter-intra examiner reliability in measuring the structures possibly related to CAI in healthy subjects. These measures can be used in future work on injured ankles to study the potential contributions of structural damage and functional adaptations to CAI.
Declarations
Funding
The researcher Bahar Özgül was financially supported by Scientific and Technological Research Council of Turkey, Directorate of Science Fellowships and Grant Programs [Program Code: 2214-A, Reference Number: 53325897-115.02-243381]. There is no role of sponsor in the study design which comprises of data collection, statistical analysis, and interpretation of data; writing of the manuscript; and the decision to submit the manuscript for publication.
Competing interests
The authors have no relevant financial or non-financial interests to disclose.
Author contributions
All authors contributed to the study conception and design. Study design was performed by Bahar Özgül, Mine Gülden Polat and Christopher Nester. Ultrasound scanning protocol was planned and tested by Bahar Özgül and Rawan Abdeen. Data collection was performed by Bahar Özgül and Rawan Abdeen. Data analysis was performed by Bahar Özgül. The first draft of the manuscript was written by Bahar Özgül and Chelsea Starbuck. The first draft and revised drafts of the manuscript were edited by Christopher Nester and Mine Gülden Polat and all authors commented on previous versions of the manuscript. All authors read and approved the final manuscript.
Ethics approval
This study was performed in line with the principles of the Declaration of Helsinki. Ethics approval was obtained from the University’s Research Ethics Panel (Reference no: HSR1617-106).
Consent to participate
Written informed consent was obtained from all individual participants included in the study.
Consent to publish
The authors affirm that human research participants provided informed consent for publication of the images in Figs. 1–4.
Footnotes
Publisher's Note
Springer Nature remains neutral with regard to jurisdictional claims in published maps and institutional affiliations.
References
- 1.van Rijn RM, van Os AG, Bernsen RMD, Luijsterburg PA, Koes BW, Bierma-Zeinstra SMA. What is the clinical course of acute ankle sprains? A systematic literature review. Am J Med. 2008;121(4):324–U326. doi: 10.1016/j.amjmed.2007.11.018. [DOI] [PubMed] [Google Scholar]
- 2.Czajka CM, Tran E, Cai AN, DiPreta JA. Ankle sprains and instability [Review] Med Clin North Am. 2014;98(2):313–329. doi: 10.1016/j.mcna.2013.11.003. [DOI] [PubMed] [Google Scholar]
- 3.Houston MN, Van Lunen BL, Hoch MC. Health-related quality of life in individuals with chronic ankle instability. J Athl Train. 2014;49(6):758–763. doi: 10.4085/1062-6050-49.3.54. [DOI] [PMC free article] [PubMed] [Google Scholar]
- 4.Sisson L, Croy T, Saliba S and Hertel J (2011) Comparison of ankle arthrometry to stress ultrasound imaging in the assessment of ankle laxity in healthy adults. Int J Sports Phys Ther 6(4):297–305. http://www.ncbi.nlm.nih.gov/pubmed/22163091 [PMC free article] [PubMed]
- 5.Fujii T, Luo Z-P, Kitaoka HB, An K-N. The manual stress test may not be sufficient to differentiate ankle ligament injuries. Clin Biomech (Bristol, Avon) 2000;15(8):619–623. doi: 10.1016/S0268-0033(00)00020-6. [DOI] [PubMed] [Google Scholar]
- 6.Hubbard TJ, Hicks-Little CA. Ankle ligament healing after an acute ankle sprain: an evidence-based approach [Review] J Athl Train. 2008;43(5):523–529. doi: 10.4085/1062-6050-43.5.523. [DOI] [PMC free article] [PubMed] [Google Scholar]
- 7.Lohrer H, Nauck T, Arentz S, Scholl J. Observer reliability in ankle and calcaneocuboid stress radiography [Validation Studies] Am J Sports Med. 2008;36(6):1143–1149. doi: 10.1177/0363546507313091. [DOI] [PubMed] [Google Scholar]
- 8.Chew K, Stevens KJ, Wang TG, Fredericson M, Lew HL. Introduction to diagnostic musculoskeletal ultrasound: part 2: examination of the lower limb [Review] Am J Phys Med Rehabil. 2008;87(3):238–248. doi: 10.1097/PHM.0b013e31816198c2. [DOI] [PubMed] [Google Scholar]
- 9.Croy T, Saliba SA, Saliba E, Anderson MW, Hertel J. Differences in lateral ankle laxity measured via stress ultrasonography in individuals with chronic ankle instability, ankle sprain copers, and healthy individuals [Research Support, Non-U.S. Gov't] J Orthop Sports Phys Ther. 2012;42(7):593–600. doi: 10.2519/jospt.2012.3923. [DOI] [PubMed] [Google Scholar]
- 10.Cho JH, Lee DH, Song HK, Bang JY, Lee KT, Park YU. Value of stress ultrasound for the diagnosis of chronic ankle instability compared to manual anterior drawer test, stress radiography, magnetic resonance imaging, and arthroscopy [Comparative Study] Knee Surg Sports Traumatol Arthrosc. 2016;24(4):1022–1028. doi: 10.1007/s00167-015-3828-9. [DOI] [PubMed] [Google Scholar]
- 11.Lee KT, Park YU, Jegal H, Park JW, Choi JP, Kim JS. New method of diagnosis for chronic ankle instability: comparison of manual anterior drawer test, stress radiography and stress ultrasound [Comparative Study] Knee Surg Sports Traumatol Arthrosc. 2014;22(7):1701–1707. doi: 10.1007/s00167-013-2690-x. [DOI] [PubMed] [Google Scholar]
- 12.Son SJ, Kim H, Seeley MK, Hopkins JT. Movement strategies among groups of chronic ankle instability, coper, and control. Med Sci Sports Exerc. 2017;49(8):1649–1661. doi: 10.1249/MSS.0000000000001255. [DOI] [PubMed] [Google Scholar]
- 13.Pozzi F, Moffat M, Gutierrez G. Neuromuscular control during performance of a dynamic balance task in subjects with and without ankle instability. Int J Sports Phys Ther. 2015;10(4):520. [PMC free article] [PubMed] [Google Scholar]
- 14.Koshino Y, Ishida T, Yamanaka M, Ezawa Y, Okunuki T, Kobayashi T, et al. Kinematics and muscle activities of the lower limb during a side-cutting task in subjects with chronic ankle instability. Knee Surg Sports Traumatol Arthrosc. 2016;24(4):1071–1080. doi: 10.1007/s00167-015-3745-y. [DOI] [PubMed] [Google Scholar]
- 15.Fukunaga T, Miyatani M, Tachi M, Kouzaki M, Kawakami Y, Kanehisa H. Muscle volume is a major determinant of joint torque in humans. Acta Physiol Scand. 2001;172(4):249–255. doi: 10.1046/j.1365-201x.2001.00867.x. [DOI] [PubMed] [Google Scholar]
- 16.Dupont AC, Sauerbrei EE, Fenton PV, Shragge PC, Loeb GE, Richmond FJ. Real-time sonography to estimate muscle thickness: comparison with MRI and CT [Comparative Study Evaluation Study Research Support, Non-U.S. Gov't] J Clin Ultrasound. 2001;29(4):230–236. doi: 10.1002/jcu.1025. [DOI] [PubMed] [Google Scholar]
- 17.Bemben MG. Use of diagnostic ultrasound for assessing muscle size. J Strength Cond Res. 2002;16(1):103–108. doi: 10.1519/1533-4287(2002)016<0103:uodufa>2.0.co;2. [DOI] [PubMed] [Google Scholar]
- 18.Reeves ND, Maganaris CN, Narici MV. Ultrasonographic assessment of human skeletal muscle size. Eur J Appl Physiol. 2004;91(1):116–118. doi: 10.1007/s00421-003-0961-9. [DOI] [PubMed] [Google Scholar]
- 19.Miyatani M, Kanehisa H, Ito M, Kawakami Y, Fukunaga T. The accuracy of volume estimates using ultrasound muscle thickness measurements in different muscle groups. Eur J Appl Physiol. 2004;91(2–3):264–272. doi: 10.1007/s00421-003-0974-4. [DOI] [PubMed] [Google Scholar]
- 20.Thoirs K, English C. Ultrasound measures of muscle thickness: intra-examiner reliability and influence of body position. Clin Physiol Funct Imaging. 2009;29(6):440–446. doi: 10.1111/j.1475-097X.2009.00897.x. [DOI] [PubMed] [Google Scholar]
- 21.Weiss LW, Clark FC. Ultrasonic protocols for separately measuring subcutaneous fat and skeletal muscle thickness in the calf area [Research Support, Non-U.S. Gov't] Phys Ther. 1985;65(4):477–481. doi: 10.1093/ptj/65.4.477. [DOI] [PubMed] [Google Scholar]
- 22.Ishida Y, Carroll JF, Pollock ML, Graves JE, Leggett SH. Reliability of B-mode ultrasound for the measurement of body fat and muscle thickness. Am J Hum Biol. 1992;4(4):511–520. doi: 10.1002/ajhb.1310040410. [DOI] [PubMed] [Google Scholar]
- 23.Crofts G, Angin S, Mickle KJ, Hill S, Nester C. Reliability of ultrasound for measurement of selected foot structures. Gait Posture. 2014;39(1):35–39. doi: 10.1016/j.gaitpost.2013.05.022. [DOI] [PubMed] [Google Scholar]
- 24.Namavarian N, Rezasoltani A, Zavieh MK, Tabatabaee SM, Lahouti B, Nadimi B. Rehabilitative ultrasound imaging to study the gastrocnemius muscles morphology in patients with Genu Varum and Valgum Deformities. J Clin Physiother Res. 2017;2(1):21–25. doi: 10.22037/jcpr.v2i1.11882. [DOI] [Google Scholar]
- 25.Koo TK, Li MY. A guideline of selecting and reporting intraclass correlation coefficients for reliability research. J Chiropr Med. 2016;15(2):155–163. doi: 10.1016/j.jcm.2016.02.012. [DOI] [PMC free article] [PubMed] [Google Scholar]
- 26.Wilkin EJ, Hunt A, Nightingale EJ, Munn J, Kilbreath SL, Refshauge KM. Manual testing for ankle instability [Comparative Study] Man Ther. 2012;17(6):593–596. doi: 10.1016/j.math.2012.03.007. [DOI] [PubMed] [Google Scholar]
- 27.Abdeen R, Comfort P, Starbuck C, Nester C. Ultrasound characteristics of foot and ankle structures in healthy, coper, and chronically unstable ankles. J Ultrasound Med. 2019;38(4):917–926. doi: 10.1002/jum.14770. [DOI] [PubMed] [Google Scholar]
- 28.Feger MA, Donovan L, Hart JM, Hertel J. Lower extremity muscle activation in patients with or without chronic ankle instability during walking. J Athl Train. 2015;50(4):350–357. doi: 10.4085/1062-6050-50.2.06. [DOI] [PMC free article] [PubMed] [Google Scholar]
- 29.Santilli V, Frascarelli MA, Paoloni M, Frascarelli F, Camerota F, De Natale L, De Santis F. Peroneus longus muscle activation pattern during gait cycle in athletes affected by functional ankle instability—a surface electromyographic study. Am J Sports Med. 2005;33(8):1183–1187. doi: 10.1177/0363546504274147. [DOI] [PubMed] [Google Scholar]
- 30.Suda EY, Sacco IC. Altered leg muscle activity in volleyball players with functional ankle instability during a sideward lateral cutting movement. Phys Ther Sport. 2011;12(4):164–170. doi: 10.1016/j.ptsp.2011.01.003. [DOI] [PubMed] [Google Scholar]
- 31.Delahunt E, Monaghan K, Caulfield B. Changes in lower limb kinematics, kinetics, and muscle activity in subjects with functional instability of the ankle joint during a single leg drop jump. J Orthop Res. 2006;24(10):1991–2000. doi: 10.1002/jor.20235. [DOI] [PubMed] [Google Scholar]
- 32.Koldenhoven RM, Feger MA, Fraser JJ, Saliba S, Hertel J. Surface electromyography and plantar pressure during walking in young adults with chronic ankle instability. Knee Surg Sports Traumatol Arthrosc. 2016;24(4):1060–1070. doi: 10.1007/s00167-016-4015-3. [DOI] [PubMed] [Google Scholar]
- 33.Webster KA, Pietrosimone BG, Gribble PA. Muscle activation during landing before and after fatigue in individuals with or without chronic ankle instability. J Athl Train. 2016;51(8):629–636. doi: 10.4085/1062-6050-51.10.01. [DOI] [PMC free article] [PubMed] [Google Scholar]
- 34.Hopkins JT, Coglianese M, Glasgow P, Reese S, Seeley MK. Alterations in evertor/invertor muscle activation and center of pressure trajectory in participants with functional ankle instability. J Electromyogr Kinesiol. 2012;22(2):280–285. doi: 10.1016/j.jelekin.2011.11.012. [DOI] [PubMed] [Google Scholar]
- 35.Delahunt E, Monaghan K, Caulfield B. Altered neuromuscular control and ankle joint kinematics during walking in subjects with functional instability of the ankle joint. Am J Sports Med. 2006;34(12):1970–1976. doi: 10.1177/0363546506290989. [DOI] [PubMed] [Google Scholar]
- 36.Raj IS, Bird SR, Shield AJ. Reliability of ultrasonographic measurement of the architecture of the vastus lateralis and gastrocnemius medialis muscles in older adults. Clin Physiol Funct Imaging. 2012;32(1):65–70. doi: 10.1111/j.1475-097X.2011.01056.x. [DOI] [PubMed] [Google Scholar]
- 37.Legerlotz K, Smith HK, Hing WA. Variation and reliability of ultrasonographic quantification of the architecture of the medial gastrocnemius muscle in young children. Clin Physiol Funct Imaging. 2010;30(3):198–205. doi: 10.1111/j.1475-097X.2010.00925.x. [DOI] [PubMed] [Google Scholar]
- 38.Mohagheghi AA, Khan T, Meadows TH, Giannikas K, Baltzopoulos V, Maganaris CN. Differences in gastrocnemius muscle architecture between the paretic and non-paretic legs in children with hemiplegic cerebral palsy. Clin Biomech (Bristol, Avon) 2007;22(6):718–724. doi: 10.1016/j.clinbiomech.2007.03.004. [DOI] [PubMed] [Google Scholar]
- 39.Narici MV, Binzoni T, Hiltbrand E, Fasel J, Terrier F, Cerretelli P. In vivo human gastrocnemius architecture with changing joint angle at rest and during graded isometric contraction. J Physiol-Lond. 1996;496(1):287–297. doi: 10.1113/jphysiol.1996.sp021685. [DOI] [PMC free article] [PubMed] [Google Scholar]
- 40.Weiss LW, Clark FC. Ultrasonic protocols for separately measuring subcutaneous fat and skeletal-muscle thickness in the calf area. Phys Ther. 1985;65(4):477–481. doi: 10.1093/ptj/65.4.477. [DOI] [PubMed] [Google Scholar]
- 41.Wickiewicz TL, Roy RR, Powell PL, Edgerton VR. Muscle architecture of the human lower limb. Clin Orthop Relat Res. 1983;179:275–283. doi: 10.1097/00003086-198310000-00042. [DOI] [PubMed] [Google Scholar]


