

Abstract
Cellular heterogeneity is generally overlooked in infectious diseases. In this study, we investigated host cell heterogeneity during infection with Trypanosoma cruzi (T. cruzi) parasites, causative agents of Chagas disease (CD). In chronic-stage CD, only a few host cells are infected with a large load of parasites and symptoms may appear at sites distal to parasite colonization. Furthermore, recent work has revealed T. cruzi heterogeneity with regard to replication rates and drug susceptibility. However, the role of cellular-level metabolic heterogeneity in these processes has yet to be assessed. To fill this knowledge gap, we developed a Single-probe SCMS (single-cell mass spectrometry) method compatible with biosafety protocols, to acquire metabolomics data from individual cells during T. cruzi infection. This study revealed heterogeneity in the metabolic response of the host cells to T. cruzi infection in vitro. Our results showed that parasite-infected cells possessed divergent metabolism compared to control cells. Strikingly, some uninfected cells adjacent to infected cells showed metabolic impacts as well. Specific metabolic changes include increases in glycerophospholipids with infection. These results provide novel insight into the pathogenesis of CD. Furthermore, they represent the first application of bioanalytical SCMS to the study of mammalian-infectious agents, with the potential for broad applications to study infectious diseases.
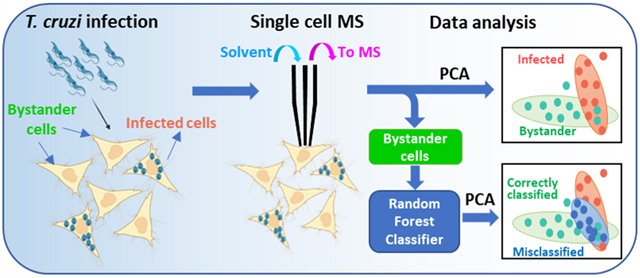
Graphical Abstract
Cell heterogeneity is commonly present in nearly all biological systems. In addition to genetic variation, cellular heterogeneity can be induced by nongenetic mechanisms, i.e., cells possessing similar genotypes but actually expressing morphological and phenotypical differences.1 Although cell heterogeneity has been reported in human diseases such as cancer, diabetes, and chronic and age-related diseases,2 it is largely understudied in infectious disease. For the first time, this study will pave the way to study the heterogeneity that presents in infection with Trypanosoma cruzi (T. cruzi) at the single-cell level.
T. cruzi is a protozoan parasite causing Chagas disease (CD), which is an understudied tropical disease with severe cardiac and gastrointestinal symptoms. At the cellular level, T. cruzi trypomastigotes invade host cells and differentiate into amastigotes, which can proliferate, differentiate back into trypomastigotes, and then escape the host cells. These newly produced trypomastigotes can then invade new cells and continue this cycle of damage.3 T. cruzi infection results in a major deregulation of lipid and glucose metabolism in the host cells.4 Metabolic alterations proportional to CD severity were observed in the heart during experimental T. cruzi infection.5 Differential spatial distribution of metabolic alterations in experimentally infected animals reflects sites of Chagas disease tropism.6 However, all of these reported studies have been performed using traditional metabolomic, gene expression, or functional studies from extracts and lysates prepared from cell populations or infected tissues, which masks cellular-level heterogeneity and cellular-level spatiality.
Although single-cell transcriptomics7 and proteomics8 are increasingly implemented, metabolomics at the single-cell level can investigate cellular function that may not be rendered by other methods. Metabolites are smaller molecules (<1.5 kDa), including sugars, lipids, and amino acids.9 Metabolites reflect cell status and unveil functions of associated metabolic pathways. Single-cell metabolomics has a great potential to uncover the phenotypic variations from cell to cell and, specifically, cellular heterogeneity. In metabolomic studies, mass spectrometry (MS) has become an important tool due to its high sensitivity, broad molecular coverage, and powerful structural identification capabilities. Traditional MS studies rely on bulk samples that do not reveal molecular information at the single-cell level and often mask cellular heterogeneity. In contrast, single-cell mass spectrometry (SCMS) is capable of profiling metabolites in individual cells and unveiling hidden subpopulations of cells. MS-based single-cell metabolomics is capable of analyzing and determining the cellular metabolites that are altered after environmental perturbation.10 A series of SCMS techniques have been developed to analyze cells under vacuum (e.g., MALDI-MS (matrix-assisted laser desorption/ionization-MS) and SIMS (secondary ion mass spectrometry)11 or ambient environment (e.g., live single-cell video-MS,12 probe ESI MS,13 LAESI MS,14 and nano-DESI MS15). We have developed multiple microscale sampling and ionization devices, including the Single-probe,16 micropipette17 and T-probe,18 that can be coupled to MS for single-cell metabolomics studies. Among them, the Single-probe SCMS method has been routinely used in our studies. Briefly, the Single-probe is a home-built device composed of a solvent-providing capillary, a dual-bore quartz needle, and a nano-ESI emitter. The Single-probe can be coupled to a mass spectrometer for microscale sampling (e.g., from single cells and tissue slices) and MS analysis (Figure 1a). The Single-probe tip is small enough (~9 μm) for insertion into single cells. The sampling solvent (50/50 acetonitrile/methanol (v/v)) with 0.1% formic acid) was continuously delivered to extract cellular contents, which are immediately ionized by MS analysis (Figure 1b).16,19 We have used this technique in different single-cell studies such as investigating the difference in drug resistance,19a,20 quantifying anticancer drugs in single cells,19c,21 comparing metabolites in cancer stem cells and nonstem cancer cells,22 and determining the influence of the environment on algal cell metabolites.23 In addition, the Single-probe device has been utilized for MS imaging studies to acquire the spatial distribution of molecules on tissue slices19f,24 as well as to analyze secreted metabolites inside multicellular spheroids.25
Figure 1.
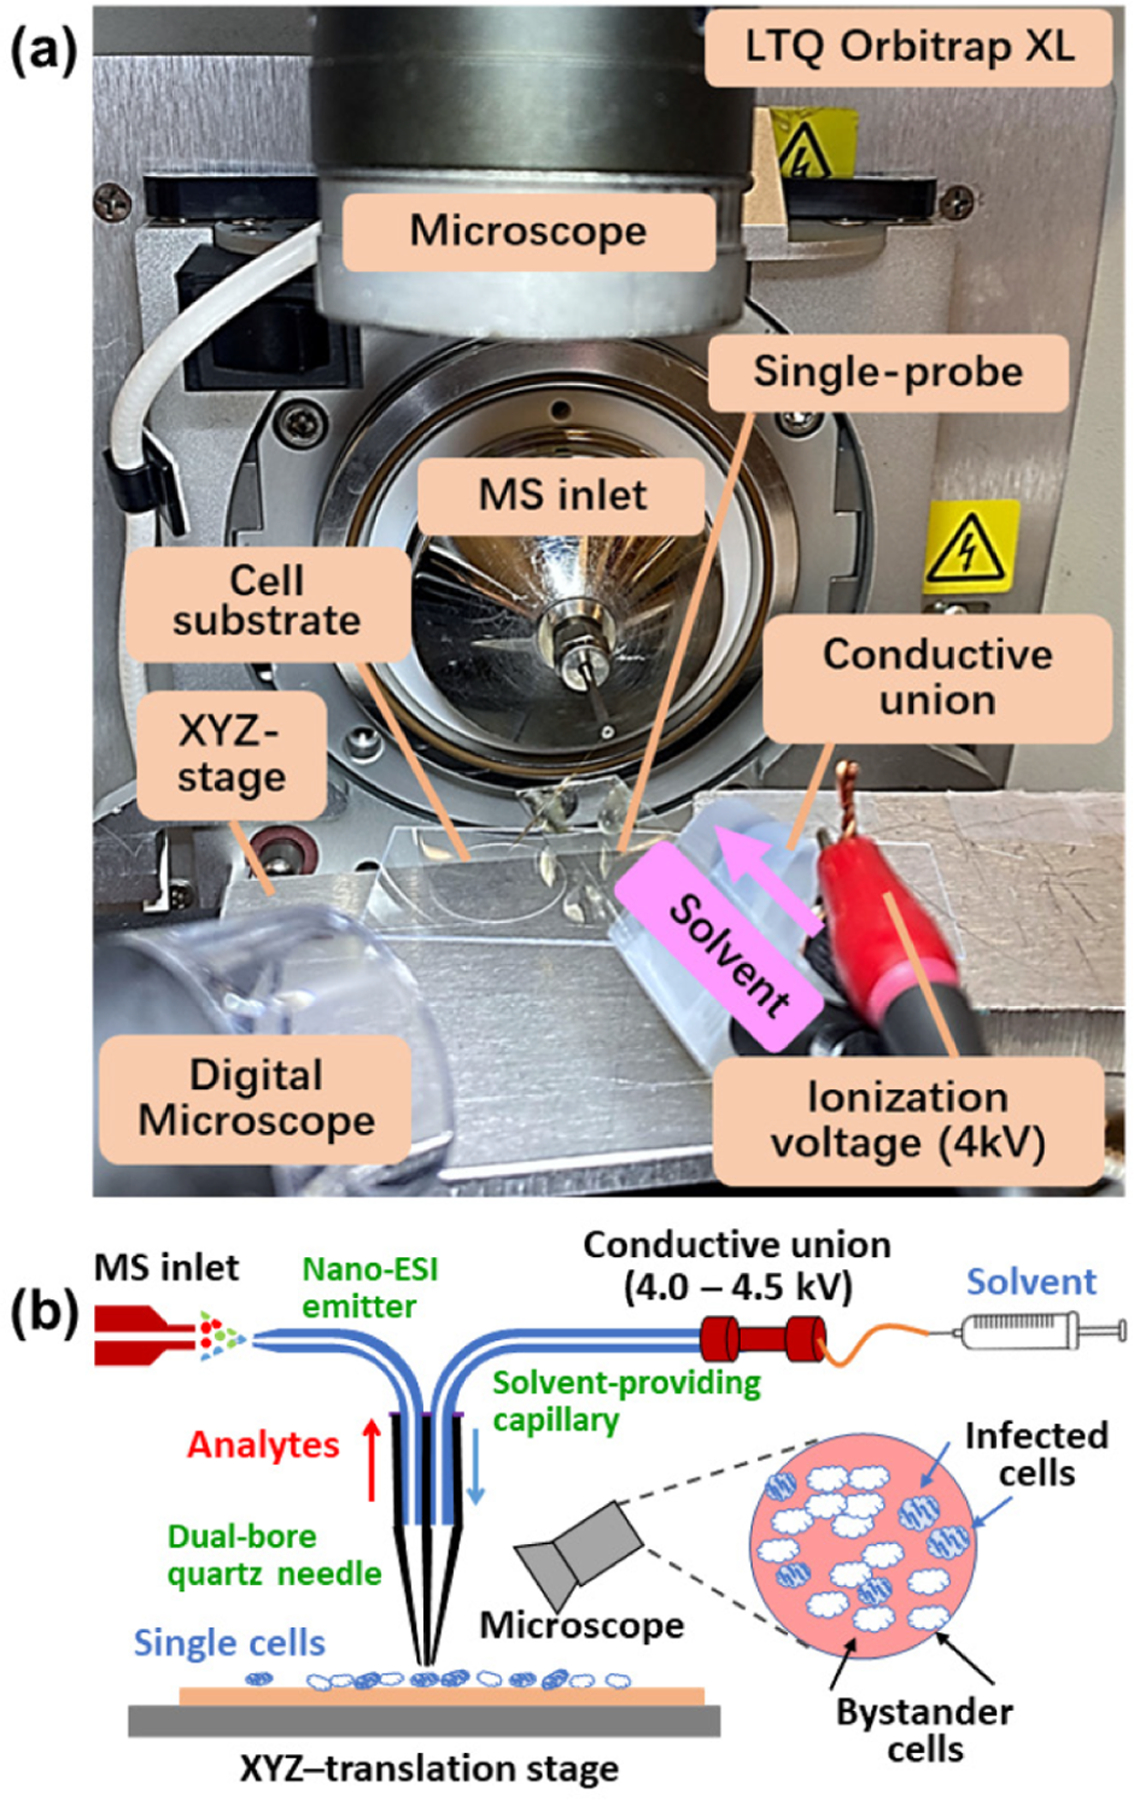
(a) Single-probe single-cell mass spectrometry (SCMS) setup. (b) Schematic of the working mechanisms of the experimental setup.
In the current study, we focused on metabolomics of single cells infected by T. cruzi, due to the crucial role of metabolism in CD.6c,26 The experiments were conducted using the Single-probe SCMS technique to analyze HeLa cells, which were used as the model system in three different groups: T. cruzi-infected, bystander (i.e., uninfected cells that are adjacent to infected cells), and control cells (no parasite exposure). Our results revealed striking bystander effects of infection, including metabolic pathways commonly perturbed in infected cells and bystander cells. These results help improve our understanding of host pathways of CD pathogenesis and may help develop new treatments to address late-stage disease that cannot be cured by antiparasitic agents. Furthermore, our approach is compatible with biosafety protocols and thus should have broad applicability to other intracellular pathogenic agents.
During chronic T. cruzi infection, only a minority of cells are infected.27 Although parasite persistence is required for disease progression,28 CD symptoms can nevertheless develop even with low parasite load that may be spatially disconnected from sites of tissue damage.29 SCMS analyses of infected and uninfected cells in the same culture plate, in comparison to control wells, can deconvolute direct effects of T. cruzi infection from bystander effects of infection. HeLa cells were used as a model and infected with β-galactosidase-expressing T. cruzi.30 Cells were fixed by glutaraldehyde to kill the parasites and ensure biosafety. The fixed parasites were then stained with X-gal, enabling us to clearly differentiate parasite-containing cells (containing blue amastigote-stage parasites) from bystander cells (do not contain blue-staining regions) by bright-field microscopy (Figure 2a). These observations match with previous publications regarding this parasite strain.31 SCMS measurements were performed not only on these infected and bystander cells but also on control cells from a separate, uninfected culture well.
Figure 2.
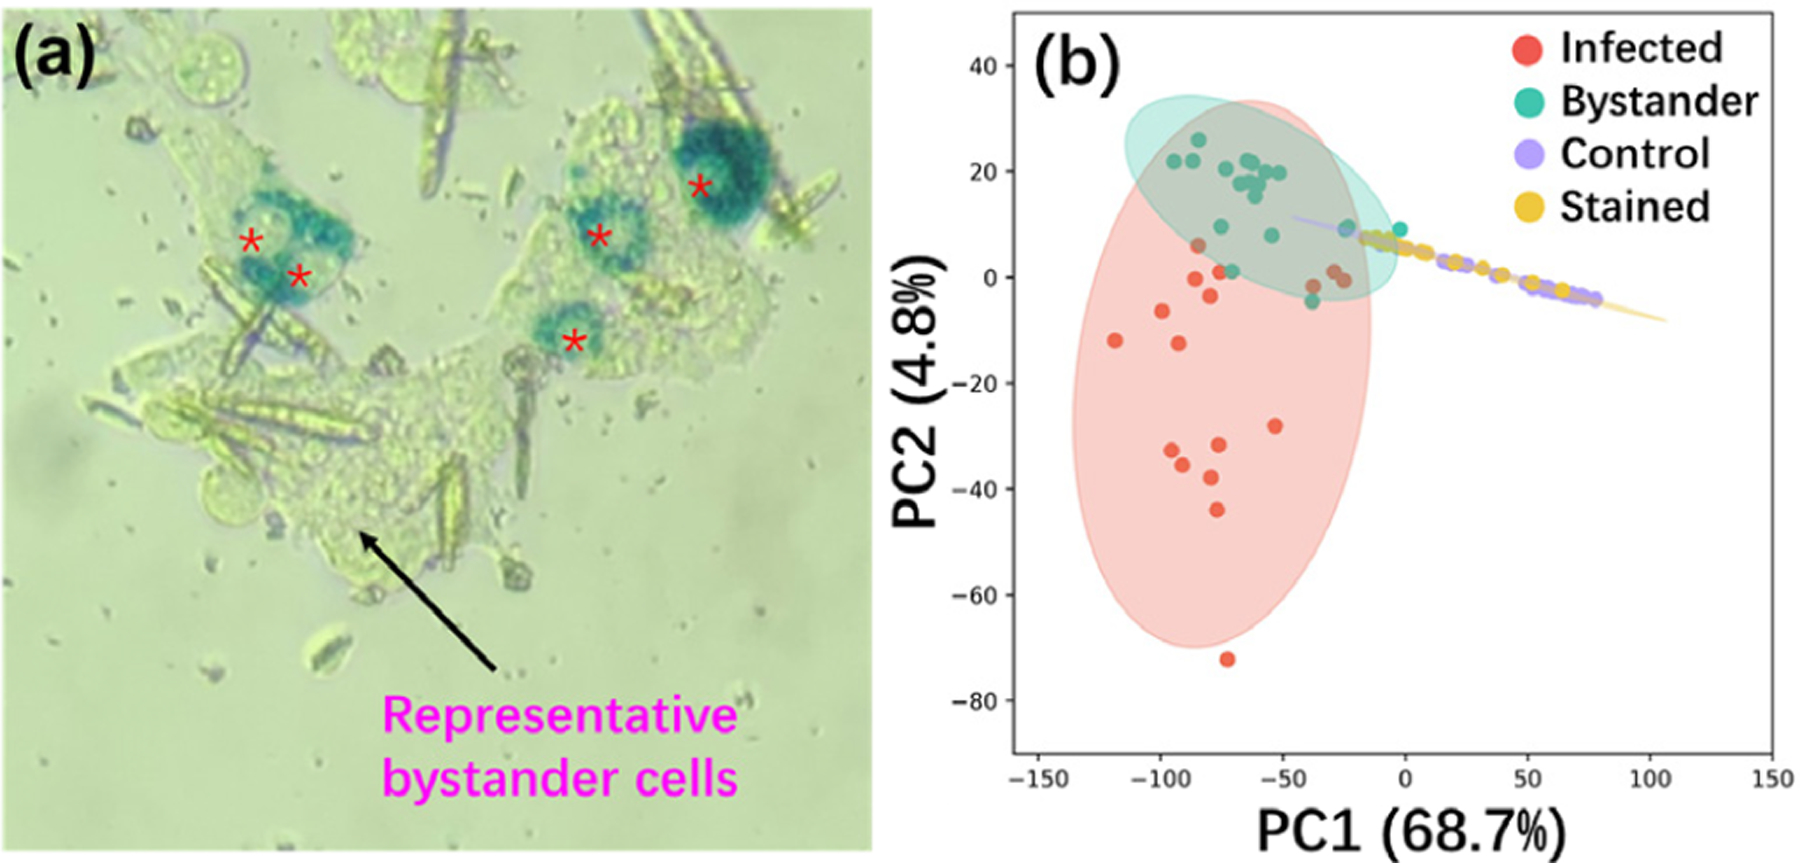
Influence of the optimized fixation and staining processes on the overall profiles of cellular metabolites in HeLa cells infected by T. cruzi. (a) Bright-field microscopy picture of HeLa cells infected with β-galactosidase-expressing T. cruzi. Cells were fixed by glutaraldehyde and stained by X-gal. Individual T. cruzi parasites become stained a deep blue, so that infected cells with intracellular T. cruzi amastigotes (stained as deep blue in an oval shape; infected cells indicated by red asterisks) can be distinguished from bystander cells (adjacent uninfected cells; representative cell indicated by a black arrow) that remain clear. (b) PCA results. Without parasite infection, cells have comparable profiles of metabolites without (control) and with (stained) the fixation and staining processes. Cells exposed to parasites (infected and bystander cells) present significantly different metabolite profiles than unexposed cells (control and stained).
PCA (principal component analysis) showed that the fixation and staining processes had no significant influence on the overall cellular metabolite profiles (Figure 2b and Supporting Information Figure S4a). This conclusion was further confirmed by PLS-DA (partial least-squares discriminant analysis) (p = 0.49 by permutation test, Figure S4b,c). As expected, parasite-containing cells have different overall metabolite compositions compared to bystander cells. However, strikingly, both cell types differed in terms of overall metabolome from control and stained cells (both are uninfected). This finding supports bystander effects of T. cruzi infection on the overall cellular metabolome and provides a metabolic mechanism to explain the development of Chagas disease lesions at sites with low parasite burden.32
PCA results showed that a subset of bystander cells was particularly similar to (i.e., overlapped with) infected cells from the same culture plate (Figure 2b and Figure 3a). Indeed, random forest machine learning algorithms misclassified 16 out of 53 bystander cells as infected (Table 1). In contrast, 62 out of 68 infected cells were correctly classified. It is worth noting that a large portion of control cells was misclassified as stained cells and vice versa, supporting that fixation and staining processes have no significant influence on cell metabolites. We then manually regrouped the bystander cells into correctly classified and misclassified subgroups and conducted PCA. We observed a high degree of similarity between the misclassified and infected cells (Figure 3b). To determine metabolites with significantly different abundances among the infected cells and the two bystander groups (correctly classified and misclassified infected cells), we performed ANOVA (with false discovery rate (FDR) correction and adjusted p-value ≤ 0.05) (Table S4 and Figure S1). We obtained 16 ions from all groups possessing strikingly similar patterns for both misclassified bystander cells and infected cells across two independent experimental replicates (e.g., lower levels of m/z 267.0620, 322.886, and 359.025 compared to correctly classified bystander cells) (Table S4 and Figure S2).
Figure 3.
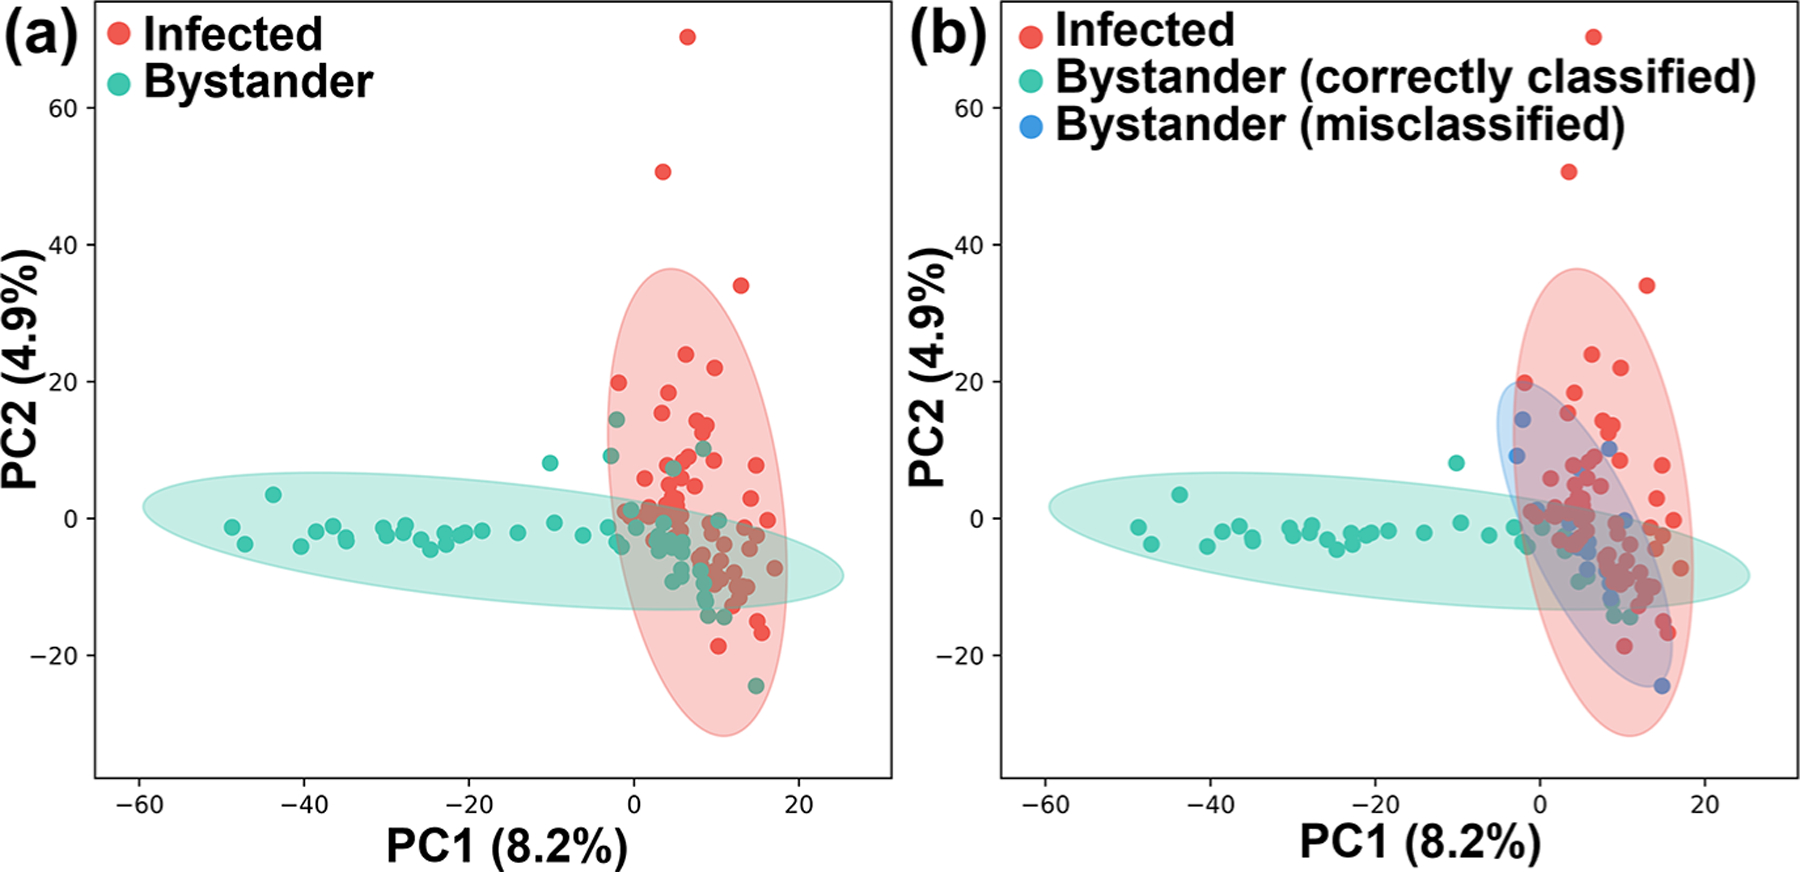
Impact of T. cruzi infection on the metabolome of bystander uninfected cells. (a) PCA of SCMS data highlighting metabolic overlap between T. cruzi infected cells and a subset of bystander cells. (b) PCA analysis of SCMS data as in panel a, colored based on random forest classifier prediction. Misclassified uninfected bystander cells have overall metabolomes similar to infected cells.
Table 1.
Random Forest Classification of Single Cells
| predicted | |||||
|---|---|---|---|---|---|
| control | stained | infected | bystander | classification error | |
| correct | |||||
| control | 48 | 12 | 1 | 0 | 0.213 |
| stained | 25 | 13 | 0 | 0 | 0.658 |
| infected | 0 | 1 | 62 | 5 | 0.014 |
| bystander | 3 | 1 | 16 | 33 | 0.32 |
To annotate these ions, we performed MS/MS of both single cells (using the Single-probe SCMS method) and cell lysate (using LC-MS/MS). Similar to our previous studies, 19a,33 some species could only be detected in the SCMS experiments, likely due to multiple reasons (e.g., differences in sample preparation methods, matrix compositions, and stabilities of molecules during sample preparation) (Table S4). As expected in untargeted metabolomics,34 most metabolite features could not be annotated (Table S4). Among all annotatable metabolites, m/z 756.547 was annotated as PC(34:3), LPC(34:4), or PC(O-34:4) (Table S4 and Figure 4). This lipid significantly differed in abundance between cell groups (p = 2.33 × 10⁻⁴ using ANOVA test with false discovery rate correction (Figure 4a)). It is interesting to note that, similar to infected cells, misclassified bystander cells also contain higher abundances of this species (Figure 4a). Other infection-elevated metabolites were also annotated as glycerophosphocholines (GPCs), including m/z 768.583, 780.5460, 782.5630, 808.5770, and 810.5940 (Table S4 and Figure S3). This observation concurs with our prior findings of infection-elevated GPCs in heart tissue in proportion to disease severity and in the infected esophagus and large intestine, in mice across multiple infection time points and parasite strains.4b,5a,6a,b While confidently assigning a parasite vs host origin to these GPCs is challenging, very long-chain GPCs and lysoglycerophosphocholines (Lyso-GPCs) are elevated in isolated amastigote-stage T. cruzi compared to host cells.35 These findings may support further redevelopment of therapeutics targeting phosphatidylcholine metabolism, such as miltefosine, currently in clinical use for the related parasite Leishmania, but in this case to target the metabolic consequences of infection on the host.36
Figure 4.
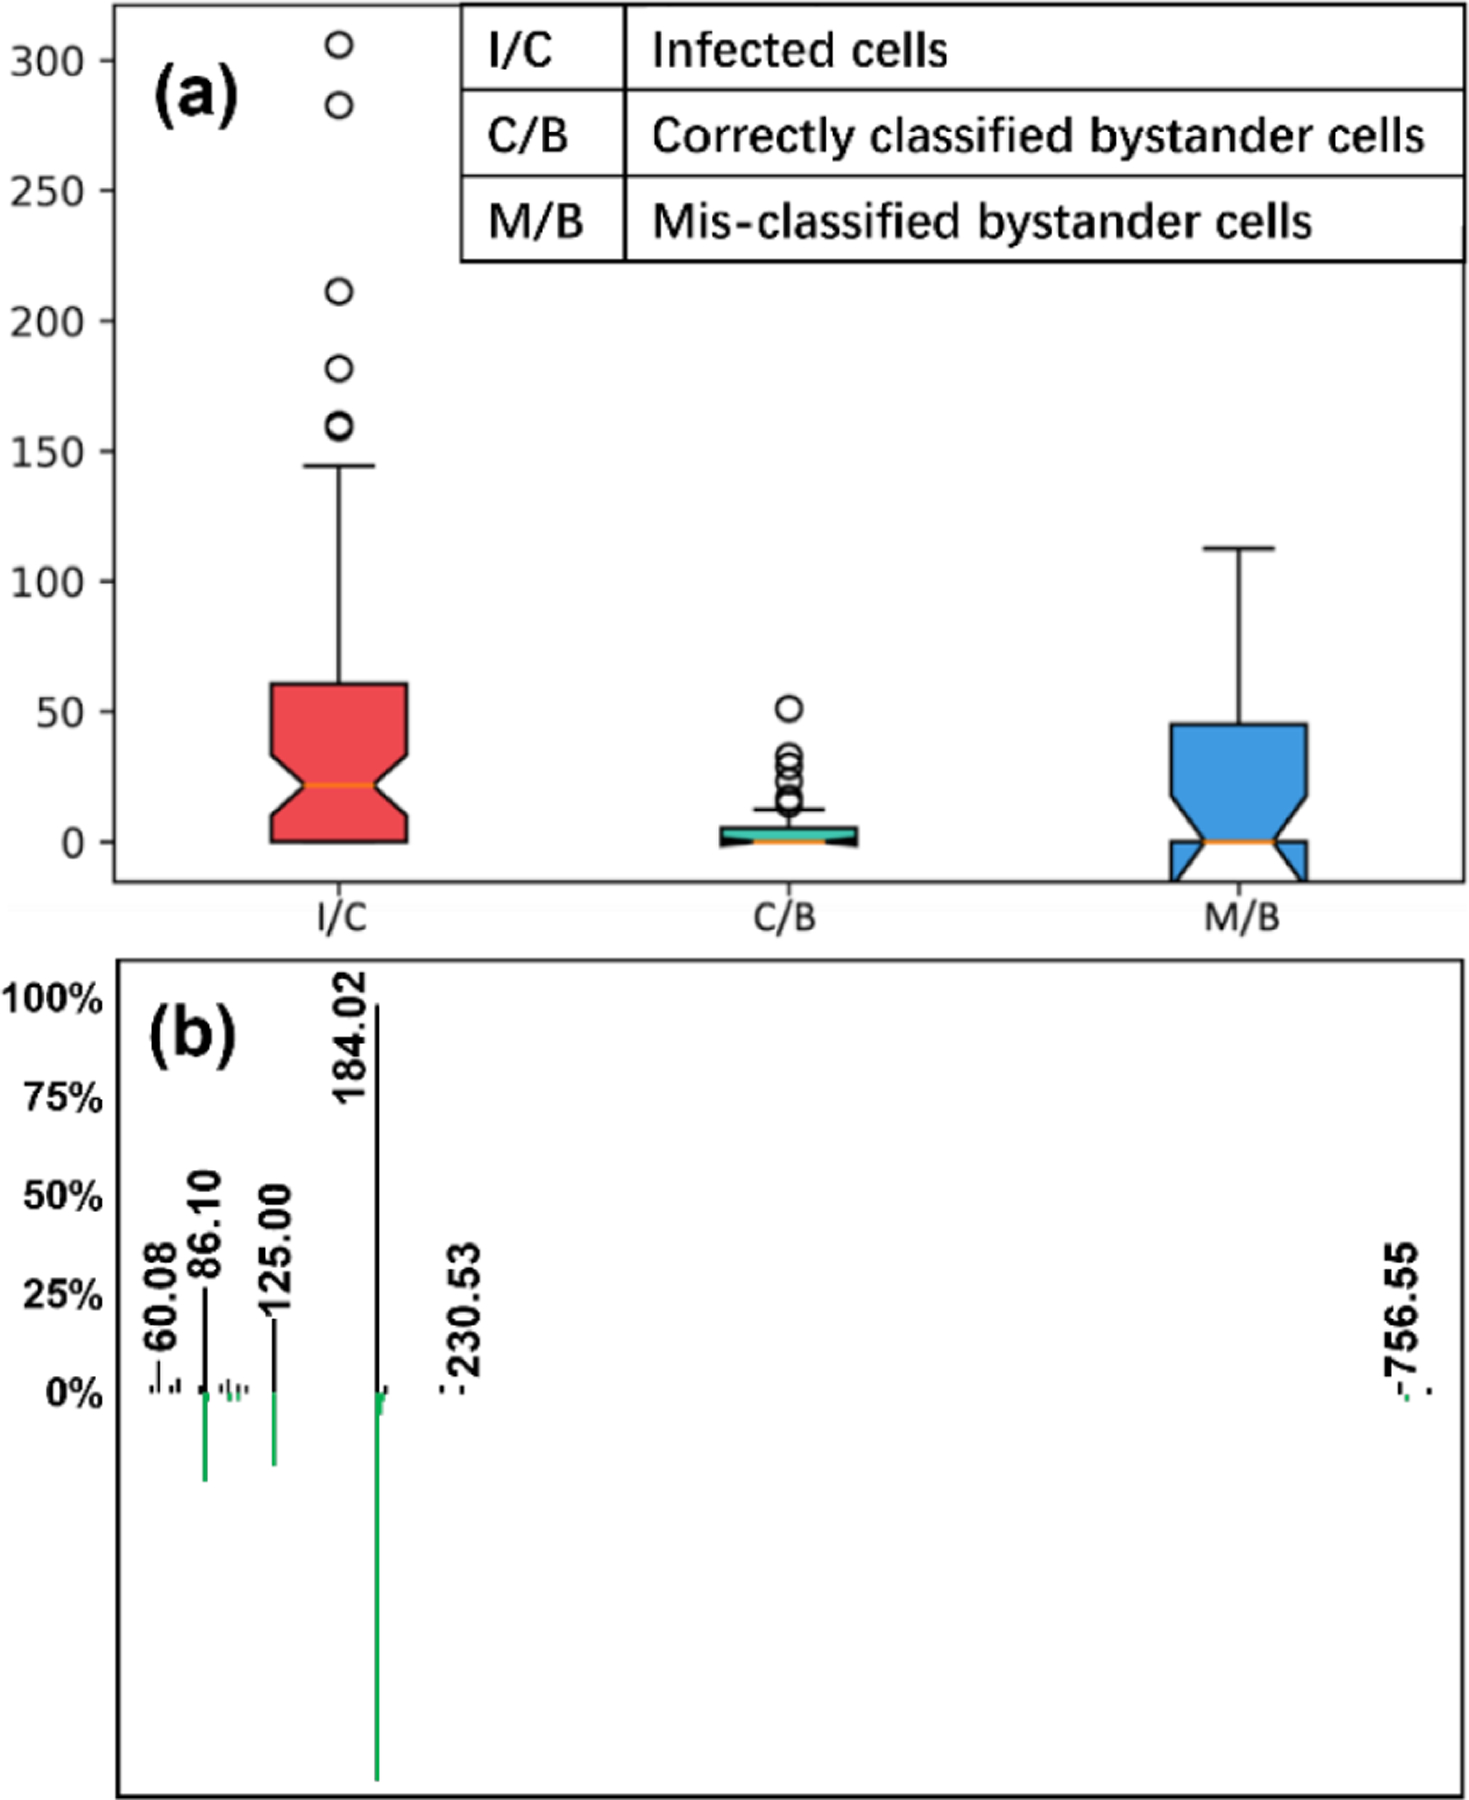
Representative glycerophosphocholine (m/z 756.547) differentiating between cell groups. (a) Normalized intensity of PC(34:3) in three different cell types (p = 0.000233 using ANOVA test with FDR correction). (b) LC-MS/MS mirror plot supporting PC annotation. Green, reference library MS/MS spectrum for 1-oleoyl-2-palmitoyl-sn-glycero-3-phosphocholine (PC 34:1). Black, experimental MS/MS spectrum for m/z 756.547. m/z 756.547 is smaller by 4.03 than that of 1-oleoyl-2-palmitoyl-sn-glycero-3-phosphocholine.
In conclusion, we used the Single-probe SCMS technique for metabolomics studies of cells with heterogeneous infection by T. cruzi at the single-cell level. This represents, to the best of our knowledge, the first implementation of single-cell metabolomics in mammalian-infectious disease. We discovered that necessary cell fixation (to kill the parasites) and staining (to illustrate T. cruzi infection) have no significant influence on the overall cell metabolome (Figures 2b and S4). Our results demonstrate for the first time bystander effects of T. cruzi on infection-adjacent uninfected cells (Figures 2b,3, and 4). Although our current studies cannot fully explain the mechanism of this bystander effect, uneven infection may be due to pre-existing heterogeneity of host cells. For example, the bystander cells may belong to a subpopulation of host cells containing lower levels of nutrients needed to support parasite intracellular replication. Alternatively, these differences may be established subsequent to parasite infection, through the secretion of metabolites or proteins by infected cells that reshape bystander cell metabolism.
Our results provide a significant insight into CD pathogenesis, explaining lesion development in sites that do not contain parasites.29 This has major implications for CD treatment, indicating that killing parasites alone may not be sufficient. Our results may explain the failure of the benznidazole evaluation for interrupting trypanosomiasis (BENEFIT) clinical trial37 and pave the way for future work to assess the role of metabolic heterogeneity in CD pathogenesis, tissue resilience, parasite dormancy, and antiparasitic susceptibility.
SAFETY CONSIDERATIONS
Silica capillaries pose a needle-stick hazard, and they must be handled with caution. Standard safety protocols are needed for the handling of chemicals and culturing and treating of cell lines. T. cruzi is classified at biosafety level 2 (BSL-2) in the United Sates. All unfixed T. cruzi should only be handled inside a biosafety cabinet by trained operators wearing safety glasses, laboratory coats and double gloves. Ambient experimentation on open parasite-containing receptacles outside of the biosafety cabinet should only be performed after fixation processes have killed the parasites.
Supplementary Material
ACKNOWLEDGMENTS
This work was supported by start-up funds from the University of Oklahoma (to L.-I.M.). L.-I.M. holds an Investigators in the Pathogenesis of Infectious Disease Award from the Burroughs Wellcome Fund. Z.Y. is supported by the National Institutes of Health (Grant R01GM116116), National Science Foundation (Grant OCE-1634630), and Research Council of the University of Oklahoma Norman Campus. The content is solely the responsibility of the authors and does not necessarily represent the official views of the funders.
Footnotes
Supporting Information
The Supporting Information is available free of charge at https://pubs.acs.org/doi/10.1021/acs.analchem.2c02279.
Experimental details of cell culture, parasite culture, cell infection and staining, Single-probe single-cell mass spectrometry, and LC-MS/MS and GNPS parameters; tables of annotated metabolites and their MS/MS spectra; boxplot and hierarchical clustering of metabolites; PCA and PLS-DA analyses; Python script and R script (PDF)
Complete contact information is available at: https://pubs.acs.org/10.1021/acs.analchem.2c02279
The authors declare no competing financial interest.
Contributor Information
Tra D. Nguyen, Department of Chemistry and Biochemistry, University of Oklahoma, Norman, Oklahoma 73019, United States.
Yunpeng Lan, Department of Chemistry and Biochemistry, University of Oklahoma, Norman, Oklahoma 73019, United States.
Shelley S. Kane, Department of Chemistry and Biochemistry, University of Oklahoma, Norman, Oklahoma 73019, United States
Jacob J. Haffner, Laboratories of Molecular Anthropology and Microbiome Research and Department of Anthropology, University of Oklahoma, Norman, Oklahoma 73019, United States
Renmeng Liu, Department of Chemistry and Biochemistry, University of Oklahoma, Norman, Oklahoma 73019, United States; Present Address: (R.L.) Drug Metabolism, Gilead Sciences Inc., Foster City, CA, 94404, USA..
Laura-Isobel McCall, Department of Chemistry and Biochemistry, University of Oklahoma, Norman, Oklahoma 73019, United States; Laboratories of Molecular Anthropology and Microbiome Research and Department of Microbiology and Plant Biology, University of Oklahoma, Norman, Oklahoma 73019, United States.
Zhibo Yang, Department of Chemistry and Biochemistry, University of Oklahoma, Norman, Oklahoma 73019, United States.
REFERENCES
- (1).(a) Xin X; Wang H; Han L; Wang M; Fang H; Hao Y; Li J; Zhang H; Zheng C; Shen C J. Virol 2018, 92 (9), e00179–18. [DOI] [PMC free article] [PubMed] [Google Scholar]; (b) Raj A; Rifkin SA; Andersen E; van Oudenaarden A Nature 2010, 463 (7283), 913–8. [DOI] [PMC free article] [PubMed] [Google Scholar]
- (2).Kamies R; Martinez-Jimenez CP Mamm. Genome 2020, 31 (5), 170–180. [DOI] [PMC free article] [PubMed] [Google Scholar]
- (3).Fernandes MC; Andrews NW FEMS Microbiol Rev. 2012, 36 (3), 734–47. [DOI] [PMC free article] [PubMed] [Google Scholar]
- (4).(a) D’Avila H; Freire-de-Lima CG; Roque NR; Teixeira L; Barja-Fidalgo C; Silva AR; Melo RC; Dosreis GA; Castro-Faria-Neto HC; Bozza PT J. Infect Dis 2011, 204 (6), 951–61. [DOI] [PubMed] [Google Scholar]; (b) Nagajyothi F; Desruisseaux MS; Weiss LM; Chua S; Albanese C; Machado FS; Esper L; Lisanti MP; Teixeira MM; Scherer PE; Tanowitz HB Memórias do Instituto Oswaldo Cruz 2009, 104, 219–225. [DOI] [PMC free article] [PubMed] [Google Scholar]
- (5).(a) Hoffman K; Liu Z; Hossain E; Bottazzi ME; Hotez PJ; Jones KM; McCall LI ACS Infect Dis 2021, 7 (6), 1638–1649. [DOI] [PMC free article] [PubMed] [Google Scholar]; (b) McCall LI; Morton JT; Bernatchez JA; de Siqueira-Neto JL; Knight R; Dorrestein PC; McKerrow JH Anal. Chem 2017, 89 (19), 10414–10421. [DOI] [PMC free article] [PubMed] [Google Scholar]
- (6).(a) Dean DA; Gautham G; Siqueira-Neto JL; McKerrow JH; Dorrestein PC; McCall L-I PLOS Neglected Tropical Diseases 2021, 15 (10), No. e0009819. [DOI] [PMC free article] [PubMed] [Google Scholar]; (b) Hossain E; Khanam S; Dean DA; Wu C; Lostracco-Johnson S; Thomas D; Kane SS; Parab AR; Flores K; Katemauswa M; Gosmanov C; Hayes SE; Zhang Y; Li D; Woelfel-Monsivais C; Sankaranarayanan K; McCall LI Sci. Adv 2020, 6 (30), No. eaaz2015. [DOI] [PMC free article] [PubMed] [Google Scholar]; (c) Liu Z; Ulrich vonBargen R; McCall LI Curr. Opin Microbiol 2021, 63, 204–209. [DOI] [PMC free article] [PubMed] [Google Scholar]
- (7).(a) Kolodziejczyk AA; Kim JK; Svensson V; Marioni JC; Teichmann SA Mol. Cell 2015, 58 (4), 610–620. [DOI] [PubMed] [Google Scholar]; (b) Bengtsson M; Hemberg M; Rorsman P; Ståhlberg A BMC Molecular Biology 2008, 9 (1), 63. [DOI] [PMC free article] [PubMed] [Google Scholar]; (c) Drayman N; Patel P; Vistain L; Tay S eLife 2019, 8, No. e46339. [DOI] [PMC free article] [PubMed] [Google Scholar]
- (8).(a) Albayrak C; Jordi CA; Zechner C; Lin J; Bichsel CA; Khammash M; Tay S Mol. Cell 2016, 61 (6), 914–24. [DOI] [PubMed] [Google Scholar]; (b) Zhang Y; Naguro I; Herr AE Angew. Chem, Int. Ed. 2019, 58 (39), 13929–13934. [DOI] [PMC free article] [PubMed] [Google Scholar]
- (9).(a) Minakshi P; Ghosh M; Kumar R; Patki HS; Saini HM; Ranjan K; Brar B; Prasad G Single-Cell Metabolomics: Technology and Applications. In Single-Cell Omics; Barh D, Azevedo V, Eds.; Academic Press: 2019; Chapter 15, pp 319–353. DOI: 10.1016/B978-0-12-814919-5.00015-4. [DOI] [Google Scholar]; (b) Kumar R; Ghosh M; Kumar S; Prasad M Front. Microbiol 2020, 11, 1152. [DOI] [PMC free article] [PubMed] [Google Scholar]
- (10).Dolatmoradi M; Samarah LZ; Vertes A Anal. Sens 2022, 2 (1), No. e202100032. [Google Scholar]
- (11).(a) Boggio KJ; Obasuyi E; Sugino K; Nelson SB; Agar NYR; Agar JN Expert Rev. Proteomic 2011, 8 (5), 591–604. [DOI] [PMC free article] [PubMed] [Google Scholar]; (b) Jungnickel H; Laux P; Luch A Toxics 2016, 4 (1), 5. [DOI] [PMC free article] [PubMed] [Google Scholar]
- (12).Masujima T Anal. Sci 2009, 25 (8), 953–960. [DOI] [PubMed] [Google Scholar]
- (13).Gong XY; Zhao YY; Cai SQ; Fu SJ; Yang CD; Zhang SC; Zhang XR Anal. Chem 2014, 86 (8), 3809–3816. [DOI] [PubMed] [Google Scholar]
- (14).Shrestha B; Vertes A Anal. Chem 2009, 81 (20), 8265–8271. [DOI] [PubMed] [Google Scholar]
- (15).Bergman HM; Lanekoff I Analyst 2017, 142 (19), 3639–3647. [DOI] [PubMed] [Google Scholar]
- (16).Pan N; Rao W; Kothapalli NR; Liu R; Burgett AWG; Yang Z Anal. Chem 2014, 86 (19), 9376–9380. [DOI] [PubMed] [Google Scholar]
- (17).Zhu Y; Wang W; Yang Z Anal. Chem 2020, 92 (16), 11380–11387. [DOI] [PMC free article] [PubMed] [Google Scholar]
- (18).Liu R; Pan N; Zhu Y; Yang Z Anal. Chem 2018, 90 (18), 11078–11085. [DOI] [PMC free article] [PubMed] [Google Scholar]
- (19).(a) Liu R; Sun M; Zhang G; Lan Y; Yang Z Anal. Chim. Acta 2019, 1092, 42–48. [DOI] [PMC free article] [PubMed] [Google Scholar]; (b) Standke SJ; Colby DH; Bensen RC; Burgett AWG; Yang Z Anal. Chem 2019, 91 (3), 1738–1742. [DOI] [PMC free article] [PubMed] [Google Scholar]; (c) Pan N; Standke SJ; Kothapalli NR; Sun M; Bensen RC; Burgett AWG; Yang Z Analytical chemistry 2019, 91 (14), 9018–9024. [DOI] [PMC free article] [PubMed] [Google Scholar]; (d) Sun M; Tian X; Yang Z Anal. Chem 2017, 89 (17), 9069–9076. [DOI] [PMC free article] [PubMed] [Google Scholar]; (e) Standke SJ; Colby DH; Bensen RC; Burgett AWG; Yang ZJ Vis. Exp 2019, 148, e59875. [DOI] [PMC free article] [PubMed] [Google Scholar]; (f) Tian X; Zhang G; Zou Z; Yang Z Anal. Chem 2019, 91 (9), 5802–5809. [DOI] [PMC free article] [PubMed] [Google Scholar]
- (20).Liu R; Zhang G; Yang Z Chem. Commun. (Camb) 2019, 55 (5), 616–619. [DOI] [PMC free article] [PubMed] [Google Scholar]
- (21).(a) Roberts BL; Severance ZC; Bensen RC; Le AT; Kothapalli NR; Nuñez JI; Ma H; Wu S; Standke SJ; Yang Z; Reddig WJ; Blewett EL; Burgett AWG ACS Chem. Biol 2019, 14 (2), 276–287. [DOI] [PMC free article] [PubMed] [Google Scholar]; (b) Liu M; Zhang Y; Yang J; Cui X; Zhou Z; Zhan H; Ding K; Tian X; Yang Z; Fung KA; Edil BH; Postier RG; Bronze MS; Fernandez-Zapico ME; Stemmler MP; Brabletz T; Li YP; Houchen CW; Li M Gastroenterology 2020, 158 (3), 679–692 e1. [DOI] [PMC free article] [PubMed] [Google Scholar]; (c) Bensen RC; Standke SJ; Colby DH; Kothapalli NR; Le-McClain AT; Patten MA; Tripathi A; Heinlen JE; Yang Z; Burgett AWG ACS Pharmacology & Translational Science 2021, 4 (1), 96–100. [DOI] [PMC free article] [PubMed] [Google Scholar]
- (22).Sun M; Yang Z Anal. Chem 2019, 91 (3), 2384–2391. [DOI] [PMC free article] [PubMed] [Google Scholar]
- (23).Sun M; Yang Z; Wawrik B Front. Plant Sci 2018, 9, 571. [DOI] [PMC free article] [PubMed] [Google Scholar]
- (24).(a) Rao W; Pan N; Yang ZJ Am. Soc. Mass Spectrom 2015, 26 (6), 986–93. [DOI] [PubMed] [Google Scholar]; (b) Rao W; Pan N; Tian X; Yang ZJ Am. Soc. Mass Spectrom 2016, 27 (1), 124–134. [DOI] [PMC free article] [PubMed] [Google Scholar]; (c) Rao W; Pan N; Yang Z J. Vis. Exp 2016, 112, e53911. [DOI] [PMC free article] [PubMed] [Google Scholar]; (d) Tian X; Xie B; Zou Z; Jiao Y; Lin L-E; Chen C-L; Hsu C-C; Peng J; Yang Z Anal. Chem 2019, 91 (20), 12882–12889. [DOI] [PMC free article] [PubMed] [Google Scholar]
- (25).Sun M; Tian X; Yang Z Anal. Chem 2017, 89 (17), 9069–9076. [DOI] [PMC free article] [PubMed] [Google Scholar]
- (26).Dumoulin PC; Burleigh BA Curr. Opin Microbiol 2021, 63, 244–249. [DOI] [PMC free article] [PubMed] [Google Scholar]
- (27).(a) Khan AA; Langston HC; Costa FC; Olmo F; Taylor MC; McCann CJ; Kelly JM; Lewis MD PLOS Pathogens 2021, 17 (8), No. e1009864. [DOI] [PMC free article] [PubMed] [Google Scholar]; (b) Ward AI; Lewis MD; Khan AA; McCann CJ; Francisco AF; Jayawardhana S; Taylor MC; Kelly JM mBio 2020, 11 (4), No. e01242–20. [DOI] [PMC free article] [PubMed] [Google Scholar]
- (28).Tarleton RL Trends Parasitol 2003, 19 (10), 447–51. [DOI] [PubMed] [Google Scholar]
- (29).(a) Marcon GE; de Albuquerque DM; Batista AM; Andrade PD; Almeida EA; Guariento ME; Teixeira MA; Costa SC Mem. Inst. Oswaldo Cruz 2011, 106 (1), 85–91. [DOI] [PubMed] [Google Scholar]; (b) Ward AI; Lewis MD; Taylor MC; Kelly JM bioRxiv 2022, 90, e0038221. [DOI] [PMC free article] [PubMed] [Google Scholar]
- (30).Buckner FS; Verlinde CL; La Flamme AC; Van Voorhis WC Antimicrob. Agents Chemother 1996, 40 (11), 2592–7. [DOI] [PMC free article] [PubMed] [Google Scholar]
- (31).(a) Buckner FS; Verlinde CL; LaFlamme AC; Van Voorhis WC Antimicrob. Agents Chemother 1996, 40 (11), 2592–2597. [DOI] [PMC free article] [PubMed] [Google Scholar]; (b) Buckner FS; Wilson AJ; Van Voorhis WC Infect. Immun 1999, 67 (1), 403–9. [DOI] [PMC free article] [PubMed] [Google Scholar]
- (32).Higuchi M. d. L.; De Brito T; Martins Reis M; Barbosa A; Bellotti G; Pereira-Barreto AC; Pileggi F Cardiovasc Pathol 1993, 2 (2), 101–106. [DOI] [PubMed] [Google Scholar]
- (33).Liu R; Yang Z Anal. Chim. Acta 2021, 1143, 124–134. [DOI] [PMC free article] [PubMed] [Google Scholar]
- (34).da Silva RR; Dorrestein PC; Quinn RA Proc. Natl. Acad. Sci. U. S. A 2015, 112 (41), 12549–12550. [DOI] [PMC free article] [PubMed] [Google Scholar]
- (35).Gazos-Lopes F; Martin JL; Dumoulin PC; Burleigh BA PLOS Pathogens 2017, 13 (12), No. e1006800. [DOI] [PMC free article] [PubMed] [Google Scholar]
- (36).(a) Vakil NH; Fujinami N; Shah PJ Pharmacotherapy: The Journal of Human Pharmacology and Drug Therapy 2015, 35 (5), 536–545. [DOI] [PubMed] [Google Scholar]; (b) P. A. Sales Junior; Molina I; Fonseca Murta SM; Sánchez-Montalvá A; Salvador F; Corrêa-Oliveira R; Carneiro CM Am. J. Trop Med. Hyg 2017, 97 (5), 1289–1303. [DOI] [PMC free article] [PubMed] [Google Scholar]
- (37).Morillo CA; Marin-Neto JA; Avezum A; Sosa-Estani S; Rassi A; Rosas F; Villena E; Quiroz R; Bonilla R; Britto C; Guhl F; Velazquez E; Bonilla L; Meeks B; Rao-Melacini P; Pogue J; Mattos A; Lazdins J; Rassi A; Connolly SJ; Yusuf S N Engl J. Med 2015, 373 (14), 1295–1306. [DOI] [PubMed] [Google Scholar]
Associated Data
This section collects any data citations, data availability statements, or supplementary materials included in this article.