Abstract
Significant efforts such as the Pediatric Proton/Photon Consortium Registry (PPCR) involving multiple proton therapy centers have been made to conduct collaborative studies evaluating outcomes following proton therapy. As a groundwork dosimetry effort for the late effect investigation, we developed a Monte Carlo (MC) model of proton pencil beam scanning (PBS) to estimate organ/tissue doses of pediatric patients at the Maryland Proton Treatment Center (MPTC), one of the proton centers involved in the PPCR. The MC beam modeling was performed using the TOPAS (TOol for PArticle Simulation) MC code and commissioned to match measurement data within 1% for range and 0.3 mm for spot sizes. The established MC model was then tested by calculating organ/tissue doses for sample intracranial and craniospinal irradiations on whole-body pediatric computational human phantoms. The simulated dose distributions were compared with the treatment planning system dose distributions, showing the 3mm/3% gamma index passing rates of 94–99%, validating our simulations with the MC model. The calculated organ/tissue doses per prescribed doses for the craniospinal irradiations (1 mGy Gy−1 to 1 Gy Gy−1) were generally much higher than those for the intracranial irradiations (2.1 μGy Gy−1 to 0.1 Gy Gy−1), which is due to the larger field coverage of the craniospinal irradiations. The largest difference was observed at the adrenal dose, i.e., ~3000 times. In addition, the calculated organ/tissue doses were compared with those calculated with a simplified MC model, showing that the beam properties (i.e., spot size, spot divergence, mean energy, and energy spread) do not significantly influence dose calculations despite the limited irradiation cases. This implies that the use of the MC model commissioned to the MPTC measurement data might be dosimetrically acceptable for patient dose reconstructions at other proton centers particularly when their measurement data are unavailable. The developed MC model will be used to reconstruct organ/tissue doses for MPTC pediatric patients collected in the PPCR.
1. Introduction
The number of proton therapy centers worldwide has grown exponentially since the early 1990s when the first hospital-based centers opened (Journy et al 2018). Since 2012, the number of centers has doubled from about 30 to 60 and by 2025, more than 130 centers in 31 countries are expected to be in operation. Due to the presence of the Bragg peak, proton therapy promises to improve treatment efficacy by reducing doses to normal tissues compared to conventional radiotherapy using photons or electrons. Proton therapy may provide considerable clinical benefits by reducing treatment toxicities and improving survival rates, particularly for pediatric patients whose tumors are located closer to critical normal tissues compared to adults due to their smaller body size (Gondi et al 2016).
However, the advantage of proton therapy might be diminished by the fact that secondary neutrons generated from beam collimators and patient anatomy mostly contribute to normal tissue doses. The relative biological effectiveness (RBE) of neutrons for cancer induction could be more than 20 (Schneider et al 2005, Brenner and Hall 2008). Understanding the late effects after proton therapy is critical, especially for pediatric patients who are in a higher risk than adults because of higher radiosensitivity of their tissues and their longer life expectancy (Xu et al 2008, National Research Council 2006). However, epidemiological data on late health effects such as secondary cancers are sparse. As significant efforts to investigate the risks and benefits of proton therapy in pediatric patients, in 2012 the Pediatric Proton/Photon Consortium Registry (PPCR) (http://www.pedsprotonregistry.org/) was established in the United States (Kasper et al 2014, Hess et al 2018) and in 2017 an International Pediatric Proton Therapy Consortium was proposed for large-scale collaborative studies on an international level. (Berrington de Gonzalez et al 2017).
One of the major uncertainties in radiation risk assessment is the dosimetric uncertainty (Gilbert 2009). Most of the existing proton treatment planning systems (TPSs) are designed to provide doses to the target region of clinical interest and do not consider out-of-field secondary neutron doses (Eley et al 2015). Many studies (Trinkl et al 2017, Schneider et al 2002, Binns and Hough 1997) experimentally measured out-of-field doses as a function of distance to the treatment field, but the data are not sufficient for epidemiological investigations that require individualized dose to the specific organs or tissues where late effects are induced (Jarlskog et al 2008). The out-of-field organ or tissue-specific doses can be estimated with promising accuracy using Monte Carlo (MC) radiation transport techniques, which have been confirmed by a number of studies (Polf and Newhauser 2005, Zhang et al 2013, Jarlskog et al 2008). The level of accuracy achieved by MC dose calculation or other equivalent methods would be beneficial for organ/tissue dose reconstructions of pediatric patients for accurate estimation of late effects risk in epidemiological studies.
In the present study, we developed a MC model to simulate proton pencil beam scanning (PBS) system at the Maryland Proton Treatment Center (MPTC), one of the proton therapy centers involved in the PPCR. The modeling was performed using the TOPAS (TOol for PArticle Simulation) MC code (Perl et al 2012) and methodology similar to that described by Grevillot et al (2011). The beam properties (spot size, spot divergence, mean energy, and energy spread) as a function of the nominal beam energy were commissioned by matching the MPTC beam measurement data. The MC proton beam model was then tested by reconstructing organ and tissue doses of whole-body pediatric computational human phantoms (Lee et al 2010) due to intracranial and craniospinal irradiations. In addition, the influence of the beam properties on dose calculation was investigated by comparing the calculated organ/tissue doses with those calculated with a simplified MC model to see if the MC model commissioned to the MPTC measurement data can be used for patient dose reconstructions at other proton centers.
2. Material and Methods
2.1. Monte Carlo radiation transport code
The TOPAS MC code (ver. 3.1) (Perl et al 2012) was adopted for MC modeling of the MPTC spot scanning beams. TOPAS is an application built with the Geant4 MC toolkit (Allison et al 2016) developed through a collaboration between SLAC National Accelerator Laboratory, Massachusetts General Hospital (MGH), and University of California at San Francisco (UCSF) in order to make it easier for users to perform advanced Monte Carlo simulations of all forms of radiotherapy, without knowledge of the underlying Geant4 MC toolkit or any programing language. TOPAS has been widely used in medical applications, particularly for proton therapy including out-of-field secondary neutron dose calculations (Chung et al 2015, Lin et al 2014, Hartman et al 2018). More detailed information about TOPAS can be found elsewhere (http://www.topasmc.org/).
2.2. MPTC beam measurement data
The measurement data from the MPTC (ProBeam system, Varian Medical System, Inc., USA) used to develop the MC proton beam model include integral depth doses (IDDs) and spot profiles (SPs). The IDDs for the nominal energy ranging from 70 to 245 MeV with 10 MeV intervals were measured using a Bragg peak chamber (Model 340473, PTW, Freiburg, Germany) in a large water tank with outer dimensions 67.5 × 64.5 × 56 cm3 (Blue Phantom 2, IBA Dosimetry, Schwarzenbruck, Germany). The SPs for the same nominal energies considered for the IDDs were measured using the Lynx device (IBA Dosimetry, Schwarzenbruck, Germany) in air at the isocenter (0 cm) and four locations (±10 and ±20 cm) around the isocenter. Note that the nozzle exit is located 42 cm away from the isocenter. The SPs were also measured by inserting a range shifter with three physical thicknesses of 5 cm, 3 cm, and 2 cm, corresponding to the water equivalent thicknesses of 5.7 cm, 3.42 cm, and 2.28 cm, respectively. A spot size is estimated by fitting the SPs using a Gaussian equation and taking a sigma value. More detailed information on the MPTC beam measurement data can be found in Langner et al (2017).
2.3. MC beam modeling
The MC model of the MPTC spot scanning beams was developed based on the approach proposed by Grevillot et al (2011). The general idea of the method is to simulate spot beams starting at the nozzle exit without modeling the full nozzle, relying on the fact that the nozzle components do not strongly affect the beam characteristics (Kimstrand et al 2007). This modeling approach not only significantly improves work efficiency, compared with the entire beam modeling including the nozzle, but also is acceptable in terms of the dosimetry accuracy for patient dose reconstruction because secondary radiations induced from the nozzle components contribute negligibly to patient dose (Xu et al 2008).
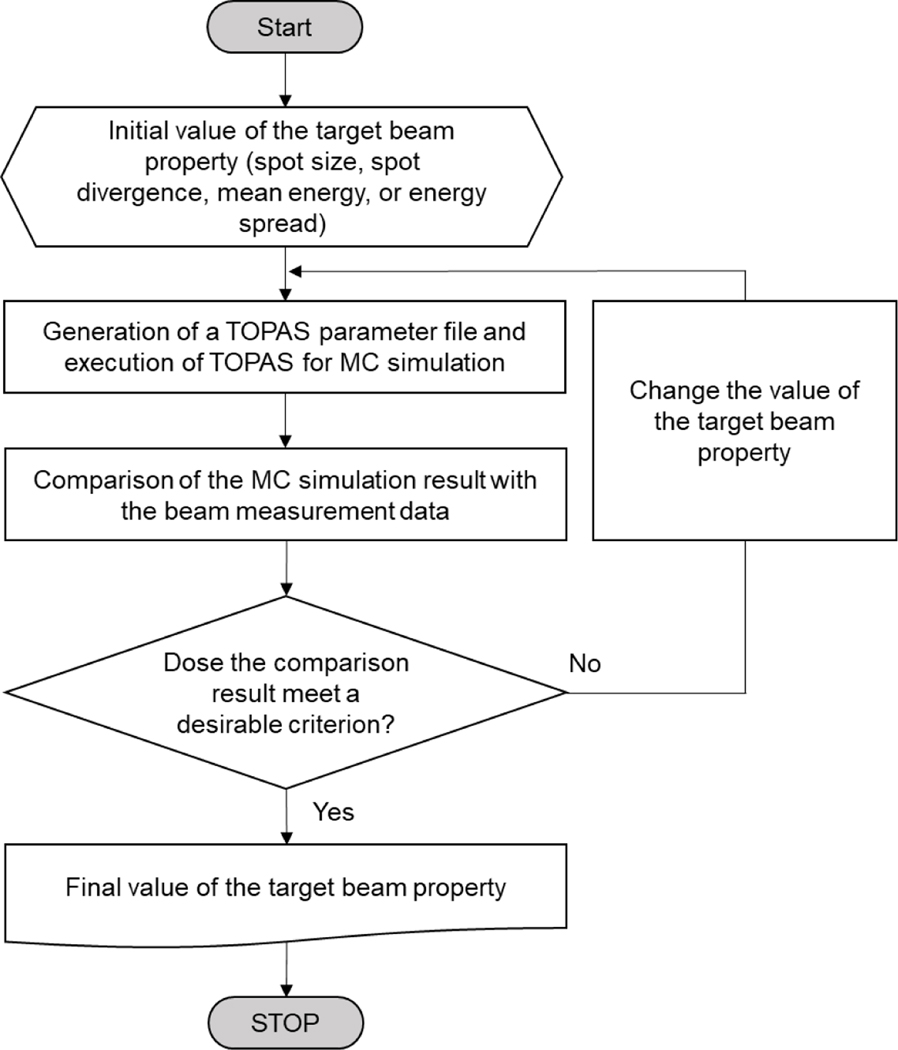
The beam properties (spot size, spot divergence, mean energy, and energy spread) at the nozzle exit as a function of the nominal energy were adjusted to match the MPTC beam measurement data. The optical properties (i.e., spot size and spot divergence) were first adjusted to match the SPs and then the energy properties (i.e., mean energy and energy spread) were adjusted to match the IDDs, as will be explained in detail in Sections 2.3.1 and 2.3.2, respectively. Note that this modeling approach is much simpler than modeling the entire nozzle, but still required a significant number of iterations until an adequate agreement between the MC simulation results and measurement data was achieved. This process was automated by using an in-house MATLAB (R2018b) script, the workflow of which is shown in figure 1.
Figure 1.
Workflow of the developed in-house MC modeling program to automatically match beam properties to beam measurement data.
2.3.1. Modeling beam optical properties
The spot divergence at the nozzle exit was determined by iteratively matching the spot divergence at the isocenter calculated from TOPAS MC simulations to that estimated from the spot sizes of the MPTC beam measurement data. The spot size at the nozzle exit, which had not been determined yet, was assumed to be the value obtained by linear extrapolation of the spot sizes estimated from the measurement data as a function of distance. In addition, the mean energy and energy spread were assumed to be the nominal energy and zero, respectively. Note that optical properties are independent of energy properties (Grevillot et al 2011). The MC simulation was repeated, changing the value of the spot divergence at the nozzle exit (the spot divergence at the isocenter estimated from the MPTC beam data was used as the initial guess value), until the spot divergence at the isocenter calculated from the simulation was matched to that from the measured data within 1% deviation. Next, the spot size at the nozzle exit was determined, again by repeating MC simulation with the determined spot divergence, changing the value of the spot size at the nozzle exit, until the spot size at the isocenter calculated from the simulation was matched within 1% deviation. For the range shifters, the spot divergence at the nozzle exit was additionally adjusted by repeating MC simulation with the determined spot size at the nozzle exit, again until the deviation of the spot size at the isocenter was matched within 1%. The spot size and spot divergence determined at the nozzle exit for all the energies considered in the measurement data were fit to polynomial functions of the nominal energy.
2.3.2. Modeling beam energy properties
The mean energy at the nozzle exit in the MC beam model was determined by the range in water, defined as the distal 80% dose location (R80) in the IDDs of the MPTC beam data. The TOPAS MC simulation was performed by irradiating a water phantom with a monoenergetic proton pencil beam to calculate the IDDs and eventually the R80. The simulation was repeated by changing the mean energy until the R80 calculated from the simulation was matched to the measurement data within 1%. In this simulation, the energy spread was set to zero and the spot size and spot divergence were set to the values determined in the previous section. The energy spread at the nozzle exit was then determined by matching the IDDs of the measurement data. To this end, the TOPAS MC simulation with the determined mean energy was repeated by changing the value of the energy spread until both dose-to-peak deviation and mean point-to-point deviation between the simulation and the measurement data were within 1%. The dose-to-peak deviation was evaluated by using the following equation:
| (1) |
where is the dose-to-peak deviation (%) and and are the maximum dose point (mm) in the IDD from the simulation and the beam measurement data, respectively. The mean point-to-point deviation was evaluated by using the equation:
| (2) |
where is the mean point-to-point deviation (%), is the number of points evaluated in the beam measurement data until the distal 20% dose location, corresponds to a given point, and is the dose at the center between two consecutive points ( and ) from the simulation and the measurement data, respectively, is the distance between two consecutive points ( and ), and is the distance between the first point and the last point. Finally, the mean energy and energy spread determined at the nozzle exit for all the energies were also fit to polynomial functions of the nominal energy.
2.4. Dose calculations for intracranial and craniospinal irradiations
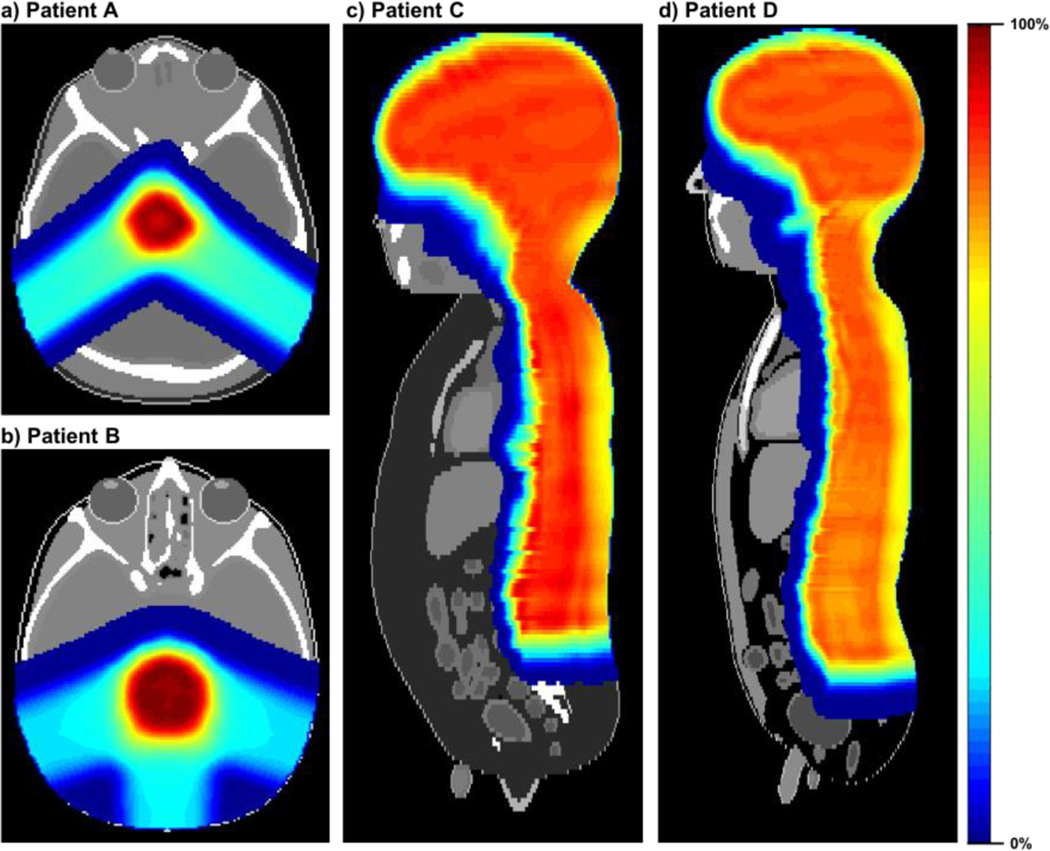
The performance of the MC proton beam model was tested by simulating pediatric patients undergoing intracranial and craniospinal irradiations. As surrogate patient anatomies, we adopted the 1- and 5-year-old computational phantoms developed in collaboration between the University of Florida and the National Cancer Institute (Lee et al 2010). Consequently, four different patients (Patient A: 1-year-old phantom with intracranial irradiation; Patient B: 5-year-old phantom with intracranial irradiation; Patient C: 1-year-old phantom with craniospinal irradiation; and Patient D: 5-year-old phantom with craniospinal irradiation) were assumed in the present study. The computational phantoms were first converted to CT images and structures in the Digital Imaging and Communications in Medicine - Radiotherapy (DICOM-RT) format by using an in-house MATLAB script (Griffin et al 2019). The converted DICOM-RT data were implemented in the MPTC TPS (Eclipse v13.7, Varian Medical Systems, Palo Alto CA) and the intracranial and craniospinal irradiations were planned on the phantoms by a clinical medical physicist (see figure 2). The treatment plan was exported from the TPS as a DICOM-RT PLAN file. The DICOM-RT PLAN was subsequently converted to a TOPAS parameter file, reflecting the beam properties determined at the nozzle exit as a function of the nominal energy. This conversion was automated by an in-house program written in MATLAB (R2018b). In the TOPAS parameter file, we then included patient parameters to implement the computational phantoms and scoring parameters to calculate absorbed dose distribution on the cubic dose grid using the identical voxel resolution to that of the phantoms. In the scoring parameters, the filtering parameter of OnlyIncludeIfParticleOrAncestorNamed set to “neutron” was included to calculate absorbed doses contributed by secondary neutrons. The proton RBE of 1.1 (Paganetti et al 2002) and the neutron RBE of 25 (Brenner and Hall 2008) were employed in the present study to obtain RBE-weighted absorbed doses.
Figure 2.
Dose distributions for proton irradiation cases planned by the MPTC TPS: (a) Patient A (intracranial irradiation on 1-year-old phantom with a prescribed dose of 50 Gy); (b) Patient B (intracranial irradiation on 5-year-old phantom with a prescribed dose of 50 Gy); (c) Patient C (craniospinal irradiation on 1-year-old phantom with a prescribed dose of 23 Gy); and (d) Patient D (craniospinal irradiation on 5-year-old phantom with a prescribed dose of 23 Gy).
To confirm whether the spot scanning beams according to the TPS plans were correctly delivered in the MC simulations, the simulated dose distributions were compared with the TPS dose distributions. For this, 3D gamma analysis (Low et al 1998) between the simulated dose distributions and the TPS dose distributions using a 3%/3mm criterion were evaluated, excluding doses less than 0.2% of the maximum dose (Grevillot et al 2011).
All the simulations presented in the present study were conducted based on the default physics modules: g4em-standard_opt4, g4h-phys_QGSP_BIC_HP, g4decay, g4ion-binarycascade, g4h-elasticHP, and g4stopping as well as the default value (0.05 mm) of secondary production cuts (also called range cuts) for all particles. A total of 1010 primary protons were transported for each simulation, resulting in the statistical relative errors for the calculated organ/tissue-averaged doses to be mostly less than 1%. The simulations were conducted on Biowulf, the National Institute of Health’s high-performance Linux computing cluster (http://hpc.nih.gov).
Another set of dose calculations was performed to investigate the dosimetric impact of variations in the beam properties (spot size, spot divergence, mean energy, and energy spread) that may occur across the different proton facilities involved in large-scale collaborative studies of proton therapy. For this calculation, we used a simplified MC model where the mean energy was set to the nominal energy and the other properties (i.e., spot size, spot divergence, and energy spread) were set to zero.
3. Results
3.1. MC model of MPTC spot scanning beams
The MC model of the MPTC spot scanning beams was developed by determining the polynomial equations for the beam properties (spot size, spot divergence, mean energy, and energy spread) at the nozzle exit by using the beam measurement data at the MPTC. Table 1 shows coefficients of the polynomial equations.
Table 1.
Coefficients of polynomial equations for beam properties at the nozzle exit as a function of the nominal energy
| C0 | C1 | C2 | C3 | |||
|---|---|---|---|---|---|---|
| Spot size (mm) | x | 4.65E+00 | −6.86E-04 | −1.98E-05 | 6.52E-09 | |
| y | 5.33E+00 | −1.33E-03 | −1.25E-04 | 4.16E-07 | ||
| Spot divergence (rad) | Range shifter thickness (cm) | |||||
| 0 | 1.92E-02 | −2.13E-04 | 9.34E-07 | −1.39E-09 | ||
| 1.78E-02 | −1.98E-04 | 1.07E-06 | −2.11E-09 | |||
| 2 | 2.59E-02 | −3.38E-04 | 1.67E-06 | −2.81E-09 | ||
| 2.41E-02 | 3.18E-04 | 1.80E-06 | −3.59E-09 | |||
| 3 | 2.87E-02 | −3.92E-04 | 2.01E-06 | −3.47E-09 | ||
| 3.14E-02 | −4.64E-04 | 2.71E-06 | −5.40E-09 | |||
| 5 | 3.27E-02 | −4.47E-04 | 2.24E-06 | −3.78E-09 | ||
| 4.93E-02 | −7.64E-04 | 4.35E-06 | −8.32E-09 | |||
| Mean energy (MeV) | 4.28E-01 | 9.96E-01 | - | - | ||
| Energy spread (%) | 1.61E+00 | −1.11E-02 | 7.22E-05 | −2.18E-07 | ||
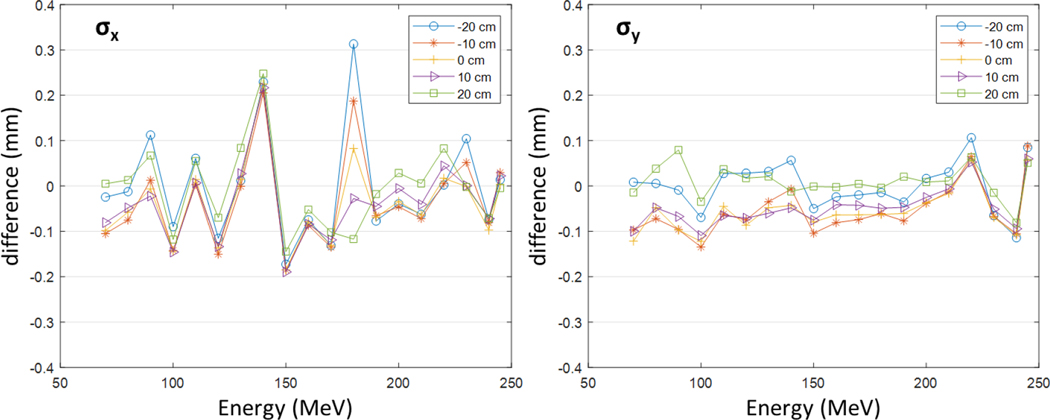
Figure 3 presents the differences of the spot sizes simulated by using the MC model from the measurement data (= simulation - measurement) at the five locations in the air without a range shifter. The differences for most cases were within ±0.1 mm, while some cases show larger differences but less than 0.3 mm. The differences with range shifters were also observed in the similar level although not presented in this figure. The results are clinically acceptable and validate the modeling of the optical properties.
Figure 3.
The differences of the spot sizes simulated with the MC model from the measurement data at the five locations (0, ± 10, and ± 20 cm) in the air without a range shifter.
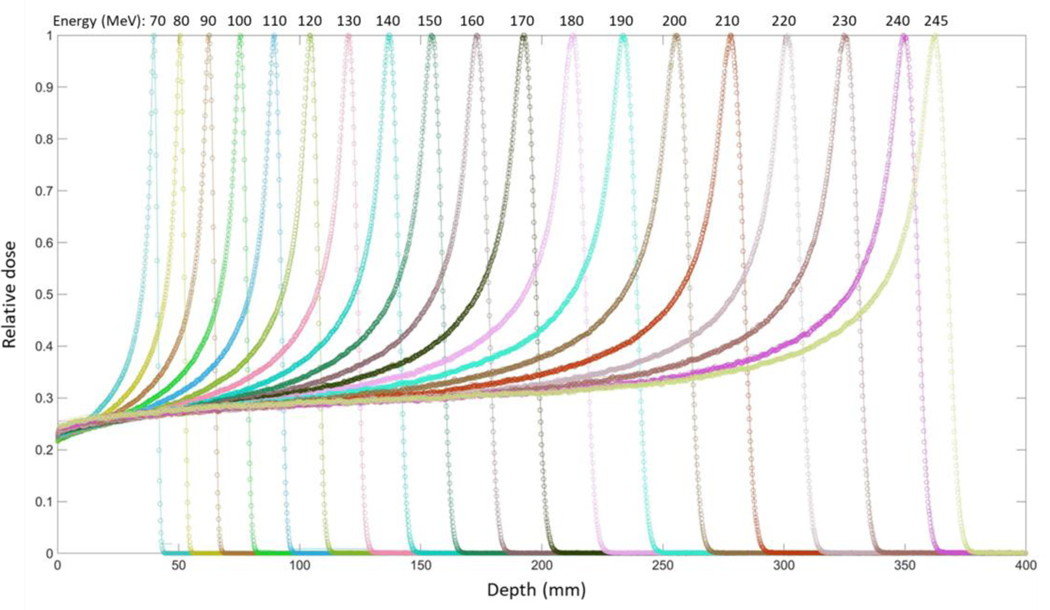
Figure 4 presents the IDDs calculated using the MC model, along with the measurement data, showing that both values are in a good agreement. In addition, both the dose-to-peak deviation and the mean point-to-point deviation between the simulation and measurement data were evaluated by using Equations 1 and 2. All the evaluated results were less than 1%. The obtained results are clinically acceptable and validate the modeling of the energy properties.
Figure 4.
Integral depth doses (IDDs) in water calculated using the MC model established in the present study (circle), along with those of the MPTC measurement data (line).
3.2. Comparison of MC-based dose distribution with TPS
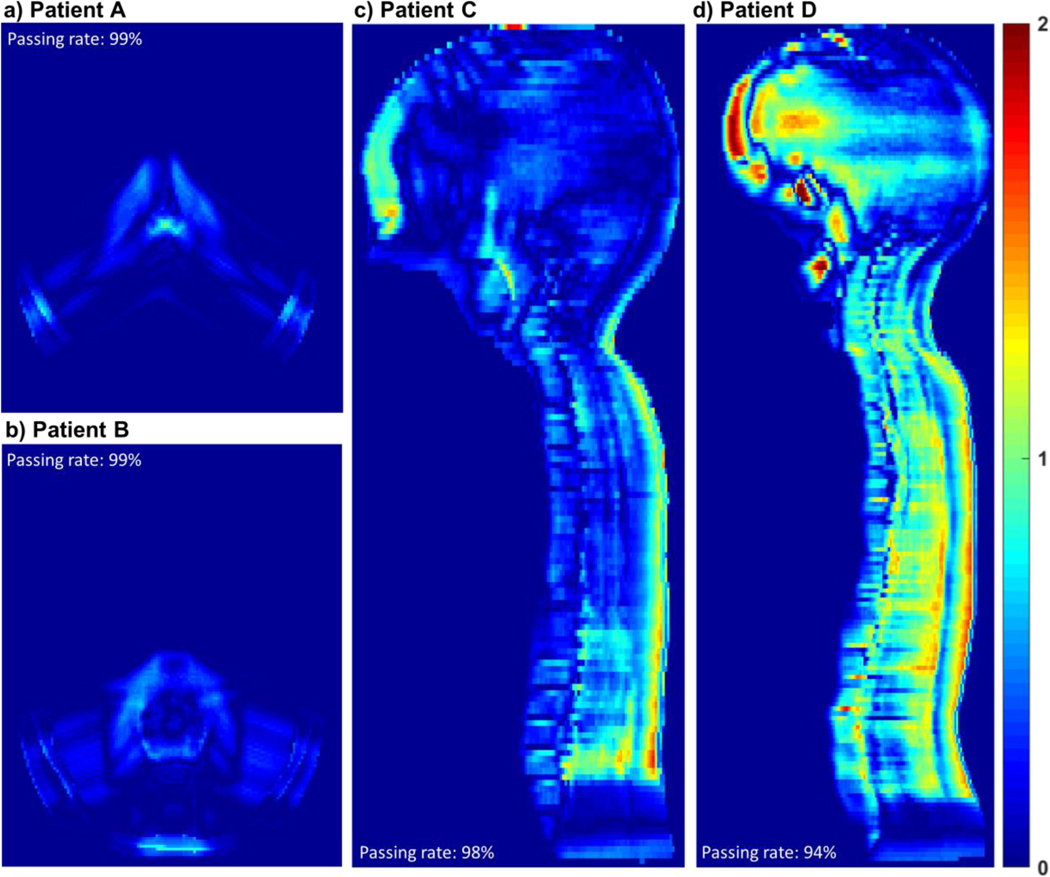
Figure 5 shows the gamma distributions between the simulated dose distributions and the TPS dose distributions for the 1- and 5-year-old ICRP reference phantoms for intracranial and craniospinal irradiations. For the intracranial irradiation, the 3D gamma passing rates (i.e., the percentage of the gamma values less than unity) were 99% for both 1-year and 5-year-old phantoms. For the craniospinal irradiation, the gamma passing rates were 98% and 94% for the 1- and 5-year-old phantoms, respectively, which are slightly lower than those for the intracranial irradiation due to higher tissue inhomogeneity in the planning target volume (PTV) for craniospinal irradiation; nonetheless, the passing rates are clinically acceptable. Overall, the simulated dose distributions were in good agreement with the TPS dose distributions.
Figure 5.
Gamma distributions between the simulated dose distributions and the TPS dose distributions: (a) Patient A (intracranial irradiation on 1-year-old phantom); (b) Patient B (intracranial irradiation on 5-year-old phantom); (c) Patient C (craniospinal irradiation on 1-year-old phantom); and (d) Patient D (craniospinal irradiation on 5-year-old phantom). Gamma analysis using a 3%/3mm criterion was performed excluding the doses less than 0.2% of the maximum dose. Gamma values for the excluded doses were assumed to be zero in the distributions.
3.3. Organ/tissue doses
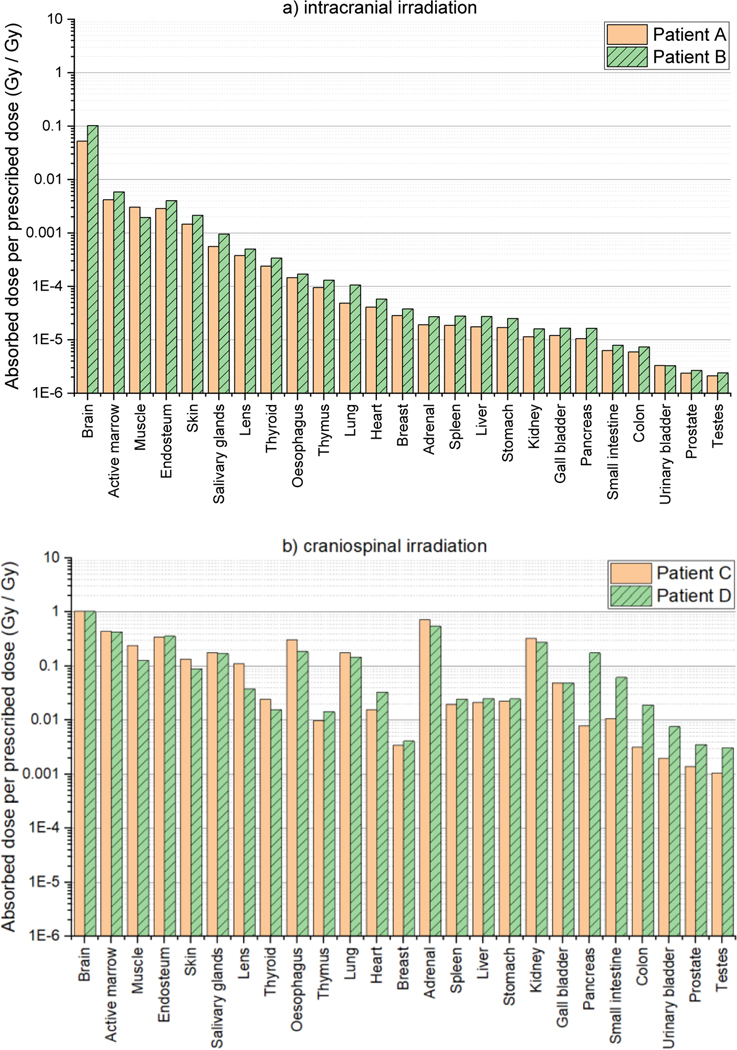
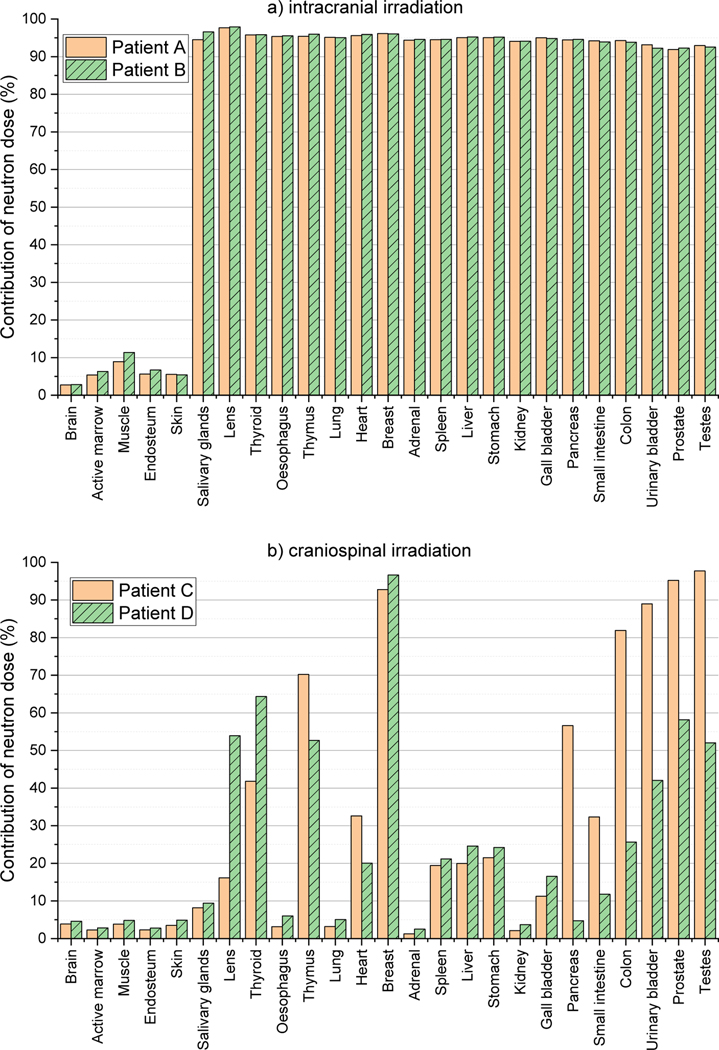
Figure 6(a) shows the average organ/tissue absorbed doses (RBE-weighted) per prescribed dose (Gy Gy−1) for 25 organs/tissues of Patent A and Patient B undergoing intracranial irradiations. For both patients, the brain doses, including the PTVs, are largest: 0.05 Gy Gy−1 for Patient A and 0.1 Gy Gy−1 for Patient B. The dose to other organs and tissues decrease as the distance from the brain increases, showing the lowest dose for the testes: 2.1 μGy Gy−1 for Patient A and 2.4 μGy Gy−1 for Patient B. Figure 6(b) shows the organ/tissue doses for Patient C and Patient D undergoing craniospinal irradiations. As similar to the intracranial irradiations, the brain doses are largest (~1 Gy Gy−1 for the both patients) and the testes doses are lowest (~1 mGy Gy−1 for Patient C and ~3 mGy Gy−1 for Patient D). The organ/tissue doses for the craniospinal irradiation cases (Figure 6(b)) are mostly much greater than those for the intracranial irradiation cases (Figure 6(a)) by several orders of magnitude. The largest differences can be seen at the adrenal doses, i.e., being ~3000 and ~2000 times greater for the 1- and 5-year-old patients, respectively. Figure 7 shows the contributions of the neutron doses to the organ/tissue doses. For the intracranial irradiation, neutrons contribute more than 90% of the dose for most organs and tissues, whereas for the craniospinal irradiation neutrons contribute less than 20% of dose to more than half organs, with up to 70% for only a few selected organs.
Figure 6.
Organ/tissue averaged, RBE-weighted absorbed dose per prescribed dose (Gy Gy−1) for 25 organs and tissues calculated by using the MC beam model established in the present study: (a) Patient A and Patient B undergoing intracranial irradiations and (b) Patient C and Patient D undergoing craniospinal irradiations.
Figure 7.
Contribution of neutron dose to organ/tissue doses calculated by using the MC beam model established in the present study: (a) Patient A and Patient B undergoing intracranial irradiations and (b) Patient C and Patient D undergoing craniospinal irradiations.
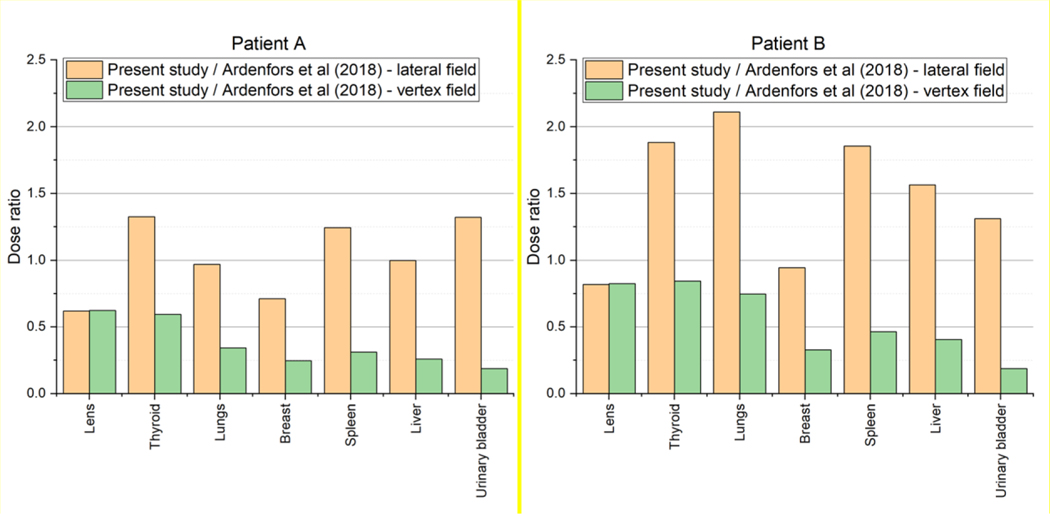
Additionally, the organ/tissue doses of Patient A and Patient B were compared with the result of Ardenfors et al (2018) in which organ/tissue doses of a 6-year-old patient for intracranial irradiations in lateral and vertex fields were calculated. Figure 8 shows the ratios of the organ/tissue doses of Patient A and Patient B to those of Ardenfors et al (2018). The ratios are generally within a range from 0.5 to 2; that is, the dose differences for many cases were less than a factor of 2. The maximum difference can be seen in the urinary bladder where the doses of both Patient A and Patient B were smaller than that of Ardenfors et al (2018) for the vertex field by a factor of ~5. The observed differences could be expected considering the difference in the used patients (or phantoms) and beam fields (such as location and size) between the present study and Ardenfors et al (2018).
Figure 8.
Ratio of the organ/tissue doses of Patent A (left) and Patient B (right) to those of Ardenfors et al (2018) calculated with a 6-year-old patient for intracranial irradiations in lateral and vertex fields.
3.4. Dosimetric influence of beam properties
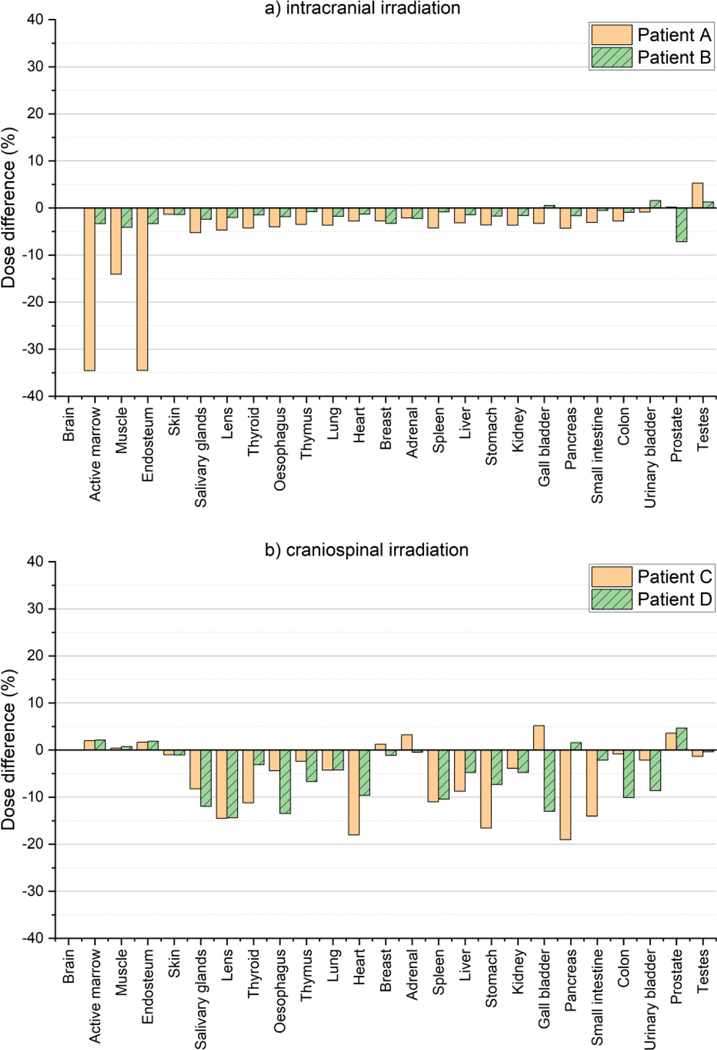
Figure 9 shows the dose differences in the organ/tissue doses calculated with the developed MC model from those calculated with the simplified MC beam model for the intracranial and craniospinal irradiations. For the intracranial irradiation, most organs and tissues show the dose differences are less than 5%, while only three tissues (i.e., active marrow, muscle, and endosteum) for the 1-year-old phantom show relatively large differences up to 35%. For the craniospinal irradiation, the differences tend to be larger than those for the intracranial irradiation, but still are less than 10% for most cases.
Figure 9.
Differences of the organ/tissue doses calculated using the developed MC beam model (D) from those calculated using the simplified MC beam model (S) [= (S/D - 1) × 100)]: (a) Patient A and Patient B undergoing intracranial irradiations and (b) Patient C and Patient D undergoing craniospinal irradiations. In the simplified MC model, the mean energy was set to the nominal energy and the other beam properties (i.e., spot size, spot divergence, and energy spread) were set to zero.
4. Discussion
As the first groundwork to eventually support a large-scale international epidemiological study of late effects risk for pediatric proton therapy patients, we developed a MC model for simulating the MPTC spot scanning beams using TOPAS MC code. A notable strength of our MC modeling work is in that an in-house program was developed to automate the MC beam modeling tasks, avoiding the time-consuming step of matching beam commission data through trial and error. This program significantly improved our work efficiency, taking only about a couple of days without human intervention while using 16 CPU cores on Biowulf, the National Institutes of Health (NIH) high-performance Linux computing cluster (http://hpc.nih.gov). The automatic MC modeling program will also be useful in the future when we need to conduct additional MC modeling for spot scanning beams of other proton centers in the IPPTC.
While our primary intended application of this MC model is for out-of-field patient dose reconstructions for epidemiological studies, it can also be used as an independent tool to validate patient dose distributions planned by the MPTC TPS, considering that the beam properties of the MC model were matched to the MPTC beam measurement data within clinically acceptable agreement (see figures 3 and 4). As shown in figure 5, the dose distributions calculated from our MC beam model are in good agreement with those planned by the MPTC TPS showing high gamma passing rates (94 – 99%). This not only confirms that our MC simulations agree with the commercial TPS but also can be a good example of validating TPS dose distributions by using a MC model.
From the result for the intracranial irradiation (see figure 6(a)), it is observed that the doses for most organs and tissues of the 5-year-old patient (i.e., Patient B) are greater than those of the 1-year-old patient (i.e., Patient A) although the 5-year-old patient (109 cm) is taller than the 1-year-old patient (76 cm). This can be explained by the difference in the PTV sizes assumed in the patients; that is, the PTV size for the 5-year-old patient is 5.5 times larger than for the 1-year-old patient, requiring more primary protons. This eventually induced more secondary particles that contribute to dose, indicating that PTV size is one of the significant factors affecting organ/tissue doses.
It was also observed that the organ/tissue dose values for the craniospinal irradiation (figure 6(b)) were generally greater than those for the intracranial irradiation (figure 6(a)) by several orders of magnitude. The PTV sizes for the craniospinal irradiation are much larger than those of the intracranial irradiation, requiring more primary protons and eventually inducing more secondary particles. In addition, the larger PTVs for the craniospinal irradiation also tend to be closer to most out-of-field organs and tissues, resulting in increased dose from secondary particles (mostly neutrons) governed by both inverse-square law and exponential attenuation law. Furthermore, as shown in figure 7, the dose from neutrons was dominant for most organs and tissues for the intracranial irradiation case, but not for the case of the craniospinal irradiation. This finding illustrates, as we might expect, that proton therapy patients will receive different patterns of out-of-field organ dose depending on the location and extent of the body being treated.
Because each proton therapy center may have a unique accelerator design and beam characteristics, an important question is whether these differences are critical for accurate out-of-field organ dosimetry. Dosimetric influence of the beam properties was investigated by comparing the organ/tissue doses calculated by the developed MC model with those calculated with the simplified MC model (mean energy is nominal energy; energy spread, spot size, and spot divergence are zero) (see figure 9). This result shows that even though the major beam characteristics are ignored in the simplified model, the resulting differences in organ/tissue dose were small, i.e., overall less than 5% and 10% for the intracranial and craniospinal irradiations, respectively. This implies that the impact of the beam properties on dose calculations for normal organs and tissues may not be significant although the limited patient cases are considered in the present study. Therefore, use of the MC beam model developed in the present study based on the MTPC beam measurement data might be dosimetrically acceptable for organ/tissue dose reconstruction of patients at other proton centers for epidemiological applications particularly when their beam measurement data are not available.
We acknowledged several issues that should be addressed for dose reconstructions of proton patients for epidemiologic studies. Although the neutron RBE of 25 suggested by Brenner and Hall (2008) was used in the present study to demonstrate organ/tissue dose calculations using the developed MC model, the neutron RBE values for cancer induction have a huge uncertainty (Newhauser and Durante 2011). Brenner and Hall (2008) indicates that the RBE value of 25 is associated with uncertainty of about a factor of 4. A dedicated study to determine the most appropriate RBE values for secondary neutrons in proton therapy should be conducted to reduce the dosimetric uncertainty for risk assessments of late effects. The MC dose calculations are well known as a ‘gold standard’ for dosimetry method (Koz\lowska et al 2019), but typically require a considerable amount of computational times (Yeom et al 2019). In the present study, it took about a couple of days per one calculation case, using 1,500 CPU cores on the NIH Biowulf cluster. Although the Biowulf cluster provides ~95,000 CPU cores, the current computational efficiency of the MC model is still practically insufficient considering that the epidemiological investigations typically require individual dose reconstructions of large-scale patients (e.g., 10,000 patients). A further study should be conducted to accelerate the MC model, e.g., by incorporating variation reduction techniques such as implicit capture.
5. Conclusion
As a dosimetry effort for the collaborative studies on late health effects of pediatric patients in proton therapy, we developed the MC proton PBS model using the TOPAS MC code by matching the MPTC beam measurement data with a clinically acceptable agreement. The MC modeling was fully automated by the in-house MC modeling program, which improved our work efficiency and will be beneficial when extending our MC model to simulate spot scanning beams of other proton centers. The performance of the MC model was tested by calculating the organ/tissue doses of the whole-body pediatric computational phantoms for the intracranial and craniospinal irradiations planned by the MPTC TPS, which demonstrates the reliability and capability of the MC model on patient dose reconstructions. It was also observed that the impact of the beam properties on dose calculations is not significant, implying great potential of the developed MC model based on the MPTC measurement data as an alternative for patient dose reconstructions at other proton centers when their measurement data are not available. As a next step, we plan to use the developed MC model to estimate organ/tissue doses of the pediatric patients treated at the MPTC and collected in the PPCR.
Acknowledgments
This work was funded by the intramural program of the National Institutes of Health (NIH), National Cancer Institute, Division of Cancer Epidemiology and Genetics. The contents are solely the responsibility of the authors and does not necessarily represent the official views of the NIH. One of the authors (Yeon Soo Yeom) was supported by a grant of the Korean Health Technology R&D Project through the Korean Health Industry Development Institute (KHIDI), funded by the Ministry of Health & Welfare, Republic of Korea (Project No: H18C2257). The calculations in this work were performed on the NIH High-Performance Computing Biowulf Cluster (http://hpc.nih.gov).
References
- Allison J, Amako K, Apostolakis J, Arce P, Asai M, Aso T, Bagli E, Bagulya A, Banerjee S, Barrand G, Beck BR, Bogdanov AG, Brandt D, Brown JMC, Burkhardt H, Canal Ph, Cano-Ott D, Chauvie S, Cho K, Cirrone GAP, Cooperman G, Cortés-Giraldo MA, Cosmo G, Cuttone G, Depaola G, Desorgher L, Dong X, Dotti A, Elvira VD, Folger G, Francis Z, Galoyan A, Garnier L, Gayer M, Genser KL, Grichine VM, Guatelli S, Guèye P, Gumplinger P, Howard AS, Hfivnacova I, Hwang S, Incerti S, Ivanchenko A, Ivanchenko VN, Jones FW, Jun SY, Kaitaniemi P, Karakatsanis N, Karamitros M, Kelsey M, Kimura A, Koi T, Kurashige H, Lechner A, Lee SB, Longo F, Maire M, Mancusi D, Mantero A, Mendoza E, Morgan B, Murakami K, Nikitina T, Pandola L, Paprocki P, Perl J, Petrovic I, Pia MG, Pokorski W, Quesada JM, Raine M, Reis MA, Ribon A, Ristic Fira A, Romano F, Russo G, Santin G, Sasaki T, Sawkey D, Shin JI, Strakovsky II, Taborda A, Tanaka S, Tomé B, Toshito T, Tran HN, Truscott PR, Urban L, Uzhinsky V, Verbeke JM, Verderi M, Wendt BL, Wenzel H, Wright DH, Wright DM, Yamashita T, Yarba J, et al. 2016. Recent developments in Geant4 Nuclear Instruments and Methods in Physics Research Section A: Accelerators, Spectrometers, Detectors and Associated Equipment 835 186–225 [Google Scholar]
- Ardenfors O, Gudowska I, Flejmer AM and Dasu A 2018. Impact of irradiation setup in proton spot scanning brain therapy on organ doses from secondary radiation Radiat Prot Dosimetry 180 261–6 [DOI] [PubMed] [Google Scholar]
- Berrington de Gonzalez A, Vikram B, Buchsbaum JC, de Vathaire F, Dörr W, Hass-Kogan D, Langendijk JA, Mahajan A, Newhauser W, Ottolenghi A, Ronckers C, Schulte R, Walsh L, Yock TI and Kleinerman RA 2017. A Clarion Call for Large-Scale Collaborative Studies of Pediatric Proton Therapy International Journal of Radiation Oncology*Biology*Physics 98 980–1 [DOI] [PubMed] [Google Scholar]
- Binns PJ and Hough JH 1997. Secondary Dose Exposures During 200 MeV Proton Therapy Radiat Prot Dosimetry 70 441–4 [Google Scholar]
- Brenner DJ and Hall EJ 2008. Secondary neutrons in clinical proton radiotherapy: a charged issue. Radiotherapy and Oncology 86 165–70 [DOI] [PubMed] [Google Scholar]
- Chung K, Kim J, Kim D-H, Ahn S and Han Y 2015. The proton therapy nozzles at Samsung Medical Center: A Monte Carlo simulation study using TOPAS Journal of the Korean Physical Society 67 170–4 [Google Scholar]
- National Research Council 2006. Health Risks from Exposure to Low Levels of Ionizing Radiation: BEIR VII Phase 2 (National Academies Press; ) [PubMed] [Google Scholar]
- Eley J, Newhauser W, Homann K, Howell R, Schneider C, Durante M and Bert C 2015. Implementation of an Analytical Model for Leakage Neutron Equivalent Dose in a Proton Radiotherapy Planning System Cancers (Basel) 7 427–38 [DOI] [PMC free article] [PubMed] [Google Scholar]
- Gilbert ES 2009. THE IMPACT OF DOSIMETRY UNCERTAINTIES ON DOSE-RESPONSE ANALYSES Health Phys 97 487–92 [DOI] [PMC free article] [PubMed] [Google Scholar]
- Gondi V, Yock TI and Mehta MP 2016. Proton therapy for paediatric CNS tumours — improving treatment-related outcomes Nature Reviews Neurology 12 334–45 [DOI] [PubMed] [Google Scholar]
- Grevillot L, Bertrand D, Dessy F, Freud N and Sarrut D 2011. A Monte Carlo pencil beam scanning model for proton treatment plan simulation using GATE/GEANT4 Phys. Med. Biol 56 5203. [DOI] [PubMed] [Google Scholar]
- Hartman J, Zhang X, Zhu XR, Frank SJ, Lagendijk JJW and Raaymakers BW 2018. TOPAS Monte Carlo model of MD anderson scanning proton beam for simulation studies in proton therapy Biomed. Phys. Eng. Express 4 037001 [Google Scholar]
- Hess CB, Indelicato DJ, Paulino AC, Hartsell WF, Hill-Kayser CE, Perkins SM, Mahajan A, Laack NN, Ermoian RP, Chang AL, Wolden SL, Mangona VS, Kwok Y, Breneman JC, Perentesis JP, Gallotto SL, Weyman EA, Bajaj BVM, Lawell MP, Yeap BY and Yock TI 2018. An Update From the Pediatric Proton Consortium Registry Front. Oncol. 8 Online: 10.3389/fonc.2018.00165/full [DOI] [PMC free article] [PubMed] [Google Scholar]
- Jarlskog CZ, Lee C, Bolch WE, Xu XG and Paganetti H 2008. Assessment of organ-specific neutron equivalent doses in proton therapy using computational whole-body age-dependent voxel phantoms Phys. Med. Biol 53 693. [DOI] [PMC free article] [PubMed] [Google Scholar]
- Journy N, Indelicato DJ, Withrow DR, Akimoto T, Alapetite C, Araya M, Chang A, Chang JH-C, Chon B, Confer ME, Demizu Y, Dendale R, Doyen J, Ermoian R, Gurtner K, Hill-Kayser C, Iwata H, Kim J-Y, Kwok Y, Laack NN, Lee C, Lim DH, Loredo L, Mangona VS, Mansur DB, Murakami M, Murayama S, Ogino T, Ondrova B, Parikh RR, Paulino AC, Perkins S, Ramakrishna NR, Richter R, Rombi B, Shibata S, Shimizu S, Timmermann B, Vern-Gross T, Wang CJ, Weber DC, Wilkinson JB, Witt Nyström P, Yock TI, Kleinerman RA and Berrington de Gonzalez A 2018. Patterns of proton therapy use in pediatric cancer management in 2016: An international survey Radiotherapy and Oncology Online: http ://www.sciencedirect.com/science/article/pii/S0167814018335461 [DOI] [PubMed] [Google Scholar]
- Kasper HB, Raeke L, Indelicato DJ, Symecko H, Hartsell W, Mahajan A, Hill-Kayser C, Perkins SM, Chang AL, Childs S, Buchsbaum JC, Laurie F, Khan AJ, Giraud C, Yeap BY and Yock TI 2014. The Pediatric Proton Consortium Registry: A Multi-institutional Collaboration in U.S. Proton Centers International Journal of Particle Therapy 1 323–33 [Google Scholar]
- Kimstrand P, Traneus E, Ahnesjö A, Grusell E, Glimelius B and Tilly N 2007. A beam source model for scanned proton beams Phys. Med. Biol 52 3151–3168 [DOI] [PubMed] [Google Scholar]
- Koz\lowska WS, Böhlen TT, Cuccagna C, Ferrari A, Fracchiolla F, Magro G, Mairani A, Schwarz M, Vlachoudis V and Georg D 2019. FLUKA particle therapy tool for Monte Carlo independent calculation of scanned proton and carbon ion beam therapy Phys. Med. Biol 64 075012 [DOI] [PubMed] [Google Scholar]
- Langner UW, Eley JG, Dong L and Langen K 2017. Comparison of multi-institutional Varian ProBeam pencil beam scanning proton beam commissioning data Journal of Applied Clinical Medical Physics 18 96–107 [DOI] [PMC free article] [PubMed] [Google Scholar]
- Lee C, Lodwick D, Hurtado J, Pafundi D, Williams JL and Bolch WE 2010. The UF family of reference hybrid phantoms for computational radiation dosimetry. Physics in Medicine and Biology 55 339–63 [DOI] [PMC free article] [PubMed] [Google Scholar]
- Lin L, Kang M, Solberg TD, Ainsley CG and McDonough JE 2014. Experimentally validated pencil beam scanning source model in TOPAS Phys. Med. Biol 59 6859. [DOI] [PubMed] [Google Scholar]
- Low DA, Harms WB, Mutic S and Purdy JA 1998. A technique for the quantitative evaluation of dose distributions Medical Physics 25 656–61 [DOI] [PubMed] [Google Scholar]
- Newhauser WD and Durante M 2011. Assessing the risk of second malignancies after modern radiotherapy Nat Rev Cancer 11 438–48 [DOI] [PMC free article] [PubMed] [Google Scholar]
- Paganetti H, Niemierko A, Ancukiewicz M, Gerweck LE, Goitein M, Loeffler JS and Suit HD 2002. Relative biological effectiveness (RBE) values for proton beam therapy International Journal of Radiation Oncology*Biology*Physics 53 407–21 [DOI] [PubMed] [Google Scholar]
- Perl J, Shin J, Schümann J, Faddegon B and Paganetti H 2012. TOPAS: An innovative proton Monte Carlo platform for research and clinical applications Medical Physics 39 6818–37 [DOI] [PMC free article] [PubMed] [Google Scholar]
- Polf JC and Newhauser WD 2005. Calculations of neutron dose equivalent exposures from range-modulated proton therapy beams Phys. Med. Biol 50 3859–3873 [DOI] [PubMed] [Google Scholar]
- Schneider U, Agosteo S, Pedroni E and Besserer J 2002. Secondary neutron dose during proton therapy using spot scanning International Journal of Radiation Oncology*Biology*Physics 53 244–51 [DOI] [PubMed] [Google Scholar]
- Schneider U, Zwahlen D, Ross D and Kaser-Hotz B 2005. Estimation of radiation-induced cancer from three-dimensional dose distributions: Concept of organ equivalent dose International Journal of Radiation Oncology*Biology*Physics 61 1510–5 [DOI] [PubMed] [Google Scholar]
- Trinkl S, Mares V, Englbrecht FS, Wilkens JJ, Wielunski M, Parodi K, Rühm W and Hillbrand M 2017. Systematic out-of-field secondary neutron spectrometry and dosimetry in pencil beam scanning proton therapy Medical Physics 44 1912–20 [DOI] [PubMed] [Google Scholar]
- Xu XG, Bednarz B and Paganetti H 2008. A review of dosimetry studies on external-beam radiation treatment with respect to second cancer induction Physics in Medicine and Biology 53 R193–241 [DOI] [PMC free article] [PubMed] [Google Scholar]
- Yeom YS, Han MC, Choi C, Han H, Shin B, Furuta T and Kim CH 2019. Computation Speeds and Memory Requirements of Mesh-Type ICRP Reference Computational Phantoms in Geant4, MCNP6, and PHITS: Health Physics 116 664–76 [DOI] [PubMed] [Google Scholar]
- Zhang R, Howell RM, Giebeler A, Taddei PJ, Mahajan A and Newhauser WD 2013. Comparison of risk of radiogenic second cancer following photon and proton craniospinal irradiation for a pediatric medulloblastoma patient Phys. Med. Biol 58 807. [DOI] [PMC free article] [PubMed] [Google Scholar]


