

Abstract
Different therapeutic nucleic acids (TNAs) can be unified in a single structure by their elongation with short oligonucleotides designed to self-assemble into nucleic acid nanoparticles (NANPs). With this approach, therapeutic cocktails with precisely controlled composition and stoichiometry of active ingredients can be delivered to the same diseased cells for enhancing pharmaceutical action. In this work, an additional nanotechnology-based therapeutic option that enlists a biocompatible NANP-encoded platform for their controlled patient-specific immunorecognition is explored. For this, a set of representative functional NANPs is extensively characterized in vitro, ex vivo, and in vivo and then further analyzed for immunostimulation of human peripheral blood mononuclear cells freshly collected from healthy donor volunteers. The results of the study present the advancement of the current TNA approach toward personalized medicine and offer a new strategy to potentially address top public health challenges related to drug overdose and safety through the biodegradable nature of the functional platform with immunostimulatory regulation.
Keywords: immunotherapy, nucleic acid nanoparticles, PBMCs, SAXS, therapeutic nucleic acids
1. Introduction
Within the human cell, pattern recognition receptors (PRRs) specific for the detection of nucleic acids as pathogen- or damage-associated molecular patterns (PAMPs or DAMPs) have evolved to pass the final judgement on which nucleic acids are “self” and which are “non-self”.[1–4] Endosomal Toll-Like Receptors (TLRs) recognize specific PAMPs and activate a signaling cascade that results in the downstream expression of various cytokines and interferons. In humans, there are four main TLRs that are generally activated by nucleic acids: broadly, TLR3 detects double-stranded RNAs, TLR7 and TLR8 detect single-stranded RNA, and TLR9 detects DNAs and unmethylated CpG motifs.[5] Meanwhile, cytosolic oligonucleotides are readily sensed by the cGAS-STING and RIG-I-like receptor(RLR)-MAVS pathways.[6]
As a result of their chemical composition, therapeutic nucleic acids (TNAs) and more advanced nucleic acid nanoparticles (NANPs), rationally designed for intracellular applications, can interact with PRRs similarly to any other innate nucleic acids.[1,7–9] While unknown immunorecognition of TNAs has historically been a major hurdle to their optimization and broader clinical transition, recently elucidated patterns of NANPs’ recognition can now be used to inform NANP design and route of administration.[9–12] The ability to control the interactions of NANPs with PRRs also defines the overall downstream production of cytokines and cell signaling responses that can be used to optimize or enhance the treatment strategy.
Our previous works have investigated the relationships between the various architectural parameters of NANPs and the way in which they can interact with different PRRs and cells of the human immune system to stimulate innate immune responses. From these studies, some overall trends have been elucidated with NANPs’ dimensionality (3D vs 2D vs 1D),[13,14] composition (DNA vs RNA vs chemical analogs),[2,13,15–18] and functionalization with TNAs[19,20] being the main contributors for the immunostimulatory properties of NANPs. However, while the latter trend has not been explored extensively, a greater flexibility in the stimulation brought about by TNA functionalization could be utilized to optimally co-deliver TNAs alongside a favorable immune profile for personalized treatments. To further explore these auspicious opportunities, we have developed a panel of NANPs composed entirely of RNA and functionalized with various numbers of Dicer Substrate (DS) RNAs positioned in all possible orientations (Figure 1).
Figure 1.

Schematic representation of experimental flow reported in this work. The library of functional NANPs with different numbers and orientations of Dicer Substrate (DS) RNAs was engineered and extensively characterized and tested in vitro, in vivo, and in human peripheral blood mononuclear cells (PBMCs) to determine NANPs immunostimulatory properties.
The assembly of RNA rings has been previously established[21,22] and is based on six pairs of kissing loops that form ≈120° intermolecular interactions between six adjacent monomers. Rings have been shown to be highly uniform in assembly, with the potential to incorporate TNAs modularly by extending the scaffold sequences in their hexameric composition.[21,23–25] A variety of functionalized rings have been utilized as carriers of aptamers, fluorophores, and DS RNA cocktails with desired biological activities confirmed both in vitro and in vivo.[23,26–32]
In this work, the structures of the functionalized ring NANPs were resolved dimensionally by electrophoretic mobility shift assays (EMSA), small angle X-ray scattering (SAXS), and atomic force microscopy (AFM). The intracellular activities of the NANPs, including their uptake into mammalian cell culture, silencing of green fluorescent protein (GFP)-expressing human breast cancer cell lines, and immune stimulation of reporter cells were assessed followed by the biodistribution and immunostimulation in animal models. Furthermore, trends between various functional NANPs were discerned using human peripheral blood mononuclear cells (PBMCs) freshly collected from six human donors to assess relative immunostimulation and inter-donor variability.
Varying immune recognition based on the orientation of TNA moieties is an advantage for their modularity toward the development of personalized therapeutics, wherein treatments may be selected based on the most favorable profile of activation and current hurdles such as inter-donor variability may become a benefit to allow for feedback in optimal drug design.
2. Results
2.1. Assembly and Characterization of NANPs
Owing to their hexameric nature, a maximum of up to six functionalities were incorporated into each NANP ring. This allows for various combinations of functionalization ranging from zero to six, with rings of two, three, and four DS RNAs available in three different orientations each. Here, all rings are referred to by the number of DS RNAs in their composition, i.e., ring 3 has three DS RNAs, and those with multiple orientations are followed by A, B, or C, as shown in Figure 2. The controlled programmable assembly of these precise combinations is possible due to the modular nature of the NANP design, which has six distinct kissing loop interactions with all monomers’ intermolecular interactions assured.[21]
Figure 2.

Functionalized NANPs characterized by SAXS, AFM, and native polyacrylamide gel electrophoresis (PAGE). A) Plots of SAXS profiles of NANPs over the q range 0.005–0.5 Å−1 with error shown as vertical bars of the same color. B) The Guinier plots of each structure with the fitted regions represented as solid circles with the line of best fit going through them in the same color. Data which are not included in the Guinier fit are shown as unfilled circles. The residual plots for all four Guinier fits are shown below. C) The pair-wise distance distribution for each structure with the same color scheme. D,E) The Chimera-generated density maps of SAXS-based models (with scale bars), where the transparent gray surface is superimposed with the idealized atomic model shown as a ribbon and stick model. F) Seven representative NANPs visualized by AFM and G) assemblies of all tested NANPs confirmed by native-PAGE stained with EtBr.
The addition of DS RNAs (25 bps with 2 nt 3′-side overhang[43]) to the outside of the rings leads to a significant difference in the size of each structure, with each DS RNA expected to add roughly ≈70 Å in length.[44] Through the SAXS analysis (Figure 2A–E), it is seen that the addition of a single DS RNA does not produce a ≈70 Å increase (but only ≈43 Å) in the size of the structure, as would be expected if it were to position perpendicular to the side of the ring to which it is bound in the plane of the structure (Table 1). This observation implies that the DS RNA must be held in a conformation that is more compact and potentially less planar.
Table 1.
Parameters of the four structures analyzed by SAXS.
| Ring 0 DS RNAs | Ring 1 DS RNA | Ring 3 DS RNAs | Ring 6 DS RNAs | |
|---|---|---|---|---|
| Guinier Rg (Å) | 57.8 ± 0.9 | 68.8 ± 0.9 | 77.0 ± 0.7 | 82.1 ± 0.5 |
| P(r) Rg (Å) | 57.0 ± 0.4 | 67.1 ± 0.5 | 78.3 ± 0.5 | 83.3 ± 0.3 |
| Dmax (Å) | 167 | 210 | 249 | 284 |
The SAXS profiles collected for the four representative NANPs show significant differences with the addition of more DS RNAs smoothing the curves (Figure 2A). The increased size of each of these structures is readily seen in the difference in the slopes of the Guinier fits of the low-q region of each data set (Figure 2B), with the larger structures having steeper slopes. This change in size is more apparent upon examination of the pair-wise distance distribution functions for each particle (Figure 2C), as the change in their dmax leads to extended P(r) curves. The P(r) analysis also shows several conserved structural features between the NANPs. The peak at ≈23–26 Å is representative of the width of the RNA helices. A second peak in the P(r) curves of each structure occurs at ≈65 Å, which is likely to be the distance between adjacent corners of the ring (i.e., the length of one side). The third consistent peak seen at ≈110 Å represents the expected distance from one flat side of the hexagonal base structure to the opposite.[21]
Constraints regarding the predicted assembly geometry were used as input parameters to assist the GASBOR modeling.[35] The atomic force micrographs (Figure 2F) were considered and electrophoretic mobility shift assays (Figure 2G) confirmed that these particles reliably assemble into hexagonal structure with six structurally identical sides although the primary structure of each oligo differs slightly. Based on these observations, a sixfold symmetry and oblate shape constraint were introduced to produce the SAXS-based models of both the non-functionalized rings and rings with 6 DS RNAs. Representative models of the functionalized and the non-functionalized rings are shown in Figure 2D,E. Fifteen models of the non-functionalized ring were generated, each of which gave similar structures with mean ×2 values of 59 ± 1 (± standard deviation). Twenty-seven models of the rings with 6 DS RNAs were generated. Of these 27 models, 8 resulted in physically impossible structures (with large, disconnected regions) and were not included in the calculation of mean ×2 values, though their ×2 values were similar to those of the feasible models. Of the remaining 19 models, seven of them were fully planar structures. The final 12 models were in the puckered conformation, as seen in Figure 2D. The 19 feasible models were consistent with each other in terms of shape and size, only differing in the degree of pucker, and had ×2 values of 395 ± 25 (mean ± standard deviation). While these ×2 values may appear large, it is important to note that the data used for the fitting, the same as was used to model the P(r), has very little instrumental error associated, approaching only 1–2% of the measured intensity over the vast majority of the modeled range. In the case of the fully functionalized rings, the model shown in Figure 2E is also consistent with a previously published structure of the same particle which was obtained via cryogenic-electron microscopy to 16 Å resolution.[23] All reasonable models that were obtained for the rings are shown in the supplemental information (Figure S1, Supporting Information). The assembly of the full panel was additionally confirmed by AFM and EMSA (Figure 2F,G). All NANPs were assembled with high batch-to-batch consistency for use in downstream experiments for biological activity and were confirmed via EMSA before each use. While a distinct band confirmed the assembly of all orientations, the migration of each ring through the well is influenced by its shape (Figure 2G).
2.2. Cellular Uptake, Silencing Activity via RNA Interference, and Immunorecognition of NANPs
To confirm the uptake of all NANPs for the immunorecognition, Alexa488-labeled NANPs were first introduced into the human breast cancer cell line MDA-MB-231. Lipofectamine 2000 (L2K) was used as a carrier for the intracellular delivery of NANPs into the cytosol and the resulting fluorescence was assessed via flow cytometry after 48 h (Figure S2A, Supporting Information). All rings showed comparable uptake efficiency.
To confirm the biological activity of all NANPs, the panel was then introduced into the human breast cancer cell line expressing GFP (MDA-MB-231/GFP) using L2K as a carrier for the intracellular delivery of NANPs into the cytosol, where the DS RNAs of each ring were designed to enter the RNA interference (RNAi) pathway via Dicer-assisted processing. After 72 h, cells were assessed via fluorescent microscopy to visualize the expression of GFP (Figure 3A). All rings (at 10 × 10−9 m final) showed comparable silencing efficiencies, resulting in an apparent decrease in GFP fluorescence (Figure S2B, Supporting Information) that was similar to the 10 × 10−9 m DS RNA-only control. The untreated cells and those transfected with non-functionalized rings (“0”) showed no effect as expected. To assess the effect of shape on silencing efficacy, rings with only one GFP DS RNA per NANP and different number of decoy DS RNAs, were compared. All tested NANPs showed similar degrees of GFP silencing (Figure S3, Supporting Information).
Figure 3.
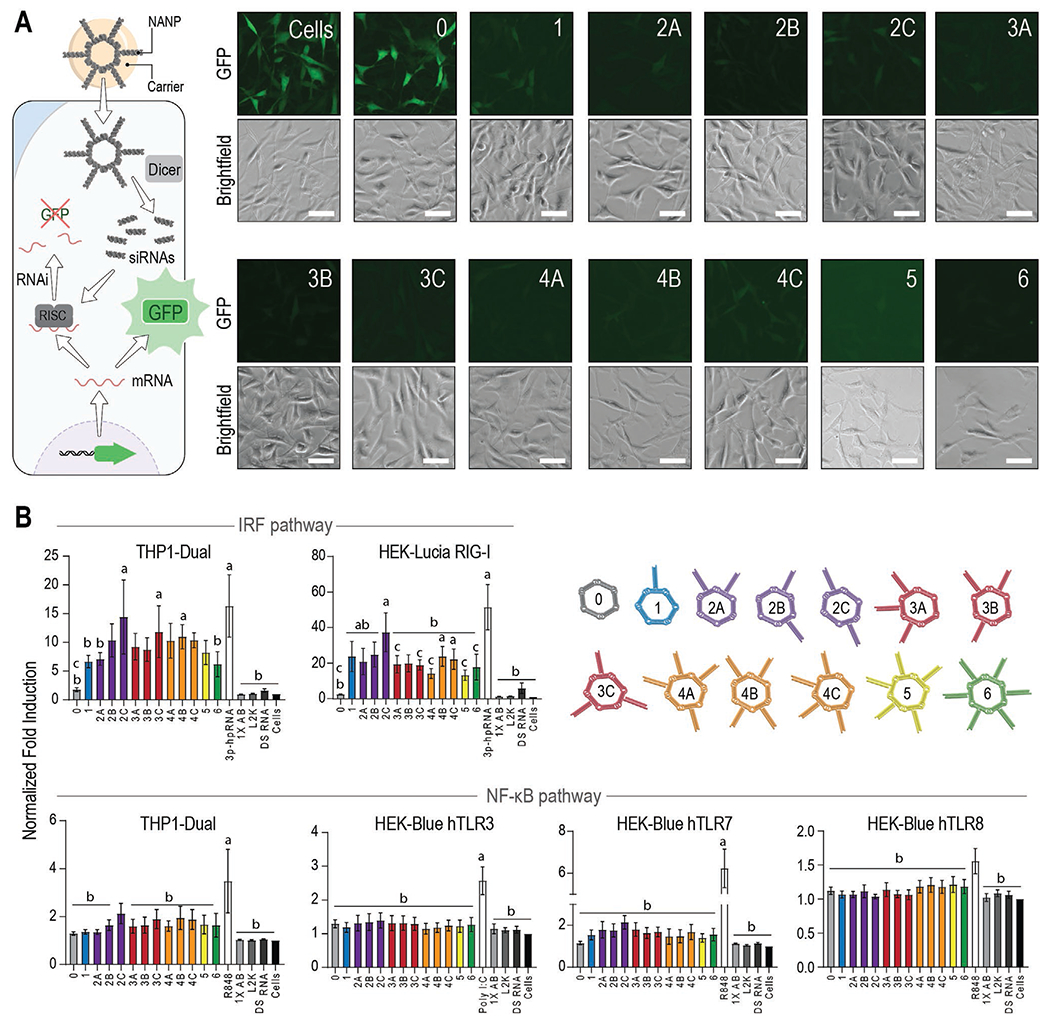
Functional and immunostimulatory properties of NANPs. A) Fluorescent microscopy images of a human breast cancer cell line expressing GFP (MDA-MB-231/GFP) 72 h after transfection with functionalized rings (10 × 10−9 m, schematically shown in left panel). The same population of cells was imaged for GFP and brightfield after transfection with each ring shown. Scale bar = 50 μm. B) Normalized fold induction over the baseline 24 h after the transfection of rings into immune reporter cell lines. All values are normalized to the cells-only control. The positive control (PC) for each cell line is shown as the uncolored bar. 1X assembly buffer (AB), L2K, and DS RNA (10 × 10−9 m) are additional controls. Each bar represents the mean of N = 5 biological repeats and error bars denote mean ± SEM. The letters “a”, “b”, and “c” indicate statistically significant differences compared to ring 0, corresponding PC, and ring 2C, respectively (one-way ANOVA with Fisher’s LSD post hoc test, p < 0.05).
To address the potential differences in immunorecognition, all NANPs were introduced into immune reporter cell lines (Figure 3B) and compared to the following controls: L2K, assembly buffer, free DS RNA, and known stimulants for each PRR at 24 h using a QUANTI-Blue or QUANTI-Luc assay. First, we examined activation of the NF-κB and IRF pathways using THP1-Dual cells that express both a NF-κB-SEAP and IRF-Lucia luciferase reporters. As shown in Figure 3B, we primarily observed robust induction of IRF in response to NANPs decorated with DS RNAs (e.g., rings 2C, 3C, and 4B) while Ring 0 did not stimulate IRF induction. Additionally, we observed minimal induction of NF-κB in response to all NANPs tested with some small differences in NF-κB induction present for rings 2C.
Next, in order to determine the PRRs required for induction of NF-κB and IRF in response to NANPs, we used HEK-Blue hTLR3, hTLR7, and hTLR8 cell lines that are engineered to overexpress their respective TLR upstream of an NF-κB-inducible secreted embryonic alkaline phosphatase (SEAP) reporter gene and HEK-Lucia RIG-I cells that are engineered to overexpress RIG-I upstream of an IRF pathway-induced Lucia reporter. Cell lines specifically expressing hTLR3 or hTLR8 showed no apparent trends between ring orientations. Interestingly, in hTLR7 reporter cells, ring 2C displayed almost a twofold increase in stimulation compared to ring 0, suggesting TLR7 contributes to the immune response to these NANPs, but the difference was not statistically significant. While these endosomal receptors did not show much contribution to the immune response, the data obtained in HEK-Lucia RIG-I reporter cells indicate RIG-I is the most prominent contributor to responses and is able to discern between ring orientations. RIG-I recognizes the 5’triphosphates (5’ppp) and dsRNAs. In our experimental design, the total number of 5’ppp for each NANP was kept constant at six 5’ppp groups per NANP. In these NANPs, only transcribed strands have (5’ppp)s while purchased RNA strands carry a 5’p. Since the final concentration of NANPs did not account for the increasing molecular weight across orientations, it was expected in the initial studies that we would see a gradual increase in stimulation as the number of DS RNAs per NANP increased. However, for RIG-I activation, this trend appears to be highly dependent not on the amount of RNA, but on the orientation in which DS RNAs are presented. Within orientations 2A-C and 4A-C, the increased spacing between DS RNAs displayed higher fold induction that was comparable with the magnitude of the positive control. This also introduces the possibility for desired immune activation without changing the dose; for instance, to co-deliver two RNA therapeutics at the same time, three different orientations are possible (2A, 2B, and 2C), all with three different levels of RIG-I activation. To ensure that it is not just an increased amount of RNA in each sample that causes the differences in RIG-I activation, ring 0 was introduced to the reporter cells with six equivalents of DS RNAs. This was found to have a similar response as either ring 0 or DS RNAs alone, with no statistical difference between this treatment and untreated cells (Figure S4, Supporting Information). The potential effect of NANPs’ cytotoxicity on the observed results was also investigated (Figure S5, Supporting Information).
2.3. Orientation of TNAs Affects In Vivo Response to NANPs
To determine if the same patterns of recognition were present in larger model systems, NANPs of three distinct orientations (1, 3C, and 6) were administered to 7–8-week-old male and female CD1 mice from Charles River (Figure 4A). NANPs were delivered using the cationic amphiphilic copolymer poly(lactide-co-glycolide)-graft-polyethyleneimine (PgP) that has been previously demonstrated for the successful delivery of NANPs in vivo[26] Each NANP was also assembled with one fluorescently labeled sequence in its structure in order to visualize the biodistribution of the treatments over time. Four hours post-injection, mice were imaged using the IVIS to locate the RNA rings (Figure 4B). With full body imaging, all rings appeared to have localized to the liver at this initial time point. Total organ fluorescence of the brain, heart, lungs, kidney, liver, and spleen were assessed via IVIS to evaluate the distribution of NANPs 24 h post-injection (Figure 4C,D; Figure S6, Supporting Information) and compared to PBS and PgP alone. Overall, fluorescence was seen most prominently in the liver and kidneys. Additionally, qPCR analysis of different organs revealed higher immunostimulation by ring 3C (Figure 4E). Specifically, we observed significant increases in IL-6 and IFN-β fold induction in the liver and spleen and IFN-β induction in the brain. Also, 24 h post-injection, total blood was collected via cardiac puncture for serum separation and cytokine analysis. For cytokine analysis, a custom mouse cytokine multiplex plate from Quansys was used to identify the profile of cytokines stimulated in response to NANP delivery. A panel of relevant cytokines was chosen given the window of expression in which the 24-hour treatment took place to include IL-1β, IL-2, IL-6, IL-10, MCP-1, IFNγ, TNFα, MIP-2, KC, and MIP-1α (Figure 5). Several changes in the blood cytokine levels were observed in the presence of NANPs: i) MCP-1 levels were upregulated; ii) IL-1β, IFNγ, IL-2, MIP-1a, and KC levels were downregulated; iii) IL-6 and IL-10 showed bi-modal distribution in that IL-6 was upregulated in one-half of the treatment group whereas the second half of animals showed no change, and IL-10 was upregulated in one-half of animals and down-regulated in the second half of the treatment group. Interestingly, changes in IL-1β and MCP-1 were seen with all rings though the magnitude of response varied between individual NANPs; downregulation of MIP-1α and KC were only significant in the presence of ring 6 but not in ring 1 and 3C-treated groups; IL-2 and IL-6 changes were significant in ring 1 and ring 3C groups; IL-10 in rings 3C and 6; and IFNγ in ring 1 group only. The magnitude of responses often varied between individual animal as detailed in Figure 5B. Both physiologically significant (i.e., at least twofold above the baseline) and statistically significant (p < 0.05 [CI95%] and p < 0.1 [CI90%]) changes were monitored. The differences in cytokine levels in response to rings with different functional arms suggest that the TNA orientations contribute to the immunological responses to NANPs both in vivo and in vitro. Variability in both the magnitude and the quality (cytokine profile) of the response observed between individual animals in our study is not uncommon in both laboratory animals and humans, and further speaks about the complexity of nanoparticle recognition by immune cells. Furthermore, since PgP has been shown to be effective nucleic acid carriers for central nervous system injury repair[38–40] some detectable amount of fluorescence and cytokine production in the brain demonstrated that NANPs were able to remain conjugated to the carrier to cross as well, which opens up possibilities for delivery to the central nervous system.
Figure 4.

In vivo characterization of ring orientations. A) Schematic of in vivo studies. NANPs complexed with the carrier, PgP were delivered to CD1 male and female via retro-orbital injection. B) IVIS images of mice were acquired 4 h following NANP delivery. C) IVIS images of organs were acquired 24 h post-delivery of NANPs. D) Radiant efficiency of organs. The letters “a” and “b” indicate statistically significant differences compared to the PBS control and to ring 6, respectively (two-way ANOVA with Tukey’s post hoc test, p < 0.05). E) Quantitative PCR analysis of immune mediator production in organs. The letters “a”, “b”, “c”, and “d” indicate statistically significant differences compared to the PgP control and to rings 1, 3C, and 6, respectively (two-sample t-test, p < 0.05). All data in (D,E) is expressed as the mean (N = 6 for rings 1, 3C, and 6; N = 2 for PBS; N = 3 for PgP) ± SEM and detailed statistical analysis (two-sample t-test, p < 0.05).
Figure 5.

Multiplex ELISA analysis of serum samples 24 h following NANP delivery. Horizontal line in each treatment group shows the mean value of individual animal responses; error bars show the SEM for the treatment group. Each dot represents a response from an individual animal. Student’s t-test with one-tailed distribution and two-sample unequal variance [CI 90% and CI95%] was used to compare treatment to control. Physiologically significant changes (i.e., twofold or more different from the baseline) were also monitored.
2.4. Immunorecognition of NANPs in Human PBMC
To investigate the immunostimulatory properties of the ring panel, NANPs with various TNA orientations were incubated with PBMC cultures and the production of type I and III interferons (IFNs), IFN-α, -β, -ω, and -λ, was assessed using a multiplex assay (Figure 5; Figures S7–S10, Supporting Information). Inter-donor variability in the magnitude of the response was observed. In cultures of some donors, the baseline level of IFNs was higher, as observed in the L2K and negative control (NC) groups. Initially, we expected that the number of DS RNAs added to the ring scaffolds would be the determining variable of immunostimulatory capabilities. However, this was not the case (Figure 6). While ring 0 showed low overall immunostimulation in agreement with previous work,[13] ring 6 did not induce the highest level of any of the IFNs in PBMC cultures in five out of six donors. Instead, ring 3C showed the highest stimulation of type I IFNs (-α, -β, and -ω) in three donors. For IFN-λ, a type III IFN, ring 3C showed higher stimulation than either ring 0 or 6; ring 4C induced the highest levels of IFNs.
Figure 6.

Results from a multiplex assay for type I and type III IFNs (IFN-α, -β, -ω, and -λ) 20 h after the transfection of PBMCs with rings using L2K. All rings were tested at the final concentration of 10 × 10−9 m. Each square on the heatmap represents the mean response of three independent samples (N = 3). Negative control (NC) is untreated cells, positive control is ODN2216, and vehicle control is L2K only. Changes in cytokine levels that were two-fold or more different from the baseline were considered physiologically significant; the comparison of treatment groups to the baseline was done for each donor separately due to the known inter-individual variability in the magnitude of the immune response and small cohort size (N = 6 donors).
3. Discussion
Tailoring NANP design based on the intended immunorecognition is a burgeoning area of their further adaptation[11,45] For three-dimensional NANPs (e.g., RNA cubes[46,47]), the overall scaffold can be tuned from highly immunostimulatory to immunoquiescent by introducing an increasing number of DNA strands into the composition.[13,15] While the functionalization of fibrous NANPs with TNAs has been shown to increase immunostimulation,[20,48] specific design principles influencing immunological properties of 2D NANPs have not been explored. The spacing between DS RNAs may play a role in recruiting an optimal number of receptors for recognition, as has been previously shown with double-stranded RNAs recognized by TLR3.[49] Indeed, in the present study, we demonstrated that the highest IFN response was detected with ring 3C (Figure 5), whereas rings with either none (ring 0) or the maximum number of TNAs (ring 6) demonstrated lower levels of IFNs. This data suggests that tertiary and possibly quaternary structures of NANPs influence their interactions with cognate PRRs.
The IFN responses to NANPs with various numbers and orientations of TNA functional moieties in human PBMC cultures correlate with the responses in reporter cell lines in that the strong activation of NF-κB and IRF pathways via RIG-I and TLR7 were also observed with ring 3C (Figure 3B). Unlike the reporter cell lines, in which ring 2C showed the highest overall response in NF-κB and IRF pathways, the IFN response to this NANP in PBMC cultures was weaker than that to ring 3C. We hypothesize several reasons for this discrepancy: i) the kinetics of responses to ring 2C and 3C differ between the reporter cell lines and PMBCs; ii) ring 3C activates additional pathways in human PBMCs that are not present in the reporter cell lines; and iii) ring 2C activates anti-inflammatory pathways in PBMCs that quench the initially strongest IFN response to protect the cell viability.
Our in vivo data demonstrating comparable induction of anti-inflammatory cytokine IL-10 by ring 1, ring 3C, and ring 6 suggest that the immune response to all rings, regardless of their pro-inflammatory potency at a fixed time point in vitro, is capable to progress toward the resolution of inflammation by activating negative regulators of the inflammation (Figure 4E).
The density and orientation of TNA moieties on rings may further influence the dynamics of the interaction of NANPs-L2K complexes with scavenger receptors (SRs) on the cell surface, thereby contributing to a differential speed of internalization and local endosomal concentrations of NANPs; however, the internalization speed and local endosomal concentrations were not investigated in the current study. The contribution of SRs to the internalization and endolysosomal trafficking of NANPs-L2K complexes has been reported earlier.[13] We further verified it in this study by comparing the uptake of representative NANPs by parent RAW264.7 cells and RAW264.7 Clone ½ in which SR-A expression is silenced[50] (Figure S11, Supporting Information).
Overall, responses to rings 2, 3 and 4 in reporter cells and PBMC cultures (Figures 3B and 6) are stronger than in ring 0, suggesting more optimal access to and interaction between these moieties on NANPs and receptors on and inside the cells when the TNAs are spaced out (i.e., orientation C).
Earlier studies demonstrated that the pathway of NANPs’ immunorecognition and the resulting spectrum of the cytokine responses can be controlled by the delivery carrier[26,27,51,52] and thus future studies toward in vivo work should utilize an alternative delivery vehicle to compare with in vitro work.
4. Experimental Section
Nucleic Acid Preparation:
Forward and reverse DNA primers and template strands (Integrated DNA Technologies (IDT), Inc.) were PCR-amplified using MyTaq Mix, 2x (Bioline), for the preparation of double-stranded DNA templates containing the promoters for T7 RNA polymerase. The amplified products were purified using DNA Clean & Concentrator® (Zymo Research) and transcribed by in vitro run-off transcription with T7 RNA polymerase in the presence of 80 × 10−3 m HEPES-KOH (pH 7.5), 2.5 × 10⁻³ m spermidine, 50 × 10−3 m DTT, 25 × 10−3 m MgCl2, and 5 × 10⁻³ m each rNTP over 3.5 h at 37 °C. Transcription was stopped by addition of RQ1 RNase-Free DNase (Promega, 3u/50 μL), followed by incubation for 30 min at 37 °C. The RNA strands produced were then purified through denaturing polyacrylamide gel electrophoresis (PAGE, 8%) in the presence of 8 m urea run in 89 × 10−3 m tris-borate, 2 × 10⁻³ m EDTA (TBE, pH 8.2) at 85 mA for ≈1.5 h. RNA bands were visualized by UV shadowing, cut out, and eluted overnight in 300 × 10−3 m NaCl, TBE at 4 °C. The eluate was thoroughly mixed with 2.5 volumes of 100% EtOH and placed at −20 °C for 3 h to precipitate. Afterward, samples were centrifuged at 10.0 G for 30 min and the resulting pellet was washed twice with 90% EtOH between 10-minute centrifugations at 10.0 G. The supernatant was removed and the pelleted samples were dried in a CentriVap micro-IR vacuum concentrator (Labconco) at 55 °C with IR. Pellets were dissolved in HyClone Water, Molecular Biology Grade (Cytiva) and the concentration of each strand was determined by measuring the absorbance at 260 nm on a NanoDrop 2000 (ThermoFisher). For the assembly of all NANP variations, twelve strands were separately prepared and stored at −20°C until use. All sequences were previously established and are available in the Supporting Information. Modified oligos—including those with 5’-phosphorylation, Alexa Fluor 488, or IRDye® 800—were purchased directly from IDT, Inc.
Assembly:
All NANPs were prepared by the combination of non-functional “1-6” strands and functional “1*-6*” strands. The combinations of strands were mixed in an equimolar ratio in endotoxin-free HyClone Water and heated to 95 °C for 2 min, snap-cooled on ice for 2 min to promote the formation of intramolecular hydrogen bonds, and assembly buffer (AB) was added to a final concentration of 89 × 10−3 m tris-borate (TB, pH 8.2), 2 × 10⁻³ m MgCl2, and 50 × 10−3 m KCl. Samples were then incubated at 30 °C for 30 min and were stored on ice or at 4 °C until use. For the assembly of Alexa Fluor 488-labeled rings, Alexa Fluor 488-labeled GFP Sense RNA strand was added in an equimolar ratio with one functionalized ring strand per assembly. For rings composed of more than one functionalized strand, non-labeled GFP Sense RNA was added in an equimolar ratio to all other functionalized strands. For the non-functionalized ring, an Alexa Fluor 488-labeled strand “3” was used. For the assembly of IRDye® 800-labeled rings, an IRDye® 800-labeled DNA strand was added in an equimolar ratio with one functionalized ring strand per assembly. For ring 3C and ring 6, the non-labeled GFP Sense RNA was added in an equimolar ratio to all other functionalized strands.
SAXS:
NANPs were prepared as above at ≈10 × 10−6 m concentration, 0.2 μm-filtered, and dialyzed against 0.2 μm-filtered assembly buffer for a minimum of 12 h with three buffer changes. SAXS data were collected at the Life Science X-ray scattering beamline (16-ID) at the National Synchrotron Light Source II at Brookhaven National Laboratory Laboratory in August of 2020 and February of 2021. The wavelength of the beam was 0.819 Å. Matched buffer data were recorded using the final dialysate and subtracted from the sample measurements to yield the scattering profile of each particle. The data are shown on the arbitrary scale and scaled to the same forward scattering intensity, I(0), for presentation purposes. Initial analysis was performed using the PRIMUS software to yield the radius of gyration, Rg, through a Guinier approximation using the low q data.[33] The pair-wise probability distance distribution, P(r), was modeled and Rg were calculated and the maximum linear dimension, dmax, was estimated using the GNOM software (ATSAS 3.0.1) for the nonfunctionalized (q = 0.008–0.200 Å−1), one DS RNA (q = 0.008–0.225 Å−1), three DS RNA-(q = 0.007–0.225 Å−1), and six DS RNA rings (q = 0.008–0.245 Å−1).[34] Dummy bead models of the non-functionalized ring and the six DS RNA ring were found using GASBOR (version 2.3i) with 264 and 650 dummy residues per symmetric unit, respectively.[35] A sixfold symmetry and oblate shape constraint was given to each run. Models were visualized with UCSF Chimera.[36] Idealized atomic models of the expected structures were superimposed onto the representative dummy atom models using SUPCOMB.[37]
AFM:
AFM of NANPs was performed as previously described[13] on a freshly cleaved 1-(3-aminopropyl) silatrane-modified mica surface. All images were collected from a MultiMode AFM Nanoscope IV system (Bruker Instruments) in tapping mode.
EMSA:
All NANPs were visualized on a native-PAGE (8%, 37.5:1 acrylamide:bis-acrylamide), prepared on a Mini-PROTEAN® Tetra Cell system (Bio-Rad). Gels were pre-run for 5 min at 150 V in 89 × 10−3 m TB, 2 × 10⁻³ m MgCl2, and 2 μL of 1 × 10⁻⁶ m ring were loaded per each well with 2 μL of native loading buffer (AB, 30% glycerol, bromophenol blue, xylene cyanol). Loaded gels were run for 30 min at 300 V, washed with double-deionized water (ddiH2O), and stained with ethidium bromide (EtBr, 0.5 μg mL−1). Gels were then imaged on a ChemiDoc MP (Bio-Rad). For Alexa Fluor 488-labeled rings, the gel was also imaged before staining for the Alexa Fluor 488 setting.
Cell Uptake:
MDA-MB-231 cells were maintained at 37 °C and 5% CO2 in Dulbecco’s Modified Eagle Medium (DMEM, Gibco) containing 10% heat-inactivated fetal bovine serum (FBS, Atlanta Biologicals), 100 U mL−1 penicillin, and 100 μg mL−1 streptomycin. Cells were seeded in 24-well plates at 40 000 cells per well 24 h before transfection. For a final concentration of 10 × 10−9 m rings per well, rings labeled with Alexa Fluor 488 were incubated with Lipofectamine 2000, or L2K (Invitrogen, 1 μL per well) at room temperature for 30 min and were then brought up to 250 μL in Opti-MEM (Gibco). Media was aspirated from each well and replaced with the treatment in Opti-MEM for 4 h of incubation at 37 °C and 5% CO2. Afterward, the treatment was aspirated and replaced with fresh media. Cells were kept in incubation and assessed after 48 h.
Cell Silencing:
MDA-MB-231/GFP cells were maintained at 37 °C and 5% CO2 in DMEM (Gibco) containing 10% heat-inactivated FBS (Atlanta Biologicals), 100 U/mL penicillin, and 100 μg mL−1 streptomycin. Cells were seeded in 12-well plates at 40000 cells per well 24 h before transfection. For a final concentration of 10 × 10−9 m rings per well, the rings were incubated with L2K (2 μL per well) at room temperature for 30 min and were then brought up to 500 μL in Opti-MEM (Gibco). Media was aspirated from each well and replaced with the treatment in Opti-MEM for 4 h of incubation at 37 °C and 5% CO2. Afterward, the treatment was aspirated and replaced with fresh media. Cells were kept in incubation and assessed after 72 h.
Fluorescent Microscopy:
Cells were viewed on an EVOS® FL cell imaging system (Thermo Fisher) equipped with a GFP light cube (488 abs, 507 em). Brightfield images were taken at 50% brightness, while GFP images of the same field were taken at 60% brightness.
Flow Cytometry:
Media from the wells of 12- and 24-well plates was aspirated and cells were gently washed with an equivalent volume of PBS (VWR). Afterward, 200 μL 0.25% Trypsin-EDTA (Gibco) was added to each well for a 5-minute incubation at 37 °C and 5% CO2. 200 μL of cell media was added to each well to stop trypsinization and all 400 μL per well were transferred into new Eppendorf tubes. Tubes were spun down at 300× g for 5 min and the cell pellet was washed once with 200 μL of PBS. Afterward, the resuspended cells were analyzed on a BD Accuri C6 Flow Cytometer with a blue (488 nm) laser and 533/30 optical filters. The cells-only treatment was used to gate 10 000 events per sample for analysis. N = 3 replicates were completed and averaged to evaluate the mean fluorescence ± standard deviation (SD).
Immune Reporter Cells:
THP1-Dual, HEK-Blue hTLR3, HEK-Blue hTLR7, HEK-Blue hTLR8, and HEK-Lucia RIG-I cells (InvivoGen) were maintained according to the supplier’s instructions in an incubator at 37 °C and 5% CO2. For all experiments, cells were seeded at 40 000 cells per well in a flat-bottomed 96-well plate (Corning Costar) 24 h before transfection (for HEK cells) or immediately before transfection (for THP1 cells). For a final concentration of 10 × 10−9 m rings per well, the rings were incubated with L2K (Invitrogen, 0.375 μL per well) at room temperature for 30 min and were then added to the wells in technical triplicate repeats. A panel of positive controls (all from InvivoGen) for each receptor were used as follows: 10 ng mL−1 3p-hpRNA with 0.375 μL L2K per well (following 30 min of incubation) and 2 μg mL−1 R848 for THP1-Dual (IRF and NF-κB pathways, respectively); 10 ng mL−1 3p-hpRNA with 0.375 μL L2K per well (following 30 min of incubation) for HEK-Lucia RIG-I; 2 μg mL−1 R848 for HEK-Blue hTLR7 and HEK-Blue hTLR8; 2 μg mL−1 Poly I:C for HEK-Blue hTLR3. L2K (0.375 μL per well), AB (equal to the volume of ring added per well), and DS RNA duplex (10 × 10−9 m, 0.375 μL L2K per well) were used as additional controls. Twenty four hours after the transfection, THP1-Dual and HEK-Blue cells were assessed using QUANTI-Blue assays (InvivoGen) according to the manufacturer’s guidelines and the plates were read on a Tecan Spark plate reader at an absorbance of 638 nm. All well values were the averages of sixteen-point reads. THP1-Dual and HEK-Lucia cells were assessed using QUANTI-Luc assays (InvivoGen) according to the manufacturer’s guidelines. Plates were read immediately on a Tecan Spark plate reader for luminescence with a 100 ms reading time. Within each plate, all samples were assessed in technical triplicates, averaged, and normalized to the cells-only treatment for assessment of normalized fold induction. N 5 biological replicates were completed and averaged to evaluate the mean and standard error of the mean (SEM).
Biodistribution and Immune Activation in CD1 Mice:
Representative functional NANPs of three distinct orientations (ring 1, ring 3C, and ring 6) were administered via retro-orbital injection to 7–8-week-old male and female CD1 mice from Charles River under UNC Charlotte Vivarium Protocol #19-003. Rings were assembled fresh with one fluorescently labeled IRDye800 sequence per ring in order to visualize the biodistribution of the treatments over time. Rings were combined with the cationic amphiphilic copolymer poly(lactide-co-glycolide)-graft-polyethylenimine (here referred to as PgP[26,38–40]) as a delivery agent in a 30/1 N/P ratio (where N is number of nitrogen atoms in PgP and P is number of phosphorus atoms in NANPs) and allowed to incubate at room temperature for 30 min prior to loading and injection. Mice were anesthetized with 1–3% isoflurane and received 100 μL of 10 × 10−6 m RNA ring with PgP via retro-orbital injection. All animals were monitored for full recovery. Four hours post-injection, mice were imaged using IVIS to visualize the location of the RNA rings (excitation 745 nm, emission 820 nm). Twenty-four hours post-injection, total blood was collected via cardiac puncture for serum separation and cytokine analysis conducted by Quansys Biosciences. For cytokine analysis, a Quansys Biosciences Q-Plex Mouse Custom multiplex ELISA array was used to identify the main contributors of the immune response. A panel of relevant cytokines was chosen given the window of expression in which the 24-hour treatment took place to include IL-1β, IL-2, IL-6, IL-10, MCP-1, IFNγ, TNFα, MIP-2, KC, and MIP-1α. Total organ fluorescence of the brain, heart, lungs, kidney, liver, and spleen were assessed via IVIS 24 h post-delivery to evaluate the distribution of rings. Organs were placed in RNAlater and stored at −80°C. RNA was extracted from 100–200 mg of organ tissue using TRIzol Reagent with the PureLink RNA Mini Kit (ThermoFisher, Cat. No.12183025) according to the manufacturer’s guidelines. RNA was quantified using a NanoDrop 3300 Fluorospectrometer prior to cDNA synthesis using iScript cDNA synthesis kit (Biorad, Cat. No. 1 708 891). All RNA used in cDNA synthesis reactions had a 260/280 value greater than 1.8 as recommended. The cDNA synthesis was conducted using 1 μg of RNA per 20 μL reaction. The reaction was incubated in a thermal cycler according the manufacturer’s recommended protocol and cDNA was stored at −20°C. Quantitative PCR was conducted using Advanced Universal SYBR Green Supermix (Biorad, Cat. No. 1725271) according to manufacturer’s recommended guidelines for 20 μL reactions in a Bio-Rad CFX96 Real-Time System. Quantitative PCR was conducted for IL-6 (Primer Bank ID 13624311a1, Forward: 5’-TAGTCCTTCCTACCCCAATTCC, Reverse: 5′-TTGGTCCTTAGCCACTCCTTC-3′, Amplicon size: 76), IFN-β (Forward: 5′-GCACTGGGTGGAATGAGACTATTG-3′; Reverse: 5′-TTCTGAGGCATCAACTGACAGGTC-3′, Amplicon size: 297 bp), and GAPDH (Primer Bank ID 6679937a1, Forward: 5’-AGGTCGGTGTGAACGGATTTG-3′, Reverse:5′-TGTAGACCATGTAGTTGAGGTCA-3′, Amplicon size: 123 bp). Fold induction was calculated as follows: ΔCq (PBS control mouse) = ΔCq (IL-6 or IFN-β) – ΔCq (GAPDH), ΔCq (NANP stimulated mouse) = ΔCq (IL-6 or IFN-β)- ΔCq (GAPDH), ΔΔCq = ΔCq (NANP stimulated mouse) – ΔCq (PBS control mouse), Fold Change = 2−(ΔΔCq).
Immunostimulation in PBMCs:
Blood from healthy donor volunteers was collected under NCI-Frederick protocol OH99CN046 D. A peripheral blood cytokine induction assay was performed following NCL Method ITA-10[41] as previously established for the evaluation of NANPs.[7] Whole blood was collected from healthy donor volunteers and mixed 1:1 v/v with phosphate-buffered saline (PBS, HyClone, Cytiva), then layered 4:3 v/v with Ficoll-Paque (GE Healthcare) and centrifuged for 30 min at 900× g without brake. The resulting mononuclear cell layer was washed in three times the volume of Hank’s balanced salt solution (HBSS, Gibco) and centrifuged for 10 min at 400× g, then the supernatant was discarded and an additional wash was completed. Cells were resuspended in complete Roswell Park Memorial Institute (RPMI)-1640 media with 10% heat-inactivated FBS, 2 × 10⁻³ m l-glutamine, 100 U mL−1 penicillin, and 100 μg mL−1 streptomycin (all from Hyclone, GE Life Sciences) and seeded at 200 000 cells in 160 μL per well in 96-well U-bottomed plates as previously described.[16] ODN2216, a known oligonucleotide immune activator, served as a positive control[42] Three repeats were performed for each of six donors to account for inter-donor variability. For a final concentration of 10 × 10−9 m rings per well, the rings were incubated with L2K (0.4 μL per well) at room temperature for 30 min and were then added to the wells in triplicate per donor. As a positive control, ODN2216 was added at 25 μg mL−1. All samples were diluted in Opti-MEM to bring each well volume to 200 μL, including for the cells-only and L2K control treatments. Plates were incubated at 37 °C and 5% CO2 for 20 h. Afterward, plates were spun down at 400× g for 5 min, and supernatants were transferred to a new 96-well plate for analysis. A 4-plex interferon kit (Quansys Biosciences) was used to assess the amounts of IFN-α, IFN-β, IFN-ω, and IFN-λ (pg mL−1) from supernatants following the supplier’s protocol. Multiplex assays were read using a Quansys ImagePro reader equipped with Q-View software. Cytokine elevation two-fold or more above the baseline was considered physiologically relevant.
Presentation and Statistical Analysis:
Figures were prepared in Adobe Illustrator. Statistical analysis was performed either by one-way or two-way analysis of variance (ANOVA) using GraphPad Prism software or by two-sample t-test using software R (by J.J); Student’s t-test was also employed to gauge the difference between individual treatments and baseline samples. All data were presented as mean of several biological repeats with the sample size (N) specified for each dataset and error bars denoted mean ± standard error (SEM); p < 0.05 and p < 0.1 were considered to be statistically significant with CI 95% and CI 90%, respectively. Physiologically significant changes (i.e., twofold or more different from the baseline) were also monitored.
Supplementary Material
Acknowledgements
The authors would like to thank Alexander Lushnikov and Yuri Lyubchenko for performing AFM at the Nanoimaging Core Facility at the University of Nebraska Medical Center. The authors would also like to thank the UNC Charlotte Vivarium staff for their excellent support and technical expertise with in vivo experiments. The authors would further like to thank James Byrnes, Lin Yang, and Shirish Chodankar for their assistance with SAXS data collection at the LiX beamline of the NSLS-II. This research used resources LiX of the National Synchrotron Light Source II, a U.S. Department of Energy (DOE) Office of Science User Facility operated for the DOE Office of Science by Brookhaven National Laboratory under Contract No. DE-SC0012704. Research reported in this publication was supported by the National Institute of General Medical Sciences of the National Institutes of Health under Award Numbers R01GM120487 and R35GM139587 (to K.A.A.) and partly by the National Institute of Neurological Disorders and Strokes of the National Institutes of Health under Award Numbers 5R01NS111037 (to J.S.L and K.A.A.). The content is solely the responsibility of the authors and does not necessarily represent the official views of the National Institutes of Health. The study was also funded in part by federal funds from the National Cancer Institute, National Institutes of Health, under contract 75N91019D00024 (M.A.D., D.S., and E.C.). The content of this publication does not necessarily reflect the views or policies of the Department of Health and Human Services, nor does mention of trade names, commercial products, or organizations imply endorsement by the U.S. Government. Research reported in this publication was supported in part by the Thomas L. Reynolds Graduate Student Research Award and the Graduate School Summer Fellowship at the University of North Carolina at Charlotte (to M.C.). The Center for BioMolecular Structure (CBMS) is primarily supported by the National Institutes of Health, National Institute of General Medical Sciences (NIGMS) through a Center Core P30 Grant (P30GM133893), and by the DOE Office of Biological and Environmental Research (KP1607011). The content is solely the responsibility of the authors and does not necessarily represent the official views of the National Institutes of Health. The content of this publication does not necessarily reflect the views or policies of the Department of Health and Human Services, nor does mention of trade names, commercial products, or organizations imply endorsement by the U.S. Government.
Footnotes
Conflict of Interest
The authors declare no conflict of interest.
Supporting Information
Supporting Information is available from the Wiley Online Library or from the author.
The ORCID identification number(s) for the author(s) of this article can be found under https://doi.org/10.1002/adfm.202205581.
Contributor Information
Morgan Chandler, Nanoscale Science Program, Department of Chemistry, University of North Carolina at Charlotte, Charlotte, NC 28223, USA.
Lewis Rolband, Nanoscale Science Program, Department of Chemistry, University of North Carolina at Charlotte, Charlotte, NC 28223, USA.
M. Brittany Johnson, Department of Biological Sciences, University of North Carolina at Charlotte, Charlotte, NC 28223, USA.
Da Shi, Nanotechnology Characterization Laboratory, Cancer Research Technology Program, Frederick National Laboratory for Cancer Research, Frederick, MD 21702, USA.
Yelixza I. Avila, Nanoscale Science Program, Department of Chemistry, University of North Carolina at Charlotte, Charlotte, NC 28223, USA
Edward Cedrone, Nanotechnology Characterization Laboratory, Cancer Research Technology Program, Frederick National Laboratory for Cancer Research, Frederick, MD 21702, USA.
Damian Beasock, Nanoscale Science Program, Department of Chemistry, University of North Carolina at Charlotte, Charlotte, NC 28223, USA.
Leyla Danai, Nanoscale Science Program, Department of Chemistry, University of North Carolina at Charlotte, Charlotte, NC 28223, USA.
Elizabeth Stassenko, Nanoscale Science Program, Department of Chemistry, University of North Carolina at Charlotte, Charlotte, NC 28223, USA.
Joanna K. Krueger, Nanoscale Science Program, Department of Chemistry, University of North Carolina at Charlotte, Charlotte, NC 28223, USA
Jiancheng Jiang, Department of Mathematics, University of North Carolina at Charlotte, Charlotte, NC 28223, USA.
Jeoung Soo Lee, Drug Design, Development, and Delivery (4D) Laboratory, Department of Bioengineering, Clemson University, Clemson, SC 29634, USA.
Marina A. Dobrovolskaia, Nanotechnology Characterization Laboratory, Cancer Research Technology Program, Frederick National Laboratory for Cancer Research, Frederick, MD 21702, USA
Kirill A. Afonin, Nanoscale Science Program, Department of Chemistry, University of North Carolina at Charlotte, Charlotte, NC 28223, USA
Data Availability Statement
The data that support the findings of this study are available from the corresponding author upon reasonable request.
References
- [1].Johnson MB, Chandler M, Afonin KA, Adv. Drug Deliv. Rev 2021, 173, 427. [DOI] [PMC free article] [PubMed] [Google Scholar]
- [2].Johnson MB, Halman JR, Burmeister AR, Currin S, Khisamutdinov EF, Afonin KA, Marriott I, J. Neuroinflam 2020, 17, 139. [DOI] [PMC free article] [PubMed] [Google Scholar]
- [3].Ori D, Murase M, Kawai T, Int. Rev. Immunol 2017, 36, 74. [DOI] [PubMed] [Google Scholar]
- [4].Roers A, Hiller B, Hornung V, Immunity 2016, 44, 739. [DOI] [PubMed] [Google Scholar]
- [5].Kawasaki T, Kawai T, Front Immunol. 2014, 5, 461. [DOI] [PMC free article] [PubMed] [Google Scholar]
- [6].Ablasser A, Hur S, Nat. Immunol 2020, 21, 17. [DOI] [PubMed] [Google Scholar]
- [7].Dobrovolskaia MA, Afonin KA, Nat. Protoc 2020, 15, 3678. [DOI] [PMC free article] [PubMed] [Google Scholar]
- [8].Afonin KA, Dobrovolskaia MA, Ke W, Grodzinski P, Bathe M, Adv. Drug Deliv. Rev 2022, 181, 114081. [DOI] [PMC free article] [PubMed] [Google Scholar]
- [9].Afonin KA, Dobrovolskaia MA, Church G, Bathe M, ACS Nano 2020, 14, 9221. [DOI] [PMC free article] [PubMed] [Google Scholar]
- [10].Chandler M, Panigaj M, Rolband LA, Afonin KA, Nanomedicine 2020, 15, 1331. [DOI] [PMC free article] [PubMed] [Google Scholar]
- [11].Chandler M, Johnson MB, Panigaj M, Afonin KA, Curr. Opin. Biotechnol 2020, 63, 8. [DOI] [PMC free article] [PubMed] [Google Scholar]
- [12].Dobrovolskaia MA, Molecules 2019, 24, 4620. [DOI] [PMC free article] [PubMed] [Google Scholar]
- [13].Hong E, Halman JR, Shah AB, Khisamutdinov EF, Dobrovolskaia MA, Afonin KA, Nano Lett. 2018, 18, 4309. [DOI] [PMC free article] [PubMed] [Google Scholar]
- [14].Tran AN, Chandler M, Halman J, Beasock D, Fessler A, McKeough RQ, Lam PA, Furr DP, Wang J, Cedrone E, Dobrovolskaia MA, Dokholyan NV, Trammell SR, Afonin KA, Small 2022, 18, 2104814. [DOI] [PMC free article] [PubMed] [Google Scholar]
- [15].Halman JR, Satterwhite E, Roark B, Chandler M, Viard M, Ivanina A, Bindewald E, Kasprzak WK, Panigaj M, Bui MN, Lu JS, Miller J, Khisamutdinov EF, Shapiro BA, Dobrovolskaia MA, Afonin KA, Nucleic Acids Res. 2017, 45, 2210. [DOI] [PMC free article] [PubMed] [Google Scholar]
- [16].Hong E, Halman JR, Shah A, Cedrone E, Truong N, Afonin KA, Dobrovolskaia MA, Molecules 2019, 24, 1094. [DOI] [PMC free article] [PubMed] [Google Scholar]
- [17].Johnson MB, Chandler M, Afonin KA, Adv. Drug Deliv. Rev 2021, 173, 427. [DOI] [PMC free article] [PubMed] [Google Scholar]
- [18].Avila YI, Chandler M, Cedrone E, Newton HS, Richardson M, Xu J, Clogston JD, Liptrott NJ, Afonin KA, Dobrovolskaia MA, Molecules 2021, 26, 652. [DOI] [PMC free article] [PubMed] [Google Scholar]
- [19].Chandler M, Afonin KA, Nanomaterials 2019, 9, 611. [DOI] [PMC free article] [PubMed] [Google Scholar]
- [20].Rackley L, Stewart JM, Salotti J, Krokhotin A, Shah A, Halman JR, Juneja R, Smollett J, Lee L, Roark K, Viard M, Tarannum M, Vivero-Escoto J, Johnson PF, Dobrovolskaia MA, Dokholyan NV, Franco E, Afonin KA, Adv. Funct. Mater 2018, 28, 1805959. [DOI] [PMC free article] [PubMed] [Google Scholar]
- [21].Grabow WW, Zakrevsky P, Afonin KA, Chworos A, Shapiro BA, Jaeger L, Nano Lett. 2011, 11, 878. [DOI] [PMC free article] [PubMed] [Google Scholar]
- [22].Yingling YG, Shapiro BA, Nano Lett. 2007, 7, 2328. [DOI] [PubMed] [Google Scholar]
- [23].Afonin KA, Viard M, Koyfman AY, Martins AN, Kasprzak WK, Panigaj M, Desai R, Santhanam A, Grabow WW, Jaeger L, Heldman E, Reiser J, Chiu W, Freed EO, Shapiro BA, Nano Lett. 2014, 14, 5662. [DOI] [PMC free article] [PubMed] [Google Scholar]
- [24].Afonin KA, Kireeva M, Grabow WW, Kashlev M, Jaeger L, Shapiro BA, Nano Lett. 2012, 12, 5192. [DOI] [PMC free article] [PubMed] [Google Scholar]
- [25].Afonin KA, Grabow WW, Walker FM, Bindewald E, Dobrovolskaia MA, Shapiro BA, Jaeger L, Nat. Protocols 2011, 6, 2022. [DOI] [PMC free article] [PubMed] [Google Scholar]
- [26].Halman JR, Kim K-T, Gwak S-J, Pace R, Johnson MB, Chandler MR, Rackley L, Viard M, Marriott I, Lee JS, Afonin KA, Nanomedicine 2020, 23, 102094. [DOI] [PMC free article] [PubMed] [Google Scholar]
- [27].Juneja R, Vadarevu H, Halman J, Tarannum M, Rackley L, Dobbs J, Marquez J, Chandler M, Afonin K, Vivero-Escoto JL, ACS Appl. Mater. Interfaces 2020, 12, 38873. [DOI] [PMC free article] [PubMed] [Google Scholar]
- [28].Yourston L, Rolband L, West C, Lushnikov A, Afonin KA, Krasnoslobodtsev AVJN, Nanoscale 2020, 12, 16189. [DOI] [PubMed] [Google Scholar]
- [29].Parlea L, Bindewald E, Sharan R, Bartlett N, Moriarty D, Oliver J, Afonin KA, Shapiro BA, Methods 2016, 103, 128. [DOI] [PMC free article] [PubMed] [Google Scholar]
- [30].Sajja S, Chandler M, Fedorov D, Kasprzak WK, Lushnikov A, Viard M, Shah A, Dang D, Dahl J, Worku B, Dobrovolskaia MA, Krasnoslobodtsev A, Shapiro BA, Afonin KA, Langmuir 2018, 34, 15099. [DOI] [PMC free article] [PubMed] [Google Scholar]
- [31].Nordmeier S, Ke W, Afonin KA, Portnoy V, in Therapeutic RNA Nanotechnology (Eds. Afonin KA, Chandler M), Jenny Stanford Publishing, New York: 2021, pp. 539–564. [Google Scholar]
- [32].Ke W, Afonin KA, Adv. Drug Deliv. Rev 2021, 176, 113835. [DOI] [PMC free article] [PubMed] [Google Scholar]
- [33].Konarev PV, Volkov VV, Sokolova AV, Koch MHJ, Svergun DI, J. Appl. Crystallogr 2003, 36, 1277. [Google Scholar]
- [34].Svergun DI, J. Appl. Crystallogr 1992, 25, 495. [Google Scholar]
- [35].Svergun DI, Petoukhov MV, Koch MHJ, Biophys. J 2001, 80, 2946. [DOI] [PMC free article] [PubMed] [Google Scholar]
- [36].Pettersen EF, Goddard TD, Huang CC, Couch GS, Greenblatt DM, Meng EC, Ferrin TE, J. Comput. Chem 2004, 25, 1605. [DOI] [PubMed] [Google Scholar]
- [37].Kozin MB, Svergun DI, J. Appl. Crystallogr 2001, 34, 33. [Google Scholar]
- [38].Macks C, Jeong D, Lee JS, Nanomedicine 2021, 32, 102343. [DOI] [PMC free article] [PubMed] [Google Scholar]
- [39].Gwak SJ, Macks C, Jeong DU, Kindy M, Lynn M, Webb K, Lee JS, Biomaterials 2017, 121, 155. [DOI] [PMC free article] [PubMed] [Google Scholar]
- [40].Gwak SJ, Nice J, Zhang J, Green B, Macks C, Bae S, Webb K, Lee JS, Acta Biomater. 2016, 35, 98. [DOI] [PMC free article] [PubMed] [Google Scholar]
- [41].Potter T, Cedrone E, Neun B, Dobrovolskaia M, NCL Method ITA-10, NCL, Frederick, MD: 2020. [Google Scholar]
- [42].Zamanian-Daryoush M, Marques JT, Gantier MP, Behlke MA, John M, Rayman P, Finke J, Williams BR, J. Interferon Cytokine Res 2008, 28, 221. [DOI] [PubMed] [Google Scholar]
- [43].Rose SD, Kim D-H, Amarzguioui M, Heidel JD, Collingwood MA, Davis ME, Rossi JJ, Behlke MA, Nucleic Acids Res. 2005, 33, 4140. [DOI] [PMC free article] [PubMed] [Google Scholar]
- [44].Saenger W, In Principles of Nucleic Acid Structure, (Ed. Saenger W), Springer New York, New York, NY, 1984, pp. 220–241. [Google Scholar]
- [45].Johnson MB, Chandler M, Afonin KA, Adv. Drug Deliv. Rev 2021, 173, 427. [DOI] [PMC free article] [PubMed] [Google Scholar]
- [46].Afonin KA, Bindewald E, Yaghoubian AJ, Voss N, Jacovetty E, Shapiro BA, Jaeger L, Nat. Nanotechnol 2010, 5, 676. [DOI] [PMC free article] [PubMed] [Google Scholar]
- [47].Afonin KA, Kasprzak W, Bindewald E, Puppala PS, Diehl AR, Hall KT, Kim TJ, Zimmermann MT, Jernigan RL, Jaeger L, Shapiro BA, Methods 2014, 67, 256. [DOI] [PMC free article] [PubMed] [Google Scholar]
- [48].Ke W, Hong E, Saito RF, Rangel MC, Wang J, Viard M, Richardson M, Khisamutdinov EF, Panigaj M, Dokholyan NV, Chammas R, Dobrovolskaia MA, Afonin KA, Nucleic Acids Res. 2019, 47, 1350. [DOI] [PMC free article] [PubMed] [Google Scholar]
- [49].Lee EY, Takahashi T, Curk T, Dobnikar J, Gallo RL, Wong GCL, ACS Nano 2017, 11, 12145. [DOI] [PMC free article] [PubMed] [Google Scholar]
- [50].Franca A, Aggarwal P, Barsov EV, Kozlov SV, Dobrovolskaia MA, Gonzalez-Fernandez A, Nanomedicine 2011, 6, 1175. [DOI] [PMC free article] [PubMed] [Google Scholar]
- [51].Avila YI, Chandler M, Cedrone E, Newton HS, Richardson M, Xu J, Clogston JD, Liptrott NJ, Afonin KA, Dobrovolskaia MA, Molecules 2021, 26, 652. [DOI] [PMC free article] [PubMed] [Google Scholar]
- [52].Ke W, Afonin KA, Adv. Drug Deliv. Rev 2021, 176, 113835. [DOI] [PMC free article] [PubMed] [Google Scholar]
Associated Data
This section collects any data citations, data availability statements, or supplementary materials included in this article.
Supplementary Materials
Data Availability Statement
The data that support the findings of this study are available from the corresponding author upon reasonable request.