

Abstract
Thrombosis is a major complication that can occur in both blood-contacting devices and regions and in regions of vascular damage. Microfluidic devices are popular templates to model various thrombogenic settings and to assess conditions that lead to bulk channel occlusion. However, area-averaged measurements miss the opportunity to extract real-time information on thrombus evolution and early dynamics of thrombus formation and propagation, which result in late-stage bulk channel occlusion. To clarify these dynamics, we have developed a standalone tracking algorithm that uses consecutive image connectivity and minimal centroid distance mappings to uniquely index all appearing thrombi in fluorescence time-lapse videos Supplemental Video 1, and Supplemental Video 2. This leads to measurements of all individual aggregates that can in turn be studied as ensembles. We applied tracking to fluorescence time-lapse videos Supplemental Video 1, and Supplemental Video 2 of thrombosis across both collagen-functionalized substrate and across the surface of a roughened titanium alloy (Ti6Al4V) at a shear rate of 4000 s−1. When comparing ensemble-averaged measurements to area-averaged metrics, we unveil immediate, steady thrombus growth at early phases on collagen surfaces and unstable thrombus attachment to roughened Ti6Al4V surfaces on Ti6Al4V surfaces. Additionally, we introduce tracked thrombus eccentricity and fluorescence intensity as additional volumetric measures of thrombus growth that relate back to the primary thrombosis mechanism at play. This work advocates for the complementation of surface macrostate metrics with characteristic thrombus microstate growth patterns to accurately predict critical thrombosis events.
Keywords: bioengineered surfaces, platelet aggregation, thrombosis, tracking
Thrombosis is the formation of blood clots in the vasculature or in blood-contacting surfaces and is one of the major causes of cardiovascular deaths in the United States.1 Patients requiring blood-contacting implanted devices such as ventricular assist devices or extracorporeal membrane oxygenators (ECMO) are subject to device malfunction or vascular obstruction due to circuit thrombosis. In 2014, the Interagency Registry for Mechanically Assisted Circulatory Support (INTERMACS) reported over a 5% increase in 6-month pump exchange or death rates attributed to thrombosis in the HeartMate II LVAD, with no explanation for the rise.2 Surrounding the COVID-19 pandemic, pulmonary immunothrombosis and deep vein thrombosis rates were reported as high as 27% and 53% for patients undergoing ECMO support,3 and the Extracorporeal Life Support Organization reports circuit change rates as high as 15% in 2020.4 A common fluid dynamical feature of these systems are elevated shear rates in excess of 1000 s−1.5–7 In addition to shear-independent mechanisms,8–10 at these shear rates, von Willebrand Factor (VWF), a natively coiled thrombogenic protein, elongates and tethers to adhesive proteins such as collagen and bind to platelet GPIba receptors.11–13 Upon arrest, platelets undergo activation and aggregation. In contrast, artificial surfaces require the deposition of plasma proteins to develop a thrombogenic surface upon which platelets can adhere to and activate.14,15 In addition, these surfaces contain nanoscale roughness features from machining processes, and the effect of these features on platelet adhesion and aggregation is not clearly understood.16–19
Microfluidic devices have emerged as popular templates to model and study thrombotic systems because of their ease of fabrication, optical transparency, flow control, and reduced reagent costs.20 Sub-millimeter length scales characteristic in these devices allow for simplification of the flow momentum equations into the Stokes equations, which allow for precise shear stress control throughout the device based on careful geometric channel design and flow inputs. In addition to shear control, it is routine to model vasculature or clinical interfaces in these devices. Glass substrates can be coated with thrombogenic proteins such as fibrinogen,21 collagen,22 or VWF,23 to create a prothrombotic surface. Alternatively, biomaterial thrombogenicity can be assessed by flowing blood through a microchannel clamped onto the material of interest. These perks have greatly advanced the field’s understanding of real-time platelet activation under various controlled flow and surface conditions.8,23–25
Despite the ability to observe and quantify thrombus growth in real-time, thrombosis studies in microfluidic devices have reported only area-averaged thrombosis measures and only a small fraction of the sampled times. Common measurements include endpoint or peak surface coverage fractions,26–29 mean aggregate areas,28,30 mean fluorescence intensity,31 platelet or thrombus morphology scores,26,29 and platelet counts32 over a course of perfusion. The rationale for reporting endpoint or peak values is consistent with the field’s mission to minimize bulk thrombosis and occlusion rates. However, there is a missed opportunity to complement these studies with information on the dynamics of early-stage thrombosis development and thrombus microstate evolution that would later develop into bulk channel occlusion. One method to resolve these features is by tracking individual platelets as they are allowed to nucleate and propagate on a surface. Entity tracking has routinely been used in studies of cell and particle dynamics33,34 and, to our knowledge, has not been used to study thrombus formation and propagation before channel occlusion. Once in place, evolutionary histories of thrombi postadhesion can be determined and studied as ensembles to draw new information on thrombus development or to better contrast grossly varying thrombotic systems through methods that are not restricted to area-averaged metrics. Understanding these dynamics can have widespread impacts, such as providing studies to validate computational fluid dynamics (CFD) models concerning thrombus microstates, or establishing novel metrics to assess ensemble-averaged thrombus stability as a function of shear and surface condition.
To demonstrate these added outputs and benefits, we introduce a tracking algorithm that traces thrombus properties as they grow on surfaces. Using minimal distance centroid mappings and consecutive-image connectivity, we can reconstruct the development of numerous thrombus properties for every thrombus in view. After reconstruction, we reveal hidden thrombus growth and embolization features that are unveiled only when deconvolving aggregate growth from the chronology of aggregate nucleation. We exemplify this by applying our method to fluorescence time-lapse videos Supplemental Video 1, and Supplemental Video 2 of thrombus growth on collagen-coated glass and uncoated roughened titanium alloys at high shear. We report ensemble-averaged platelet aggregate areas and aggregate counts that evince subtle differences in the dynamics of thrombus formation across the two systems that area-averaged readouts are unable to detect. Furthermore, we introduce eccentricity and normalized mean and maximum fluorescence intensity evolution to discern mural and volumetric growth features that pertain to each surface condition. To our knowledge, this is the first application of entity tracking to microfluidic studies of thrombus formation, and our results provide insight on the dynamics of thrombosis initiation and propagation that precede bulk occlusion.
Methodology
This section describes the procedure for entity tracking algorithm and event classification. The materials and methodology for the blood sample preparation, microfluidic experiment setup, image acquisition, and image processing are disclosed in the supplementary information. The algorithm makes no assumptions about the experimental conditions and acts strictly on the matrices of intensities provided by a stack of fluorescence images. A low-pass Butterworth filter is applied to these images before binarization to further attenuate signal originating from freely flowing platelets above the surface of interest (Figure 1, Supplementary Figure 1). The typical field procedure is to binarize images and assign arbitrary indices for each 2-dimensionally connected foreground object. Once each object is indexed, properties such as 2-D area or the number of foreground objects can be determined.
Figure 1.
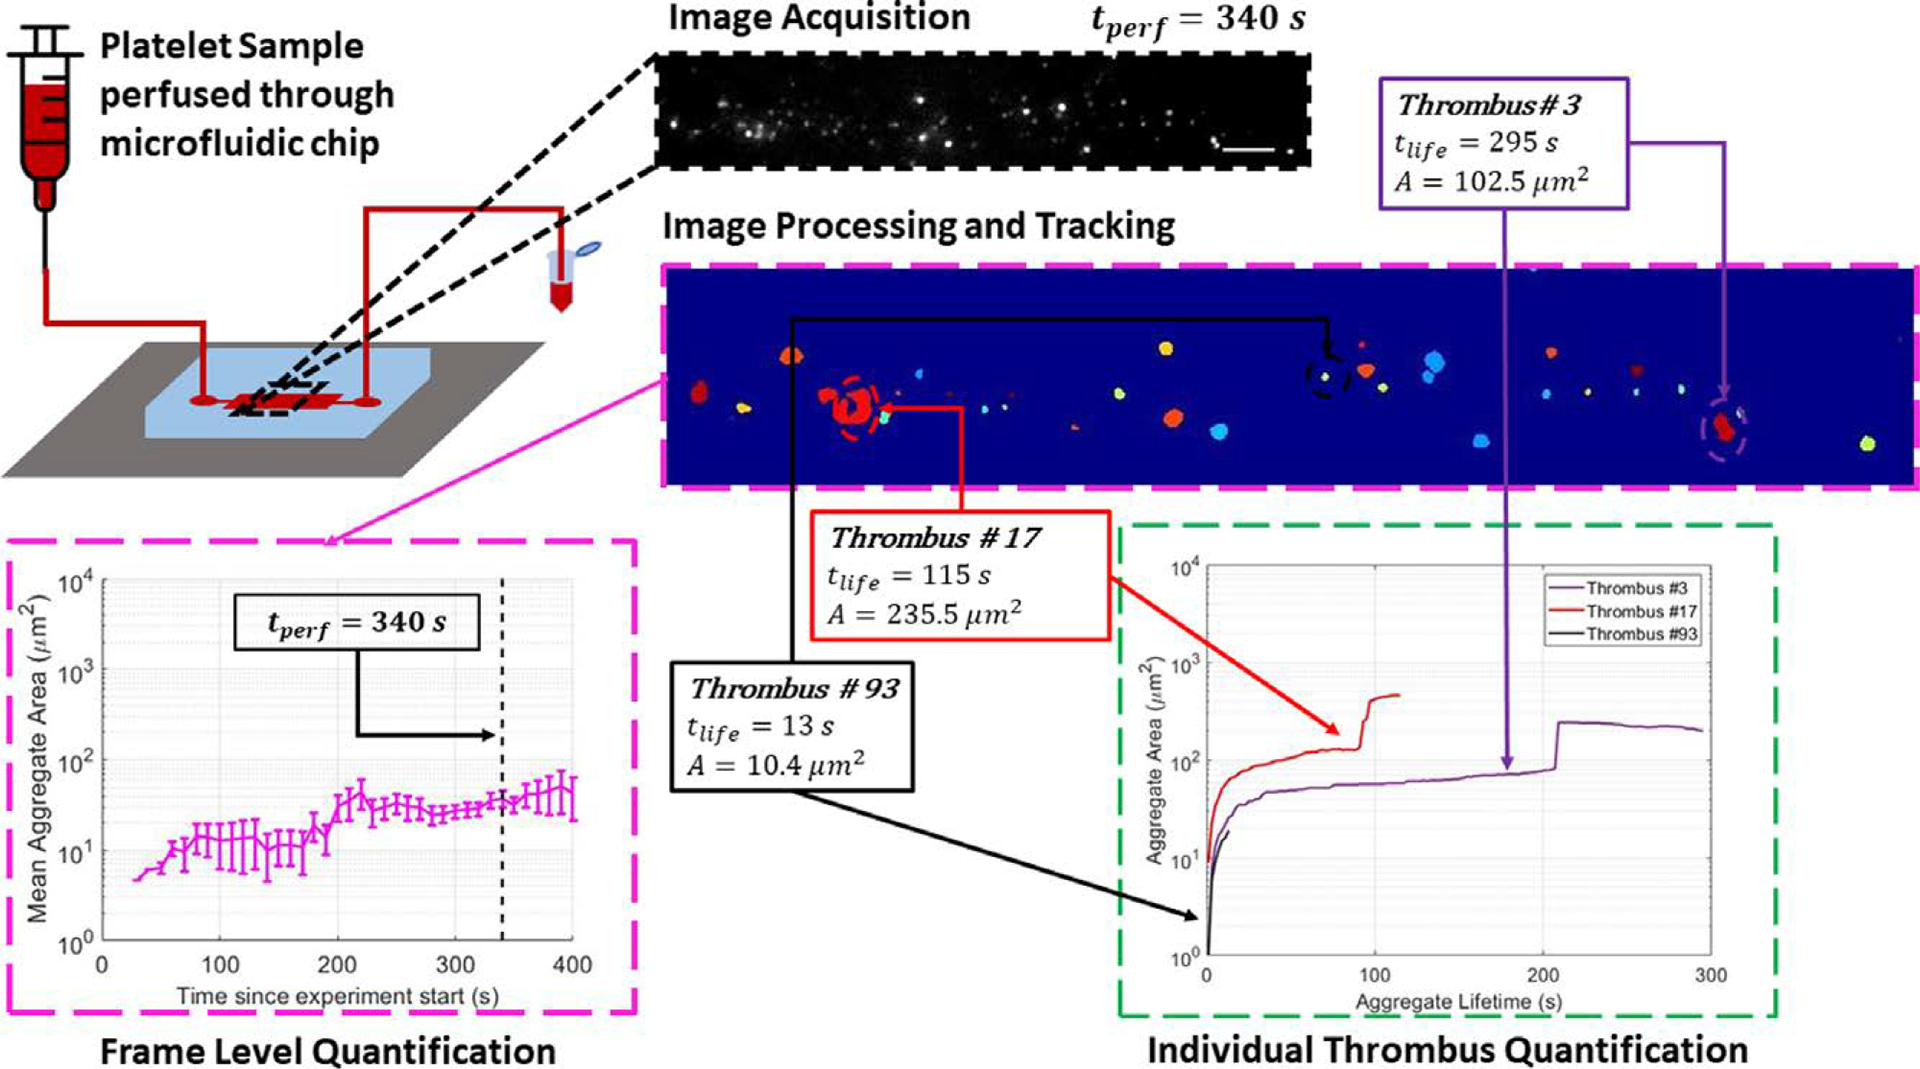
Outline of the experimental procedure and image-processing pipeline. A platelet sample incubated with mepacrine is perfused through a microfluidic chip. Time-lapse fluorescence images are acquired and processed using a variety of frequency, contrast, and non-uniform illumination correction filters. After the image processing pipeline, each distinct object is assigned an index value (shown with color for visualization). All thrombus properties are then evaluated at both the frame level (pink border inset) and at chronologically deconvolved thrombus level (green border inset). All scale bars = 100 μm.
The foundation for entity tracking builds on this procedure by revisiting the binarized image and mapping these indices across consecutive frames by considering minimal centroid distances and chronologically connected objects. These two ideas allow the classification of thrombotic events into five distinct events: entity growth/reduction, nucleation, aggregation, fragmentation, and detachment. Taking the very first image containing foreground objects, the immediate frame is concatenated onto the first, resulting in an n × m × 2 matrix of 1 s and 0 s, where 1 s indicate a foreground object. Next, 3-dimensional centroids are computed from this matrix, and thrombotic events can be categorized based on the information of the 3rd centroid position (Figure 2). A value of exactly 1 indicates total detachment, a value of exactly 2 indicates nucleation, and any value between 1 and 2 can be classified into growth/reduction, aggregation, or fragmentation.
Figure 2.
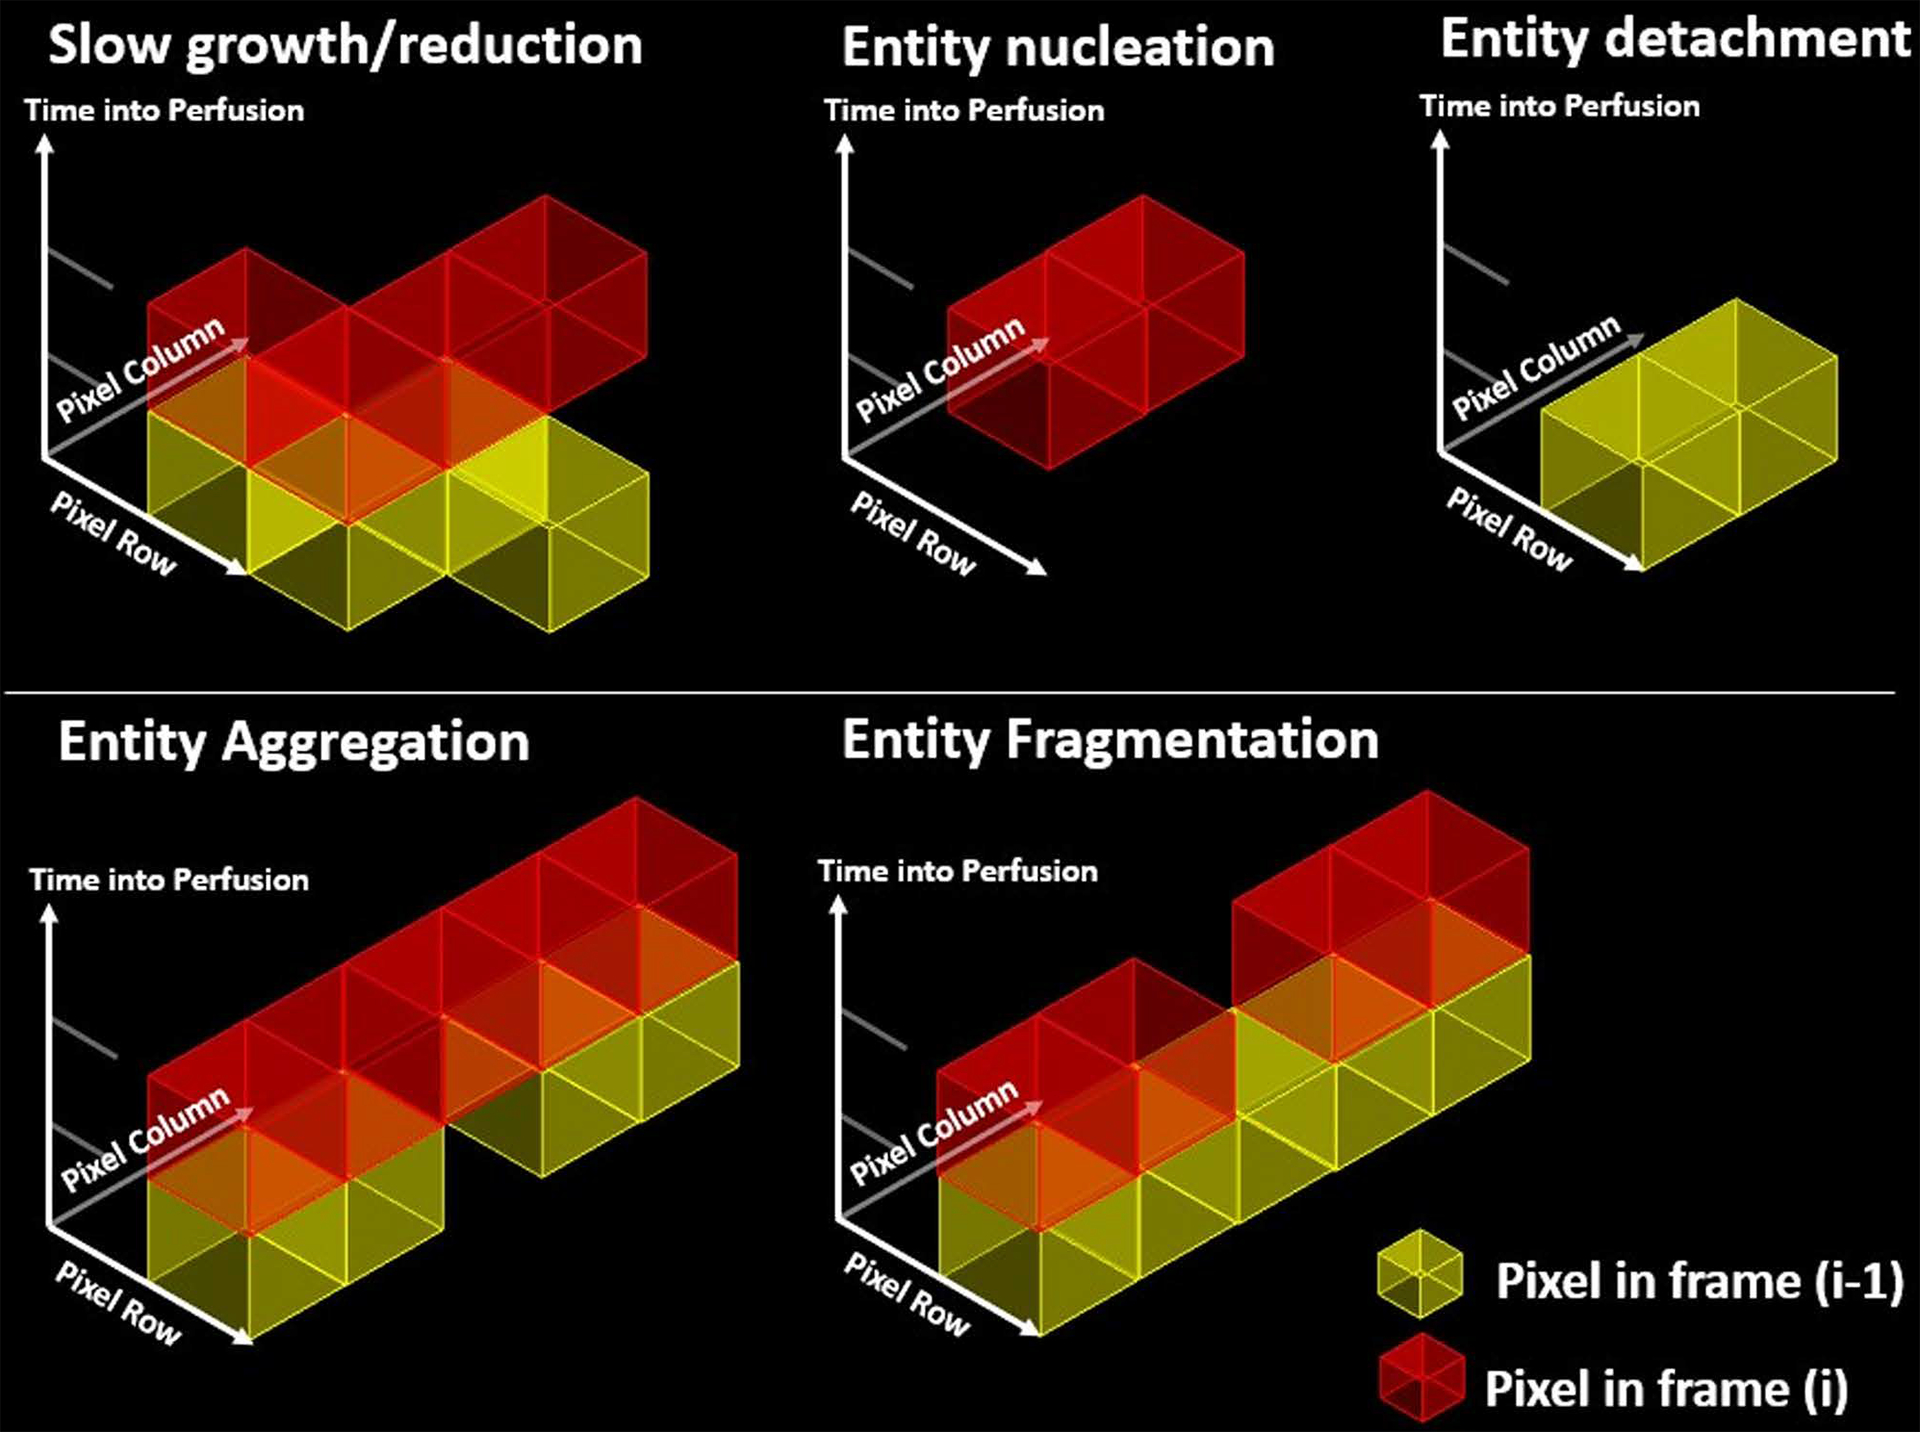
Categorization of five unique aggregate topological events as informed by sequential image 3D connectivity. Slow growth or reduction is defined as an object fully connected (with 26-connectivity) to another in frame (i). The 3-centroid positions for this group must lie between 1 and 2. In addition, the entities isolated in their respect frames must exhibit 8-connectivity along the image plane. For entity nucleation, an object is identified strictly in the (i) plane and implies an exact 3-centroid position of 2. Similarly, for entity detachment, an object is identified strictly in the (i-1) plane and implies an exact centroid position of 1. Entity aggregation and fragmentation are classified as slow growth and decay events, with the added condition that the entities are not fully connected in their isolated (i-1) and (i) frames, respectively.
Chronologically, the subset of detached entities in the first frame is recorded and removed from consideration. The distances between aggregate in the first frame and the following frame are computed. The indices of the aggregates with minimal distances are mapped together and recorded. However, this results in repeated index mappings due to fragmentation and aggregation events. For example, upon aggregation, two distinct indices in the first frame join together and become mapped to the same index in the following frame. Similarly, upon fragmentation, one distinct index in the first frame separates into two, causing a mapping from one index in the first frame to two indices in the following frame. To distinguish these two events from growth/reduction, the aggregation events are determined by scanning for and recording repeat indices in the first frame. Next, the set of added indices is recorded and removed from consideration. Afterward, any remaining indices in the following frame are assumed to be a fragment of a larger entity in the first frame. For each of these fragments, the set of all pixel coordinates is obtained, and the originating index from the first frame is located by determining the index value at the same coordinate.
All the above mappings are recorded, and the algorithm repeats using frames (i-1) and i until all frames have been processed.
Results
Improvements to Quantification of Aggregate Growth by Use of Aggregate Tracking
All experiments were quantified by use of area-averaged and aggregate-resolved metrics to highlight and compare the different thrombosis features made evident. Figure 3 shows how these two experiments can be quantified through surface coverage fraction, area-averaged aggregate surface area, and aggregate counts. Figure 3A shows the surface coverage fractions of platelets adhering onto collagen-coated (black, circle) and roughened Ti6Al4V (red, triangle) substrates at local shear rates of 4000 s−1. Comparing the two, we can infer differences in endpoint magnitude of platelet deposition and lag times for deposition enhancement. Platelet deposition on collagen shows an initial lag time lasting around 350 seconds followed by a steady, rapid increase. In contrast, deposition on roughened titanium alloys shows a shorter lag time of around 160 seconds followed by gradual and erratic deposition patterns. After 15 minutes, the coverage fractions for collagen and roughened titanium reach .361 and .245, respectively. Figure 3B shows the area-averaged aggregate area and the number of deposited aggregates at a given moment in the perfusion. In collagen, aggregate areas remain static between 28.2 and 58.0 μm2 in the first 360 seconds of perfusion and then monotonically grow to a mean value of 2155.8 μm2. In titanium, thrombi appear abruptly as large aggregates around 250 μm2 300 seconds into the perfusion and continue to grow. After 790 seconds, large discontinuities are observed and reach an endpoint mean area of 4119.7 μm2. Aggregate counts on collagen reach a peak value of 77.3 aggregates at 600 seconds and decrease to an endpoint value of 33.3 aggregates, whereas on titanium, aggregate counts on roughened titanium remain low and fluctuate between 7 and 27 aggregates. From these area-averaged or surface-based metrics, both systems pose thrombotic risks when assessed by these area-averaged metrics. The results on collagen suggest steady growth of existing aggregates with simultaneous nucleation of new ones, whereas the results on roughened titanium suggest sudden aggregate formation that is allowed to grow to large mural sizes. However, the details of individual thrombus formation locally around the nucleation site remain unknown.
Figure 3.
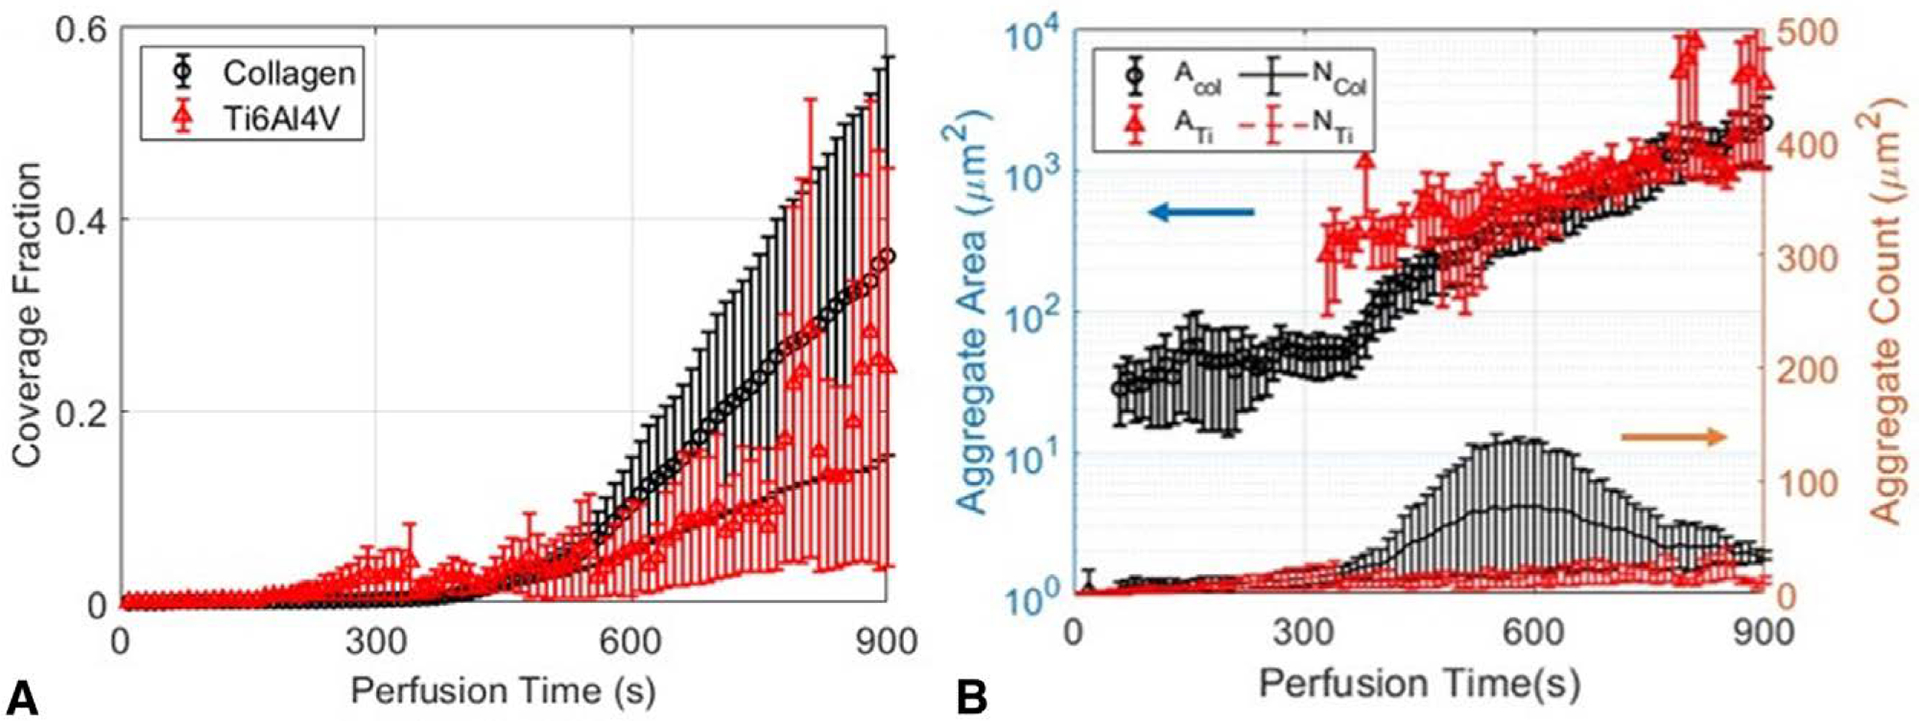
Thrombosis quantification at the frame level on collagen-coated substrates (black) and roughened Ti6Al4V (red) fail to detect subtle differences between thrombosis behaviors. (A) Surface coverage fraction of aggregates on engineered surfaces. (B) Area-averaged aggregate surface area and number of aggregates. Since images convolve particles of multiple different ages, comparisons are muddled.
Figure 4 reports ensemble averaged aggregate areas and counts based on each aggregate’s individual growth history for the same set of experiments. Here, tracking each aggregate individually and ensemble-averaging their properties shifts the view towards aggregate microstates rather than the surface macrostate. Deconvolving aggregate growth from aggregate nucleation in this manner unveils additional thrombotic behaviors that were hidden in Figure 3. On collagen, we observe numerous small bundles of platelets deposit onto the surface that grow immediately, and monotonically for 510 seconds up to a mean value of 1604.9 μm2. This immediate accumulation of platelets around nucleation sites is not observable in Figure 3B and indicates an absence of a lag phase for growth as an ensemble. Furthermore, we report unique aggregate counts greatly exceeding 100 on collagen and suggest that area-averaged metrics largely underestimate the number of aggregates that have formed. Whereas a bulk measurement conflates late-forming aggregates with old aggregates in Figure 3B, the ensemble average of the individually tracked aggregates resolves this and captures the correct, larger growth rate at early stages of thrombus growth.
Figure 4.
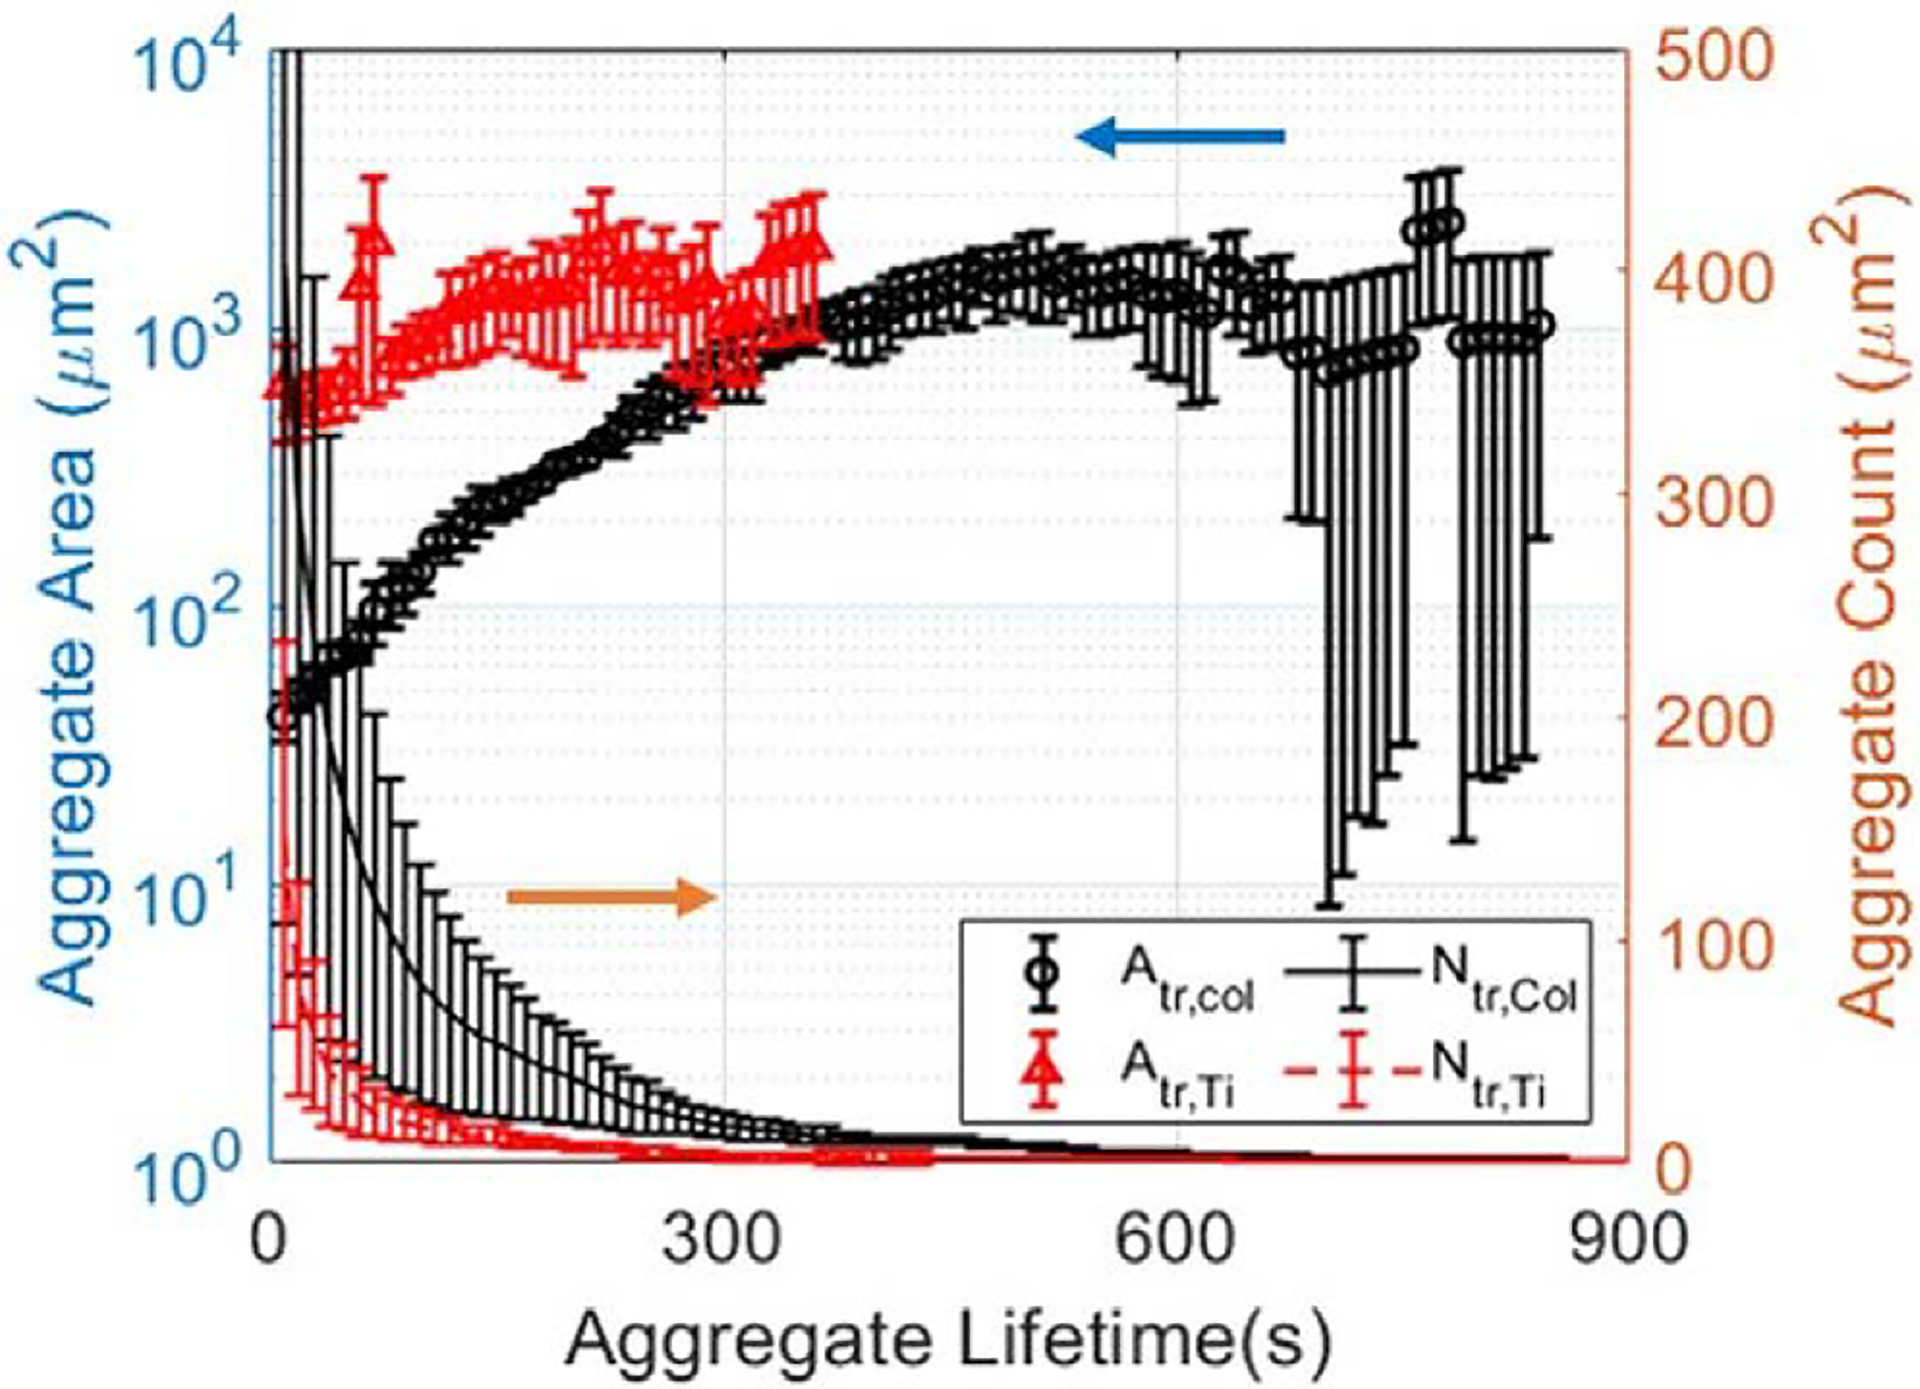
Aggregate tracking evinces subtle differences in aggregate evolution. Here, the x-axis represents the time since nucleation, that is, the lifetime of the aggregate. Ensemble-averaged 2D aggregate surface areas and deconvolved number of aggregates on collagen (black) and on roughened Ti6Al4V (red). Individually tracked, ensemble-averaged measurements show that while platelets and small thrombi nucleate the surface and grow steadily and stably on collagen, in contrast, thrombi attach with larger areas, aggregate rapidly and then are swept away from view due to high shear and weak adhesion onto the Ti6Al4V surface.
In contrast, on roughened titanium surfaces, ensemble averages reveal erratic and unstable thrombus growth that deviates significantly from the behavior shown by area-averaged measurements. First, platelets and small thrombi cannot sustain their growth and are immediately swept out of view, as gleaned from short-lived mean aggregate areas and drastically lower aggregate counts. Second, the dominance of large thrombus deposition onto the surface is enhanced; area-averaged metrics report a mean aggregate area of 248 μm2 upon aggregate detection, whereas ensemble-averaged metrics report an area 618.6 μm2 10 seconds after deposition. When comparing the ensemble-averaged measurements across both experiments, the resolved capture of thromboembolic and merging events leads to an unambiguously clear difference in the aggregate growth patterns.
Quantitation and Comparison of 2D Aggregate Elongation
We present additional quantitative metrics that can be used to further distinguish the dynamics of thrombus formation across different systems. Figure 5A shows the ensemble-averaged squared eccentricities, , where a and b are estimated semimajor and semiminor axes lengths of an aggregate, respectively. On collagen, thrombus formation begins with the nucleation of single or small, round aggregates. These platelets act as local activation and aggregation sites, recruiting more platelets at the downstream site. Simultaneously, more platelets continue to nucleate the surface and create more sites for thrombus formation (Figure 5B). After 3 minutes of growth, thrombi fluctuate around an e2 value of around 0.8 until growth extends path the imaging field of view or adjacent thrombi combines due to surface saturation.
Figure 5.
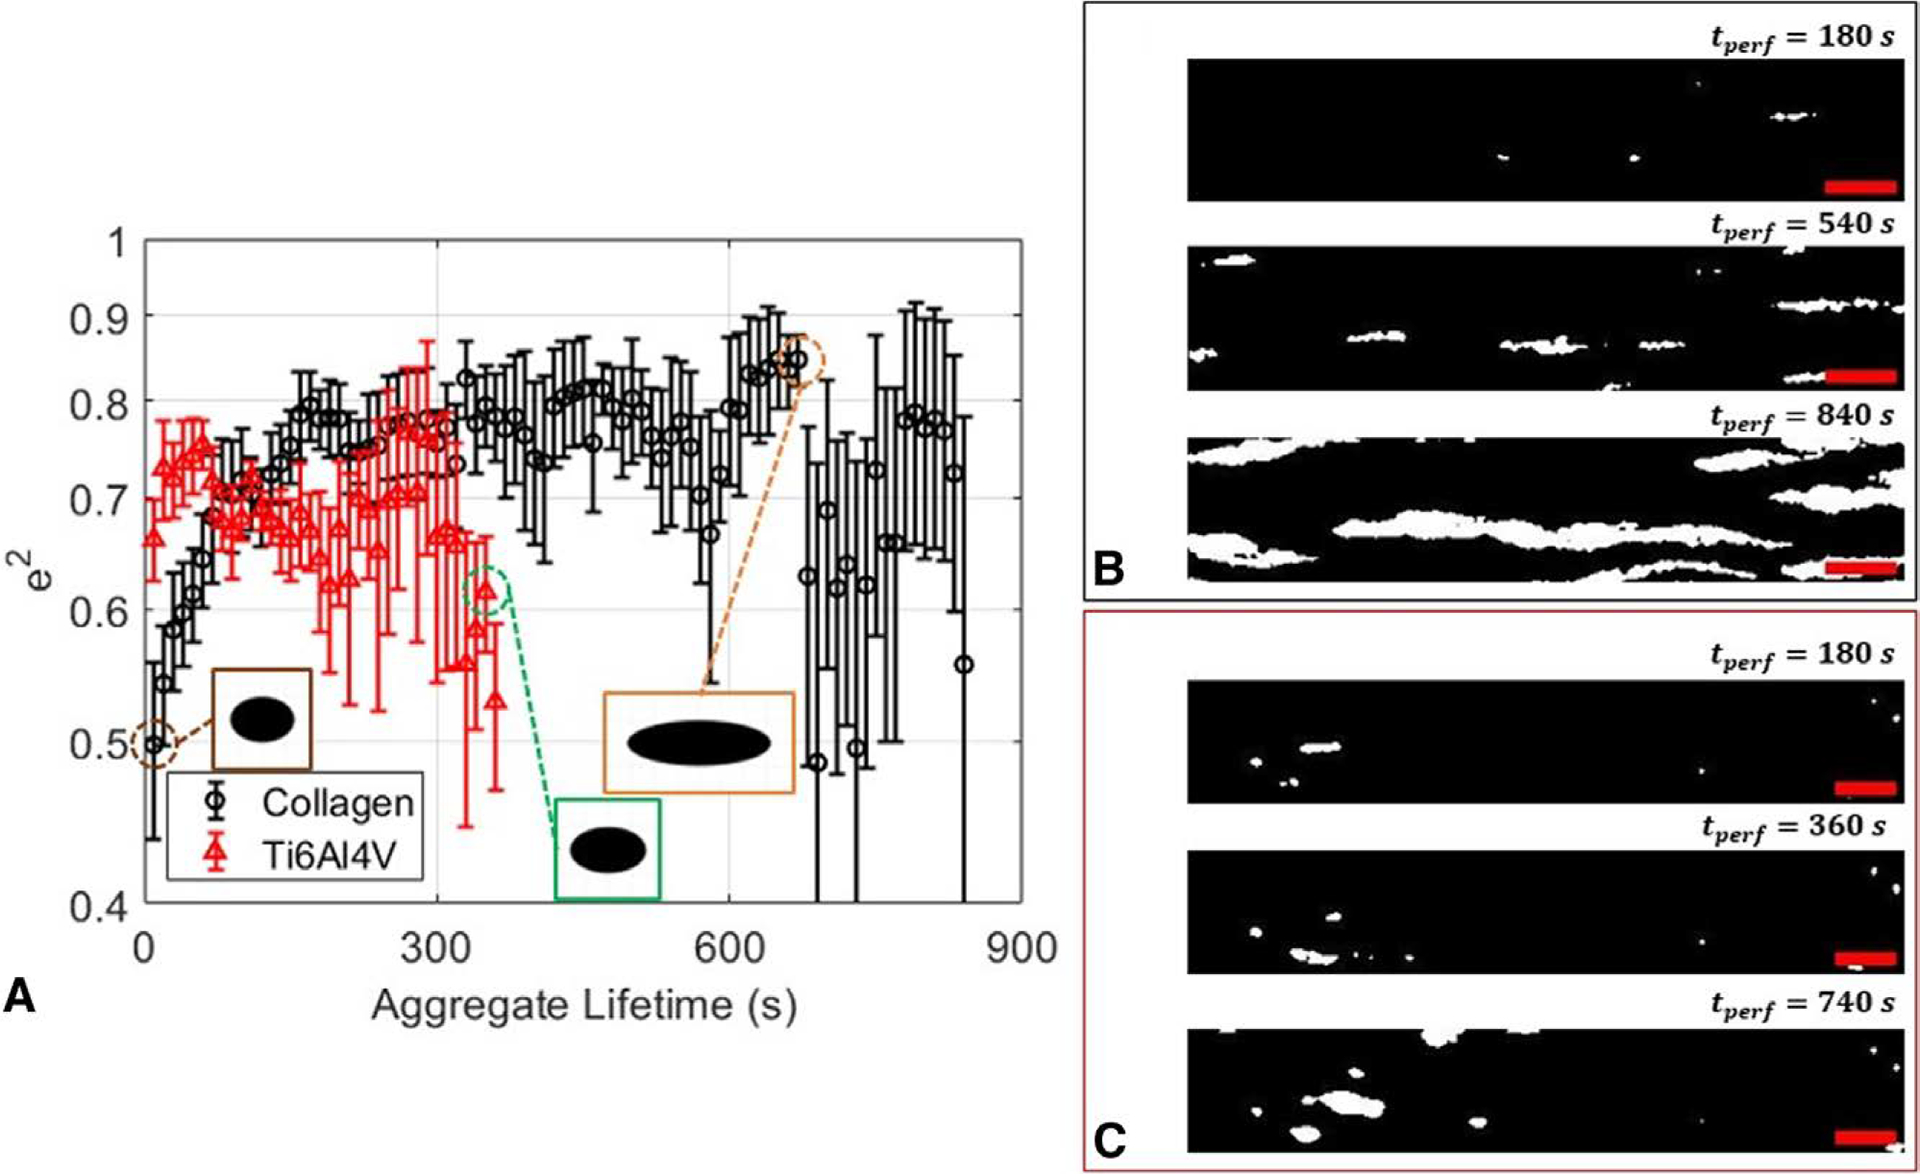
Aggregate tracking reveals stable, elongational platelet accumulation behavior that is present only on collagen-coated surfaces at high shear. (A) Squared eccentricity plots of thrombi on collagen (black) and roughened titanium (red). (B) Binarized images exhibiting sustained, elongated growth of thrombi at 180, 540, and 840 seconds into perfusion on a collagen-coated microfluidic surface. (C) Binarized images showing absence of highly elongated growth onto a roughened titanium alloy. The flow is from left to right. Scale bar = 100 μm for all images. Individually tracked measurements show stable aggregate elongation towards the direction of flow on collagen-coated surfaces that is absent on roughened Ti6Al4V.
In contrast to sustained elongational growth observed on collagen, we observe no elongational trends on titanium. Consistent with short-lived area growth as shown in Figure 4, the initial absence of an adhesive protein coating inhibits sustained platelet contact with the surface, severely reducing the time frame for any elongation. These intermittent contacts with the surface result in thrombi growth through a tumbling or rolling motion. Once these small thrombi reach the imaging site, the ensemble-averaged squared eccentricities can fluctuate in two ways. In one case, small thrombi that were able to stably adhere on coarsely roughened grooves can merge with a larger aggregate swept into view. When an upstream embolus merges with an existing thrombus in the imaging region, the eccentricity changes unpredictably. In the second case, the large, irregularly formed embolus can redeposit onto a vacancy at the imaging site. These events lead to an absence of sustained elongated growth on roughened titanium, which is present on collagen before surface saturation. These results demonstrate the differentiation of additional thrombus growth patterns that are dependent on surface conditions through tracking implementation.
Peripheral and Height-wise Platelet Accumulation Behavior
Finally, we present ensemble-averaged fluorescence intensity variations and use these metrics to gain additional information on peripheral and volumetric growth. Figures 6A,B report ensemble-averaged mean and max fluorescence intensities normalized to the maximum intensity range detected for each set of surface conditions. On collagen, the mean fluorescence intensity of thrombi increases from 0 to 0.1 over 500 seconds of growth. As thrombi grow, increases in the peripheral area add more regions for platelet accumulation. As this area continues to increase, the increasing fraction of dimly lit platelets comprising the thrombus acts to attenuate or reduce mean intensities. In conjunction, maximum fluorescence intensity informs the development of peak thrombus height. From Figure 6B, the maximum fluorescence intensity continues to increase, indicating platelet accumulation along its height. Paired with steady mean intensity growth, this implies a uniform accumulation of platelets. As more platelets are recruited to the site, the aggregate spans a larger surface area, and the initial site of platelet nucleation continues to grow in height (Supplementary Figure 3). In contrast, both the mean and maximum intensities of thrombi on roughened titanium exhibit short, abrupt increases within 150 seconds of aggregate growth. Since thrombus formation is dominated by the merging of large, bright emboli merging with small, dim thrombi, both the ensemble-averaged mean and maximum fluorescence intensities grow at faster rates compared to growth on collagen.
Figure 6.
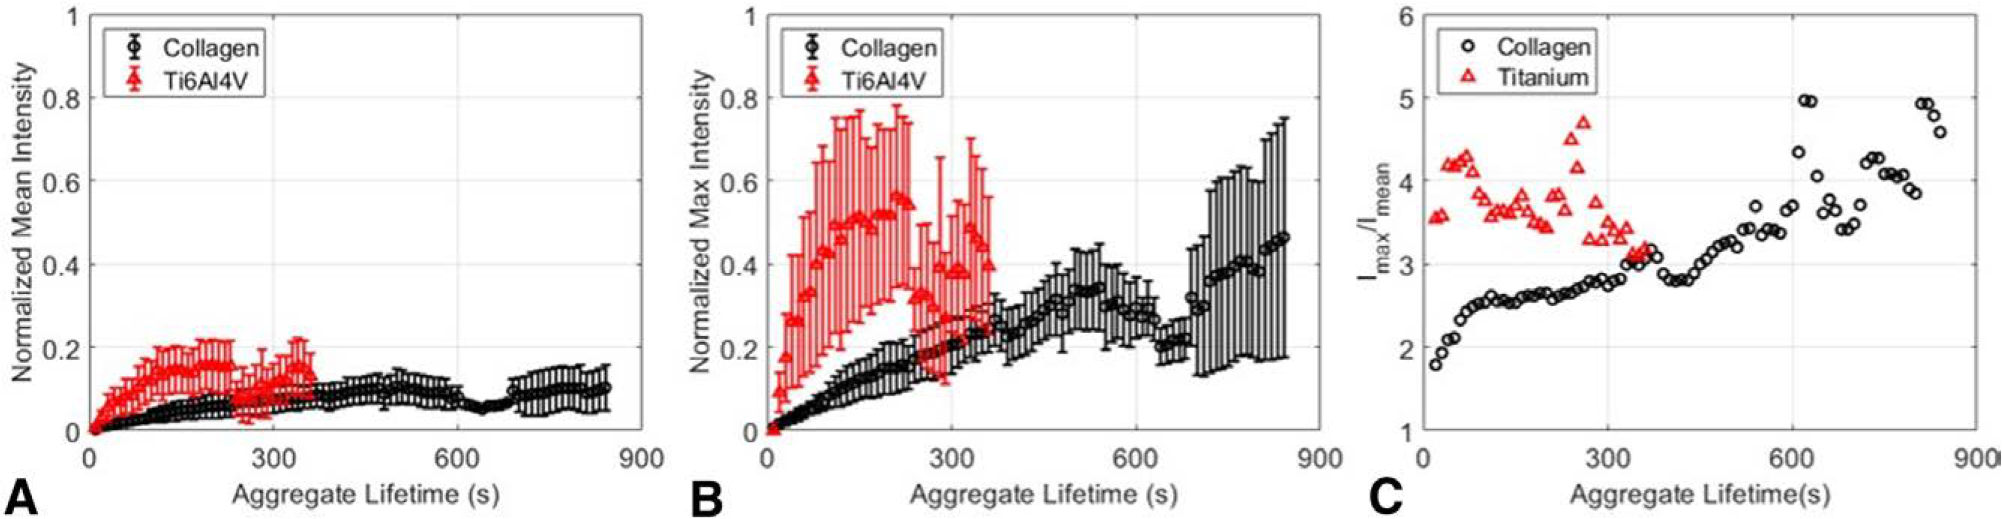
Tracking fluorescence distribution in individual aggregates clarifies different time constants for aggregate peripheral and height growth. (A) Tracked normalized mean and (B) normalized max fluorescence intensities of aggregates for platelets aggregating on collagen (black, circle) and on roughened Ti6Al4V (red, triangle). Intensities are normalized to the maximum intensity range across N = 3 trials for each experimental condition (C) Normalized maximum-to-mean intensity ratio for collagen (black) and roughened Ti6Al4V (red). Joint evaluation of intrathrombus fluorescence distributions and growth illustrate patterns and biases of mural and heightwise thrombus growth.
These observations are summarized in Figure 6C which presents the max/mean intensity ratios Imax/Imean between the two surfaces. A value of one is equivalent to a uniform thrombus height, and higher ratio values indicate a dominated accumulation of platelets along the thrombus’s height. From these comparisons, it is evident that platelets initially accumulate uniformly around thrombi given their small peripheral area. On collagen, as thrombi continue to grow, peripheral accumulation of platelets increasingly conflates platelet accumulation along their height, leading to a stagnation of mean intensity and continued maximum intensity growth. On titanium, the merging of bright thrombi is captured by the immediately large intensity ratio. These results show that tracking implementation leads to the differentiation of platelet accumulation patterns on collagen and titanium.
Discussion
In this work, we quantify thrombosis on collagen and roughened titanium at high shear and comment on the value of complementing area-averaged metrics, the standard quantification in the field, with ensemble-averaged metrics. Our approach obviates additional microscopic techniques and equipment such as confocal microscopy or computational models to supplement studies on aggregate growth. By defining the five discrete events as prescribed in Figure 2, we can recall the properties of each thrombus that have developed on the surface of interest, which can then be monitored individually or in ensemble average.
First, we report the capabilities of the area-averaged metrics when comparing high shear thrombosis between a conventional collagen-coated platform and roughened titanium alloys used commonly in heart pumps, such as the HeartMate II or Heartware heartware ventricular assist device (HVAD).30,35 In the former case, high shear, VWF-induced platelet activation becomes an added driver to other shear-independent activation and aggregation mechanisms on collagen, such as GPVI engagement.36 In the latter case, the thrombogenic platform develops through surface biofouling,37 after which thrombus formation can occur. While titanium is generally perceived to be an antithrombogenic material, the effects of sub-micron surface features on protein and/or platelet deposition at high shear remain unclear.17,37 When using area-averaged metrics to assess the roughened titanium’s thrombogenicity relative to collagen, a well-understood platform, we are led to believe that these systems follow similar trends after an initial lag phase.24 The surface coverage fractions and mean aggregate areas for both systems grow at similarly large rates which would rapidly lead to channel occlusion. If the investigation were to end there, one would conclude that these two systems pose thrombotic risks and sub-micron level surface roughening should be avoided. However, upon closer examination of each system’s perfusion history, we can glean subtle differences in thrombosis initiation and stability. Only thrombosis on collagen exhibits monotonically increasing surface coverage and area-averaged aggregate area, and thrombosis on roughened titanium shows an extremely gradual increase in the number of aggregates on the surface. The sources for these differences can only be pinpointed if the development history of each aggregate was tracked and ensemble-averaged. Area-averaged metrics, standard in use in the field, are able to assess overall system thrombogenicity but cannot distinguish the dynamics of thrombosis initiation and propagation.
In contrast, when we implement tracking, we reveal hidden dynamic thrombotic events by deconvolving thrombus evolution from the chronology of image capture. We draw information such as the likelihood of embolization, the tracked growth trend of an aggregate, or even the area or time point at which an aggregate embolized or fragmented. When taking the ensemble-averaged mean aggregate area, we correctly describe the growth rate and eliminate early stage underprediction of the growth rate caused by early nucleating small aggregates. In the presence of many embolization events, we observe that lifetime-tracked mean aggregate area captures both redeposition and re-embolization of large upstream emboli. This is reflected by the significantly larger aggregate areas upon appearance as well as the shortened aggregate lifetime curves on titanium compared to collagen Understanding these different distributions and growth trends can have important implications for stochastic computational modeling of thrombus growth in implanted devices or for elucidating the wide variability of reports in system-based measurements. In addition, in recent years, there have been major concerns about the safety of heart pump implementation due to the high frequency of device exchanges and pump thrombosis events reported annually, many of the reports attributing these events to surface roughness features or material thrombogenicity.30,38 However, as we have shown in this pair of experiments, the growth of aggregates on our aggregates was largely a result of a few large upstream emboli that grew over a short period and embolized downstream due to hydrodynamic shear, an event that would be easily missed if reported at the frame level.
Furthermore, at high shear rate conditions, long VWF chains have been shown to elongate and expose binding sites that can adhere and activate to platelets. To our knowledge, many studies have shown similar elongational behavior, but none have quantified this in a way that can be related to VWF action. Tovar-Lopez et al.39 demonstrated preferential thrombus formation in the widening portion of a stenosed microchannel. In particular, the growing thrombus continued to elongate further down the widening region of the channel. Herbig and Diamond also presented clear, fluorescence visualizations of VWF elongation around a post embedded in a microfluidic channel, followed by facilitated platelet aggregation and activation around the fiber.40 O’Brien’s group also reported similar elongated aggregation features in a microfluidic device at high shear but only reported surface coverage fractions.41
In contrast, this VWF-induced thrombotic pathway is absent due to the lack of a collagen foundation onto which VWF can tether. Our observed erratic thrombus elongation patterns are in line with other microfluidic observations. In addition, reporting eccentricity has the potential to further distinguish thrombotic conditions that are not limited to VWF activity. Herfs et al.26 presented images of largely erratic, uncharacteristic thrombus formation at 3 and 7 minutes of perfusion at a local shear rate of 1000 s−1 on collagen-coated spots at various temperatures. Houck et al.42 quantified the effect of Janus tyrosine kinase 2 inhibitors on collagen-induced platelet aggregation and showed that increasing concentrations of Janus kinase 2 (JAK2) inhibitors increased aggregate elongation in a dose-dependent manner. DeCortin et al.31 showed oblate thrombi forming on a collagen and tissue factor-coated surface which was largely unperturbed despite the addition of multiple platelet activation pathway inhibitors. We believe that in many of these studies, eccentricity measurements could serve as a useful tool in better classifying thrombus formation patterns that relate to the underlying aggregation or activation inhibition mechanisms present in the system.
Finally, analysis of intra-thrombus fluorescence growth provides information on thrombus volumetric states during surface attachment and temporary growth. On collagen, the gradual increase of maximum fluorescence intensity indicates a steady accumulation of platelets along its height, which can then be used to infer successful platelet activation followed by platelet recruitment via GPIIb/IIIa engagement.43 Simultaneously, the accumulation of dimly fluorescent platelet continues around the perimeter of growing thrombi. When considering both mean and maximum intensity growth together, platelet accumulation occurs uniformly around platelets. This is reflected by the initially low max-to-mean intensity ratio as depicted in Figure 6C. As thrombi continue to grow, the maximum intensity continues to grow unrestricted by the number of pixels constituting the thrombi, whereas mean intensity begins to stagnate and decrease due to pixel count sensitivity and an increasing aggregate area growth rate. Therefore, the intensity ratio begins to increase. In contrast, thrombi depend on soluble protein deposition such as fibrinogen to create a thrombogenic surface coating, and these proteins may not be firmly adherent to the artificial surface.44,45 As a result, thrombi grow in volume through constant tumbling motions across the artificial surface, conglomerating as a bulky mass of platelets and adhesive proteins. This is captured by the intensity ratio, which starts out large and fluctuates wildly due to the prevalence of large upstream emboli depositing and re-embolizing into and out of view.
To achieve volumetric resolution, other experimental groups have modified fluorescence labeling techniques to quantify thrombus height distributions. Claesson et al.46 developed a 5% platelet fraction labeling and image tracking technique to estimate the three thrombi volumes forming on top of a collagen patch under physiological shear rates. Z-stack time-lapse images were obtained, and heightwise determination of a thrombus was determined by counting the number of detected single platelets at and approximating the remaining thrombus volume comprised of nonlabeled platelets.46 This method was extended into the following study to quantify platelet contractile movements by tracing individual platelet translocation within a thrombus.47 While these studies compared the spatial resolutions determined by the platelet counting method to fluorescence intensity determination or confocal microscopy techniques, their high spatiotemporal resolutions may be feasible only at low flow velocities. Although our method does not achieve equivalently high volumetric resolution and accuracy, it prevails through its high temporal resolution that is independent of flow velocities and its ability to quantify hundreds of aggregates per experiment.
Conclusion
In summary, we have demonstrated an image-tracking algorithm to analyze thrombosis on collagen-coated glass and roughened titanium substrates. We have dynamically captured thromboembolic events that were impossible to decipher when growth information was convolved with the chronological imaging sequence. We showed squared eccentricity as an additional metric that can be used to classify the different thrombotic conditions and to inform the actions of various thrombogenic proteins. Finally, we demonstrated how ensemble-averaged fluorescence intensity distributions can be utilized to interpret biases in mural or height-wise aggregate growth. We believe that the underlying principles of our methodology should be used to better classify different thrombotic systems and patterns that are not confined to analyses of the surface macrostate.
Supplementary Material
Acknowledgments
This work was supported by the National Institute of Health under Grant number R01HL089456-10.
This work was performed in part at the Cornell NanoScale Facility, an NNCI member supported by NSF Grant NNCI-2025233.
Footnotes
Disclosure: The authors have no conflicts of interest to report.
Supplemental digital content is available for this article. Direct URL citations appear in the printed text, and links to the digital files are provided in the HTML and PDF versions of this article on the journal’s Web site (www.asaiojournal.com).
References
- 1.Virani SS, Alonso A, Benjamin EJ, et al. : Heart disease and stroke statistics—2020 update: A report from the American Heart Association. Circulation 141: e333–e353, 2020. [DOI] [PubMed] [Google Scholar]
- 2.Kirklin JK, Naftel DC, Kormos RL, et al. : Interagency Registry for Mechanically Assisted Circulatory Support (INTERMACS) analysis of pump thrombosis in the HeartMate II left ventricular assist device. J Hear Lung Transplant 33: 12–22, 2014. [DOI] [PubMed] [Google Scholar]
- 3.Doyle AJ, Hunt BJ, Sanderson B, et al. : A Comparison of thrombosis and hemorrhage rates in patients with severe respiratory failure due to coronavirus disease 2019 and influenza requiring extracorporeal membrane oxygenation. Crit Care Med 49: e663–e672, 2021. [DOI] [PubMed] [Google Scholar]
- 4.Barbaro RP, MacLaren G, Boonstra PS, et al. : Extracorporeal membrane oxygenation support in COVID-19: An international cohort study of the Extracorporeal Life Support Organization registry. Lancet 396: 1071–1078, 2020. [DOI] [PMC free article] [PubMed] [Google Scholar]
- 5.Selgrade BP, Truskey GA: Computational fluid dynamics analysis to determine shear stresses and rates in a centrifugal left ventricular assist device. Artif Organs 36: 89–96 2012. [DOI] [PMC free article] [PubMed] [Google Scholar]
- 6.Pelosi A, Sheriff J, Stevanella M, Fiore GB, Bluestein D, Redaelli A: Computational evaluation of the thrombogenic potential of a hollow-fiber oxygenator with integrated heat exchanger during extracorporeal circulation. Biomech Model Mechanobiol 13: 349–361, 2014. [DOI] [PMC free article] [PubMed] [Google Scholar]
- 7.Fuchs G, Berg N, Broman LM, Prahl Wittberg L: Flow-induced platelet activation in components of the extracorporeal membrane oxygenation circuit. Sci Rep 8: 1–9, 2018. [DOI] [PMC free article] [PubMed] [Google Scholar]
- 8.Nagy M, Heemskerk JWM, Swieringa F: Use of microfluidics to assess the platelet-based control of coagulation. Platelets 28: 441–448, 2017. [DOI] [PubMed] [Google Scholar]
- 9.Sambrano GR, Weiss EJ, Zheng YW, Huang W, Coughlin SR: Role of thrombin signalling in platelets in haemostasis and thrombosis. Nature 6: 74–78, 2001. [DOI] [PubMed] [Google Scholar]
- 10.White-Adams TC, Berny MA, Patel IA, et al. : Laminin promotes coagulation and thrombus formation in a factor XII-dependent manner. J Thromb Haemost 8: 1295–1301, 2010. [DOI] [PMC free article] [PubMed] [Google Scholar]
- 11.Rana A, Westein E, Niego B, Hagemeyer CE: Shear-dependent platelet aggregation: Mechanisms and therapeutic opportunities. Front Cardiovasc Med 6: 141, 2019. [DOI] [PMC free article] [PubMed] [Google Scholar]
- 12.Fu H, Jiang Y, Yang D, Scheiflinger F, Wong WP, Springer TA: Flow-induced elongation of von Willebrand factor precedes tension-dependent activation. Nat Commun 8: 1–12, 2017. [DOI] [PMC free article] [PubMed] [Google Scholar]
- 13.Receveur N, Nechipurenko D, Knapp Y, et al. : Shear rate gradients promote a bi-phasic thrombus formation on weak adhesive proteins, such as fibrinogen in a von Willebrand factor-dependent manner. Haematologica 105: 2471–2483, 2020. [DOI] [PMC free article] [PubMed] [Google Scholar]
- 14.Brash JL, Horbett TA, Latour RA, Tengvall P: The blood compatibility challenge. Part 2: Protein adsorption phenomena governing blood reactivity. Acta Biomater 94: 11–24, 2019. [DOI] [PMC free article] [PubMed] [Google Scholar]
- 15.Weber M, Steinle H, Golombek S, et al. : Blood-contacting bio-materials: In vitro evaluation of the hemocompatibility. Front Bioeng Biotechnol 6: 99, 2018. [DOI] [PMC free article] [PubMed] [Google Scholar]
- 16.Manivasagam VK, Sabino RM, Kantam P, Popat KC: Surface modification strategies to improve titanium hemocompatibility: A comprehensive review. Mater Adv 2: 5824–5842, 2021. [DOI] [PMC free article] [PubMed] [Google Scholar]
- 17.Park JY, Gemmell CH, Davies JE: Platelet interactions with titanium: Modulation of platelet activity by surface topography. Biomaterials 22: 2671–2682, 2001. [DOI] [PubMed] [Google Scholar]
- 18.Rechendorff K, Hovgaard MB, Foss M, Zhdanov VP, Besenbacher F: Enhancement of protein adsorption induced by surface roughness. Langmuir 22: 10885–10888, 2006. [DOI] [PubMed] [Google Scholar]
- 19.Linneweber J, Dohmen PM, Kerzscher U, Affeld K, Nosé Y, Konertz W: The effect of surface roughness on activation of the coagulation system and platelet adhesion in rotary blood pumps. in Artificial Organs. 31: 345–351, 2007. [DOI] [PubMed] [Google Scholar]
- 20.Kirby BJ: Micro- and Nanoscale: Fluid Transport in Microfluidic devices. Cambridge, Cambridge University Press, 2010. [Google Scholar]
- 21.Loncar R, Zotz RB, Sucker C, Vodovnik A, Mihalj M, Scharf RE: Platelet adhesion onto immobilized fibrinogen under arterial and venous in-vitro flow conditions does not significantly differ between men and women. Thromb J 5, 2007. [DOI] [PMC free article] [PubMed] [Google Scholar]
- 22.Li M, Hotaling NA, Ku DN, Forest CR: Microfluidic thrombosis under multiple shear rates and antiplatelet therapy doses. PLoS One 9: e82493, 2014. [DOI] [PMC free article] [PubMed] [Google Scholar]
- 23.Gutierrez E, Petrich BG, Shattil SJ, Ginsberg MH, Groisman A, Kasirer-Friede A: Microfluidic devices for studies of shear-dependent platelet adhesion. Lab Chip 8: 1486–1495, 2008. [DOI] [PMC free article] [PubMed] [Google Scholar]
- 24.Casa LDC, Deaton DH, Ku DN: Role of high shear rate in thrombosis. J Vasc Surg 61: 1068–1080, 2015. [DOI] [PubMed] [Google Scholar]
- 25.Jain A, Graveline A, Waterhouse A, Vernet A, Flaumenhaft R, Ingber DE: A shear gradient-activated microfluidic device for automated monitoring of whole blood haemostasis and platelet function. Nat Commun 7:10176, 2016. [DOI] [PMC free article] [PubMed] [Google Scholar]
- 26.Herfs L, Swieringa F, Jooss N, et al. : Multiparameter microfluidics assay of thrombus formation reveals increased sensitivity to contraction and antiplatelet agents at physiological temperature. Thromb Res 203: 46–56, 2021. [DOI] [PubMed] [Google Scholar]
- 27.Zilberman-Rudenko J, Sylman JL, Lakshmanan HHS, McCarty OJT, Maddala J: Dynamics of blood flow and thrombus formation in a multi-bypass microfluidic ladder network. Cell Mol Bioeng 10: 16–29, 2017. [DOI] [PMC free article] [PubMed] [Google Scholar]
- 28.Tsai M, Kita A, Leach J, et al. : In vitro modeling of the microvascular occlusion and thrombosis that occur in hematologic diseases using microfluidic technology. J Clin Invest 122: 408–418, 2012. [DOI] [PMC free article] [PubMed] [Google Scholar]
- 29.Brouns SLN, van Geffen JP, Campello E, et al. : Platelet-primed interactions of coagulation and anticoagulation pathways in flow-dependent thrombus formation. Sci Rep 10: 11910, 2020. [DOI] [PMC free article] [PubMed] [Google Scholar]
- 30.Jamiolkowski MA, Woolley JR, Kameneva MV, Antaki JF, Wagner WR: Real time visualization and characterization of platelet deposition under flow onto clinically relevant opaque surfaces. J Biomed Mater Res - Part A 103: 1303–1311, 2015. [DOI] [PMC free article] [PubMed] [Google Scholar]
- 31.DeCortin ME, Brass LF, Diamond SL: Core and shell platelets of a thrombus: A new microfluidic assay to study mechanics and biochemistry. Res Pract Thromb Haemost 4: 1158–1166, 2020. [DOI] [PMC free article] [PubMed] [Google Scholar]
- 32.Tsuji S, Sugimoto M, Miyata S, Kuwahara M, Kinoshita S, Yoshioka A: Real-time analysis of mural thrombus formation in various platelet aggregation disorders: Distinct shear-dependent roles of platelet receptors and adhesive proteins under flow. Blood 94: 968–975, 1999. [PubMed] [Google Scholar]
- 33.Emami N, Sedaei Z, Ferdousi R: Computerized cell tracking: Current methods, tools and challenges. Vis Informatics 5: 1–13, 2021. [Google Scholar]
- 34.Shen H, Tauzin LJ, Baiyasi R, et al. : Single particle tracking: From theory to biophysical applications. Chem Rev 117:7331–7376, 2017. [DOI] [PubMed] [Google Scholar]
- 35.Lara DA, Jeewa A, Elias BA, et al. : Titanium plug closure after heartware ventricular assist device explantation in a 15-year-old girl: First U.S. experience. Texas Hear Inst J 44: 66–69, 2017. [DOI] [PMC free article] [PubMed] [Google Scholar]
- 36.Manon-Jensen T, Kjeld NG, Karsdal MA: Collagen-mediated hemostasis. J Thromb Haemost 14: 438–448, 2016. [DOI] [PubMed] [Google Scholar]
- 37.Barberi J, Spriano S: Titanium and protein adsorption: An overview of mechanisms and effects of surface features. Materials (Basel) 24: 1590, 2021. [DOI] [PMC free article] [PubMed] [Google Scholar]
- 38.Blitz A: Pump thrombosis-A riddle wrapped in a mystery inside an enigma. Ann Cardiothorac Surg 3: 450–471, 2014. [DOI] [PMC free article] [PubMed] [Google Scholar]
- 39.Tovar-Lopez FJ, Rosengarten G, Westein E, et al. : A microfluidics device to monitor platelet aggregation dynamics in response to strain rate micro-gradients in flowing blood. Lab Chip 10: 291–302, 2010. [DOI] [PubMed] [Google Scholar]
- 40.Herbig BA, Diamond SL: Pathological von Willebrand factor fibers resist tissue plasminogen activator and ADAMTS13 while promoting the contact pathway and shear-induced platelet activation. J Thromb Haemost 13: 1699–1708, 2015. [DOI] [PMC free article] [PubMed] [Google Scholar]
- 41.O’Brien HER, Zhang XF, Sanz-Hernandez M, et al. : Blocking von Willebrand factor free thiols inhibits binding to collagen under high and pathological shear stress. J Thromb Haemost 19: 358–369, 2021. [DOI] [PubMed] [Google Scholar]
- 42.Houck KL, Yuan H, Tian Y, et al. : Physical proximity and functional cooperation of glycoprotein 130 and glycoprotein VI in platelet membrane lipid rafts. J Thromb Haemost 17: 1500–1510, 2019. [DOI] [PubMed] [Google Scholar]
- 43.Fullard J: The role of the platelet glycoprotein IIb/IIIa in thrombosis and haemostasis. Curr Pharm Des 10: 1567–1576, 2005. [DOI] [PubMed] [Google Scholar]
- 44.Jung SY, Lim SM, Albertorio F, et al. : The vroman effect: A molecular level description of fibrinogen displacement. J Am Chem Soc 22: 12782–12786, 2003. [DOI] [PubMed] [Google Scholar]
- 45.Balasubramanian V, Slack SM: The effect of fluid shear and co-adsorbed proteins on the stability of immobilized fibrinogen and subsequent platelet interactions. J Biomater Sci Polym Ed 13: 543–561, 2002. [DOI] [PubMed] [Google Scholar]
- 46.Claesson K, Lindahl TL, Faxälv L: Counting the platelets: A robust and sensitive quantification method for thrombus formation. Thromb Haemost 115:1178–1190, 2016. [DOI] [PubMed] [Google Scholar]
- 47.Tunströmer K, Faxälv L, Boknäs N, Lindahl TL: Quantification of platelet contractile movements during thrombus formation. Thromb Haemost 118: 1600–1611, 2018. [DOI] [PMC free article] [PubMed] [Google Scholar]
- 48.Schwoch G, Passow H: Preparation and properties of human erythrocyte ghosts. Mol Cell Biochem 2: 197–218, 1973. [DOI] [PubMed] [Google Scholar]
- 49.Huang C, Santana SM, Liu H, Bander NH, Hawkins BG, Kirby BJ: Characterization of a hybrid dielectrophoresis and immunocapture microfluidic system for cancer cell capture. Electrophoresis 34: 2970–2979, 2013. [DOI] [PMC free article] [PubMed] [Google Scholar]
Associated Data
This section collects any data citations, data availability statements, or supplementary materials included in this article.