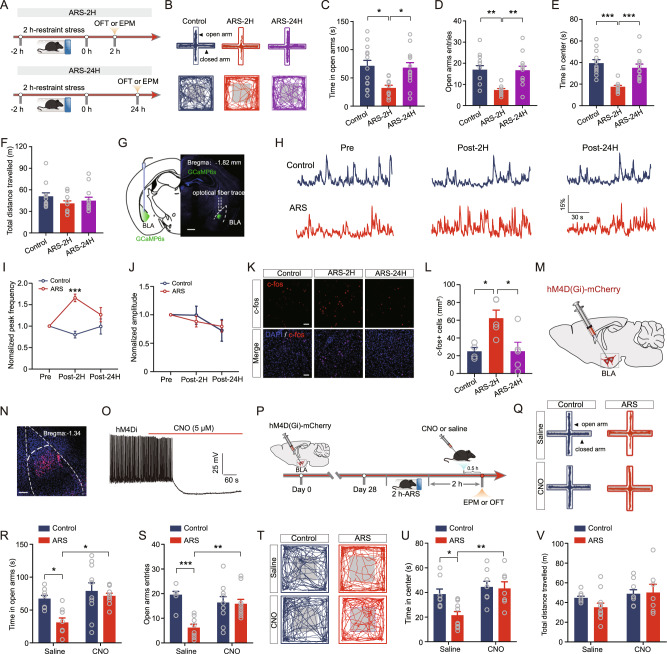
Fig. 1. Acute stress transiently increases the neuronal activity of BLA projection neurons and anxiety-like behavior.
A Experimental procedures. B Representative activity tracking in EPMT (upper) and OFT. Summary plots of time in open arms (C) and open-arm entries (D) during EPMT. Control mice: n = 14 mice; ARS-2H mice, n = 10 mice; ARS-24H mice, n = 13 mice. Time in open arms: one-way ANOVA measures, F(2,34) = 5.332, p = 0.0097. Bonferroni post hoc comparison, ARS-2H vs. control, *p < 0.05; ARS-2H vs. ARS-24H, *p < 0.01. Open-arm entries: one-way ANOVA measures, F(2,34) = 8.214, p = 0.0012. Bonferroni post hoc comparison, ARS-2H vs. control, **p < 0.01; ARS-2H vs. ARS-24H, **p < 0.01. Summary plots of time in center area (E) and total distance traveled (F) during OFT. Control mice: n = 12 mice; ARS-2H mice, n = 11 mice; ARS-24H mice, n = 12 mice. Time in center: one-way ANOVA measures, F(2,32) = 14.31, p < 0.0001. Bonferroni post hoc comparison, ARS-2H vs. control, ***p < 0.001; ARS-2H vs. ARS-24H, ***p < 0.01. Total distance traveled: one-way ANOVA measures, F(2,32) = 1.11, p = 0.3418. G Representative image showing GCaMP6s expression and the cannula implantation onto BLA. Scale bar: 500 μm. H Representative traces of filtered calcium signals in Control (upper) and ARS (lower) mice. I Summary plots of normalized peak frequency as a function of pre, 2 h post, and 24 h post ARS. Data were normalized to pre-ARS periods for all mice. Control mice: n = 6 mice; ARS mice, n = 7 mice. Two-way ANOVA with repeated measures, main effect of stress treatment, F(1,11) = 10.44, p = 0.008; main effect of time, F(2,22) = 3.244, p = 0.058; interaction, F(2,22) = 11.56, p = 0.0004. Bonferroni post hoc comparison, ARS vs. control, ***p < 0.001. J Same as in E except that the data were from normalized peak amplitude. Two-way ANOVA with repeated measures, main effect of stress treatment, F(1,11) = 0.0162, p = 0.901; main effect of time, F(2,22) = 2.971, p = 0.0721; interaction, F(2,22) = 0.405, p = 0.672. K Representative images showing c-fos expression in BLA for control (Control), 2 h post ARS (ARS-2H) and 24 h post ARS (ARS-24H) mice. Scale bar = 100 μm. L Summary plots of c-fos+ cells expression in BLA. Control mice: n = 4 mice; ARS-2H mice, n = 5 mice; ARS-24H mice, n = 5 mice. One-way ANOVA with repeated measures, F(2,11) = 6.244, p = 0.0154. Bonferroni post hoc comparison, ARS-2H vs. control, *p < 0.05; ARS-2H vs. ARS-24H, *p < 0.05. M Diagram showing the injection of hM4D(Gi)-carrying adeno-associated virus (AAV) vectors into the BLA. N Representative image showing hM4D(Gi) expression in BLA. Scale bar = 100 μm. O Representative trace showing CNO-induced inhibition of firing of BLA projection neuron. P Experimental procedures. Q Representative activity tracking during EPMT. Summary plots of time in open arms (R) and open-arm entries (S) during EPMT. Saline: control mice: n = 8 mice; ARS mice, n = 8 mice; CNO: control mice, n = 10 mice; ARS mice, n = 10 mice. Time in open arms: two-way ANOVA with repeated measures, main effect of virus treatment, F(1,32) = 6.743, p = 0.0141; main effect of stress, F(1,32) = 9.551, p = 0.0041; interaction, F(1,32) = 2.95, p = 0.0955, Bonferroni post hoc analysis, Saline: control mice vs. ARS mice, *p < 0.05. Open-arm entries: two-way ANOVA with repeated measures, main effect of virus treatment, F(1,32) = 12.3, p = 0.0014; main effect of stress, F(1,32) = 2.68, p = 0.1114; interaction, F(1,32) = 10.6, p = 0.0027, Bonferroni post hoc analysis, Saline: control mice vs. ARS mice, ***p < 0.001. T Representative activity tracking during OFT. Summary plots of time in center area (U) and total distance traveled (V) during OFT. Saline: control mice: n = 8 mice; ARS mice, n = 11 mice; CNO: control mice, n = 8 mice; ARS mice, n = 7 mice. Time in center: two-way ANOVA with repeated measures, main effect of virus treatment, F(1,30) = 4.513, p = 0.0042; main effect of stress, F(1,30) = 10.18, p = 0.0033; interaction, F(1,30) = 3.37, p = 0.0763, Bonferroni post hoc analysis, Saline: control mice vs. ARS mice, *p < 0.05. Total distance traveled: two-way ANOVA with repeated measures, main effect of virus treatment, F(1,30) = 0.6634, p = 0.4218; main effect of stress, F(1,30) = 3.539, p = 0.0697; interaction, F(1,30) = 1.112, p = 0.3. All data are presented as the mean ± SEM.

