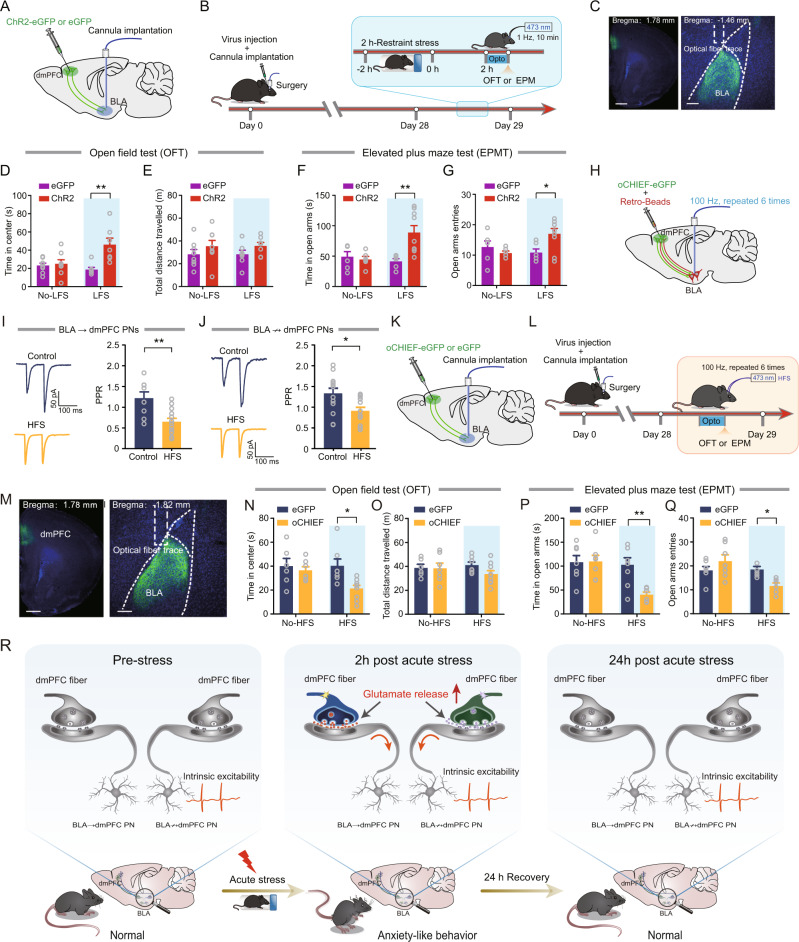
Fig. 5. Optogenetic inhibition or augmentation of prefrontal glutamate release modulates anxiety-like behavior.
A Schematic illustration of injection of ChR2- or eGFP-carrying AAV in dmPFC. B Schematic showing the experimental procedures. C Representative images showing the injection site in dmPFC (left) and optic fibers placement onto BLA (right). Scale bar: 500 (left) and 100 (right) μm. OFT time in center (D) and total distance (E) measured LFS a. No-LFS: eGFP mice: n = 8 mice; ChR2 mice, n = 8 mice; LFS: eGFP mice, n = 7 mice; ChR2 mice, n = 7 mice. Time in center: two-way ANOVA with repeated measures, main effect of LFS treatment, F(1,26) = 10.34, p = 0.0035; main effect of virus, F(1,26) = 3.414, p = 0.076; interaction, F(1,26) = 7.869, p = 0.0094, Bonferroni post hoc analysis, LFS: eGFP mice vs. ChR2 mice, **p < 0.001. Total distance traveled: two-way ANOVA with repeated measures, main effect of LFS treatment, F(1,26) = 3.003, p = 0.0949; main effect of virus, F(1,26) = 0.0006, p = 0.9808; interaction, F(1,26) = 0.0022, p = 0.963. EPM open-arm time (F) and entries (G) measured LFS. No-LFS: eGFP mice: n = 6 mice; ChR2 mice, n = 6 mice; LFS: eGFP mice, n = 6 mice; ChR2 mice, n = 9 mice. Time in open arms: two-way ANOVA with repeated measures, main effect of LFS treatment, F(1,23) = 5.406, p = 0.0292; main effect of virus, F(1,23) = 3.991, p = 0.0577; interaction, F(1,23) = 8.086, p = 0.0092, Bonferroni post hoc analysis, LFS: eGFP mice vs. ChR2 mice, **p < 0.01. Open arms entries: two-way ANOVA with repeated measures, main effect of LFS treatment, F(1,23) = 1.636, p = 0.2137; main effect of virus, F(1,23) = 1.908, p = 0.1805; interaction, F(1,23) = 6.283, p = 0.0197, Bonferroni post hoc analysis, LFS: eGFP mice vs. ChR2 mice, *p < 0.01. H Schematic showing experimental procedures for in vivo high-frequency stimulation (HFS) in control mice that co-injected with oCHIEF-carrying AAV and red Retrobeads. I Representative traces showing EPSCs in BLA → dmPFC PNs (left) and summary plots of PPR in BLA → dmPFC PNs (right). Scale bar: 100 ms, 50 pA. Control mice: n = 8 neurons/3 mice; HFS mice: n = 13 neurons/4 mice. Two-tailed unpaired t-test, control vs. HFS, **p < 0.01. J Representative traces showing EPSCs (left) and Summary plots of PPR in BLA ↛ dmPFC PNs (right). Control mice: n = 13 neurons/4 mice; HFS mice: n = 12 neurons/4 mice. Two-tailed unpaired t-test, control vs. HFS, *p < 0.05. K Schematic illustration of injection of oCHIEF- or eGFP-carrying AAV in dmPFC. L Schematic showing the experimental procedures. M representative images showing the injection site in dmPFC (left) and optic fibers placement onto BLA (right). Scale bar: 500 (left) and 100 (right) μm. OFT time in center (N) and total distance (O) measured HFS. No-HFS: eGFP mice: n = 6 mice; 0-CHIEF mice, n = 7 mice; HFS: eGFP mice, n = 7 mice; oCHIEF mice, n = 9 mice. Time in center: two-way ANOVA with repeated measures, main effect of HFS treatment, F(1,25) = 5.88, p = 0.0229; main effect of virus, F(1,25) = 2.621, p = 0.118; interaction, F(1,25) = 2.761, p = 0.1091, Bonferroni post hoc analysis, HFS: eGFP mice vs. oCHIEF mice, *p < 0.001. Total distance traveled: two-way ANOVA with repeated measures, main effect of HFS treatment, F(1,25) = 1.423, p = 0.2441; main effect of virus, F(1,25) = 0.1473, p = 0.7044; interaction, F(1,25) = 1.163, p = 0.2911. P, Q EPM open-arm time (Q) and entries (R) measured HFS. No-HFS: eGFP mice: n = 7 mice; oCHIEF mice, n = 7 mice; HFS: eGFP mice, n = 9 mice; 0-CHIEF mice, n = 6 mice. Time in open arms: two-way ANOVA with repeated measures, main effect of HFS treatment, F(1,25) = 5.172, p = 0.0318; main effect of virus, F(1,25) = 7.53, p = 0.0111; interaction, F(1,25) = 5.674, p = 0.0251, Bonferroni post hoc analysis, HFS: eGFP mice vs. oCHIEF mice, **p < 0.01. Open arms entries: two-way ANOVA with repeated measures, main effect of HFS treatment, F(1,25) = 0.624, p = 0.437; main effect of virus, F(1,25) = 8.637, p = 0.007; interaction, F(1,25) = 9.016, p = 0.006, Bonferroni post hoc analysis, HFS: eGFP mice vs. oCHIEF mice, *p < 0.01. R A working model for acute stress-induced short-term anxiety-like behavior. All data are presented as the mean ± SEM.

