

Abstract
Background
The budding uninhibited by benzimidazoles (BUB) family is involved in the cell cycle process as mitotic checkpoint components. Abnormal proliferation is a vital process in the development of lung adenocarcinoma (LUAD). Nevertheless, the roles of BUB1 in LUAD remain unclear. In this study, we evaluated the prognostic value and biological functions of BUB1 in LUAD using data from The Cancer Genome Atlas (TCGA), Gene Expression Omnibus (GEO), clinical LUAD samples, and in vitro experiments.
Methods
The expression, prognostic significance, functions, immune infiltration, and methylation of BUB1 in LUAD were comprehensively analyzed using TCGA, GEO, Gene Expression Profiling Interactive Analysis, Metascape, cBioPortal, MethSurv, and cancerSEA databases. Furthermore, we performed a battery of in vitro experiments and immunohistochemistry (IHC) to verify the bioinformatics results.
Results
Multivariate analysis revealed that BUB1 overexpression was an independent prognostic factor (hazard ratio = 1.499, p = 0.013). Functional enrichment analysis showed that BUB1 was correlated with cell cycle, proliferation, DNA repair, DNA damage, and invasion (p < 0.05). Finally, in vitro experiments showed that downregulation of BUB1 inhibited the proliferation, migration, and invasion of LUAD cells and promoted LUAD cell apoptosis. IHC also showed that BUB1 was overexpressed in LUAD (p < 0.001) and was significantly associated with poor prognosis (p < 0.001).
Conclusions
Our bioinformatics and IHC analyses revealed that BUB1 overexpression was an adverse prognostic factor in LUAD. In vitro experiments demonstrated that BUB1 promoted tumor cell proliferation, migration, and invasion in LUAD. These results indicated that BUB1 was a promising biomarker and potential therapeutic target in LUAD.
Keywords: budding uninhibited by benzimidazoles 1, cell cycle, immunohistochemistry, lung adenocarcinoma, methylation
Immunohistochemical validation of BUB1. (A) Comparison of immunohistochemical staining of lung adenocarcinoma and paraneoplastic tissue. (B) Statistical plots quantifying the expression of BUB1 by staining score. (C) Kaplan‐Meier survival analysis demonstrates the relationship between BUB1 expression levels and patient prognosis.

INTRODUCTION
Lung cancer is associated with high incidence and mortality rates. Indeed, the 5‐year survival rate in patients with lung cancer is only 4–17%. 1 Non‐small‐cell lung cancer (NSCLC) accounts for up to 84% of all cases of lung cancer, 2 and adenocarcinoma is the main component of NSCLC. Current strategies for the clinical treatment of lung cancer include not only traditional surgery, radiotherapy, and chemotherapy but also targeted therapy and immunotherapy, which have become more popular in recent years; however, these approaches have certain requirements with regard to mutation targets and immune checkpoints in tumor tissues. 1 , 3 The extremely complex mechanisms of cancer development, individual patient differences, and the development of drug resistance, among other factors, contribute to the poor response to treatment and overall prognosis in patients. 4 , 5 , 6 , 7 , 8 Accordingly, it is necessary to explore new and more reliable lung adenocarcinoma (LUAD) biomarkers to identify patients at high risk of poor prognosis and to initiate more optimal treatments to improve patient survival.
BUB1, a mitotic serine/threonine kinase (also known as BUB1A, BUB1L, and hBUB1), is a protein encoded by the BUB1 gene located on chromosome 2 in humans. Budding uninhibited by benzimidazoles 1 (BUB1) is involved in various functions, such as stabilization of kinetochore‐microtubule attachments and ensuring accurate chromosome segregation. 9 , 10 , 11 , 12 According to pan‐cancer analysis, BUB1 may play important roles in interaction with the The anaphase‐promoting complex/cyclosome (APC/C) activator protein Cdc20, which has carcinogenic and prognostic significance. 13 Moreover, the overexpression of BUB1 proteins is strongly associated with the malignant phenotype and poor prognosis in various malignancies, including bladder cancer, osteosarcoma, leukemia, gastric cancer, liver cancer, breast cancer, and pancreatic ductal adenocarcinoma. 14 , 15 , 16 , 17 , 18 , 19 , 20 The above literature indicates that BUB1 may contribute to the progression of multiple human tumors through a variety of complex mechanisms. However, it is unclear whether BUB1 may have applications as a prognostic molecular marker in LUAD, and the mechanisms of action of BUB1 in LUAD have not yet been elucidated. Therefore, we expect to further investigate the value of BUB1 as a biomarker in LUAD and assess whether it can help improve the diagnosis and predict the prognosis of LUAD. In addition, we also expect to evaluate the blocking effect of BUB1 kinase inhibitors on BUB1 targets to better serve the clinical use of drugs.
In the current study, we evaluated BUB1 expression in LUAD using data from The Cancer Genome Atlas (TCGA) database to evaluate differences in BUB1 expression between LUAD and normal tissues. TCGA and Gene Expression Omnibus (GEO) data were used to explore and validate the prognostic value of BUB1 in LUAD. To further elucidate the biological mechanisms of BUB1, a series of functional enrichment analyses were also performed. Next, we collected tissue samples from postsurgical LUAD patients and validated the differences in BUB1 expression in 36 pairs of carcinomas and paraneoplasms. We also performed immunohistochemical (IHC) experiments in tissue microarrays of LUAD and verified that high BUB1 expression was associated with poor prognosis and staging of LUAD. Finally, we verified the biological function of BUB1 in LUAD through a series of in vitro experiments, which is consistent with the results of our functional enrichment analysis. Our findings provided insights into the critical roles of BUB1 in LUAD and established BUB1 as a potential diagnostic and prognostic biomarker. In addition, we point out the role of BUB1 kinase inhibitors in inhibiting the proliferation and migration of LUAD cells, providing new ideas for the clinical combination of drugs.
MATERIALS AND METHODS
Data acquisition
In total, 497 LUAD samples with associated clinical data, including sex, age, number pack years smoked, T stage, N stage, M stage, vital signs, epidermal growth factor receptor (EGFR) status, anaplastic lymphoma kinase (ALK) status, and BUB1 gene expression data (Table 1), were downloaded from TCGA data portal. Next, RNA‐sequencing data in the fragments per kilobase per million mapped reads format were converted into the standardized transcripts per million mapped reads format using R language software (V.3.6.2). To eliminate technical errors in the sequencing data, we downloaded the GSE13213, GSE50081 and GSE37745 databases from the National Center for Biotechnology Information (NCBI) and compared them with the TCGA dataset. In addition, tissue microarrays containing 96 LUAD samples and 81 adjacent normal tissues (HLugA180Su08) were purchased from Outdo Biotech. The detailed clinical features of the immunohistochemical samples are shown in Supporting Information Table S1.
TABLE 1.
Demographic and clinical characteristics of lung adenocarcinoma patients in The Cancer Genome Atlas
| Clinical characteristic | Total (497) | Percentage (%) | |
|---|---|---|---|
| Sex | |||
| Male | 228 | 45.9 | |
| Female | 269 | 54.1 | |
| Age at diagnosis | |||
| ≤70 years old | 327 | 65.8 | |
| >70 years old | 160 | 32.2 | |
| Number pack years smoked | |||
| <40 | 167 | 33.6 | |
| ≥40 | 174 | 35 | |
| EGFR status | |||
| Mut | 79 | 15.9 | |
| Wt | 190 | 38.2 | |
| ALK status | |||
| Mut | 33 | 6.6 | |
| Wt | 206 | 41.4 | |
| KRAS status | |||
| Mut | 61 | 12.3 | |
| Wt | 244 | 49.1 | |
| T stage | |||
| T1 | 166 | 33.4 | |
| T2 | 267 | 53.7 | |
| T3 | 43 | 8.7 | |
| T4 | 18 | 3.6 | |
| N stage | |||
| N0 | 321 | 64.6 | |
| N1 | 94 | 18.9 | |
| N2 | 69 | 13.9 | |
| N3 | 2 | 0.4 | |
| M stage | |||
| M0 | 331 | 66.6 | |
| M1 | 24 | 4.8 | |
| Pathologic stage | |||
| Stage I | 267 | 53.7 | |
| Stage II | 118 | 23.7 | |
| Stage III | 80 | 16.1 | |
| Stage IV | 25 | 5 | |
| BUB1 expression | |||
| Low | 248 | 49.9 | |
| High | 249 | 50.1 |
Abbreviations: ALK, anaplastic lymphoma kinase; BUB1, Budding uninhibited by benzimidazoles; EGFR, epidermal growth factor receptor; KRAS, Kirsten rat sarcoma viral oncogene homolog.
Construction and evaluation of a prognostic model
In this study, a nomogram was created in the software package R (version 6.0–1) using the nomogram function from the rms library. C‐index and calibration curve analyses were performed using the Hmisc R package (version 4.4–1). Nomograms were evaluated using calibration plots and C‐indexes, which compared nomogram‐predicated probability with observed outcomes. A C‐index of 1 indicates perfect prediction accuracy, whereas a C‐index of 0.5 indicates a model not better than random chance.
GO and KEGG enrichment analyses
In the current study, we used Gene Expression Profiling Interactive Analysis to identify genes that were highly correlated with the expression level of BUB1 in LUAD. Correlation coefficients of |r| values greater than or equal to 0.65 were considered BUB1‐related genes. Subsequently, we incorporated these BUB1‐related genes into Metascape (http://metascape.org) for gene ontology (GO) and Kyoto Encyclopedia of Genes and Genomes (KEGG) analyses to predict the potential biological functions of BUB1. Among the identified genes, genes showing significant differences had p values less than 0.01, a minimum count of 3, and an enrichment factor greater than 1.5. In addition, gene set enrichment analysis (GSEA) was performed to predict significant functional differences between the low and high BUB1 expression groups using the Cluster Profiler package (3.8.0) in R software 21 and the Molecular Signatures Database (MSigDB) Collection (c2.cp.v7.2.symbol.gmt). Results with a p value less than 0.05, normalized enrichment score greater than 1, and false discovery rate (FDR) less than 0.25 were considered significantly enriched.
Single‐cell function and pathway enrichment of BUB1
We used CancerSEA to analyze the tumor‐associated malignant phenotype of BUB1 involved in LUAD and other cancer types. CancerSEA is a dedicated sequencing database designed to comprehensively explore different cellular functions of cancer cells at the single‐cell level. 22 Cancer‐related single‐cell sequencing data for human samples in CancerSEA were derived from 72 datasets in the Sequence Read Archive, GEO, and ArrayExpress websites, therefore CancerSEA was performed to examine the functional correlation of BUB1 with LUAD. The correlation between BUB1 and tumor‐associated malignant phenotypes in distinctive single‐cell datasets was evaluated based on an FDR of less than 0.05 and a correlation coefficient greater than or equal to 0.2.
Immune infiltration analysis
To investigate the association between BUB1 and immune cell infiltration, single‐sample GSEA (ssGSEA) with the Gene Set Variation Analysis (GSVA) package was used to detect the correlation between the relative proportions of different types of infiltrating immune cells in the tumor microenvironment and BUB1 expression. 23 Spearman correlations were employed to evaluate the relationships between BUB1 expression and the infiltration of 24 types of immune cells, and lollipop charts were used to show correlations.
Analysis of methylation
The methylation data for BUB1 were downloaded from the cBioPortal web platform (https://www.cbioportal.org/). 24 The correlation between BUB1 methylation level and BUB1 gene expression (Spearman and Pearson correlations) was evaluated. MethSurv was used to analyze the prognostic value of BUB1 methylation in LUAD. 25
LUAD cell lines and cell culture
MRC‐5 human embryonic lung fibroblasts, MRC‐5 culture medium, and the NSCLC cell lines H1299, H1975, A549, H1650, and PC9 were obtained from Procell Life Science and Technology. A549 and PC9 cells were cultured in high‐glucose Dulbecco's modified Eagle's medium (Hyclone) containing 10% fetal bovine serum (FBS; Biological Industries) and 1% penicillin/streptomycin (Biological Industries), whereas other NSCLC cell lines were grown in RPMI‐1640 medium (Hyclone) supplemented with 10% FBS and 1% penicillin/streptomycin. All cells were incubated in a humidified incubator with 5% CO2 at 37°C.
RNA extraction and RT‐qPCR
RNA was extracted using TRIzol reagent (TaKaRa) according to the manufacturer's instructions. The extracted RNA was then reverse transcribed with a reverse transcription kit (TaKaRa) to yield complementary DNA (cDNA). Subsequently, reverse transcription quantitative polymerase chain reaction (RT‐qPCR) was performed to measure the expression of BUB1 using TB Green Premix Ex Taq II (TaKaRa). Relative gene expression levels were calculated using the 2−ΔΔCt method. The primers used were as follows: BUB1‐forward, 5′‐AGCCCAGACAGTAACAGACTC‐3′; BUB1‐reverse, 5′‐GTTGGCAACCTTATGTGTTTCAC‐3′; glyceraldehyde 3‐phosphate dehydrogenase (GAPDH)‐forward, 5′‐AGGTCGGTGTGAACGGATTTG‐3′; GAPDH‐reverse, 5′‐TGTAGACCATGTAGTTGAGGTCA‐3′.
Western blot analysis
Cells were lysed using Radio Immunoprecipitation Assay (RIPA) buffer to extract proteins. The proteins were then subjected to sodium dodecyl sulfate polyacrylamide gel electrophoresis on 10% gels and transferred to polyvinylidene difluoride membranes (Millipore). The membranes were incubated in 3% bovine serum albumin and probed with appropriate primary antibodies. Immunoblotting images were collected on a Bio‐Rad system after incubation with secondary antibodies. The antibodies used in this study were as follows: rabbit anti‐glyceraldehyde‐3‐phosphate dehydrogenase (GAPDH) (cat. no. 10494‐1‐AP, 1:20000), anti‐BUB1 (cat. no. 13330‐1‐AP, 1:2000), anti‐E‐cadherin (cat. no. 20874‐1‐AP, 1:5000), anti‐N‐cadherin (cat. no. 22018‐1‐AP, 1:4000), anti‐cyclinB1 (cat. no. 55004‐1‐AP, 1:2000), anti‐the serine/threonine kinase AKT (cat. no. 10176‐2‐AP, 1:4000), anti‐phosphatidylinositol 3‐kinase (PI3K; cat. no. 20584‐1‐AP, 1:300), anti‐phospho‐AKT (cat. no. 28731‐1‐AP, 1:3000), and anti‐rabbit secondary antibodies (cat. no. B900210, 1:10000) purchased from Proteintech; and anti‐phospho‐PI3K (cat. no. AF3242, 1:1000) purchased from Affinity Biosciences.
Downregulation of BUB1
LUAD cell lines were infected with a knockdown lentivirus (sh‐BUB1, TCCTACACTTCCTGATATT) 17 and corresponding negative control lentivirus (sh‐NC, TTCTCCGAACGTGTCACGT), purchased from Hanbio Tech. The cells were plated in six‐well plates at 1 × 10⁵ cells/well and incubated for 8 h. Subsequently, depending on the multiplicity of infection value corresponding to the cells, the appropriate amount of virus suspension was added to the six‐well plate and incubated with the cells for 6 h. After replacing the medium with fresh medium and incubating for 48 h, stably transfected clones were screened with puromycin. RT‐qPCR and western blot assays were used to confirm the transfection efficiency.
MTS assays
Promega CellTiter 96 AQueous One Solution Cell Proliferation Assays were employed to measure cell proliferation activity. After transfection, cells were seeded in 96‐well plates at a density of 1000 cells/well and cultured at 37°C for 24, 48, 72, or 96 h. Next, 10 μL of MTS ((3‐(4,5‐dimethylthiazol‐2‐yl)‐5(3‐carboxymethoxyphenyl)‐2‐(4‐sulfopheny)‐2H‐tetrazolium) solution was added to 90 μL of Roswell Park Memorial Institute (RPMI) 1640 medium in each well of a 96‐well plate, and the plates were incubated for an additional 30 min. Subsequently, a microplate reader (Bio‐Rad Laboratories) was used to measure the absorbance at 490 nm. Additionally, H1299 and H1975 cells were cultured in complete medium containing 0, 5, or 10 μM 2OH‐BNPP1 (a BUB1 inhibitor; MedChemExpress) in 96‐well plates, and the results were detected as described above.
Wound healing assays
First, we evenly seeded LUAD cells in six‐well plates after 48 h of lentiviral transfection treatment. When the density of cells in six‐well plates reached 80–90%, the cell monolayers were scraped using a 200‐μL sterile pipette tip. Cells were cultured in medium containing 3% FBS and photographed under a microscope at 0, 24, and 48 h. In addition, to observe the effects of 2OH‐BNPP1 on LUAD cell migration, we treated H1299 and H1975 cells with medium containing 3% FBS plus 0, 5, or 10 μM 2OH‐BNPP1 and photographed them at 0, 24, and 36 h.
Transwell assays
LUAD cells were transfected with lentivirus (negative control sequence set [sh‐NC], sh‐BUB1) for 48 h and then prepared for use. Two hundred microliters of cell suspension in serum‐free medium containing 1 × 10⁴ cells was added to the upper chambers of Transwell inserts (8‐μm pore size; Corning). The inserts were incubated in 24‐well plates supplemented with 700 μL of medium containing 20% FBS as a chemoattractant. For analysis of invasion, Matrigel (BD; Becton, Dickinson and Company) was added to the upper chambers. After incubation in a cell incubator for 48 h, the cells were fixed with 4% paraformaldehyde and then stained with 0.1% crystalline violet solution (Sorabio). Finally, the cells remaining in the upper chamber were wiped with a cotton swab, dried naturally, and photographed under a light microscope.
Clone formation assay
Cells were seeded in six‐well plates at 500 cells/well and incubated for approximately 2 weeks. After individual cell clones formed clusters of more than 50 cells, the cells were fixed and stained. Finally, the number of cell clusters in each well was photographed and counted.
Flow cytometry
After transfection or drug treatment, apoptosis was detected using an Annexin V‐FITC Apoptosis kit (Beyotime). Apoptosis was then measured by flow cytometry analysis (CytoFLEX S; Beckman Coulter) and the data were analyzed using CytExpert2.4.
Immunohistochemistry
Tissue slides were analyzed using immunohistochemistry. Antigen retrieval was performed by boiling the slides in citrate buffer (pH 6.0) for 10 min, followed by cooling at room temperature for 20 min. The slides were incubated at 4°C with anti‐BUB1 primary antibodies (1:300 dilution; Proteintech, cat. no. 13330‐1‐AP) overnight, followed by anti‐rabbit peroxidase‐conjugated secondary antibodies (1:500). Subsequently, scoring was performed as previously reported. 26 The intensity of staining was scored as 0 (no staining), 1 (weak), 2 (medium), or 3 (strong). An H‐score was calculated based on the intensity (0–3) and percentage of cells staining (0–100%), using the formula intensity × percentage/100. H‐score ≤1 was the low expression group of BUB1 and H‐score >1 was the high expression group. The staining score for each sample was assessed independently by two skilled pathologists.
Statistical analysis
Statistical analyses were carried out using R software (v3.6.3), GraphPad Prism8.0.2 and ImageJ (1.8.0). Wilcoxon signed‐rank and Wilcoxon rank‐sum tests were used to analyze BUB1 expression in paired and nonpaired samples, respectively. The associations between clinicopathological features and BUB1 expression were evaluated using Wilcoxon signed‐rank tests or Kruskal–Wallis tests. Receiver operating characteristic (ROC) curves were generated using the pROC R and ggplot2 R packages. Correlation analysis was performed using Spearman tests. Differences in survival status were measured using the Kaplan–Meier method, and differences between groups were assessed using log‐rank tests. Univariate Cox analysis was used to identify potential prognostic factors, and multivariate Cox analyses were used to determine whether BUB1 was an independent risk factor for overall survival (OS) in patients with LUAD. Differences between groups were analyzed using t‐tests and results with p values less than 0.05 were considered significant. Mann–Whitney tests were used to analyze differences in BUB1 expression between LUAD and adjacent lung tissues.
RESULTS
BUB1 expression was upregulated in LUAD samples from TCGA database
First, to determine BUB1 expression in multiple types of cancer, we performed a comprehensive analysis of 33 tumor types using data from TCGA. We found that BUB1 was overexpressed in 30 tumor types, including bladder urothelial carcinoma (BLCA), breast invasive carcinoma (BRCA), liver hepatocellular carcinoma (LIHC), cholangio carcinoma (CHOL), and LUAD (p < 0.001; Figure 1A). This is consistent with the findings reported in previous literature. 15 , 19 , 20 , 27 , 28 Subsequently, we further explored that BUB1 expression was significantly higher in LUAD tissue than in normal tissue when comparing unpaired and paired samples of LUAD and normal tissues (p < 0.001; Figure 1B,C). ROC curve analyses showed that the area under the curve (AUC) of BUB1 was as high as 0.943, suggesting that BUB1 had potential diagnostic value in patients with LUAD (Figure 1D).
FIGURE 1.

Budding uninhibited by benzimidazoles 1 (BUB1) expression levels in lung adenocarcinoma (LUAD) and multiple human cancers based on The Cancer Genome Atlas (TCGA) data. (A) BUB1 expression levels in diverse tumor types based on TCGA database. (B–C) Expression levels of BUB1 in LUAD and paracancerous tissues in unpaired and paired samples. (D) Receiver operating characteristic analysis of BUB1 in LUAD. (E–G) Correlation of BUB1 expression in LUAD with T‐stage, N‐stage, and pathological stage (*p < 0.05, **p < 0.01, ***p < 0.001)
Overexpression of BUB1 was associated with poor prognosis in patients with LUAD
We analyzed the relationship between BUB1 messenger RNA (mRNA) expression and clinicopathological parameters in patients with LUAD, including T stage, N stage, distant metastasis, sex, age, and EGFR/ALK status. Analyses showed that BUB1 mRNA expression was associated with T stage (Figure 1E) and N stage (Figure 1F). Moreover, BUB1 mRNA expression was higher in patients with advanced disease (Figure 1G).
To investigate the relevance of BUB1 expression in prognosis in patients with LUAD, we divided samples into two groups based on the median expression level of BUB1 in TCGA database. The results showed that patients with high BUB1 expression had distinctly lower OS rates than those with low BUB1 expression (p = 0.001; Figure 2A). To further verify the association between BUB1 expression level and OS, we examined the GSE13213, GSE37745, and GSE50081 datasets. Similarly, high expression of BUB1 was associated with a worse OS than low expression of BUB1 (p = 0.002, Figure 2B; p = 0.001, Figure 2C; p = 0.007, Figure 2D).
FIGURE 2.

The prognostic value of budding uninhibited by benzimidazoles 1 (BUB1) expression in lung adenocarcinoma (LUAD). (A) Survival curves of overall survival (OS) from The Cancer Genome Atlas data (n = 497). (B) Survival curves of OS from GSE13213 (n = 117). (C) Survival curves of OS from GSE37745 (n = 106). (D) Survival curves of OS from GSE50081 data (n = 127)
Next, univariate and multivariate Cox regression models were employed to investigate the prognostic factors of LUAD. Univariate analysis revealed that high BUB1 expression was associated with poor OS (hazard ratio [HR] = 1.620, 95% confidence interval [CI] 1.204–2.179, p = 0.001; Table 2). Other clinicopathological variables associated with poor OS included T stage (p = 0.003), N stage (p < 0.001), and pathological stage (p < 0.001). In multivariate analyses, BUB1 expression remained independently related with OS (HR = 1.499, 95% CI 1.088–2.066, p = 0.013; Table 2) and pathological stage (p < 0.017).
TABLE 2.
The univariate and multivariate analyses of overall survival according to BUB1, after adjusting for other potential predictors in The Cancer Genome Atlas
| Clinicopathologic variable | Total (N) | Hazard ratio (95% CI) | p |
|---|---|---|---|
| Univariate analysis | |||
| Sex (male vs. female) | 497 | 0.954 (0.711 ~ 1.279) | 0.752 |
| Age (>70 vs. ≤ 70) | 487 | 1.464 (1.081 ~ 1.982) | 0.014 |
| Number pack years smoked (≥40 vs. <40) | 341 | 1.026 (0.714 ~ 1.475) | 0.888 |
| EGFR status (Mut vs. Wt) | 266 | 1.265 (0.797 ~ 2.008) | 0.319 |
| ALK status (Mut vs. Wt) | 236 | 1.713 (0.938 ~ 3.128) | 0.08 |
| KRAS status (Mut vs. Wt) | 302 | 1.257 (0.778 ~ 2.032) | 0.351 |
| T stage (T2/T3/T4 vs. T1) | 494 | 1.678 (1.187 ~ 2.373) | 0.003 |
| N stage (N1/N2/N3 vs. N0) | 486 | 2.637 (1.957 ~ 3.553) | <0.001 |
| M stage (M1 vs. M0) | 355 | 2.129 (1.243 ~ 3.648) | 0.006 |
| Pathologic stage (stage II/III/ IV vs. stage I) | 490 | 2.629 (1.924 ~ 3.591) | <0.001 |
| BUB1 (high vs. low) | 497 | 1.620 (1.204 ~ 2.179) | 0.001 |
| Multivariate analysis | |||
| Age (>70 vs. ≤70) | 1.583 (1.155 ~ 2.170) | 0.004 | |
| T stage (T2/T3/T4 vs. T1) | 1.251 (0.868 ~ 1.804) | 0.23 | |
| N stage (N1/N2/N3 vs. N0) | 1.380 (0.841 ~ 2.265) | 0.203 | |
| Pathologic stage (stage II/III/IV vs. stage I) | 1.885 (1.120 ~ 3.174) | 0.017 | |
| BUB1 (high vs. low) | 1.499 (1.088 ~ 2.066) | 0.013 |
Abbreviations: ALK, anaplastic lymphoma kinase; BUB1, budding uninhibited by benzimidazoles 1; CI, confidence interval; EGFR, epidermal growth factor receptor; KRAS, kirsten rat sarcoma viral oncogene homolog.
Establishment of prognostic models based on BUB1 and clinical factors
Next, we constructed a nomogram based on the results of multivariate analysis, incorporating BUB1 as a biomarker of LUAD to predict OS (Figure 3A). Higher combined scores indicated a worse prognosis, and calibration curves were used to evaluate the reliability of our constructed nomogram. BUB1 had a C‐index of 0.68 (Figure 3B–D). Thus, this nomogram may be a model for predicting survival in patients with LUAD using BUB1 as an independent prognostic factor.
FIGURE 3.

Nomogram and calibration curve for predicting the probability of 1‐, 3‐, and 5‐year overall survival for lung adenocarcinoma (LUAD) patients. (A) A nomogram integrates BUB1 and other prognostic factors in LUAD from The Cancer Genome Atlas data. (B–D) The calibration curve of the nomogram. Budding uninhibited by benzimidazoles 1 (BUB1)
Functional enrichment analysis of BUB1
Genes associated with BUB1 expression were screened out, and GO and KEGG enrichment analyses were performed using the Metascape online tool. We then found that BUB1‐related genes were primarily involved in cell cycle regulation, cell division, and DNA damage and repair (Figure 4A). GSEA results showed that BUB1 may participate in activating the cell cycle, DNA methylation, DNA replication, and mitosis signaling pathways (Figure 4B,C).
FIGURE 4.

Functional enrichment of Budding uninhibited by benzimidazoles 1 (BUB1) in lung adenocarcinoma. (A) Gene ontology (GO) and Kyoto Encyclopedia of Genes and Genomes (KEGG) enrichment analyses of BUB1‐related genes. (B) Gene set enrichment analysis (GSEA) function enrichment analysis of differentially expressed genes in low‐ and high‐BUB1 expression samples. (C) Enrichment score of genes in the cell cycle, DNA methylation, DNA replication, and mitotic metaphase and anaphase by GSEA function analysis
Single‐cell functions involved in BUB1 across LUAD and other cancer types by CancerSEA
To better understand the potential mechanisms of BUB1 at the single‐cell level, we analyzed the tumor‐associated malignant phenotypes of BUB1 involvement in LUAD and other cancer types in the CancerSEA database. As shown in Figure 5, BUB1 was positively correlated with cell cycle, DNA damage, DNA repair, invasion, and proliferation in most cancer types, including LUAD, BRCA, and Acute myeloid leukemia (AML). In LUAD, functional correlation analysis indicated positive correlations of BUB1 expression with DNA damage, cell cycle, proliferation, DNA repair, invasion, the epithelial‐mesenchymal transition (EMT), and metastasis (Spearman's correlations 0.55, 0.53, 0.47, 0.42, 0.40, 0.37, and 0.29, respectively; p < 0.01).
FIGURE 5.
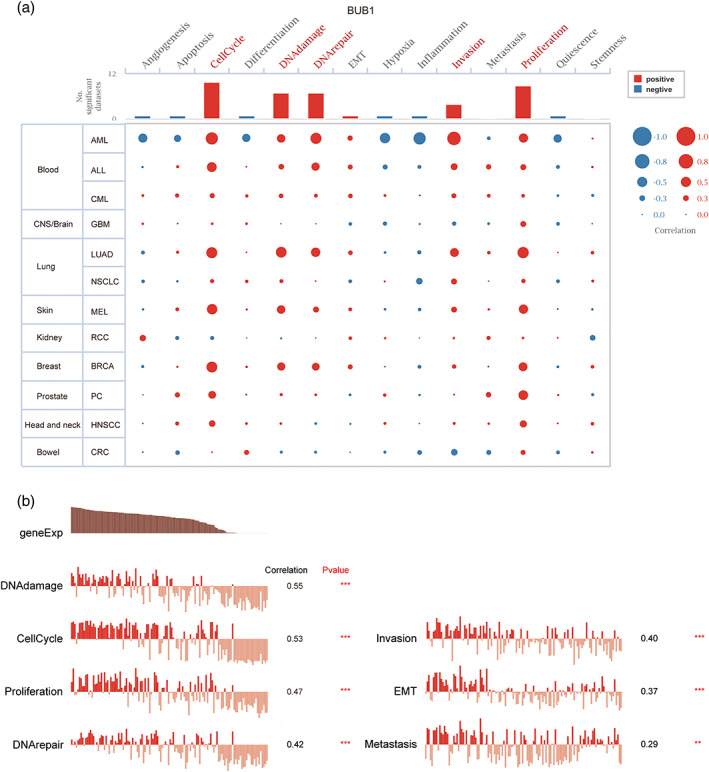
Single‐cell functions involved in Budding uninhibited by benzimidazoles 1 (BUB1) across lung adenocarcinoma (LUAD) and other cancer types by CancerSEA. (A) Visualization of functional analysis of BUB1 in multiple malignancies. (B) In LUAD, single‐cell sequencing showed correlation of BUB1 expression with multiple functional phenotypes (Spearman correlation, p < 0.01)
Correlations between BUB1 expression and immune cell infiltration in LUAD
In subsequent analyses, ssGSEA was employed to analyze the relationships between BUB1 expression and the level of immune cell infiltration in LUAD (Figure 6A). We found that the numbers of T helper 2 cells (p < 0.001), activated dendritic cells, T helper cells, natural killer (NK) CD56 dark cells, and T gamma delta cells (p < 0.05) were positively correlated with BUB1 expression. Conversely, the numbers of other immune cell subsets, such as mast cells, eosinophils, interdigitating cells, T follicular helper cells, dendritic cells (DCs), and CD8+ T cells (p < 0.05), were negatively correlated with BUB1 expression. Importantly, we found that the numbers of several immune cell types with important roles in tumor immunity were negatively correlated with BUB1 expression, including NK cells (p < 0.001, r = −0.193; Figure 6B), CD8+ T cells (p < 0.001, r = −0.250; Figure 6C), DCs (p < 0.001, r = −0.253; Figure 6D), and B cells (p < 0.001, r = −0.141; Figure 6E).
FIGURE 6.
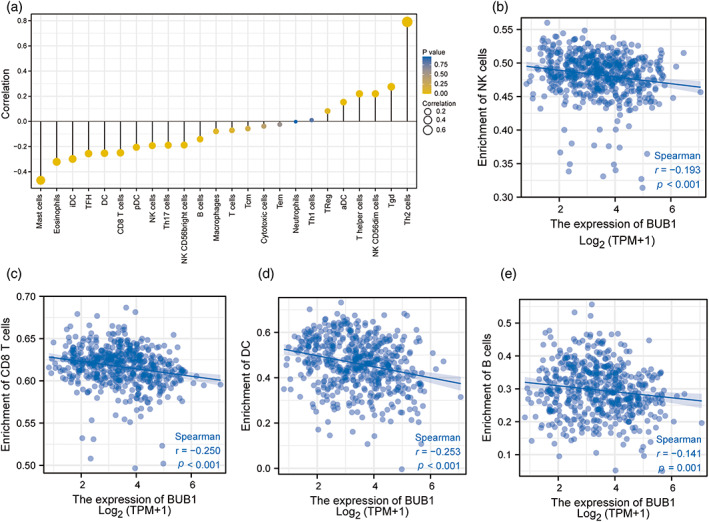
The association of Budding uninhibited by benzimidazoles 1 (BUB1) expression with the level of immune cell infiltration in lung adenocarcinoma. (A) Correlation between the level of infiltration of 24 immune cells and BUB1 expression as detected by single‐sample GSEA (ssGSEA). (B–E) BUB1 expression shows a significant negative correlation with infiltrating levels of natural killer (NK) cells (B), CD8+ T cells (C), activated dendritic cells (DCs) (D), and B cells (E) based on ssGSEA
BUB1 overexpression was associated with hypomethylation
Next, we performed methylation analysis of the BUB1 gene. We found that the expression of BUB1 was negatively correlated with the methylation level of BUB1 (Figure 7A). Moreover, the methylation level of BUB1 was low in LUAD samples in data from the MethSurv (Figure 7B). Finally, MethSurv analysis revealed that patients with low BUB1 methylation had a worse prognosis than patients with high BUB1 methylation (p < 0.05). Additionally, we discovered that two phosphodiester bond that connects cytosine and guanine (CpG) sites, that is, cg10954392 (p = 0.033, HR = 0.699) and cg05519737 (p = 0.016, HR = 0.669) were associated with a poor prognosis (Figure 7C,D).
FIGURE 7.

Relationship between Budding uninhibited by benzimidazoles 1 (BUB1) expression level and its methylation level. (A) Correlation of BUB1 methylation with its mRNA expression level. (B) The visualization between the methylation level and the BUB1 expression. (C–D) The Kaplan–Meier survival of the methylation site of BUB1
Validation of the prognostic value of BUB1 by IHC
As shown in Figure 8A, we next evaluated the immunohistochemical staining intensities of BUB1 in LUAD and paraneoplastic tissues. Mann–Whitney tests showed that BUB1 was significantly overexpressed in LUAD tissues (p < 0.001; Figure 8B). Detailed clinicopathological information regarding the tissue microarray is available in Supporting Information Table S1. Importantly, Kaplan–Meier survival analysis revealed that BUB1 overexpression was associated with a poor prognosis in patients with LUAD (p < 0.001; Figure 8C). In addition, multivariate Cox regression analyses showed that BUB1 overexpression (p = 0.018; Supporting Information Table S2) and TNM stage (p = 0.015; Supporting Information Table S2) were independent risk factors for LUAD.
FIGURE 8.

Immunohistochemical validation of Budding uninhibited by benzimidazoles 1 (BUB1). (A) Comparison of immunohistochemical staining of lung adenocarcinoma and paraneoplastic tissue. (B) Statistical plots quantifying the expression of BUB1 by staining score. (C) Kaplan–Meier survival analysis demonstrates the relationship between BUB1 expression levels and patient prognosis
Verification of BUB1 expression in vitro
In the current study, we confirmed that BUB1 expression was strongly upregulated in LUAD tissues and cell lines. First, BUB1 mRNA levels were detected in 36 pairs of LUAD samples (written informed consent was obtained from patients for all tissue samples.) by RT‐qPCR; the results showed that 69.4% of LUAD tissues had higher BUB1 mRNA levels than normal tissues (Figure 9A,B). Subsequently, as shown in Figure 9C,D, the mRNA and protein expression levels of BUB1 in five common LUAD cell lines (A549, H1299, H1975, H1650, and PC9) were significantly higher than those in MCR‐5 human normal lung cells. Therefore, we selected the two cell lines with the highest BUB1 expression, that is, H1299 and H1975, for subsequent in vitro experiments.
FIGURE 9.

Comparison of Budding uninhibited by benzimidazoles 1 (BUB1) expression levels in tissue and cell samples, and validation of BUB1 knockdown efficiency. (A–B) BUB1 mRNA expression level in 36 pairs of lung adenocarcinoma and paracancer tissues. (C–D) The mRNA as well as protein expression levels of BUB1 in Medical research council cell strain‐5 (MRC‐5) and five NSCLC cell lines. (E–F) Validation of knockdown efficiency of BUB1 in H1299 and H1975 cells (*p < 0.05, **p < 0.01, ***p < 0.001)
Knockdown of BUB1 inhibited proliferation and promoted apoptosis in LUAD cells
As shown in Figure 9E,F, after we knocked down BUB1 in H1299 and H1975 cell lines with lentivirus, their BUB1 mRNA and protein levels were significantly decreased. The results of MTS and plate cloning assays showed that after knockdown of BUB1, the proliferation ability of H1299 and H1975 cells was inhibited (Figure 10A,C). In addition, MTS assays also showed that treatment of cells with different concentrations of the BUB1 inhibitor 2OH‐BNPP1 inhibited cell proliferation in a concentration‐dependent manner (Figure 10B). Apoptosis was then detected by flow cytometry. Compared with the control group, both early and late apoptosis levels were increased in the knockdown group, suggesting that knockdown of BUB1 promoted apoptosis in LUAD cells (Figure 10D,E).
FIGURE 10.

Effect of Budding uninhibited by benzimidazoles 1 (BUB1) on cell proliferation and apoptosis. (A–B) The results of the MTS assay showed that knockdown of BUB1 or the use of BUB1 inhibitors 2OH‐BNPP1 both reduced the proliferation viability of H1299 and H1975. (C) Plate cloning experiments showed that knockdown of BUB1 inhibited the proliferation of lung adenocarcinoma (LUAD) cells. (D–E) Flow cytometry analysis showed that knockdown of BUB1 promoted apoptosis of LUAD cells (*p < 0.05, **p < 0.01, ***p < 0.001)
Knockdown of BUB1 reduced the invasion and migration of LUAD cells
Wound‐healing assays were used to assess the effects of BUB1 on cell migration. We found that inhibition of BUB1 (including knockdown of BUB1 or treatment with the BUB1 inhibitor 2OH‐BNPP1) in H1299 and H1975 cells markedly attenuated cell migration (Figure 11A–D). The experimental results were consistent with those of transwell experiments, in which the migration (Figure 12A,B) and invasion (Figure 12C,D) abilities of BUB1‐knockdown cells (transfected with sh‐BUB1) were significantly inhibited.
FIGURE 11.

Inhibition of Budding uninhibited by benzimidazoles 1 (BUB1) attenuated the migratory ability of lung adenocarcinoma (LUAD) cells. (A–B) Wound healing experiments showed that knockdown of BUB1 decreased the migratory capacity of LUAD cells. (C–D) Wound healing experiments showed that the migration ability of LUAD cells was reduced after treatment of cells with the BUB1 inhibitor 2OH‐BNPP1 (*p < 0.05, **p < 0.01, ***p < 0.001)
FIGURE 12.

Effects of knockdown of Budding uninhibited by benzimidazoles 1 (BUB1) on lung adenocarcinoma cell invasion and migration and changes in related protein expression. (A–D) Transwell assay showed that the migration and invasion ability of H1299 and H1975 cells were decreased after knockdown of BUB1. (E) Changes in the expression levels of E‐cadherin, CyclinB1, and N‐cadherin after knockdown of BUB1. (F) Changes in the expression levels of key proteins in the PI3K/AKT signaling pathway after knockdown of BUB1 (*p < 0.05, **p < 0.01, ***p < 0.001)
BUB1 affected the biological functions of LUAD through the PI3K/AKT pathway
Western blot results showed that the BUB1 knockdown group had lower levels of N‐cadherin and cyclinB1 and higher levels of E‐cadherin compared with the control group (Figure 12E), suggesting that BUB1 may be involved in the EMT process, consistent with the results of our wound healing and transwell assays. Finally, we speculated that BUB1 affected the development of LUAD through the activation of the PI3K/AKT signaling pathway based on previous literature. 17 , 29 Indeed, although downregulation of BUB1 did not significantly alter PI3K and AKT expression, both phospho‐PI3K and phospho‐AKT levels were decreased in the BUB1‐knockdown group (Figure 12F).
DISCUSSION
Lung cancer is the most commonly diagnosed cancer in the world and a common cause of cancer‐related death, with more than two‐thirds of patients diagnosed at an advanced stage. 30 Difficulties in the early diagnosis of lung cancer as well as treatment failure due to multiple factors are associated with poor prognosis in patients with lung cancer, 31 therefore finding biomarkers that can aid in early diagnosis and accurate prognostic assessment is essential for improving prognoses. In this study, we aimed to comprehensively explore and analyze the potential of BUB1 as a LUAD biomarker from a multi‐omics perspective using bioinformatics analysis and basic experiments.
The importance of BUB1 as a biomarker in LUAD has been previously reported in the literature. 28 However, these studies explored BUB1 as being more highly expressed in LUAD than in paraneoplastic tissues and that BUB1 may promote the malignant progression of LUAD by influencing the cell cycle and cell replication as well as the P53 signaling pathway in LUAD, which were only based on bioinformatics analysis and were not validated by in vivo and in vitro experiments. In our study, we downloaded relevant data from TCGA and GEO databases for differential analysis, and the results showed that the expression of BUB1 was significantly higher in LUAD tissues than in paraneoplastic tissues. Moreover, high BUB1 expression was associated with a poor prognosis and adverse pathological parameters, such as T‐stage and N‐stage in LUAD. Furthermore, the AUC of BUB1 in the ROC curve was as high as 0.943, suggesting that BUB1 had some potential diagnostic value for LUAD. Subsequently, we further validated the mRNA expression of BUB1 in 36 pairs of clinical samples using RT‐qPCR, and the protein expression of BUB1 in cancer and paraneoplastic tissues in tissue microarrays was verified by IHC; both analyses showed that BUB1 exhibited significantly high expression in LUAD. Importantly, IHC analysis of tissue microarrays also demonstrated that BUB1 overexpression was significantly associated with poor prognosis and adverse clinicopathological parameters, such as N stage in patients with LUAD. In addition, multivariate Cox regression analysis showed that BUB1 overexpression was an independent risk factor for LUAD. The above experimentally verified results were all consistent with the bioinformatics findings, indicating that BUB1 could be used as a credible biomarker for prognosis in patients with LUAD.
BUB1 is a serine/threonine kinase with functions in mitotic chromosome alignment and the spindle assembly checkpoint. Aurora B kinase works with BUB1 to promote the production of the mitotic checkpoint complex, which promotes the next step in cell division. 32 This indicates that BUB1 is involved in important biological functions, such as cell growth and proliferation. Our bioinformatics analysis based on TCGA database concluded that BUB1 showed high expression in a variety of tumors, including BLCA, BRCA, LIHC, LUAD, and so forth. In single‐cell sequencing, we found that BUB1 is also involved in similar biological functions in multiple malignancies. These are consistent with previous results reported in the kinds of literature, and the literature also indicates that BUB1 is closely associated with the malignant phenotype and prognosis of these tumors. 15 , 19 , 20 , 27 , 33 However, the relationships between high BUB1 expression and the multiple malignant phenotypes of LUAD have not been clearly reported in the literature.
Subsequently, we validated the associations of BUB1 with multiple malignant phenotypes and the related mechanisms. Our functional enrichment analyses of the GO, KEGG, GSEA, and CancerSEA datasets showed that BUB1 was associated with various biological functions, such as DNA damage repair, cell division, cell cycle, and invasion, and these findings were confirmed in subsequent experiments. For example, MTS assays and plate cloning experiments confirmed that inhibition of BUB1 blocked the proliferation of LUAD cells, promoted apoptosis in LUAD cells, and significantly decreased the expression of cyclinB1, which plays important roles in the G2 phase of the cell cycle and promotes the G2/M transition. 34 The G2 phase involves the synthesis of cell mitosis‐related enzymes and spindle filament proteins. Thus, we can infer that BUB1 can block cell proliferation by affecting the cell cycle. In follow‐up experiments, wound healing and transwell assays confirmed that knockdown of BUB1 inhibited the migration and invasion of LUAD cells. Importantly, western blotting showed that BUB1 knockdown downregulated E‐cadherin and upregulated N‐cadherin. Combined with the results of transwell assays and wound healing experiments, our findings suggested that knockdown of BUB1 inhibited the EMT in tumor cells, 35 thereby blocking the migration and invasion of LUAD cells.
In further studies, we validated the roles of BUB1 in relevant signaling pathways. Western blotting results showed no significant changes in PI3K and AKT levels in the knockdown group, but the levels of phosphorylated PI3K and AKT were significantly reduced in the BUB1‐knockdown group, suggesting that BUB1 may affect the occurrence and development of LUAD through the PI3K/AKT signaling pathway. The PI3K/AKT signaling pathway has extensive and significant effects in tumors. 36 Studies have shown that inhibitors of the PI3K/AKT signaling cascade, either alone or in combination with other therapies, are critical cancer treatment strategies. 37 Based on the above experimental results and related discussions, we concluded that BUB1 may serve as an independent biomarker for the prognosis of LUAD and an effective therapeutic target for the treatment of patients with LUAD.
DNA methylation is a chemical modification that defines cell types and lineages by controlling gene expression and genome stability. Disruption of DNA methylation control mechanisms and changes in gene methylation levels can lead to the development of various diseases, including cancer. 38 Accordingly, it is reasonable to assume that DNA hypomethylation promotes tumorigenesis by activating oncogenes. In the current study, we found that BUB1 overexpression was significantly correlated with BUB1 hypomethylation. Moreover, patients with low BUB1 methylation showed worse outcomes than those with high BUB1 methylation. This also suggests that BUB1 hypomethylation may result in BUB1 overexpression, thereby promoting the progression of LUAD.
In recent years, the tumor immune microenvironment has become a hot research topic, and studies have shown that the tumor immune microenvironment may affect the prognosis and treatment outcomes of patients with LUAD. 39 We further performed ssGSEA to evaluate the association between BUB1 and immune cell infiltration in LUAD. Interestingly, our results revealed that high BUB1 expression was correlated with low infiltration of immune cells, including CD8+ T cells, NK cells, B cells, and DCs. Many reports have shown that the tumor microenvironment, particularly the immune microenvironment, plays key roles in the development of cancer. 40 , 41 , 42 Additionally, patients with high levels of CD8+ T‐cell infiltration in the tumor stroma and tumor nest have better OS, and the numbers of NK cells, B cells, and mature DCs tend to be positively correlated with the prognosis of patients with cancer. 43 , 44 , 45 , 46 , 47 Consequently, we postulated that low levels of immune cell infiltration may be important factors affecting prognosis in patients with high BUB1 expression. Importantly, the levels of immune cell infiltration are also related to the response to treatment with immune checkpoint inhibitors (ICIs). Patients with high levels of infiltrating immune cells, particularly CD8+ T cells, are more likely to benefit from ICI treatment in LUAD. 48 Taken together, these findings suggest that BUB1 may be a promising biomarker for prediction of the response to immunotherapy.
In summary, our study suggests that BUB1 can indeed be used as a molecular biomarker of LUAD to assess the prognosis of LUAD. We confirmed that BUB1 is highly expressed in LUAD from multiple aspects at bioinformatic, LUAD tissue, and cellular levels and correlated with poor prognosis and pathological parameters of LUAD. Our bioinformatic analysis also pointed out that BUB1 may be involved in the tumor microenvironment of LUAD, promoting its malignant progression. In addition, hypomethylation of BUB1 may contribute to its high expression in LUAD as well as poor prognosis. We also performed a series of in vitro experiments to confirm that BUB1 promotes the proliferation, invasion, and migration of LUAD cells as well as inhibits their apoptosis. Importantly, we also indicated that BUB1 may affect LUAD development and progression through the PI3K/AKT signaling pathway. Although our current findings improved our understanding of the roles of BUB1 in LUAD, there were some limitations to this study. First, ssGSEA suggested that BUB1 may promote LUAD progression by mediating immunosuppression, but further experimental validation is needed to confirm these findings. Additionally, more in‐depth studies on the potential mechanisms of BUB1 in LUAD are needed. Finally, appropriate doses of 2OH‐BNPP1 can inhibit the proliferation and migration of LUAD cells. Previous studies have also shown that treatment of mice with lung cancer xenografts with 2OH‐BNPP1 can reduce the amount of phosphorylated Mothers against decapentaplegic homolog 2 (SMAD2) in tumor tissue. 49 BUB1 targeting may have applications as an independent treatment strategy or in combination with current chemotherapies and immunotherapies in the future.
CONCLUSIONS
Taken together, our findings showed that BUB1 is highly expressed in LUAD and is associated with poor prognosis and adverse clinicopathological parameters. Furthermore, bioinformatics evidence (including GEO, KEGG, ssGSEA, Nomograme, etc.) and in vitro experiments confirmed that BUB1 plays important roles in regulating the malignant phenotypes of patients with LUAD. Mechanistically, BUB1 may be involved in activating the PI3K/ATK signaling pathway to influence the progression of LUAD. In addition, low doses of 2OH‐BNPP1 inhibited LUAD cell proliferation and migration. These findings suggested that BUB1 may indeed be a promising prognostic biomarker and potential therapeutic target in patients with LUAD.
AUTHOR CONTRIBUTIONS
R.C. performed the experiments, processed the relevant data involved in the experiments, and drafted the manuscript. Z.W. performed the data collection and interpretation, and participated in the revision of the manuscript. T.L., Y.L., Y.J., and Y.Y. revised the manuscript critically for important intellectual content. S.G. and F.T. gave final approval of the version to be published. All authors read and approved the final manuscript.
CONFLICT OF INTEREST STATEMENT
No author has any conflict of interest.
Supporting information
TABLE S1. Immunohistochemical validation: correlation between BUB1 expression and clinicopathological characteristics
TABLE S2. Univariate and multivariate analyses of the factors correlated with overall survival of lung adenocarcinoma patients
ACKNOWLEDGMENTS
We sincerely thank the publicly available databases, including TCGA, GEO, cBioportal, Metascape, MethSurv, and cancerSEA, for providing open access. Moreover, we would like to thank Editage (www.editage.cn) for English language editing. This study was supported by the National Natural Science Foundation of China (grant no. 8166100534).
Chen R, Wang Z, Lu T, Liu Y, Ji Y, Yu Y, et al. Budding uninhibited by benzimidazoles 1 overexpression is associated with poor prognosis and malignant phenotype: A promising therapeutic target for lung adenocarcinoma. Thorac Cancer. 2023;14(10):893–912. 10.1111/1759-7714.14822
Rui Chen and Zhiping Wang contributed equally to this work.
Contributor Information
Fangfang Tou, Email: toufangfang2022@126.com.
Shanxian Guo, Email: guoshanxian666@126.com.
REFERENCES
- 1. Hirsch FR, Scagliotti GV, Mulshine JL, Kwon R, Curran WJ Jr, Wu YL, et al. Lung cancer: current therapies and new targeted treatments. Lancet (London, England). 2017;389(10066):299–311. [DOI] [PubMed] [Google Scholar]
- 2. Majeed U, Manochakian R, Zhao Y, Lou Y. Targeted therapy in advanced non‐small‐cell lung cancer: current advances and future trends. J Hematol Oncol. 2021;14(1):108. [DOI] [PMC free article] [PubMed] [Google Scholar]
- 3. Aldarouish M, Wang C. Trends and advances in tumor immunology and lung cancer immunotherapy. J Exp Clin Cancer Res. 2016;35(1):157. [DOI] [PMC free article] [PubMed] [Google Scholar]
- 4. Chen M‐Y, Zeng Y‐C. Pseudoprogression in lung cancer patients treated with immunotherapy. Crit Rev Oncol Hematol. 2021;169:103531. [DOI] [PubMed] [Google Scholar]
- 5. Duruisseaux M, Esteller M. Lung cancer epigenetics: from knowledge to applications. Semin Cancer Biol. 2018;51:116–28. [DOI] [PubMed] [Google Scholar]
- 6. Samarelli A, Masciale V, Aramini B, Coló GP, Tonelli R, Marchioni A, et al. Molecular mechanisms and cellular contribution from lung fibrosis to lung cancer development. Int J Mol Sci. 2021;22(22):12179. [DOI] [PMC free article] [PubMed] [Google Scholar]
- 7. Singh T, Fatehi Hassanabad M, Fatehi Hassanabad A. Non‐small cell lung cancer: emerging molecular targeted and immunotherapeutic agents. Biochim Biophys Acta Rev Cancer. 2021;1876(2):188636. [DOI] [PubMed] [Google Scholar]
- 8. Tian X, Gu T, Lee M‐H, Dong Z. Challenge and countermeasures for EGFR targeted therapy in non‐small cell lung cancer. Biochim Biophys Acta Rev Cancer. 2021;1877(1):188645. [DOI] [PubMed] [Google Scholar]
- 9. Chen Q, Zhang M, Pan X, Yuan X, Zhou L, Yan L, et al. Bub1 and CENP‐U redundantly recruit Plk1 to stabilize kinetochore‐microtubule attachments and ensure accurate chromosome segregation. Cell Rep. 2021;36(12):109740. [DOI] [PubMed] [Google Scholar]
- 10. Fischer E, Yu CWH, Bellini D, McLaughlin S, Orr CM, Wagner A, et al. Molecular mechanism of Mad1 kinetochore targeting by phosphorylated Bub1. EMBO Rep. 2021;22(7):e52242. [DOI] [PMC free article] [PubMed] [Google Scholar]
- 11. Garcia Y, Velasquez EF, Gao LW, Gholkar AA, Clutario KM, Cheung K, et al. Mapping proximity associations of core spindle assembly checkpoint proteins. J Proteome Res. 2021;20(7):3414–27. [DOI] [PMC free article] [PubMed] [Google Scholar]
- 12. Li F, Kim H, Ji Z, Zhang T, Chen B, Ge Y, et al. The BUB3‐BUB1 complex promotes telomere DNA replication. Mol Cell. 2018;70(3):395–407.e4. [DOI] [PMC free article] [PubMed] [Google Scholar]
- 13. Wu F, Sun Y, Chen J, Li H, Yao K, Liu Y, et al. The oncogenic role of APC/C activator protein Cdc20 by an integrated Pan‐cancer analysis in human tumors. Front Oncol. 2021;11:721797. [DOI] [PMC free article] [PubMed] [Google Scholar]
- 14. Piao J, Zhu L, Sun J, Li N, Dong B, Yang Y, et al. High expression of CDK1 and BUB1 predicts poor prognosis of pancreatic ductal adenocarcinoma. Gene. 2019;701:15–22. [DOI] [PubMed] [Google Scholar]
- 15. Colón‐Marrero S, Jusino S, Rivera‐Rivera Y, Saavedra HI. Mitotic kinases as drivers of the epithelial‐to‐mesenchymal transition and as therapeutic targets against breast cancers. Exp Biol Med (Maywood). 2021;246(9):1036–44. [DOI] [PMC free article] [PubMed] [Google Scholar]
- 16. Grabsch H, Takeno S, Parsons WJ, Pomjanski N, Boecking A, Gabbert HE, et al. Overexpression of the mitotic checkpoint genesBUB1, BUBR1, andBUB3 in gastric cancer?Association with tumour cell proliferation. J Pathol. 2003;200(1):16–22. [DOI] [PubMed] [Google Scholar]
- 17. Huang Z, Wang S, Wei H, Chen H, Shen R, Lin R, et al. Inhibition of BUB1 suppresses tumorigenesis of osteosarcoma via blocking of PI3K/Akt and ERK pathways. J Cell Mol Med. 2021;25:8442–53. [DOI] [PMC free article] [PubMed] [Google Scholar]
- 18. Ohshima K, Haraoka S, Yoshioka S, Hamasaki M, Fujiki T, Suzumiya J, et al. Mutation analysis of mitotic checkpoint genes (hBUB1 and hBUBR1) and microsatellite instability in adult T‐cell leukemia/lymphoma. Cancer Lett. 2000;158(2):141–50. [DOI] [PubMed] [Google Scholar]
- 19. Zhu L, Pan Y, Chen XY, Hou PF. BUB1 promotes proliferation of liver cancer cells by activating SMAD2 phosphorylation. Oncol Lett. 2020;19(5):3506–12. [DOI] [PMC free article] [PubMed] [Google Scholar]
- 20. Jiang N, Liao Y, Wang M, Wang Y, Wang K, Guo J, et al. BUB1 drives the occurrence and development of bladder cancer by mediating the STAT3 signaling pathway. J Exp Clin Cancer Res. 2021;40(1):378. [DOI] [PMC free article] [PubMed] [Google Scholar]
- 21. Yu G, Wang LG, Han Y, He QY. clusterProfiler: an R package for comparing biological themes among gene clusters. Omics. 2012;16(5):284–7. [DOI] [PMC free article] [PubMed] [Google Scholar]
- 22. Yuan H, Yan M, Zhang G, Liu W, Deng C, Liao G, et al. CancerSEA: a cancer single‐cell state atlas. Nucleic Acids Res. 2019;47:D900–8. [DOI] [PMC free article] [PubMed] [Google Scholar]
- 23. Bindea G, Mlecnik B, Tosolini M, Kirilovsky A, Waldner M, Obenauf AC, et al. Spatiotemporal dynamics of intratumoral immune cells reveal the immune landscape in human cancer. Immunity. 2013;39(4):782–95. [DOI] [PubMed] [Google Scholar]
- 24. Cerami E, Gao J, Dogrusoz U, Gross BE, Sumer SO, Aksoy BA, et al. The cBio cancer genomics portal: an open platform for exploring multidimensional cancer genomics data. Cancer Discov. 2012;2(5):401–4. [DOI] [PMC free article] [PubMed] [Google Scholar]
- 25. Modhukur V, Iljasenko T, Metsalu T, Lokk K, Laisk‐Podar T, Vilo J. MethSurv: a web tool to perform multivariable survival analysis using DNA methylation data. Epigenomics. 2018;10(3):277–88. [DOI] [PubMed] [Google Scholar]
- 26. Huang H, Wang Y, Kandpal M, Zhao G, Cardenas H, Ji Y, et al. NFTO‐dependent‐methyladenosine modifications inhibit ovarian cancer stem cell self‐renewal by blocking cAMP signaling. Cancer Res. 2020;80(16):3200–14. [DOI] [PMC free article] [PubMed] [Google Scholar]
- 27. Piao X, You C, Byun YJ, Kang HW, Noh J, Lee J, et al. Prognostic value of BUB1 for predicting non‐muscle‐invasive bladder cancer progression. Int J Mol Sci. 2021;22(23):12756. [DOI] [PMC free article] [PubMed] [Google Scholar]
- 28. Wang L, Yang X, An N, Liu J. Bioinformatics analysis of BUB1 expression and gene regulation network in lung adenocarcinoma. Transl Cancer Res. 2020;9(8):4820–33. [DOI] [PMC free article] [PubMed] [Google Scholar]
- 29. Li Z, Zhang X. Kinases involved in both autophagy and mitosis. Int J Mol Sci. 2017;18(9):1884. [DOI] [PMC free article] [PubMed] [Google Scholar]
- 30. Wadowska K, Bil‐Lula I, Trembecki Ł, Śliwińska‐Mossoń M. Genetic markers in lung cancer diagnosis: a review. Int J Mol Sci. 2020;21(13):4569. [DOI] [PMC free article] [PubMed] [Google Scholar]
- 31. Xu Y, Lu L, Sun SH, Lin‐Ning E, Lian W, Yang H, et al. Effect of CT image acquisition parameters on diagnostic performance of radiomics in predicting malignancy of pulmonary nodules of different sizes. Eur Radiol. 2021;32(3):1517–27. [DOI] [PMC free article] [PubMed] [Google Scholar]
- 32. Roy B, Han SJY, Fontan AN, Jema S, Joglekar AP. Aurora B phosphorylates Bub1 to promote spindle assembly checkpoint signaling. Curr Biol. 2022;32(1):237–247.e6. [DOI] [PMC free article] [PubMed] [Google Scholar]
- 33. Yuan Y, Chen Z, Cai X, He S, Li D, Zhao W. Identification of hub genes correlated with poor prognosis for patients with uterine corpus endometrial carcinoma by integrated bioinformatics analysis and experimental validation. Front Oncol. 2021;11:766947. [DOI] [PMC free article] [PubMed] [Google Scholar]
- 34. Guo L, Mohd KS, Ren H, Xin G, Jiang Q, Clarke PR, et al. Phosphorylation of importin‐α1 by CDK1‐cyclin B1 controls mitotic spindle assembly. J Cell Sci. 2019;132(18):jcs232314. [DOI] [PMC free article] [PubMed] [Google Scholar]
- 35. Nowak E, Bednarek I. Aspects of the epigenetic regulation of EMT related to cancer metastasis. Cell. 2021;10(12):3435. [DOI] [PMC free article] [PubMed] [Google Scholar]
- 36. Rascio F, Spadaccino F, Rocchetti MT, Castellano G, Stallone G, Netti GS, et al. The pathogenic role of PI3K/AKT pathway in cancer onset and drug resistance. An updated review. Cancers. 2021;13(16):3949. [DOI] [PMC free article] [PubMed] [Google Scholar]
- 37. He Y, Sun MM, Zhang GG, Yang J, Chen KS, Xu WW, et al. Targeting PI3K/Akt signal transduction for cancer therapy. Signal Transduct Target Ther. 2021;6(1):425. [DOI] [PMC free article] [PubMed] [Google Scholar]
- 38. Nishiyama A, Nakanishi M. Navigating the DNA methylation landscape of cancer. Trends Genet. 2021;37(11):1012–27. [DOI] [PubMed] [Google Scholar]
- 39. Su D, Wu G, Xiong R, Sun X, Xu M, Mei Y, et al. Tumor immune microenvironment characteristics and their prognostic value in non‐small‐cell lung cancer. Front Oncol. 2021;11:634059. [DOI] [PMC free article] [PubMed] [Google Scholar]
- 40. Forde P, Kelly R, Brahmer J. New strategies in lung cancer: translating immunotherapy into clinical practice. Clin Cancer Res. 2014;20(5):1067–73. [DOI] [PubMed] [Google Scholar]
- 41. Hui L, Chen Y. Tumor microenvironment: sanctuary of the devil. Cancer Lett. 2015;368(1):7–13. [DOI] [PubMed] [Google Scholar]
- 42. Kim J, Bae J. Tumor‐associated macrophages and neutrophils in tumor microenvironment. Mediators Inflamm. 2016;2016:6058147. [DOI] [PMC free article] [PubMed] [Google Scholar]
- 43. Catacchio I, Scattone A, Silvestris N, Mangia A. Immune prophets of lung cancer: the prognostic and predictive landscape of cellular and molecular immune markers. Transl Oncol. 2018;11(3):825–35. [DOI] [PMC free article] [PubMed] [Google Scholar]
- 44. Talebian Yazdi M, van Riet S, van Schadewijk A, Fiocco M, van Hall T, Taube C, et al. The positive prognostic effect of stromal CD8+ tumor‐infiltrating T cells is restrained by the expression of HLA‐E in non‐small cell lung carcinoma. Oncotarget. 2016;7(3):3477–88. [DOI] [PMC free article] [PubMed] [Google Scholar]
- 45. Aktaş O, Öztürk AB, Erman B, Erus S, Tanju S, Dilege Ş. Role of natural killer cells in lung cancer. J Cancer Res Clin Oncol. 2018;144(6):997–1003. [DOI] [PMC free article] [PubMed] [Google Scholar]
- 46. Remark R, Becker C, Gomez JE, Damotte D, Dieu‐Nosjean MC, Sautès‐Fridman C, et al. The non‐small cell lung cancer immune contexture. A major determinant of tumor characteristics and patient outcome. Am J Respir Crit Care Med. 2015;191(4):377–90. [DOI] [PMC free article] [PubMed] [Google Scholar]
- 47. Wang S, Liu W, Ly D, Xu H, Qu L, Zhang L. Tumor‐infiltrating B cells: their role and application in anti‐tumor immunity in lung cancer. Cell Mol Immunol. 2019;16(1):6–18. [DOI] [PMC free article] [PubMed] [Google Scholar]
- 48. Zhang Y, Zhang Z. The history and advances in cancer immunotherapy: understanding the characteristics of tumor‐infiltrating immune cells and their therapeutic implications. Cell Mol Immunol. 2020;17(8):807–21. [DOI] [PMC free article] [PubMed] [Google Scholar]
- 49. Nyati S, Schinske‐Sebolt K, Pitchiaya S, Chekhovskiy K, Chator A, Chaudhry N, et al. The kinase activity of the ser/Thr kinase BUB1 promotes TGF‐β signaling. Sci Signal. 2015;8(358):ra1. [DOI] [PMC free article] [PubMed] [Google Scholar]
Associated Data
This section collects any data citations, data availability statements, or supplementary materials included in this article.
Supplementary Materials
TABLE S1. Immunohistochemical validation: correlation between BUB1 expression and clinicopathological characteristics
TABLE S2. Univariate and multivariate analyses of the factors correlated with overall survival of lung adenocarcinoma patients