

Abstract
Bile duct cancer (BDC) frequently invades the nerve fibers, making complete surgical resection difficult. A single tumor mass contains cells of variable malignancy and cell‐differentiation states, with cancer stem cells (CSCs) considered responsible for poor clinical outcomes. This study aimed to investigate the contribution of autosynthesized dopamine to CSC‐related properties in BDC. Sphere formation assays using 13 commercially available BDC cell lines demonstrated that blocking dopamine receptor D1 (DRD1) signaling promoted CSC‐related anchorage‐independent growth. Additionally, we newly established four new BDC patient‐derived organoids (PDOs) and found that blocking DRD1 increased resistance to chemotherapy and enabled xenotransplantation in vivo. Single‐cell analysis revealed that the BDC PDO cells varied in their cell‐differentiation states and responses to dopamine signaling. Further, DRD1 inhibition increased WNT7B expression in cells with bile duct‐like phenotype, and it induced proliferation of other cell types expressing Wnt receptors and stem cell‐like signatures. Reagents that inhibited Wnt function canceled the effect of DRD1 inhibition and reduced cell proliferation in BDC PDOs. In summary, in BDCs, DRD1 is a crucial protein involved in autonomous CSC proliferation through the regulation of endogenous WNT7B. As such, inhibition of the DRD1 feedback signaling may be a potential treatment strategy for BDC.
Keywords: bile duct cancer, cancer stem cells, dopamine D1 receptors, organoids, single‐cell analysis
Single‐cell analysis revealed that the Bile duct cancer patient‐derived organoid cells varied in their cell‐differentiation states and responses to their autosynthesized dopamine. Further, DRD1 inhibition increased WNT7B expression in cells with bile duct‐like phenotype, and it induced proliferation of other cell types expressing Wnt receptors and stem cell‐like signatures.

Abbreviations
- BDC
bile duct cancer
- CSCs
cancer stem cells
- DRD1
dopamine receptor D1
- PDOs
patient‐derived organoids
- qRT‐PCR
quantitative real‐time polymerase chain reaction
- scRNA‐seq
single‐cell RNA‐sequence
- P/S
penicillin–streptomycin mixed solution
- bFGF
recombinant human fibroblast growth factor‐basic
- EGF
human epidermal growth factor
- KD
knockdown
- TCGA
The Cancer Genome Atlas
- KEGG
Kyoto Encyclopedia of Genes and Genomes
1. INTRODUCTION
Bile duct cancer (BDC) has a low 5‐year survival rate of only 7%–20% and a high postoperative recurrence rate of approximately 60%. 1 Further, over 75% of symptomatic cases are ineligible for complete resection. 2 A single cancer tumor comprises numerous cells with different degrees of malignancy, 3 with cancer stem cells (CSCs) considered the “root of recurrence and metastasis.” Consequently, CSCs have been set as critical therapeutic targets, particularly in hematopoietic malignancies or solid tumors, such as breast, brain, and colon cancers. 4 Since the 2010s, a phenomenon called CSC plasticity has been highlighted. Non‐CSCs can convert their phenotype into CSCs in limited conditions, and the surrounding environment is called the CSC niche. 5 , 6 , 7 Thus, CSC niche‐targeting therapy is gaining significant attention. 8 However, in BDCs, although biomarkers for cancer stem‐like properties have been reported, 9 , 10 the mechanisms by which the niche regulates CSC plasticity remain to be elucidated. 11
Anatomically, the nerve fibers run parallel to the bile ducts, and the high rate of neural invasion (56.0%–88.0%) is a critical factor for the poor prognosis of BDCs. 12 , 13 , 14 As such, BDCs are sometimes referred to as “neurotropic cancers.” 15 Further, recent studies show that both the malignant behavior of BDC and normal bile duct development are affected by neurotransmitters. 13 , 15 , 16 , 17 Notably, BDC cells synthesize dopamine by themselves under epigenetic regulation. 16 , 18 In acute myeloid leukemia, breast cancer, or non‐small lung carcinoma, dopamine signaling contributes to CSC homeostasis. 19 , 20 , 21 However, the contribution of dopamine signaling to BDC CSC has not been elucidated thus far.
Patient‐derived organoids (PDOs) are a novel cell resource cultured in 3D gels in vitro, retaining features of the original tumor in vivo containing CSCs and non‐CSCs. 22 , 23 Therefore, PDOs are advantageous for examining tumor heterogeneity with in vitro interventional experiments. This study aimed to elucidate the contribution of autosynthesized dopamine to CSC‐related properties using four BDC PDOs.
2. MATERIALS AND METHODS
2.1. Cell culture
Commercially available cells were obtained from RIKEN, the Japanese Collection of Research Bioresources Cell Bank, or the American Type Culture Collection. The short tandem repeat analysis for cell line authentication and mycoplasma non‐contamination test had been performed by each cell bank before shipment. Details about Cat#, RRID, and culture conditions are given in Table S1.
2.2. Sphere culture conditions and sphere formation assay
For sphere culture, cells were dissociated with TrypLE Express enzyme (Invitrogen), filtered through a 35‐μm cell strainer (Corning), and seeded in ultralow attachment six‐well plates (Corning; 10,000 cells per well) with serum‐free DMEM/Ham's F‐12 (Nacalai Tesque). DMEM was supplemented with 1× B27 Supplement (Thermo Fisher Scientific), 10 ng/mL recombinant human fibroblast growth factor‐basic (Thermo Fisher Scientific), 20 ng/mL recombinant human epidermal growth factor (EGF; Thermo Fisher Scientific), and 1% penicillin/streptomycin mixed solution (P/S; Nacalai Tesque). Spheres were passaged after 5–7 days. After two passages, cells were used for sphere formation assays or mRNA extraction. In sphere formation assays, dissociated and filtered cells were cultured in ultra‐low attachment 24‐well plates (Corning; 2000 cells per well) with a medium containing each reagent (DMSO and/or D1 inhibitor (SKF‐83566, Abcam) and/or porcupine inhibitor (LGK974, Cayman Chemical Company)). On day 2, half the amount of medium with reagent was added. Spheres were imaged using the microscope IX73 (Olympus). On day 5 or 6, spheres larger than 75 μm in diameter were counted using Cell3Imager CC5000 (SCREEN Holdings).
2.3. Patient‐derived organoid culture
Patient‐derived organoids were established from fresh surgical specimens obtained from patients who underwent surgical resection at Kyoto University Hospital. Primary tumor tissue samples were processed as previously described with slight modifications. 24 , 25 , 26 , 27 , 28 The cell aggregates were embedded in Matrigel (Corning) and covered by a conditioned medium composed of 50% L‐WRN (ATCC Cat# CRL‐3276, RRID: CVCL_DA06; containing Wnt3A, R‐spondin 3, and Noggin), advanced DMEM/F12 (Invitrogen), 5% FBS (Cytiva), 2 mmol/L L‐Alanyl‐L‐Glutamine (Wako), 1% P/S, 2.5 μg/mL plasmocin prophylactic (Invitrogen), 10 μM Y‐27632 (Wako), 1× B27 Supplement, 100 ng/mL basic FGF, and 20 ng/mL EGF, denoted as “niche‐enriched.” The medium containing advanced DMEM/F12, 5% FBS, 2 mmol/L L‐Alanyl‐L‐Glutamine, and 1% P/S was called “niche deficient.” Used PDOs were passaged fewer than 35 times.
2.4. Organoid formation assay
Patient‐derived organoids were dissociated into single cells using TrypLE Express Enzyme, filtered through a 35‐μm cell strainer, and cultured in 48‐well plates (250 cells per 5 μL Matrigel per well, with 2 μL Matrigel embedded a priori so that PDOs did not spread to the bottom) with the medium changed twice weekly. Images of PDOs were recorded using microscope IX73. On days 10–15, PDOs greater than 75 μm in diameter were counted using Cell3Imager CC5000 with a multiplanar scanning option.
2.5. RT‐PCR
Total RNA extraction, single‐strand complementary DNA synthesis, and qRT‐PCR were performed in triplicate as previously described. 27 The relative quantification of each target, normalized to an endogenous control (GAPDH), was performed using the comparative Ct method. Table S2 lists the primer sequences. Further details are given in the Supplementary Methods.
2.6. ShRNA‐mediated human DRD1 gene knockdown by lentiviral transduction
ShRNA‐mediated knockdown (KD) was performed as described previously. 27 The two predesigned DRD1‐targeting shRNA (A:TRCN0000356937, 5‐ ccggTTATGCCTTTAATGCTGATTTctcgagaaatcagcattaaaggcataatttttg‐3, B:TRCN0000230254, 5‐ ccggTATCAGTCATATTGGACTATGctcgagcatagtccaatatgactgatatttttg‐3) were used. At 48–72 h after viral infection, the cells were treated with a medium containing puromycin (Invitrogen) at 1–5 μg/mL for 2 weeks to eliminate the non‐infected cells. Further details are provided in the Supplementary Methods.
2.7. Xenograft assay
NOD/SCID mice were purchased from the Charles River Laboratories Japan. Cultured BDC cells including spheres were dissociated with TrypLE Express enzyme, centrifuged, and resuspended in iced PBS. PDO cells were dissociated with TrypLE Express enzyme, centrifuged, and resuspended in an iced “niche‐deficient” medium at a concentration of 105 or 106 in 50 μL. For subcutaneous transplantation, cells were injected into the flanks of 8–12‐week‐old NOD/SCID mice (PDO cell suspension was mixed with Matrigel [50% vol/vol]). The tumor constructions were examined by peeling off the skin. For spleen injection, 29 the NOD/SCID mice were anesthetized using isoflurane, and a 1.5‐cm left‐sided transverse laparotomy was performed to open the abdominal cavity. Cells were injected into the spleen using a 27‐gauge needle. Tumor cells were allowed to circulate for 10 min, and the spleen was resected. For peri‐sciatic nerve xenograft, 30 NOD/SCID mice were anesthetized, and a 1.5‐cm incision exposed their sciatic nerves. The cell mixture with Matrigel (50% vol/vol) was injected at the space of the branch of the tibial and sural nerves.
2.8. Chemoresistance assay
Patient‐derived organoids were dissociated and cultured in V‐bottom 96‐well plates (nerbe plus; 2000 cells in 4 μL of Matrigel per well, covered by a “niche‐enriched” medium). After 3 days, the medium was changed into a “niche‐enriched” or “niche‐deficient” medium (medium change, twice weekly). On days 7–10, PDOs were treated with gemcitabine hydrochloride (Tokyo Chemical Industry), cisplatin (Wako), or 5‐fluorouracil (Nacalai Tesque). Subsequently, after 3 days, the medium was changed to 100 μL of “niche‐deficient” medium with 10 μL of CCK‐8 (Dojindo Labs). After incubation for 2 h, each medium was transferred to a new 96‐well plate, and the optical absorbance at a wavelength of 450 nm was measured using the plate reader Infinite F50 (TECAN).
2.9. scRNA‐seq
Dissociated PDO cells in Matrigel were plated on a Matrigel‐precoated six‐well plate (10,000 cells per well) and cultured in a niche‐enriched medium with DMSO or D1 inhibitor (SKF‐83566 4 μM) with the medium changed twice weekly. After 14 days, the cells were dissociated, and scRNA‐seq was conducted using the 10X Genomics Chromium Single Cell 3′ Gene Expression kit. Further details, including sequencing and bioinformatics, are given in Supplementary Methods.
2.10. Statistical analysis
Values were presented as the mean ± standard error of the mean when data distribution was assumed to be normal (not formally tested); otherwise, a box plot was used. Student's t‐test (two‐tailed unpaired or paired), the Wilcoxon rank‐sum test, or Tukey's test was used to compare groups as appropriate. All statistical analyses were performed using R (v.3.6.2) with R package multcomp (v.1.4–17). The p‐values were as follows: ****p < 0.0001, ***p < 0.001, **p < 0.01, *p < 0.05, and n.s. > 0.05.
3. RESULTS
3.1. Blocking of DRD1 increases bile duct cancer sphere formation
To find cell lines that followed the CSC plasticity model, sphere formation assays were applied to 13 commercially available BDC cell lines (Figure 1A and Figure S1A). In general, most monolayer‐cultured cells are non‐CSC‐like, and sphere culture can enrich CSC‐like cells as spherical aggregates called spheres, with non‐CSC‐like cells suspended as single cells. 22 , 31 , 32 The cell lines were divided into the following two groups according to the types of sphere formation: (1) a convertible type that formed spheres only in sphere culture (NOZ, KKU213, TYGBK1, TYBDC1, HuCCA1, HuCCT1, and TKF1) and (2) an unconvertible type that formed no or few small spheres (KKU055, KKU100, OCUG1, G415) or formed aggregates in either condition (OZ, TYGBK8; Figure 1A and Figure S1B). It was inferred that the convertible type lines were more likely to retain CSC plasticity than the unconvertible type.
FIGURE 1.
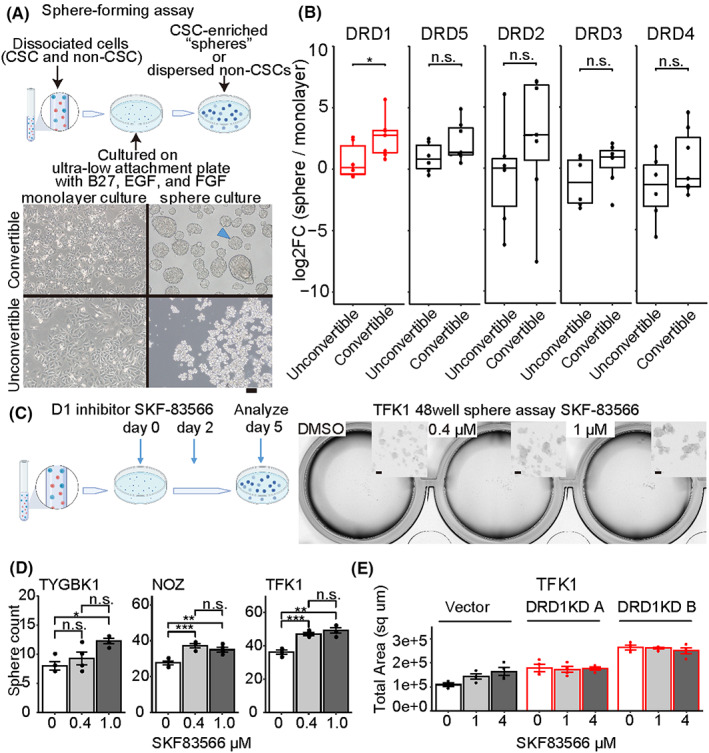
Sphere formation assay depicting increased spheres with DRD1 inhibition. (A) Schematic picture of sphere formation assay, enriching cancer stem cells (CSCs) (blue dots) out of a mixture of CSC (blue dots) and non‐CSC cells (red dots) (top). Examples of a convertible line (TYGBK1), an unconvertible line (KKU‐100) (down), and a typical “sphere” (arrowhead). Scale bar, 100 μm. (B) Change in mRNA expression of dopamine receptors from monolayer culture to sphere culture quantified via qRT‐PCR. Each value is calculated as the median of the triplicate. Comparison using Wilcoxon rank‐sum test. DRD1: median log2Foldchange (FC) of 2.8 in convertible and of 0.14 in “unconvertible,” p = 0.035. (C) Schematic picture of sphere formation assay (left). Examples of microscopic images of spheres (right). Scale bar, 100 μm. (D) Sphere formation assay with D1 inhibitor (SKF‐83566 0.4 μM, 1 μM or DMSO) using TYGBK1, NOZ, and TFK1. Tukey's test is used. n = 4. (E) Sphere formation assay with D1 inhibitor (SKF‐83566 1 μM, 4 μM or DMSO) using vector‐induced or DRD1‐knockdown (KD) TFK1s n = 4
Expressions of pluripotency‐associated genes (i.e., NANOG, SOX2, and POU5F1/OCT4) and the recently reported slow‐cycling CSC marker PROX1 33 were confirmed to be elevated in the convertible type (Figure S2A). In addition, “convertible type” sphere cells had higher tumorigenic potential than monolayer‐cultured cells in vivo (Figure S2B). Then, the dopamine autosynthesis capacity of BDC was confirmed by mRNA expression of dopamine synthesis genes (TH and DDC) and quantification of dopamine levels by enzyme‐linked immunosorbent assay (ELISA; Figure S3). The expression of TH, the rate‐limiting enzyme for dopamine synthesis, was higher in the convertible type than in the unconvertible type. These data suggested that these convertible‐type BDC cell lines (NOZ, KKU213, TYGBK1, TYBDC1, HuCCA1, HuCCT1, and TKF1) followed the CSC plasticity model with higher dopamine autosynthesis capacity.
Additionally, to explore the functions of dopamine receptors in CSCs, we evaluated the expressions of genes of five dopamine receptor subtypes (D1‐like: DRD1 and DRD5; D2‐like: DRD2, DRD3, and DRD4) in conditions of the sphere and monolayer culture. The results showed that DRD1 was the most upregulated in convertible‐type spheres (Figure 1B). A selective D1 receptor inhibitor (SKF‐83566) was applied to the sphere formation assay of three convertible‐type lines that had the highest sphere‐forming ability (TYGBK1, NOZ, and TFK1; Figure S1A). The D1 inhibitor increased the number of spheres (Figure 1C,D). The involvement of DRD1 was confirmed using DRD1‐KD (Figure 1 E and Figure S2C). In summary, these results suggested that blocking of D1 signaling enhanced the CSC niche of BDC.
3.2. Blocking of DRD1 signaling augments patient‐derived organoids initiation in vitro
To validate the above results with more clinically relevant resources, four BDC PDOs were newly established from fresh surgical specimens (Sph18‐08, Sph18‐16, Sph18‐22, and Sph18‐29; Table 1). Each PDO had genetic variants characteristic of BDCs (Figure S4 and Table S3). The main mutations had a variant allele frequency of 50% or 100% (heterozygous or homozygous mutation), suggesting PDOs contained only tumor cells. The dopamine autosynthesis capacity in these PDOs was confirmed by qRT‐PCR and ELISA (Figure S3).
TABLE 1.
Clinical information of the established BDC PDOs
| Number | Age | Sex | Tumor location | Histology | TNM staging by AJCC/UICC (8th) | Clinical IHC results |
|---|---|---|---|---|---|---|
| sph18‐08 | 69 | Male | Distal | well | T3N1M0 | p53+ > 95%, IMP3+ 50% |
| sph18‐16 | 76 | Female | Gallbladder | mod | T2aN1M0 | None |
| sph18‐22 | 79 | Female | Intrahepatic | mod | T1aN0M0 | Focally p53 + <5% claudin4+, IMP3+ |
| sph18‐29 | 73 | Female | Distal | mod | T3N1M0 | None |
Abbreviations: AJCC, American Joint Committee on Cancer; BDC, bile duct cancer; IHC, Immunohistochemistry; mod, moderately differentiated tubular adenocarcinoma; PDO, patient‐derived organoid; well, well‐differentiated tubular adenocarcinoma; UICC, International Union Against Cancer.
Organoid formation assays were performed to evaluate the organoid‐initiating cell frequency, and D1 inhibition or KD of DRD1 increased the size and number of PDO initiations (Figure 2 and Figures S5A‐D). Additionally, after long‐term incubation over 2 weeks with D1 inhibition, the PDOs developed into unique warty shapes, whereas the control PDOs remained spherical in shape (Figure 2A). These results suggested that DRD1 inhibition enhanced reconstruction and growth of PDOs through the high tumor‐initiating ability of CSC‐like cells in PDOs.
FIGURE 2.
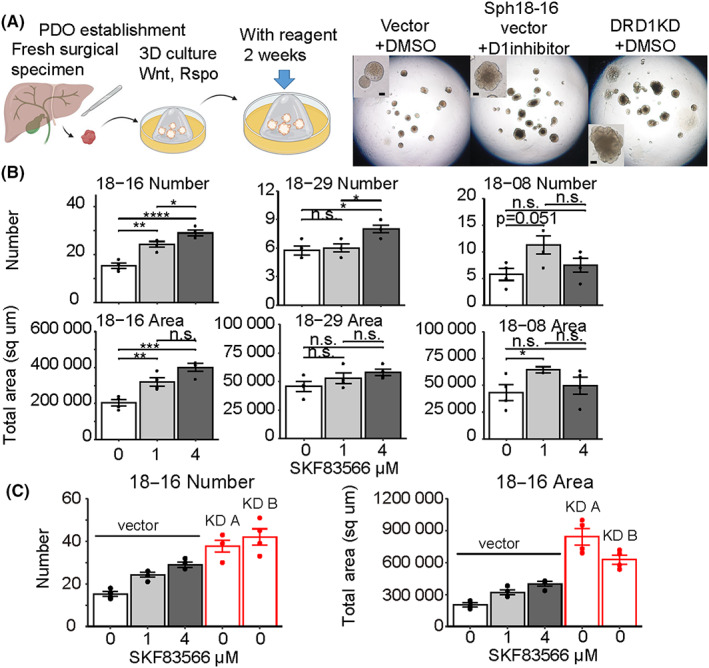
Distinct patient‐derived cancer organoid (PDO) formation with D1 inhibitor or DRD1 KD. (A) Schematic picture of PDO establishment and organoid formation assay (left). Examples of microscopic images of PDOs cultured for 17 days (right). Scale bar, 100 μm. (B) Organoid formation assay with D1 inhibitor (SKF‐83566 1 μM, 4 μM, or DMSO) using Sph18‐08, 16, 29. Tukey's test is used. n = 4. (C) Organoid formation assay with D1 inhibitor using vector‐induced or DRD1‐KD Sph18‐16 n = 4
3.3. Single‐cell RNA‐sequence analysis revealed cancer stem cell‐like and dopamine‐responsive cells in patient‐derived organoids
To detect how CSCs were enhanced in D1‐inhibited PDOs, scRNA‐seq with and without D1 inhibitor was conducted (Figure 3A). Several cell clusters with various cell cycle states were observed. Given the expressional bias in proliferating cells, 34 five cell clusters were further analyzed, most of which were cells in the G0/1 phase (Figure 3A right and Figure S6A‐C). Three kinds of cells were found: (1) B1 and B2 with bile duct‐like signatures, (2) H with hepatocyte‐like signatures, and (3) INT1 and INT2 with intermediate signatures of the two. 35 , 36 , 37 INT1, INT2, and H also expressed genes showing duodenal‐stem‐like signatures (Figure 3B). 38 In addition, B1 and B2 cells exhibited lower expression of genes related to gemcitabine, fluorouracil, doxorubicin, and docetaxel resistance, supporting that these cells were less CSC‐like than were INT1, INT2, and H (Figure S7A).
FIGURE 3.
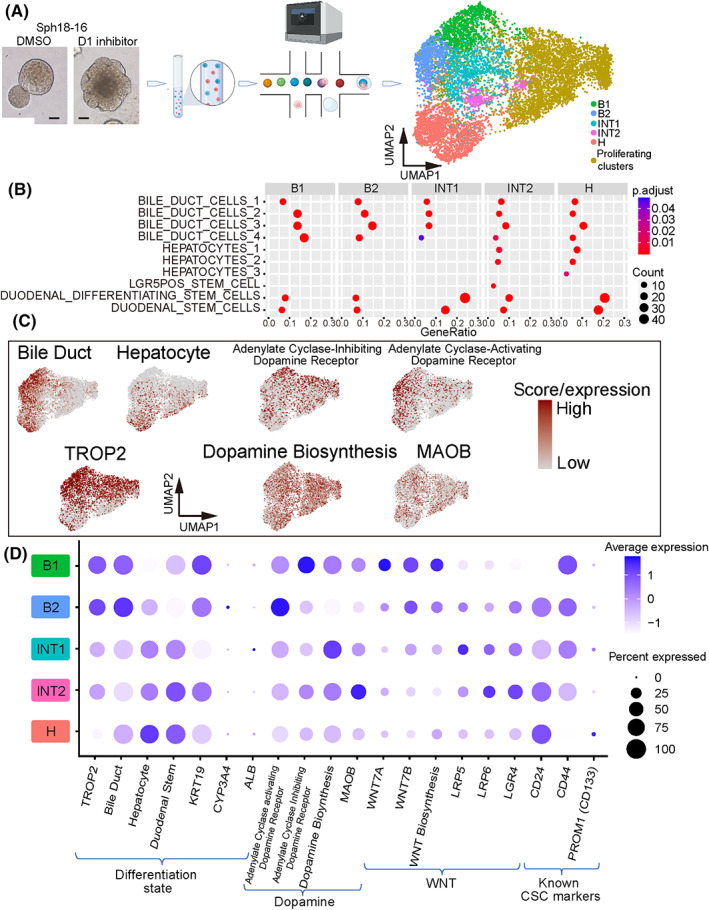
ScRNA‐seq of PDO Sph18‐16. (A) Schema of scRNA‐seq (left) and clusters shown in Uniform Manifold Approximation and Projection (UMAP) (right). (B) Dot plot of enrichment analysis for each cluster. Gene sets related to hepato‐biliary development or stem cells derived from MSigDB:C8 are listed. The color of the dots represents the adjusted p‐value, and the diameter represents the count of enriched genes. Results of adjusted p < 0.05 are shown. (C) Feature plots of each gene signature score and expression of TROP2 and MAOB. (D) Expressions of genes or gene signature scores of the five clusters. Table S6 shows the details of the gene sets
Analysis of cell type‐specific surface markers showed that TROP2 (TACSTD2), a cell surface glycoprotein, was more highly expressed in B1 and B2 cells than in INT1 and INT2 cells, while its expression was the lowest in H cells (Figure 3C,D and Table S4). Additionally, FACS‐sorted TROP2high cells exhibited decreased organoid‐initiating cell frequency and less plasticity to be TROP2low (Figure S7B‐D). This was consistent with a previous report that CD24+/CD44+ cells (INT cells, Figure 4D) had CSC‐like potency in extrahepatic cholangiocarcinomas. 10 Both results suggested that PDOs contained different cell types represented by B, INT, and H clusters, among which INT and H cells revealed stem‐like features.
FIGURE 4.
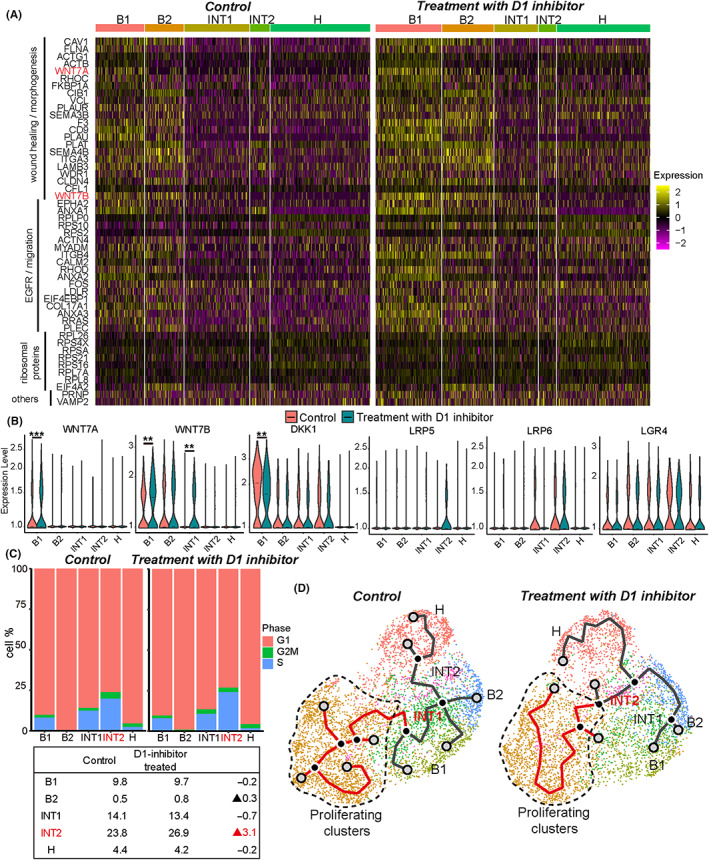
ScRNA‐seq analysis comparing control (DMSO) and D1 inhibitor (SKF‐83566 4 μM) treatment. (A) Heatmap visualization of the 50 most frequently appearing upregulated genes in D1 inhibitor‐treated Sph18‐16 sample by enrichment analysis using all GOBP terms. The details are provided in Table S5. (B) Violin plots depicting the expression of genes compared with control (red) and D1 inhibitor‐treated sample (green). Bar indicates the median value. Adjusted p‐value for B1 of WNT7A, 0.00058; B1 of WNT7B, 0.0029; INT1 of WNT7B, 0.0013; B1 of DKK1, 0.0018. (C) Proliferating cells of each cluster in control or D1 inhibitor‐treated sample (top). Listed percentages of cells in S and G2/M phases of each cluster (down). (D) Trajectories showing INT1 as the center in DMSO and INT2 in D1 inhibitor treatment
Additionally, B1 and B2 cells exhibited higher expression of genes related to dopamine responsiveness of “adenyl‐cyclase‐activating” or “adenyl‐cyclase‐inhibiting” (Figure 3C,D). Varying protein expression levels of KRT19 (bile duct marker), PROX1 (hepatocyte marker), and DRD1 in a PDO were confirmed via immunohistochemistry (Figure S8A). In the original surgical specimen of Sph18‐16, DRD1 expression overlapped with TROP2 in epithelial‐like cells (Figure S8B). In addition, dopamine production among cells appeared to vary according to the expression of MAOB, a gene responsible for dopamine metabolism (Figure 3C,D, Figure S8C). This heterogeneity of dopamine responsiveness was also confirmed in another PDO, Sph18‐29 (Figure S9A‐D). Further, the expression of TROP2, the B cluster marker, was correlated to the gene signature associated with the dopamine D1 receptor in The Cancer Genome Atlas (TCGA) cholangiocarcinoma cohort (Figure S9E). These results indicated that TROP2‐marked B cluster cells could be more dopamine‐reactive than INT or H cells.
3.4. WNT7B is produced by B subtypes and enhanced by D1 inhibition
To explore the cause of CSC enhancement by D1 inhibition, we performed enrichment analysis and compared control and D1 inhibitor‐treated samples with all gene sets of GO‐term BP. Three significant pathways with high enrichment of highly expressed genes in D1 inhibitor‐treated cells were identified: EGFR signaling, ribosomal proteins, and wound healing or morphogenesis (Figure 4A and Table S5). EGFR signaling is reported to be associated with cholangiocarcinoma plasticity, and its upregulation is concordant to enhancement of CSCs. 1 In addition, increased ribosomal protein might be interpreted as enhancement of cell proliferation. The current study focused on upregulated WNT7A/7B in wound healing‐related genes because WNT7A/B could be the cause of increased proliferation or CSC‐like potential. 26 , 39 , 40
Further, the expression of WNT7A/7B was higher in B cells, whereas expressions of the receptor or coreceptor genes of Wnt (LRP5, LRP6, and LGR4) were higher in INTs, the suspected CSC subtyped cells (Figure 3D). D1 inhibitor treatment increased WNT7A/7B expression in B1 and INT1 cells and decreased the expression of DKK1, a negative regulator of Wnt signaling. In contrast, the expressions of LRP5, LRP6, and LGR4 showed no significant changes (Figure 4B). The increased expression of WNT7B in TROP2‐positive cells was confirmed by confocal immunofluorescent image (Figure S10A). Additionally, D1 inhibitor treatment‐induced increase in gene expression related to Wnt signaling was most evident in INT2 cells (Figure S10B). Wnt signaling is related to the self‐renewal of CSCs, 41 and D1 inhibition‐induced increase in their proliferating population was most pronounced in INT2 cells (Figure 4C). Thus, it is supposed that increased WNT7A/7B by D1 inhibition in B cells promoted INT cell proliferation.
Trajectory analyses identified that INT cells were centered and branched into B, H, and proliferating clusters (Figure 4D), suggesting a cellular hierarchy with INT cells at the top. D1 inhibitor treatment shifted the center from INT1 to INT2, which also supported the above deduction that D1 inhibition promoted INT2 proliferation. Heterogeneous WNT7B expression in original surgical specimens was confirmed in Sph18‐16 and 18–29 (Figure S10C). However, PDO Sph18‐29 did not express WNT7A (Figure S9C). Further, in the TCGA datasets, the WNT7A expression level was not higher in BDCs than that in normal tissue (Figure S10D). In contrast, WNT7B expression was the highest in the Wnt gene family (Figure S10D). Hence, we assumed that WNT7B is the main possible CSC niche factor involved in D1 inhibition.
3.5. Effect of D1 inhibitor depends on Wnt autosignaling
To elucidate the contribution of Wnt overexpression under DRD1‐regulated control in BDC cell proliferation, Wnt signaling was blocked via the porcupine inhibitor LGK974. Porcupine is an endoplasmic reticulum transmembrane protein essential for the processing and correct localization of Wnt proteins, and this was initially confirmed in PC12 rat neuronal cells. 42 , 43 In sphere assays of TYGBK1, NOZ, and TFK1, LGK974 canceled the increase of sphere formation by D1 inhibition (Figure 5A). Similar results with LGK974 were confirmed in three PDOs: Sph18‐08, Sph18‐16, and Sph18‐29 (Figure 5B and Figure S11A). To identify the mechanism of increased WNT7B by D1 inhibition, a Kyoto Encyclopedia of Genes and Genomes (KEGG) pathway map analysis was performed in B1 cells (Figure S11B).
FIGURE 5.
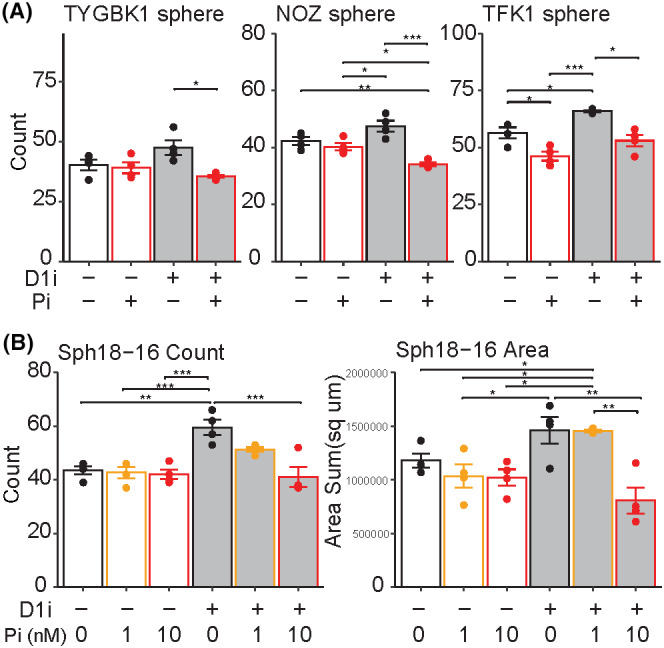
Autosignaling of Wnt as downstream of D1 inhibition. (A) Sphere formation assay with D1 inhibitor (SKF‐83566 0.4 μM for NOZ and TFK1, 1 μM for TYGBK1, or DMSO) and porcupine inhibitor (LGK974 1 nM for NOZ and TFK1, 10 nM for TYGBK1 or DMSO). Tukey's test is used, n = 4. D1i, D1 inhibitor; Pi, porcupine inhibitor. (B) Organoid formation assay of Sph18‐16 with D1 inhibitor (SKF‐83566 4 μM or DMSO) and porcupine inhibitor (LGK974 1 nM,10 nM or DMSO). Tukey's test is used, n = 4. Results of Sph18‐08 and 29 are shown in Figure S11A.
The results showed increased c‐FOS expression downstream of dopamine receptors. C‐FOS is known to be increased by ERK. 44 In studies of osteosarcoma, in which D1 inhibitors or DRD1‐KD increased its proliferation, a D1 inhibitor increased ERK1/2 activity, 45 and FOS directly controlled the expression of endogenous WNT7B. 46 Similarly, increased c‐FOS expression downstream of ERK was confirmed in B1 cells in the current study (Figure S11C). In the TCGA dataset, the gene signature of DRD1 was correlated to that of ERK and so was that of ERK and FOS, or FOS and WNT7B (Figure S11D). Further, higher expression of WNT7B was a poor prognostic factor in BDC (Figure S11E). These results suggested that increased WNT7B by D1 inhibition was mediated by ERK‐FOS signaling.
3.6. Effect of D1 inhibition is pronounced in the absence of the exogenous cancer stem cell niches
Thus far, we have found that the autosynthesized dopamine of BDCs affected their endogenous Wnt signaling. Lastly, the effects of D1 inhibition were examined in different microenvironments. Given that BDCs are neurotropic cancers, comparative xenotransplantation assays with DRD1‐KD PDOs were performed in three different sites in the NOD‐SCID mouse: peri‐sciatic nerve, subcutaneous, and spleen (Figure 6A). In peri‐sciatic nerve xenografts, the efficacy of tumor initiation was similar between the vector and DRD1‐KD PDOs (7/10 and 8/10; Figure 6A and Figure S12A). However, the size of the masses was larger in DRD1‐KD PDOs (Figure 6B). Additionally, most of the vector PDO (6/7) formed masses only along the nerves (Figure 6B arrowhead), whereas DRD1‐KD PDOs could grow away from the nerves (5/8). Tumor initiation of subcutaneous and splenic injected cells was lower than that of peri‐sciatic‐nerve transplanted cells, but only DRD1‐KD PDO cells formed subcutaneous mass or lung metastasis (Figure 6A,C). Similar findings were confirmed with another PDO (Figure S12B). These results suggested that the neural‐related niche could also enhance CSCs and that the effect of D1 inhibition was more pronounced in their absence.
FIGURE 6.
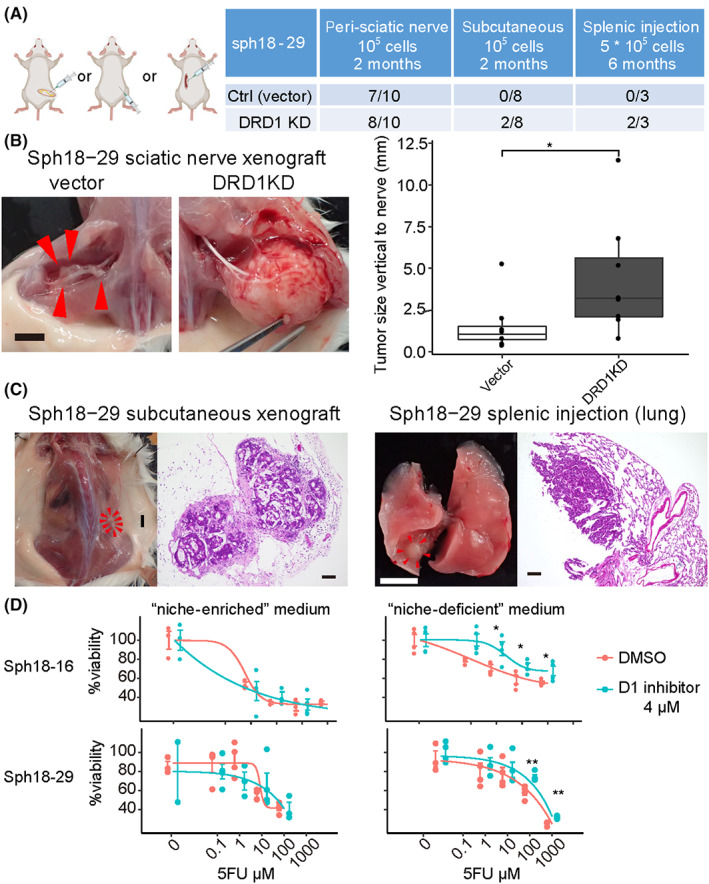
D1 inhibition enhancing cancer stem cell (CSC)‐related capacities in the absence of exogenous niches. (A) Peri‐sciatic nerve xenograft, subcutaneous xenograft, and splenic injection assay of Sph18‐29. Vector or two independent DRD1‐targeting shRNA is transduced to Sph18‐29. Table of the result (right). (B) Gross images of xenografted tumor in the peri‐sciatic nerve (left). Control patient‐derived cancer organoid (PDO tumor forming only along the nerves (arrowhead). Scale bar, 5 mm. The tumor size vertical to the nerve (mm) is measured (right). Wilcoxon rank‐sum test is used. (C) Macroscopic and HE‐stained histological images of a subcutaneously xenografted tumor and lung metastasis of DRD1‐KD sph18‐29. Scale bar, 5 mm in macroscopic images and 100 μm in histological images. (D) CCK8 proliferation assay of Sph18‐16, 29 with 5FU in the niche‐enriched or niche‐deficient medium, n = 4. The result of cisplatin and gemcitabine is shown in Figure S12C. Two‐tailed unpaired Student's t‐test is used at each concentration
Given that the organoid culture medium contained neural stem cell‐related niche factors such as B‐27 supplement 47 or Wnt3a, 48 we next examined chemoresistant proliferation, another CSC‐related property, with PDOs precultured with D1 inhibitor in niche‐enriched and niche‐deficient media. In the niche‐enriched medium, there was no difference in chemoresistance between the D1 inhibition and control groups; however, in the “niche‐deficient” medium, chemoresistance was enhanced by D1 inhibition in two PDOs with three cytotoxic reagents (5FU, cisplatin, and gemcitabine; Figure 6D and Figure S12C). Therefore, neural‐related niche factors and D1 inhibition might partially overlap in enhancing CSC‐related properties, and this is consistent with our result that D1 inhibition increased CSC proliferation via Wnt signaling (Figure 7).
FIGURE 7.
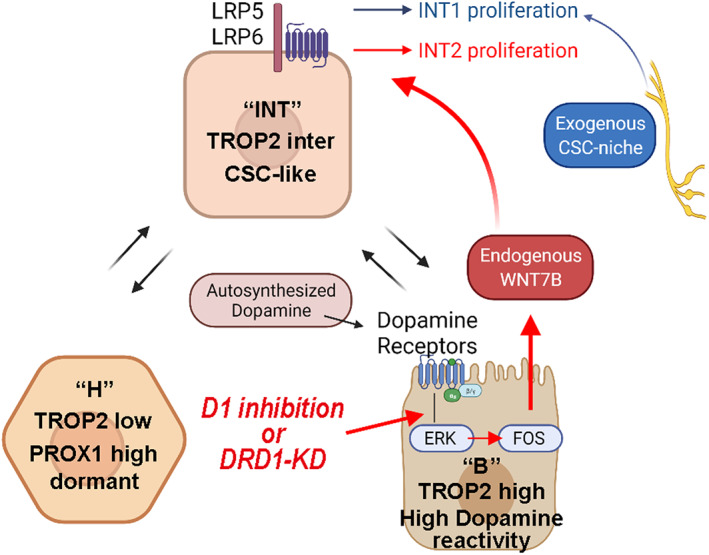
Schematic illustrations depicting variations of B, INT, H clusters, and WNT7B as endogenous cancer stem cell (CSC) niche downstream of DRD1‐ERK‐FOS
4. DISCUSSION
The genetic landscape of BDC is comparatively broad, and the common nongenetic mechanism causing therapeutic resistance has not been elucidated. 1 The current study, using single‐cell analysis of clinical human materials, describes a spectrum of cell‐differentiation states from bile duct‐like to hepatocyte‐like differentiation, including intermediate clusters such as CSCs. The findings are consistent with a previous report indicating similarity between differentiating lineages of tumor and normal tissue development. 3 A previous study with scRNA‐seq of normal liver tissue showed that TROP2 expression was negatively correlated with hepatocyte fate. 37 In our analysis, TROP2high was inferred as a bile duct‐like cell marker and TROP2inter or TROP2low as markers for suspected CSC‐like cells. PROX1 is a stable hepatocyte marker, 49 and our scRNA‐seq confirmed its expression in the hepatocyte‐like cluster (Table S4E), although “hepatocyte‐like” was a relative signature with low expression of the developed hepatocyte markers CYP3A4 and ALB (Figure 3D). Another report described PROX1 as a marker for dormant CSC. 33 Consistently, the current study found that hepatocyte‐like clusters with the signature of duodenal stem genes (Figure 3B,D) had less proliferative fractions (Figure 4C). Conclusively, TROP2 and PROX1 are potential markers for analyzing BDC heterogeneity.
Using sphere/organoid formation assays focusing on autosynthesized dopamine, the current study identified DRD1 signaling as a potential regulator of CSCs. Additionally, ScRNA‐seq analysis showed that D1 inhibition increased WNT7B expression in bile duct‐like cells, resulting in the proliferation of CSC‐like INT2 cells. This is in contrast with the self‐inhibition of SP cell expansion by SFRP4, secreted from non‐SP cells in B‐cell lymphoma. 50 Thus, BDCs might monitor autosynthesized dopamine by DRD1, with its low signaling leading to the autonomous proliferation of CSCs via increased endogenous WNT7B levels.
For the detailed molecular mechanism, we developed a cascade of DRD1‐ERK‐FOS‐WNT7B based on KEGG pathway map analysis and previous reports 44 , 45 , 46 and confirmed its clinical relevance in the TCGA dataset (Figures S9E and S11D,E). The scRNA‐seq analysis did not detect mRNA expression of DRD1 in many populations, although DRD1 protein expression was confirmed in Western blotting or immunohistochemistry (Figures S5B,D, S8A,B, and S9D). This result may be attributed to the technical limitation of detecting low or continuously expressed protein mRNA at a single‐cell level. 51 Thus, gene signature analysis was used to evaluate DRD1 signaling activity. In the BDC cohort of TCGA, higher expression of WNT7B was a poor prognostic factor (Figure S11E), and there were expressional correlations among WNT7B, FOS, ERK signaling and DRD1‐related genes (Figure S11D). This suggested the clinical relevance of DRD1‐ERK‐FOS‐WNT7B cascade in the entire BDC cohort.
However, BDCs are heterogenous in their genetic backgrounds, and their individual reactivities to dopamine or WNT7B may vary. In the current study, 2 of the 13 commercially available BDC cell lines, TYGBK8 and OZ, form sphere‐like aggregates even in 2D culture condition with a high expressional level of CSC‐related genes (Figure S13A). The number of spheres was also increased in TYGBK8 under low‐dose D1 inhibitor treatment but not in OZ (Figure S13B). This might imply that the CSC capacity of OZ did not depend on dopamine signaling and high malignancy of OZ, which was originally obtained from the ascitic effusion, was suspected. 52 Sph18‐29 had CTNNB1 exon 3 mutation (Figure S4), which is reported to be associated with activation of the Wnt/β‐catenin pathway. 53 Nevertheless, porcupine inhibitor suppressed organoid formation of Sph18‐29 cells. We suspect that WNT7B also activated the noncanonical WNT pathway, as is reported in pancreatic progenitor cells 54 or prostate cancer. 55 Therefore, the contributions of D1 signaling or WNT7B could depend on the cell line characteristics.
This study has some limitations. It focused primarily on tumor cells and not on nontumor cells such as fibroblasts, immune cells, or neural cells. As for the neural‐related niche, we showed its possible functional overlap with tumoral Wnt self‐signaling (Figure 6). Moreover, in the genes upregulated by D1 inhibition (Figure 4A), there were other intercellular signaling genes, including the semaphorin gene family (SEMA3B, SEMA4B). The semaphorin gene family was initially identified as a neural developmental factor and recently emerged as a regulator of malignancy through cross‐talk with tumor microenvironments. 56 The neural‐related niche and cross‐talks causing neurotropism of PDOs (Figure 6 and Figure S12B,C) require further analysis.
In conclusion, although more than 150 clinical trials targeting CSC are currently ongoing, 8 most responses have been modest, especially in solid tumors. This implies that targeting only CSCs might trigger feedback signaling to enhance CSCs. The current study supports that the D1 self‐signaling of BDCs might be a vital regulator of autonomous CSC growth via ERK‐FOS and WNT7B. Thus, inhibition of this feedback signaling may lead to novel combination therapies with conventional chemotherapy.
AUTHOR CONTRIBUTIONS
Conceptualization, AY, TM, and ST; Methodology, AY, ST, KM, RC, SS, AW, RI, and MMN; Investigation, AY, ST, KM, RC, YK, KN, TA, SW, SS, AW, RI, and MMN; Validation, KM, RC, SS, AW, RI, and MMN; Software, AY, SS, AW, RI, and MMN; Data curation, AY and ST; Formal analysis, AY, SS, AW, RI, and MMN; Visualization, AY and AW; Resources, AY and ST; Funding acquisition, TM and ST; Project administration, TM, ST, SO, HS, SU, and EH; Supervision, TM and ST; Writing—original draft, AY; Writing—review & editing, TM, ST, and SW.
FUNDING INFORMATION
TM received funding from Grants‐in‐Aid KAKENHI (21 K08732), and ST received funding from Grants‐in‐Aid KAKENHI (17 K09460), both research programs from the Ministry of Education, Culture, Sports, Science, and Technology. In addition, TM and ST received research funding from Sumitomo Pharma.
CONFLICT OF INTEREST
TM and ST received partial support from Sumitomo Pharma. SW and RI are employees of Sumitomo Pharma. SO and HS are editorial board members of Cancer Science. The other authors declare no competing financial interests in this study.
ETHICS STATEMENTS
Approval of the research protocol by an Institutional Review Board: The research protocol was approved by the ethical committee of Kyoto University Hospital (approval number: R1281). PDOs were established from fresh surgical specimens obtained from patients who underwent surgical resection at Kyoto University Hospital. All experiments were conducted according to the Declaration of Helsinki and the guidelines and regulations of the committee.
Informed Consent. For PDO establishment, informed consent in writing was obtained from each patient.
Registry and the Registration No. of the study/trial. N/A.
Animal Studies. All procedures for animal experiments were conducted in compliance with the ARRIVE guidelines and the Institutional Animal Welfare Guidelines of Kyoto University.
Supporting information
Appendix S1
Figures S1‐S13
Tables S1‐S7
ACKNOWLEDGMENTS
We thank S. Yokoyama, previously from the Medical Innovation Center DSK Project, for mice breeding and technical support; H. Umehara, T Kodo, and M Takamura for project management; M. Nishikawa from the Kyoto Institute of Nutrition & Pathology for immunohistochemistry staining; MARUZEN‐YUSHODO. (https://kw.maruzen.co.jp/kousei‐honyaku/); and Editage (https://www.editage.com/) for the English language editing. Figures 1A,C, 2A, and 3A (middle), Figure 6A (left), and Figure 7 were created with a licensed version of BioRender.com (to AY, 2022) by adaption of BioRender templates, retrieved from https://app.biorender.com/biorender‐templates.
Yogo A, Masui T, Takaishi S, et al. Inhibition of dopamine receptor D1 signaling promotes human bile duct cancer progression via WNT signaling. Cancer Sci. 2023;114:1324‐1336. doi: 10.1111/cas.15676
Toshihiko Masui and Shigeo Takaishi jointly supervised this study.
Contributor Information
Toshihiko Masui, Email: tmasui@kuhp.kyoto-u.ac.jp.
Shigeo Takaishi, Email: takaishi.shigeo.7w@kyoto-u.jp.
REFERENCES
- 1. Banales JM, Marin JJG, Lamarca A, et al. Cholangiocarcinoma 2020: the next horizon in mechanisms and management. Nat Rev Gastroenterol Hepatol. 2020;17(9):557‐588. doi: 10.1038/s41575-020-0310-z [DOI] [PMC free article] [PubMed] [Google Scholar]
- 2. Van VJLA, Gaspersz MP, Coelen RJS, et al. The prognostic value of portal vein and hepatic artery involvement in patients with perihilar cholangiocarcinoma. Int Hepato‐Pancreato‐Biliary Assoc. 2018;20(1):83‐92. doi: 10.1016/j.hpb.2017.08.025 [DOI] [PubMed] [Google Scholar]
- 3. Lee HO, Hong Y, Etlioglu HE, et al. Lineage‐dependent gene expression programs influence the immune landscape of colorectal cancer. Nat Genet. 2020;52(6):594‐603. doi: 10.1038/s41588-020-0636-z [DOI] [PubMed] [Google Scholar]
- 4. Clevers H. The cancer stem cell: premises, promises and challenges. Nat Med. 2011;17(3):313‐319. doi: 10.1038/nm.2304 [DOI] [PubMed] [Google Scholar]
- 5. Batlle E, Clevers H. Cancer stem cells revisited. Nat Med. 2017;23(10):1124‐1134. doi: 10.1038/nm.4409 [DOI] [PubMed] [Google Scholar]
- 6. Chaffer CL, Brueckmann I, Scheel C, et al. Normal and neoplastic nonstem cells can spontaneously convert to a stem‐like state. Proc Natl Acad Sci USA. 2011;108(19):7950‐7955. doi: 10.1073/pnas.1102454108 [DOI] [PMC free article] [PubMed] [Google Scholar]
- 7. Shimokawa M, Ohta Y, Nishikori S, et al. Visualization and targeting of LGR5 + human colon cancer stem cells. Nature. 2017;545(7653):187‐192. doi: 10.1038/nature22081 [DOI] [PubMed] [Google Scholar]
- 8. Yang L, Shi P, Zhao G, et al. Targeting cancer stem cell pathways for cancer therapy. Signal Transduct Target Ther. 2020;5(1):8. doi: 10.1038/s41392-020-0110-5 [DOI] [PMC free article] [PubMed] [Google Scholar]
- 9. Shi C, Tian R, Wang M, et al. CD44+CD133+ population exhibits cancer stem cell‐like characteristics in human gallbladder carcinoma. Cancer Biol Ther. 2010;10(11):1182‐1190. doi: 10.4161/cbt.10.11.13664 [DOI] [PubMed] [Google Scholar]
- 10. Wang M, Xiao J, Shen M, et al. Isolation and characterization of tumorigenic extrahepatic cholangiocarcinoma cells with stem cell‐like properties. Int J Cancer. 2011;128(1):72‐81. doi: 10.1002/ijc.25317 [DOI] [PubMed] [Google Scholar]
- 11. Mayr C, Ocker M, Ritter M, Pichler M, Neureiter D, Kiesslich T. Biliary tract cancer stem cells ‐ translational options and challenges. World J Gastroenterol. 2017;23(14):2470‐2482. doi: 10.3748/wjg.v23.i14.2470 [DOI] [PMC free article] [PubMed] [Google Scholar]
- 12. Chen S, Zhang B, Zhou B, Zhu C, Sun L, Feng Y. Perineural invasion of cancer : a complex crosstalk between cells and molecules in the perineural niche. Am J Cancer Res. 2019;9(1):1‐21. [PMC free article] [PubMed] [Google Scholar]
- 13. Amit M, Na'Ara S, Gil Z. Mechanisms of cancer dissemination along nerves. Nat Rev Cancer. 2016;16(6):399‐408. doi: 10.1038/nrc.2016.38 [DOI] [PubMed] [Google Scholar]
- 14. Kawamata H, Yamashita K, Nakamura K. Perineural invasion and preoperative serum CA19‐9 as predictors of survival in biliary tract cancer. Anticancer Res. 2013;33(2):583‐594. [PubMed] [Google Scholar]
- 15. Tan X, Sivakumar S, Bednarsch J, et al. Nerve fibers in the tumor microenvironment in neurotropic cancer—pancreatic cancer and cholangiocarcinoma. Oncogene. 2021;40(5):899‐908. doi: 10.1038/s41388-020-01578-4 [DOI] [PMC free article] [PubMed] [Google Scholar]
- 16. Coufal M, Invernizzi P, Gaudio E, et al. Increased local dopamine secretion has growth‐promoting effects in cholangiocarcinoma. Int J Cancer. 2010;126(9):2112‐2122. doi: 10.1002/ijc.24909 [DOI] [PMC free article] [PubMed] [Google Scholar]
- 17. Hall C, Sato K, Wu N, et al. Regulators of Cholangiocyte proliferation. Gene Expr. 2017;17(2):155‐171. doi: 10.3727/105221616X692568 [DOI] [PMC free article] [PubMed] [Google Scholar]
- 18. Huang L, Frampton G, Rao A, et al. Monoamine oxidase a expression is suppressed in human cholangiocarcinoma via coordinated epigenetic and IL‐6‐driven events. Lab Invest. 2012;92(10):1451‐1460. doi: 10.1038/labinvest.2012.110 [DOI] [PMC free article] [PubMed] [Google Scholar]
- 19. Sachlos E, Risueño RM, Laronde S, et al. Identification of drugs including a dopamine receptor antagonist that selectively target cancer stem cells. Cell. 2012;149(6):1284‐1297. doi: 10.1016/j.cell.2012.03.049 [DOI] [PubMed] [Google Scholar]
- 20. Yang L, Yao Y, Yong L, et al. Dopamine D1 receptor agonists inhibit lung metastasis of breast cancer reducing cancer stemness. Eur J Pharmacol. 2019;859:172499. doi: 10.1016/j.ejphar.2019.172499 [DOI] [PubMed] [Google Scholar]
- 21. Hao F, Wang S, Zhu X, et al. Pharmacokinetic‐pharmacodynamic modeling of the anti‐tumor effect of sunitinib combined with dopamine in the human non‐small cell lung cancer xenograft. Pharm Res. 2017;34(2):408‐418. doi: 10.1007/s11095-016-2071-5 [DOI] [PubMed] [Google Scholar]
- 22. Zhao H, Yan C, Hu Y, et al. Sphere‐forming assay vs. organoid culture: determining long‐term stemness and the chemoresistant capacity of primary colorectal cancer cells. Int J Oncol. 2019;54(3):893‐904. doi: 10.3892/ijo.2019.4683 [DOI] [PMC free article] [PubMed] [Google Scholar]
- 23. Marsee A, Roos FJM, Verstegen MMA, et al. Building consensus on definition and nomenclature of hepatic, pancreatic, and biliary organoids. Cell Stem Cell. 2021;28(5):816‐832. doi: 10.1016/j.stem.2021.04.005 [DOI] [PMC free article] [PubMed] [Google Scholar]
- 24. Miyoshi H, Stappenbeck TS. In vitro expansion and genetic modification of gastrointestinal stem cells in spheroid culture. Nat Protoc. 2013;8(12):2471‐2482. doi: 10.1038/nprot.2013.153 [DOI] [PMC free article] [PubMed] [Google Scholar]
- 25. Boj SF, Il HC, Baker LA, et al. Organoid models of human and mouse ductal pancreatic cancer. Cell. 2015;160(1–2):324‐338. doi: 10.1016/j.cell.2014.12.021 [DOI] [PMC free article] [PubMed] [Google Scholar]
- 26. Seino T, Kawasaki S, Shimokawa M, et al. Human pancreatic tumor organoids reveal loss of stem cell niche factor dependence during disease progression. Cell Stem Cell. 2018;22(3):454‐467.e6. doi: 10.1016/j.stem.2017.12.009 [DOI] [PubMed] [Google Scholar]
- 27. Masuo K, Chen R, Yogo A, et al. SNAIL2 contributes to tumorigenicity and chemotherapy resistance in pancreatic cancer by regulating IGFBP2. Cancer Sci. 2021;112(12):4987‐4999. doi: 10.1111/cas.15162 [DOI] [PMC free article] [PubMed] [Google Scholar]
- 28. Watanabe S, Yogo A, Otsubo T, et al. Establishment of patient‐derived organoids and a characterization‐based drug discovery platform for treatment of pancreatic cancer. BMC Cancer. 2022;22(1):489. doi: 10.1186/s12885-022-09619-9 [DOI] [PMC free article] [PubMed] [Google Scholar]
- 29. Partecke IL, Kaeding A, Sendler M, et al. In vivo imaging of pancreatic tumours and liver metastases using 7 tesla MRI in a murine orthotopic pancreatic cancer model and a liver metastases model. BMC Cancer. 2011;11:40. doi: 10.1186/1471-2407-11-40 [DOI] [PMC free article] [PubMed] [Google Scholar]
- 30. Gil Z, Rein A, Brader P, et al. Nerve‐sparing therapy with oncolytic herpes virus for cancers with neural invasion. Clin Cancer Res. 2007;13(21):6479‐6485. doi: 10.1158/1078-0432.CCR-07-1639 [DOI] [PubMed] [Google Scholar]
- 31. Reynolds B, Weiss S. Generation of neurons and astrocytes from isolated cells of the adult mammalian central nervous system. Science. 1992;255(5052):1707‐1710. doi: 10.1126/science.1553558 [DOI] [PubMed] [Google Scholar]
- 32. Pastrana E, Silva‐Vargas V, Doetsch F. Eyes wide open: a critical review of sphere‐formation as an assay for stem cells. Cell Stem Cell. 2011;8(5):486‐498. doi: 10.1016/j.stem.2011.04.007 [DOI] [PMC free article] [PubMed] [Google Scholar]
- 33. Shiokawa D, Sakai H, Ohata H, et al. Slow‐cycling cancer stem cells regulate progression and chemoresistance in colon cancer. Cancer Res. 2020;80(20):4451‐4464. doi: 10.1158/0008-5472.CAN-20-0378 [DOI] [PubMed] [Google Scholar]
- 34. Okamoto T, duVerle D, Yaginuma K, et al. Comparative analysis of patient‐matched PDOs revealed a reduction in OLFM4‐associated clusters in metastatic lesions in colorectal cancer. Stem Cell Rep. 2021;16(4):954‐967. doi: 10.1016/j.stemcr.2021.02.012 [DOI] [PMC free article] [PubMed] [Google Scholar]
- 35. Liberzon A, Subramanian A, Pinchback R, Thorvaldsdóttir H, Tamayo P, Mesirov JP. Molecular signatures database (MSigDB) 3.0. Bioinformatics. 2011;27(12):1739‐1740. doi: 10.1093/bioinformatics/btr260 [DOI] [PMC free article] [PubMed] [Google Scholar]
- 36. Aizarani N, Saviano A, Sagar ML, et al. A human liver cell atlas reveals heterogeneity and epithelial progenitors. Nature. 2019;572(7768):199‐204. doi: 10.1038/s41586-019-1373-2 [DOI] [PMC free article] [PubMed] [Google Scholar]
- 37. Busslinger GA, Weusten BLA, Bogte A, Begthel H, Brosens LAA, Clevers H. Human gastrointestinal epithelia of the esophagus, stomach, and duodenum resolved at single‐cell resolution. Cell Rep. 2021;34(10):108819. doi: 10.1016/j.celrep.2021.108819 [DOI] [PubMed] [Google Scholar]
- 38. Gao S, Yan L, Wang R, et al. Tracing the temporal‐spatial transcriptome landscapes of the human fetal digestive tract using single‐cell RNA‐sequencing. Nat Cell Biol. 2018;20(6):721‐734. doi: 10.1038/s41556-018-0105-4 [DOI] [PubMed] [Google Scholar]
- 39. Boulter L, Guest RV, Kendall TJ, et al. WNT signaling drives cholangiocarcinoma growth and can be pharmacologically inhibited. J Clin Invest. 2015;125(3):1269‐1285. doi: 10.1172/JCI76452 [DOI] [PMC free article] [PubMed] [Google Scholar]
- 40. Arensman MD, Kovochich AN, Kulikauskas RM, et al. WNT7B mediates autocrine WNT/β‐catenin signaling and anchorage‐independent growth in pancreatic adenocarcinoma. Oncogene. 2014;33(7):899‐908. doi: 10.1038/onc.2013.23 [DOI] [PMC free article] [PubMed] [Google Scholar]
- 41. Zhan T, Rindtorff N, Boutros M. Wnt signaling in cancer. Oncogene. 2017;36(11):1461‐1473. doi: 10.1038/onc.2016.304 [DOI] [PMC free article] [PubMed] [Google Scholar]
- 42. Kadowaki T, Wilder E, Klingensmith J, Zachary K, Perrimon N. The segment polarity gene porcupine encodes a putative multitransmembrane protein involved in wingless processing. Genes Dev. 1996;10(24):3116‐3128. doi: 10.1101/gad.10.24.3116 [DOI] [PubMed] [Google Scholar]
- 43. Caricasole A, Ferraro T, Rimland JM, Terstappen GC. Molecular cloning and initial characterization of the MG61/PORC gene, the human homologue of the drosophila segment polarity gene porcupine. Gene. 2002;288(1–2):147‐157. doi: 10.1016/s0378-1119(02)00467-5 [DOI] [PubMed] [Google Scholar]
- 44. Monje P, Hernández‐Losa J, Lyons RJ, Castellone MD, Gutkind JS. Regulation of the transcriptional activity of c‐Fos by ERK. A novel role for the prolyl isomerase PIN1. J Biol Chem. 2005;280(42):35081‐35084. doi: 10.1074/jbc.C500353200 [DOI] [PubMed] [Google Scholar]
- 45. Gao J, Zhang C, Gao F, Li H. The effect and mechanism of dopamine D1 receptors on the proliferation of osteosarcoma cells. Mol Cell Biochem. 2017;430(1–2):31‐36. doi: 10.1007/s11010-017-2951-y [DOI] [PubMed] [Google Scholar]
- 46. Matsuoka K, Bakiri L, Wolff LI, et al. Wnt signaling and Loxl2 promote aggressive osteosarcoma. Cell Res. 2020;30(10):885‐901. doi: 10.1038/s41422-020-0370-1 [DOI] [PMC free article] [PubMed] [Google Scholar]
- 47. Brewer GJ, Torricelli JR, Evege EK, Price PJ. Optimized survival of hippocampal neurons in B27‐supplemented neurobasal, a new serum‐free medium combination. J Neurosci Res. 1993;35(5):567‐576. doi: 10.1002/jnr.490350513 [DOI] [PubMed] [Google Scholar]
- 48. Ikeya M, Lee SMK, Johnson JE, Mc Mahon AP, Takada S. Wnt signalling required for expansion of neural crest and CNS progenitors. Nature. 1997;389(6654):966‐970. doi: 10.1038/40146 [DOI] [PubMed] [Google Scholar]
- 49. Dudas J, Elmaouhoub A, Mansuroglu T, et al. Prospero‐related homeobox 1 (Prox1) is a stable hepatocyte marker during liver development, injury and regeneration, and is absent from "oval cells". Histochem Cell Biol. 2006;126(5):549‐562. doi: 10.1007/s00418-006-0191-4 [DOI] [PubMed] [Google Scholar]
- 50. Koch R, Demant M, Aung T, et al. Populational equilibrium through exosome‐mediated Wnt signaling in tumor progression of diffuse large B‐cell lymphoma. Blood. 2014;123(14):2189‐2198. doi: 10.1182/blood-2013-08-523886 [DOI] [PubMed] [Google Scholar]
- 51. Mair F, Erickson JR, Voillet V, et al. A targeted multi‐omic analysis approach measures protein expression and low‐abundance transcripts on the single‐cell level. Cell Rep. 2020;31(1):107499. doi: 10.1016/j.celrep.2020.03.063 [DOI] [PMC free article] [PubMed] [Google Scholar]
- 52. Homma S, Nagamori S, Fujise K, et al. Human bile duct carcinoma cell line producing abundant mucin in vitro. Gastroenterol Jpn. 1987;22(4):474‐479. doi: 10.1007/BF02773816 [DOI] [PubMed] [Google Scholar]
- 53. Gao C, Wang Y, Broaddus R, Sun L, Xue F, Zhang W. Exon 3 mutations of CTNNB1 drive tumorigenesis: a review. Oncotarget. 2017;9(4):5492‐5508. doi: 10.18632/oncotarget.23695 [DOI] [PMC free article] [PubMed] [Google Scholar]
- 54. Kimura A, Toyoda T, Iwasaki M, Hirama R, Osafune K. Combined omics approaches reveal the roles of non‐canonical WNT7B signaling and YY1 in the proliferation of human pancreatic progenitor cells. Cell Chem Biol. 2020;27(12):1561‐1572.e7. doi: 10.1016/j.chembiol.2020.08.018 [DOI] [PubMed] [Google Scholar]
- 55. Zheng D, Decker KF, Zhou T, et al. Role of WNT7B‐induced noncanonical pathway in advanced prostate cancer. Mol Cancer Res. 2013;11(5):482‐493. doi: 10.1158/1541-7786.MCR-12-0520 [DOI] [PMC free article] [PubMed] [Google Scholar]
- 56. Mastrantonio R, You H, Tamagnone L. Semaphorins as emerging clinical biomarkers and therapeutic targets in cancer. Theranostics. 2021;11(7):3262‐3277. doi: 10.7150/thno.54023 [DOI] [PMC free article] [PubMed] [Google Scholar]
Associated Data
This section collects any data citations, data availability statements, or supplementary materials included in this article.
Supplementary Materials
Appendix S1
Figures S1‐S13
Tables S1‐S7