

Abstract
Background
Inflammatory cytokine interleukin‐6 (IL‐6) plays a pivotal role in skeletal muscle degradation after intra‐abdominal sepsis (IAS), with mechanism remained to be elucidated. Indoleamine 2,3‐dioxygenase 1 (IDO‐1), a key enzyme in converting tryptophan into kynurenine, could be activated by IL‐6, and kynurenine has been shown to be involved in muscle degradation. We hypothesized that IL‐6 could promote muscle degradation via tryptophan–IDO‐1–kynurenine pathway in IAS patients.
Methods
Serum and rectus abdominis (RA) were obtained from IAS or non‐IAS patients. Mouse model of IAS‐induced muscle wasting was generated by caecal ligation and puncture (CLP) and lipopolysaccharide (LPS) injection. IL‐6 signalling was blocked by anti‐mouse IL‐6 antibody (IL‐6‐AB), and the IDO‐1 pathway was blocked by navoximod. To elucidate the role of kynurenine in muscle mass and physiology, kynurenine was administered to IAS mice treated with IL‐6‐AB.
Results
Compared to non‐IAS patients, kynurenine levels in serum (+2.30‐fold vs. non‐IAS, P < 0.001) and RA (+3.11‐fold vs. non‐IAS, P < 0.001) were elevated, whereas tryptophan levels in serum (−53.65% vs. non‐IAS, P < 0.01) and RA (−61.39% vs. non‐IAS, P < 0.01) were decreased. Serum IL‐6 level of the IAS group was significantly higher compared to non‐IAS patients (+5.82‐fold vs. non‐IAS, P = 0.01), and muscle cross‐sectional area (MCSA) was markedly reduced compared to non‐IAS patients (−27.73% vs. non‐IAS, P < 0.01). In animal experiments, IDO‐1 expression was up‐regulated in the small intestine, colon and blood for CLP or LPS‐treated mice, and there was correlation (R 2 = 0.66, P < 0.01) between serum and muscle kynurenine concentrations. Navoximod significantly mitigated IAS‐induced skeletal muscle loss according to MCSA analysis (+22.94% vs. CLP, P < 0.05; +23.71% vs. LPS, P < 0.01) and increased the phosphorylated AKT (+2.15‐fold vs. CLP, P < 0.01; +3.44‐fold vs. LPS, P < 0.01) and myosin heavy chain (+3.64‐fold vs. CLP, P < 0.01; +2.13‐fold vs. LPS, P < 0.01) protein expression in myocytes. In the presence of anti‐IL‐6 antibody, a significantly decreased IDO‐1 expression was observed in the small intestine, colon and blood in CLP or LPS mice (all P < 0.01), whereas the decrease of MCSA was alleviated (+37.43% vs. CLP + IgG, P < 0.001; +30.72% vs. LPS + IgG, P < 0.001). In contrast, additional supplementation of kynurenine decreased the MCSA in septic mice treated with IL‐6‐AB (both P < 0.01).
Conclusions
This study provided novel insights into the tryptophan–IDO‐1–kynurenine‐dependent mechanisms that underlie inflammatory cytokine‐induced skeletal muscle catabolism during intra‐abdominal sepsis.
Keywords: indoleamine 2,3‐dioxygenase 1; interleukin‐6; intra‐abdominal sepsis; muscle wasting; tryptophan
Introduction
Intra‐abdominal sepsis (IAS) is a common complication after abdominal trauma or surgery. 1 Up to 70–100% of IAS patients are accompanied with metabolic disorders, presenting as a hyper‐catabolic status. 2 On this subject, skeletal muscle (SM) wasting and the consequent sarcopenia are the main problems, which would lead to the rapid loss of SM mass and strength, with a clinical manifestation of frailty and increased morbidity. 3 Although nutrition support could promote anabolism, it could not counteract the process of catabolism and preserve muscle mass in the early phase of critical illness. 4 Therefore, factors other than nutrition deficiency might play an important role during muscle wasting in IAS.
Interleukin‐6 (IL‐6) is an inflammatory cytokine that has been shown to participate in sepsis development 5 and is associated with mortality in severe sepsis. 6 IL‐6 could trigger SM degradation by different mechanisms, including elevated Janus kinase/signal transducer and activator of tran‐ions (JAK/STAT) pathway activity or increased release of other cytokines. 7 Neutralizing antibodies to IL‐6 was identified as a therapeutic target in cancer cachexia 8 ; however, whether blockage of IL‐6 signalling could attenuate the process of muscle wasting in sepsis has not been determined. The optimal time of IL‐6 blocking is also noteworthy, because early intervention with the most appropriate biologic provides the best opportunity for remission. 9
Recent findings suggested that some amino acids could serve as the signalling molecules to regulate SM metabolism, rather than simply function as the substrates of muscle protein synthesis. 10 Tryptophan (Trp) is a conditionally essential amino acid. There are three ways of Trp metabolism, including the direct transformation of Trp into aryl hydrocarbon receptor (AhR) ligands, the 5‐hydroxytryptamine (5‐HT) production pathway and the kynurenine (Kyn) pathway via indoleamine 2,3‐dioxygenase 1 (IDO‐1). 11
Among them, Trp catabolism through the Kyn pathway could generate a variety of bioactive metabolites that would affect the substrate metabolism. An increase in IDO‐1 activity has been associated to an increased mortality in septic patients, 12 and frailty is associated with a marked increase in the Kyn/Trp ratio. 13 Lean body mass in mice treated with high Kyn diet was significantly reduced, 14 which suggested that IDO‐1 inhibition may represent a novel therapeutic approach for the prevention of sarcopenia. Also, IL‐6 could enable the activation of IDO‐1 in inflammatory state. 15 Therefore, IDO‐1 activation and Kyn accumulation might be a possible mechanism and therapeutic target of IL‐6‐induced SM wasting in IAS.
In the current study, we sought to delineate the role of IDO‐1 and its metabolite Kyn in sepsis‐induced muscle wasting and to explore the relationship between IL‐6 and IDO‐1 in sepsis. To address this, we first collected blood and rectus abdominis (RA) samples from patients undergoing surgery for IAS and tested the correlation between muscle wasting and serum IL‐6, Trp and Kyn levels. In animal experiments, we used navoximod (NLG‐919), a specific antagonist of IDO‐1, and IL‐6‐neutralizing antibody to confirm that IDO‐1 activation mediates IL‐6‐induced SM wasting during sepsis.
Materials and methods
Patients
Twelve IAS and 27 non‐IAS patients undergoing laparotomy were enrolled between November 2019 and June 2020. Inclusion criteria were: (1) age 16–70 years (2) and patients undergoing laparotomy due to abdominal trauma or gastrointestinal (GI) perforation‐induced IAS. For controls (non‐IAS group), patients with GI cancer undergoing laparotomy were enrolled. Patients were excluded if they meet any of following conditions: (1) preoperative chemoradiation, (2) with neuromuscular disease, (3) preoperative fasting ≥ 7 days, exhibited an unrecoverable state of death or dying, (4) incomplete data during hospitalization or without the muscle specimen collection during laparotomy. The diagnosis of IAS was made according to the Sepsis‐3 criteria, which included: (1) suspected or documented intra‐abdominal infection (IAI), along with (2) evidence of organ dysfunction represented by an acute increase in the sequential organ failure assessment (SOFA) score ≥ 2 points due to IAI. 16 Informed consent was obtained, and the protocol was approved by Ethics Committee of Jinling Hospital.
A midline incision was used for all patients. Prior to intra‐abdominal procedure, ~2 g of the RA was divided into two parts to be fixed in 4% paraformaldehyde or stored in liquid nitrogen. Blood samples were collected within 2 h prior to surgery and at Postoperative Days (PODs) 1, 3 and 5. Serum IL‐6, C‐reactive protein (CRP) and other serum biochemical parameters were part of routine perioperative laboratory tests and were retrieved from the patients' computerized medical charts. Serum and muscle Trp and Kyn levels were determined by high‐performance liquid chromatography (HPLC), and the IDO‐1 protein expression in muscle was analysed by western blot. Outcome assessors were blinded to the clinical situation of the patients to prevent subjective bias.
Mice model of intra‐abdominal sepsis
All animal experimental protocols were performed in accordance with the guidelines for the animal care. Ten‐week‐old wild‐type C57BL/6J male mice were housed at 25°C with a 12/12‐h light/dark cycle and with ad libitum access to chow and water.
Caecal ligation and puncture (CLP) was performed to induce IAI‐related polymicrobial sepsis as described previously. 17 Briefly, after laparotomy under general anaesthesia, caecum was ligatured at the distal third with a 4–0 suture and the distal part was perforated twice with a 21‐gauge needle. The sham‐operated mice were subjected to laparotomy without CLP. To establish a positive control group of sepsis, one group of mice received intraperitoneal injection of lipopolysaccharide (LPS) (L2630, St. Louis, MO, USA, 10 mg/kg).
Anti‐interleukin‐6 antibody and navoximod (NLG‐919) treatment
Anti‐mouse IL‐6 antibody (IL‐6‐AB) (clone MP5‐20F3) and mouse IgG1 isotype control purified antibody were purchased from Bio X Cell (Lebanon, NH, USA). Navoximod (GDC‐0919; previously NLG‐919), an orally bioavailable IDO‐1/TDO inhibitor, was obtained from MedChemExpress (NJ, USA).
For anti‐IL‐6 antibody, the two antibodies including clone MP5‐20F3 and mouse IgG1 were injected intraperitoneally (1 mg/kg) twice at 24‐h interval prior to CLP or LPS treatment and followed by three injections of 1.5‐mg/kg body weight (BW) thereafter at intervals of 24 h each. 18 Navoximod was administered 100 and 200 mg/kg orally before and after CLP or LPS treatment, respectively. 19
Seventy‐two hours after CLP or LPS injection, mice were euthanized by cervical dislocation. The gastrocnemius (GAS) muscles were carefully removed from both legs and divided into two; half tissue was put in fixative and embedded by paraffin for histology and immunofluorescence (IF), and the rest was snap frozen in liquid nitrogen and stored −80°C until use for immunoblotting, real‐time quantitative PCR (qRT‐PCR) and HPLC experiments.
Histology and fibre size determination
Processing of SM tissue for histological analysis was performed as previously described. For Sirius Red staining, serial transverse sections of muscle (10 μm) were stained using commercial kit (Servicebio, China). For laminin staining, 20‐μm sections were fixed for 15 min in 4% PFA and then blocked in phosphate‐buffered saline (PBS) (10‐mmol/L NaPO4 and 150‐mmol/L NaCl)/10% bovine serum albumin (BSA) for 1 h at room temperature (RT). Sections were then incubated overnight at RT with rabbit anti‐laminin antibody (Sigma‐Aldrich) (1:500), washed with PBS/0.025% Triton X‐100 and incubated in an Alexa Fluor‐labelled goat anti‐rabbit secondary antibody (Invitrogen, 1:1000). Images demonstrating fibre‐type distribution were obtained using an FW1000 confocal microscope. Fibre area was measured in images by Image‐Pro Plus software (NIH, Bethesda, MD, USA, https://imagej.nih.gov/ij/), and 100 muscle cross‐sectional areas (MCSAs) were measured per mouse, muscle and condition in a blinded fashion.
Real‐time quantitative PCR
Total RNA was extracted from GAS muscle using TRIzol reagent (Thermo Fisher Scientific Inc., MA, USA) according to the manufacturer's instructions. Once isolated, 5 μg of total RNA was reverse transcribed to yield cDNA. Real‐time PCR was performed on an ABI Prism 7900HT (Applied Biosystems, Foster City, CA, USA) and analysed by Applied Biosystems software. Expression levels of each gene were normalized to an internal control gene (GAPDH mRNA), and the normalized fold change of gene expression level was analysed using the 2–∆∆Ct method. 20 The primer sequences used in the study were listed as follows: MuRF1, 5#‐CCAGGTGAAGGAGGAACT‐3# forward, 5#‐TTGGCACTCAAGAGGAAGG‐3# reverse; atrogin‐1, 5#‐TCAAAGGCCTCACGATCACC‐3# forward, 5#‐CCTCAATGACGTATCCCCCG‐3# reverse; FOXO‐1, 5#‐CAAGGATAAGGGCGACAG‐3# forward, 5#‐TTGAGCATCCACCAAGAAC‐3# reverse; MUSA1, 5#‐GGGGAAAAGGAAGTATCCAGA‐3# forward, 5#‐GCCATGCTTAGGATGTCAGC‐3# reverse; GAPDH, 5#‐GCAAGTTCAACGGCACAG‐3# forward, 5#‐GCCAGTAGACTCCACGACAT‐3# reverse; Myh2, 5#‐AGTCCCAGGTCAACAAGCTG‐3# forward, 5#‐GCATGACCAAAGGTTTCACA‐3# reverse; and Myh4, 5#‐AGTCCCAGGTCAACAAGCTG‐3# forward, 5#‐TTTCTCCTGTCACCTCTCAACA‐3# reverse.
Tissue dissection and western blot
Total protein was extracted from tissues using radioimmunoprecipitation assay buffer (RIPA buffer; Beyotime, Shanghai, China) and quantified.
The reaction mixture was incubated on ice for 30 min and centrifuged for 10 min at 10 000 g at 4°C. The supernatant was collected, and the protein concentration was estimated using a Pierce BCA protein assay kit (Thermo Fisher Scientific Inc.). Proteins (30 μg per sample) were separated in 10% sodium dodecyl sulfate–polyacrylamide gel electrophoresis (SDS‐PAGE) gels and transferred onto nitrocellulose (NC) membranes (Sigma‐Aldrich). The membranes were blocked in 5% skim milk solution in PBS for 40 min at RT and then immunoblotted with primary antibody at 4°C overnight. Primary antibodies included IDO‐1 (1:1000, ab211017, reacts with human), IDO‐1 (1:2000, ab106134), AKT (1:2000, ab8805), phosphorylated (p)‐AKT (1:2000, ab38449), myosin heavy chain (MyHC) (1:2000, ab11083), MuRF1 (1:2000, ab172479) and atrogin‐1 (1:2000, ab168372) (all from Abcam, USA). GAPDH (sc‐365062, Santa Cruz Biotechnology, Santa Cruz, CA, USA) was used as control. The membranes were washed with PBS–Tween 20 (PBS‐T) thrice and then incubated with fluorescence‐conjugated secondary antibodies for 1 h at RT and visualized with Clinx two‐colour chemiluminescence imaging system (ChemiScope 6000 Exp, Shanghai, China). The densitometric analyses of images were performed using Image‐Pro Plus.
Ultra‐high‐performance liquid chromatography quantifications
All the serum and muscle samples were analysed by 1290 ultra‐high‐performance liquid chromatography (UHPLC) (Agilent Technologies, CA, USA) coupled with Thermo Q Exactive Focus (Thermo Fisher Scientific Inc.) platform by Biotree Ltd. (Shanghai, China). Chromatographic conditions were set as follows: ACQUITY UPLC® BEH C18 column (2.1 × 100 mm, 1.7 μm, Waters Inc., USA), sample size—5 μL, column temperature—40°C, mobile phase A—50% methanol water (containing 0.1% formic acid) and mobile phase B—10% methanol water (containing 0.1% formic acid). Mass spectrometry (MS) conditions include electrospray ionization (ESI) source and positive‐ion ionization mode. Ion source temperature is 500°C, ion source voltage is 5000 V, collision gas is 6 psi, curtain gas is 30 psi, and atomization gas and auxiliary gas are 50 psi. Multiple‐response monitoring (MRM) was used for scanning.
Liquid chromatography–MS (LC–MS) detection was performed for each standard solution. Taking the concentration of standard solution as abscissa (x) and the area ratio of internal standard peak as ordinate (y), the linear range was investigated and the standard curve was drawn. The linear regression equations of Trp and Kyn were obtained as follows: for Trp, y = 4494x + 928.7, r = 0.9965; for Kyn, y = 702.8x + 194.5, r = 0.9997. Then the measurements of Trp and Kyn on serum and muscle samples were performed as described above.
Statistics
All experiments were performed independently at least three times to ensure the accuracy of data. Statistical analysis was performed using SPSS Version 20.0 (SPSS Inc., an IBM company, Chicago, IL, USA). The data were expressed as the mean ± standard error of the mean (SEM). Nonparametric Mann–Whitney U tests were used to test the difference between the study groups with P < 0.05 as statistically significant.
Results
Skeletal muscle wasting and kynurenine accumulation in patients with intra‐abdominal sepsis
A total of 12 IAS patients and 27 non‐IAS patients were enrolled. All the outcomes were available for these 39 patients, and demographics and haematological index of patients were depicted in Table 1 . In the current study, abdominal trauma and GI perforation were the leading causes for IAS. Patients who received abdominal surgery for GI cancer were included as controls (non‐IAS group). Compared to non‐IAS controls, serum IL‐6 concentrations of the IAS group were significantly higher prior to laparotomy (Figure 1 A ). A sustained reduction of serum albumin and pre‐albumin was also observed in IAS patients (Figure 1 B ).
Table 1.
Demographic characteristic of patients with or without IAS
| Non‐IAS (n = 27) | IAS (n = 12) | P value | |
|---|---|---|---|
| Male, n (%) | 17 (62.9%) | 8 (66.6%) | 1.000 |
| Age (years) | 53.7 ± 14.1 | 41.1 ± 15.7 | 0.018 |
| BMI (kg/m2) | 21.6 ± 7.4 | 16.8 ± 5.5 | 0.038 |
| First‐time operation, n (%) | 19 (70.3%) | 8 (66.6%) | 1.000 |
| Operative time > 3 h, n (%) | 8 (29.6%) | 5 (41.6%) | 0.462 |
| Intraoperative blood transfusion, n (%) | 4 (14.8%) | 3 (25.0%) | 0.654 |
| Haematological indexes | |||
| Leucocytes (× 109) | 7.9 ± 3.4 | 12.3 ± 4.2 | 0.027 |
| Haemoglobin (g/L) | 107.8 ± 21.3 | 94.9 ± 20.6 | 0.216 |
| Platelet (/mm3) | 351.4 ± 107.9 | 279.5 ± 119.5 | 0.084 |
| C‐reactive protein (mg/L) | 7.3 ± 2.1 | 26.9 ± 11.8 | 0.014 |
| Use of corticosteroids before surgery, n (%) | 2 (7.4%) | 7 (58.3%) | <0.001 |
| Use of insulin before surgery, n (%) | 3 (11.1%) | 4 (33.3%) | 0.095 |
| Serum glucose levels (mmol/L) | 5.9 ± 2.4 | 7.8 ± 3.1 | 0.073 |
| Mean time from IAS onset to surgery (h) | — | 21.43 ± 14.84 | — |
Abbreviations: BMI, body mass index; IAS, intra‐abdominal sepsis.
Figure 1.

Comparison of the skeletal muscle wasting and kynurenine (Kyn) accumulation between intra‐abdominal sepsis (IAS) and control patients. (A) Interleukin‐6 (IL‐6) levels in serum between the non‐IAS (n = 27) and IAS (n = 12) patients prior to laparotomy. (B) Sustained reduction of serum albumin and pre‐albumin was observed in IAS patients on admission and Postoperative Day 5. (C) Representative laminin staining and associated morphometric analysis of cross‐sections from rectus abdominis from IAS patients, compared to controls. Scale bars, 100 μm. Results from morphometric analysis are depicted as the distribution frequency of fibre size categorized by fibre diameter. (D) Results from real‐time quantitative PCR (qRT‐PCR) analysis of muscle atrophy markers Trim63 (MuRF1), atrogin‐1 (MAFbx), forkhead box protein O‐1 (FOXO‐1) and Fbxo30 (MUSA1) in rectus abdominis between the non‐IAS and IAS patients. (E) Concentrations of Kyn and tryptophan (Trp) in serum and rectus abdominis between the non‐IAS and IAS patients. (F) Indoleamine 2,3‐dioxygenase 1 (IDO‐1) protein expression as determined by western blot in rectus abdominis between non‐IAS and IAS patients. All data are shown as mean ± SEM. P values were determined by two‐tailed, unpaired Student's t test. N.S, not significant. *P < 0.05, ** P < 0.01 and *** P < 0.001.
Morphometric analysis of RA revealed that MCSA of the sepsis group patients was markedly reduced compared to non‐septic patients (Figures 1 C and S1a ). To reduce the impact of the extracellular matrix (ECM) on the analysis of the MCSA, the ECM mass was quantified according to the Picrosirius Red staining, and results showed that there was very little ECM deposition in each group (Figure S1b ).
The mRNA expressions of marker genes for muscle atrophy, including Trim63 (MuRF1), atrogin‐1 (MAFbx), forkhead box protein O‐1 (FOXO‐1) and Fbxo30 (MUSA1), were all up‐regulated in RA in the IAS group (Figure 1 D ).
In addition, the change of IDO‐1/Kyn pathway was also determined. Compared with controls, the concentrations of Kyn in serum (3.31 ± 0.24 vs. 1.44 ± 0.09 μmol/L, P < 0.001) and RA (1.43 ± 0.11 vs. 0.46 ± 0.09 μmol/L, P < 0.001) were both elevated, whereas Trp levels in serum (34.84 ± 5.97 vs. 16.16 ± 5.20 μmol/L, P < 0.01) and RA (20.41 ± 3.30 vs. 7.88 ± 1.96 μmol/L, P < 0.01) decreased in IAS patients (Figure 1 E ). However, we found no significant difference of IDO‐1 protein expression in muscle between groups (Figure 1 F ).
Indoleamine 2,3‐dioxygenase 1 expression is up‐regulated in the intestine and serum in mice model of intra‐abdominal sepsis
Seventy‐two hours after CLP or LPS injection, the results of the survival analysis were shown in Figure S2a . Significant loss of BW and severe myotrophy of the GAS muscle in the septic mice were observed (Figures 2 A,B and S2b ), and MCSA in IAS group was markedly reduced compared to non‐IAS mice (Figures 2 C and S2c ), and Sirius staining was performed to rule out effects of the ECM (Figure S2 d). Muscle atrophy‐related genes including MuRF1, atrogin‐1, FOXO‐1 and MUSA1 were transcriptionally up‐regulated (Figure S2e ). In addition, sepsis induced a sharp increase of pro‐inflammatory cytokines including IL‐6 and tumour necrosis factor‐α (TNF‐α) (Figure S2e,f ).
Figure 2.
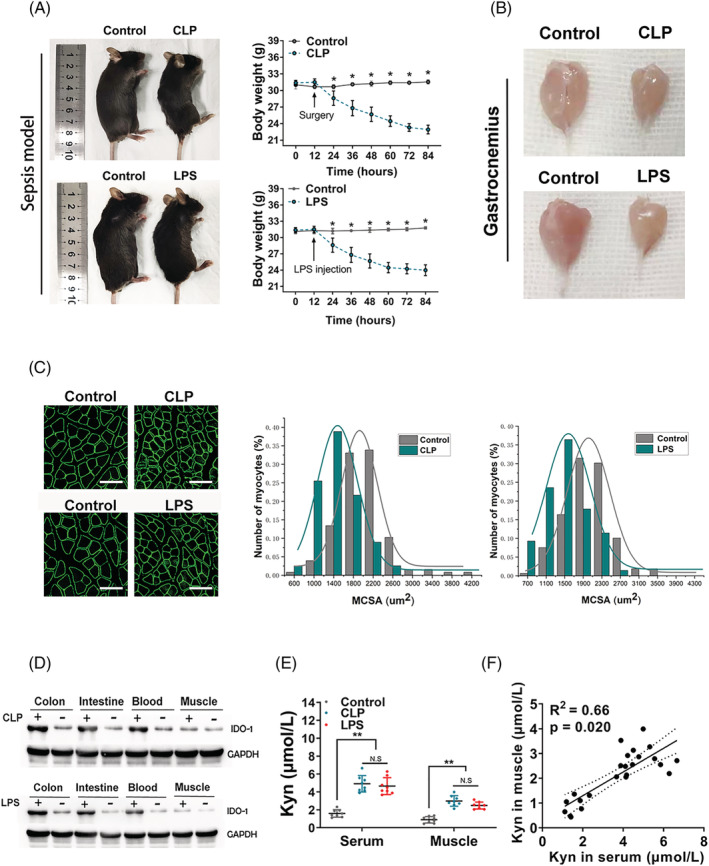
The indoleamine 2,3‐dioxygenase 1 (IDO‐1) expression is up‐regulated in the intestine and blood from both caecal ligation and puncture (CLP) and lipopolysaccharide (LPS) injection mouse models. (A) Images (left) and body weight analysis (right) of intra‐abdominal sepsis (IAS) (CLP and LPS injection) and control (non‐IAS) mice (C57BL/6 background). Images were photographed at endpoint at 72 h after CLP or LPS injection. (B) Representative images of the gastrocnemius muscles between the IAS and non‐IAS mice were shown. (C) Representative laminin staining and associated morphometric analysis of cross‐sections of gastrocnemius muscles harvested from IAS and non‐IAS mice. Scale bars, 100 μm. Morphometric analysis is depicted as the distribution frequency of fibre size categorized by fibre diameter. (D) IDO‐1 protein expression as determined by western blot in the colon, intestine, blood and muscle from the indicated groups (n = 5 in each group). (E) Measurement of kynurenine (Kyn) production in the serum and gastrocnemius from C57BL/6 control mice and mice at 72 h after CLP or LPS injection (n = 8 in each group). (F) Pearson correlation of the Kyn concentration between the serum (x axis) and gastrocnemius (y axis), with R 2 = 0.66 and P value = 0.020. All data are shown as mean ± SEM. P values were determined by two‐tailed, unpaired Student's t test or one‐way analysis of variance (ANOVA). N.S, not significant. *P < 0.05, ** P < 0.01 and *** P < 0.001.
Immunoblot analysis showed sepsis‐induced up‐regulation of IDO‐1 protein in the ileum, colon and blood. However, similar to results in patients, IDO‐1 expression in SM was not affected by CLP or LPS in mouse models (Figures 2 D and S2g ). Concentrations of Kyn in serum and GAS muscle were elevated in sepsis group (Figure 2 E ), whereas Trp levels in serum and GAS muscle were decreased significantly (Figure S2h ). There is a correlation (R 2 = 0.66, P < 0.01) between serum and GAS muscle Kyn concentrations (Figure 2 F ).
Indoleamine 2,3‐dioxygenase 1 blockage mitigated intra‐abdominal sepsis‐induced skeletal muscle loss in mice
We next determined whether blocking IDO‐1 activity could mitigate IAS‐induced SM loss and related Myoc genes in IAS mice. IAS mice were orally administered with saline or navoximod (NLG‐919), a high‐potency Trp mimetic as a specific IDO‐1 inhibitor. Forty‐eight hours prior to CLP or LPS injection, navoximod was administered orally once every 24 h at a dose of 100 mg/kg. After CLP or LPS injection, the dose increased to 200 mg/kg orally once every 24 h, and the mice were sacrificed 72 h thereafter. Tissues were subsequently harvested at predetermined endpoint (Figure 3 A ). Successful inhibition of the IDO‐1 activity by navoximod was confirmed by HPLC, which revealed reduced Kyn influx in both serum and GAS muscle (Figure 3 B ).
Figure 3.
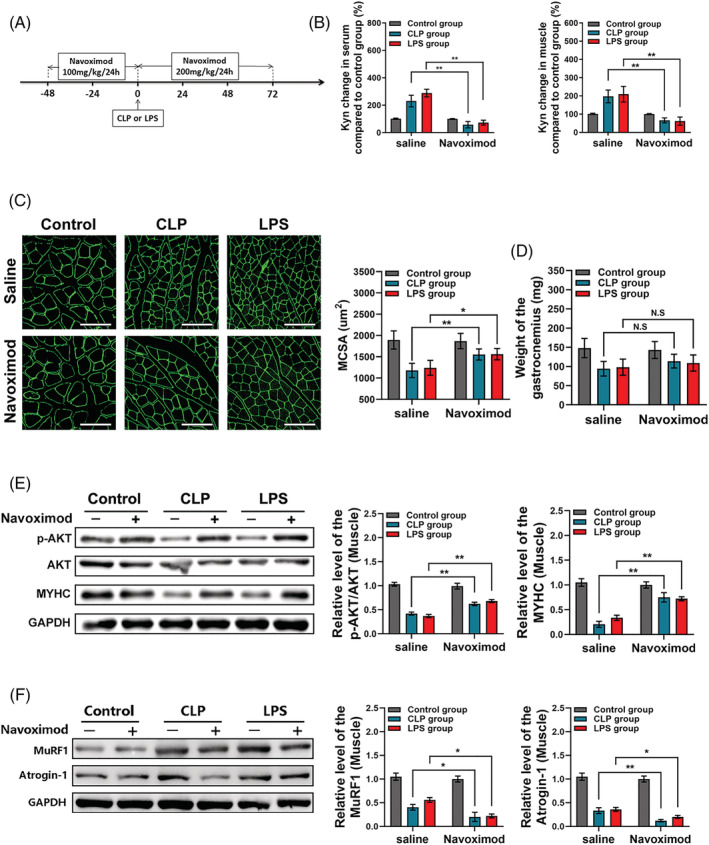
Indoleamine 2,3‐dioxygenase 1 (IDO‐1) blockage reduced the kynurenine (Kyn) accumulation and mitigated intra‐abdominal sepsis (IAS)‐induced skeletal muscle loss in mice. (A) Schematic representation of timing of sacrifice, caecal ligation and puncture (CLP) or lipopolysaccharide (LPS) injection and IDO‐1 blocking (with NLG‐919). (B) Measurement of Kyn production in the serum and gastrocnemius after the NLG‐919 usage for C57BL/6 control mice and mice with CLP or LPS injection (n = 8 in each group) and saline control group was taken for normalization. (C, D) Weight of the gastrocnemius after NLG‐919 usage and mean MCSA analysis between each group; muscles from navoximod group mice displayed visible increases in MCSA, though the weight of the gastrocnemius between each group got no statistical difference. Scale bars, 100 μm. (E) Western blot analysis for phosphorylated AKT (p‐AKT), total AKT and myosin heavy chain (MyHC) protein expression in gastrocnemius muscles from control mice, CLP mice and LPS mice with or without navoximod usage and saline control group was taken for normalization. (F) Western blot analysis for MuRF1 and atrogin‐1 protein expression in gastrocnemius muscles from control mice, CLP mice and LPS mice with or without navoximod usage and saline control group was taken for normalization. All data are shown as mean ± SEM. P values were determined by two‐tailed, unpaired Student's t test or one‐way analysis of variance (ANOVA). N.S, not significant. *P < 0.05, ** P < 0.01 and *** P < 0.001.
Compared to controls (CLP, or LPS group), muscles from navoximod group displayed increased MCSA (Figure 3 C ), whereas GAS muscle mass of the navoximod group was not significantly different (Figure 3 D ); this may be due to the restriction of a relatively small sample size in the analysis of the GAS muscle mass. However, in the MCSA analysis, above 100 MCSAs were measured per mouse, and then the difference of the MCSA between above groups could be analysed in the background of a large‐sample statistics. There was very little ECM deposition in mice treated with navoximod or not (Figure S3a ).
MyHC is one of the major proteins that decrease during SM atrophy through a mechanism involving ubiquitin–proteasome pathway (UPP). In the current study, the decrease in MyHC level induced by CLP or LPS in GAS muscle was reversed by navoximod; also, navoximod increased the relative p‐AKT/AKT level (Figure 3 E ). Phosphorylated AKT is a key protein in phosphoinositide 3‐kinase (PI3K)–AKT–mammalian target of rapamycin (mTOR) signalling pathway, which stimulates overall protein synthesis and inhibits protein degradation in muscle. MuRF1 and atrogin‐1 mRNA and protein levels in IAS mice were decreased in the presence of the navoximod (Figures 3 F and S3b ). Expression of Myh4, encoding MyHC2b, was increased in GAS muscle of CLP and LPS mice that received navoximod compared with sham animals; however, we did not find the difference of the Myh2 expression (encoding MyHC2a) among the above groups (Figure S3c ).
Pretreatment with anti‐interleukin‐6 antibody ameliorated intra‐abdominal sepsis‐induced indoleamine 2,3‐dioxygenase 1 activation and muscle wasting
Then, we evaluated whether anti‐IL‐6 antibody can ameliorate IAS‐induced SM wasting. The treatment protocol was shown in Figure 4 A , and anti‐IL‐6 group mice were accompanied with a normal or slightly elevated serum IL‐6 levels (Figure S4a ). Notably, anti‐IL‐6 group was resistant to CLP and LPS‐induced muscle wasting (Figure 4 B,C ), which was confirmed by markedly increased MCSA and greater weight of the GAS compared with the IAS mice. The sham operation group (sham CLP) and sham LPS group were set as the negative control group to verify the validity of the IAS model, and results showed that anti‐IL‐6 has no effect on MCSA and GAS weight for sham CLP and sham LPS mice (Figure S4b,c ). Expression of the muscle atrophy genes including MuRF1, atrogin‐1, FOXO‐1 and MUSA1 was significantly decreased in the presence of the anti‐IL‐6 for both CLP and LPS mice (Figure S4d ). Western blotting of muscle protein lysates showed a decrease in MuRF1 and atrogin‐1 protein levels and an increase in MyHC protein levels (Figure 4 D,E ) for CLP and LPS mice that received anti‐IL‐6 antibody. Expression of Myh4 was increased in GAS muscle of CLP and LPS mice that received anti‐IL‐6 compared with sham animals; however, we did not find the difference of the Myh2 expression among the above groups (Figure S4e ).
Figure 4.

Blocking the interleukin‐6 (IL‐6) with neutralizing antibody ameliorated intra‐abdominal sepsis (IAS)‐induced indoleamine 2,3‐dioxygenase 1 (IDO‐1) activation and muscle wasting. (A) Schematic representation of timing of mouse sacrifice, caecal ligation and puncture (CLP), lipopolysaccharide (LPS) injection and IL‐6 blocking (with anti‐mouse IL‐6 antibody [IL‐6‐AB]). (B, C) Weight and morphometric analysis of cross‐sections of gastrocnemius muscles harvested from the CLP or LPS injection mice accompanied with IL‐6‐AB, homologous IgG or saline using (n = 8 in each group). Scale bars, 100 μm. (D, E) Western blot analysis for MuRF1, atrogin‐1 and myosin heavy chain (MyHC) protein expression in gastrocnemius muscles of each indicated group (n = 6 in each group). (F) Relative protein level of IDO‐1 in the colon, intestine and blood (n = 6 in each group) and kynurenine (Kyn) levels in muscle of each indicated group (n = 8 in each group). All data are shown as mean ± SEM. P values were determined by two‐tailed, unpaired Student's t test or one‐way analysis of variance (ANOVA). N.S, not significant. *P < 0.05, ** P < 0.01 and *** P < 0.001.
In the presence of anti‐IL‐6, a significantly decreased IDO‐1 expression was observed in the colon, ileum and blood in CLP or LPS‐treated mice, as determined by western blot; however, the level of IDO‐1 in GAS muscle was not be affected (Figure 4 F ). We also found a significantly decreased Kyn level in the GAS muscle tissue in anti‐IL‐6 mice, as determined by HPLC (Figure 4 F ).
Kynurenine decreases the myosin heavy chain and phosphorylated AKT expression of the muscle fibres during sepsis‐mediated muscle wasting
The protocol of intraperitoneal Kyn (20 mg/kg) injection was shown in Figure 5A . Compared with controls (Figure 5B,C ), Kyn significantly decreased the MCSA in both CLP and LPS mice treated with anti‐IL‐6 (relative reduction 29.7%, P < 0.001, for CLP mice treated with anti‐IL‐6; relative reduction 32.3%, P < 0.001, for LPS mice treated with anti‐IL‐6). To better define the mechanism by which Kyn decreased muscle mass, western blot analysis was performed, which focuses on the expression of MyHC, p‐AKT and AKT. IAS mice (CLP and LPS) treated with anti‐IL‐6 showed an increased p‐AKT/AKT and MyHC in the GAS muscle, but this increase was attenuated in the presence of the Kyn (Figure 5 D,E ). Kyn treatment could also intensify anti‐IL‐6‐induced decrease in MuRF1 and atrogin‐1 mRNA expression (Figure S5a ). The expression of the Myh4 was attenuated in the presence of the Kyn for IAS mice treated with anti‐IL‐6, and we still did not find the difference of the Myh2 expression between the above groups (Figure S5b ).
Figure 5.

Application of kynurenine (Kyn) could decrease the myosin heavy chain (MyHC) and phosphorylated AKT (p‐AKT) expression of the muscle fibres for septic mice that received anti‐mouse interleukin‐6 (IL‐6) antibody. (A) Kyn was intraperitoneally injected to both caecal ligation and puncture (CLP) and lipopolysaccharide (LPS) mice treated with anti‐IL‐6 antibody (IL‐6‐AB). (B, C) Representative laminin staining images and morphometric analysis of the cross‐sections of gastrocnemius muscles from the indicated groups (n = 7 in each group). Scale bars, 100 μm. (D, E) Western blot of p‐AKT, total AKT and MyHC in gastrocnemius muscles and relative p‐AKT/AKT and MyHC protein level analysis in each indicated group (n = 6 in each group); mice without IL‐6‐AB and Kyn in the control, CLP and LPS groups were taken for normalization, respectively. Kyn injection could decrease the p‐AKT and MyHC protein expression in gastrocnemius muscle for intra‐abdominal sepsis (IAS) mice treated with anti‐IL‐6 antibody. Mice without IL‐6‐AB and Kyn in the control, CLP and LPS groups were taken for normalization, respectively (n = 6 in each group). All data are shown as mean ± SEM. P values were determined by two‐tailed, unpaired Student's t test or one‐way analysis of variance (ANOVA). N.S, not significant. *P < 0.05, ** P < 0.01 and *** P < 0.001.
Discussion
Critical illness myopathy (CIM) induced by progressive muscle wasting among septic patients is associated with adverse outcomes such as increased intensive care unit (ICU) and post‐ICU mortality, failure of weaning from mechanical ventilation and long‐term disability. 21 In the current study, we demonstrated that IL‐6‐mediated non‐SM IDO‐1 overexpression leads to excessive Kyn influx in SM, through aberrant down‐regulation of MyHC and AKT pathway inhibition, which mediates sepsis‐induced muscle wasting. Our studies could provide a theoretical basis for the design of anti‐CIM therapies that target IDO‐1 in septic patients.
There are multiple mechanisms contributing to the rapid muscle wasting in sepsis, including steroids usage, insulin resistance, anorexia, nutrient deficiency and the systematic inflammatory response syndrome (SIRS). 3 Inflammation was among those that implicated as the primary diver of SM loss. For example, mice with LPS‐induced inflammation showed increased levels of IL‐6 in diaphragm and limb muscles in combination with reduced myofibre size. 3 , 22 Langen et al. also found that pulmonary inflammation by intra‐tracheal instillation of LPS in mice resulted in a rapid increase in circulating pro‐inflammatory cytokines including IL‐6, TNF‐α and IL‐1β, which preceded the loss of SM mass. 20 Then, using targeted therapeutics that depletes specific cytokines such as IL‐6 or TNF‐α seems to be a promising avenue for the treatment of muscle wasting. Indeed, several in vivo studies have highlighted the possibilities that genetic or pharmaceutical inhibition of IL‐6 could attenuate muscle wasting for mice with tumour or other induced cachexia. 23 , 24 However, studies examining anti‐IL‐6 in sepsis‐related muscle wasting are limited. Due to the complicated pathogenesis that may be involved in activating sepsis‐induced muscle wasting, early intervention with the most appropriate biologics could offer the best opportunity for remission.
IL‐6 rapidly peaks in within 24 h after sepsis, and early usage of anti‐IL‐6 within 4 h after CLP could improve survival in sepsis model. 18 This made IL‐6 a potential target molecule, particularly when clinical trials of TNF or IL‐1 inhibitor failed to show beneficial outcomes for sepsis. 25 , 26 In the current study, early application of anti‐IL‐6 markedly alleviated muscle wasting in septic mice. We also noticed some concerns that entirely abrogation of IL‐6 by gene knockout did not produce beneficial effects in sepsis models, 27 indicating that IL‐6 blockade methods and selection of proper timing were of great significance. In the current study, the IL‐6‐neutralizing antibody was injected intraperitoneally 48 h before CLP or LPS injection, and we observed a generally normal or slightly elevated serum IL‐6 level. Excessive amounts of IL‐6 could trigger the cytokine release syndrome known as ‘cytokine storm’; however, physiological levels of IL‐6 also play a positive role in pathogen control by activating acute‐phase reactions, immune responses and haematopoiesis. 28 Then, the key point is that anti‐IL‐6‐based therapy should alleviate cytokine release syndrome without diminishing the protective function of the IL‐6.
IL‐6 has been proven to induce muscle catabolism through the activation of JAK/STAT pathway, insulin‐like growth factor I (IGF‐I) or increased suppressor of cytokine signalling‐3 (SOCS3) expression. 29 However, effects of elevated IL‐6 on substrates for muscle protein synthesis remained to be further explored. As a pleiotropic cytokine, IL‐6 could utilize a variety of mechanisms to mediate the metabolism of SM, and it has become clear that IDO‐1 may serve as an important target. IDO‐1 was the rate‐limiting enzyme in conversion of Trp into Kyn, and activity of the IDO‐1 could be regulated by the IL‐6. Trp as essential aromatic amino acid is not abundant in protein and circulates at very low concentration in humans. 14 , 30 But a number of Trp derivatives have significant bioactivity including Kyn, quinolinic acids, serotonin and melatonin. Here, our study focused on Kyn, a main metabolic product catalysed by IDO‐1. Acute endurance exercise was known to boost the Kyn level in circulation, 31 and gut microbiota also play a key role in stimulating IDO‐1 activity. 11 For sepsis states, cytokine such as IL‐6 seems to be a more direct trigger by enabling the activation of IDO‐1. 17 , 32 In our study, IL‐6 blocking by neutralizing antibody could decrease the high expression of IDO‐1 in septic mice and reverse the accumulation of Kyn in SM.
Kyn has been demonstrated to promote SM catabolism in previous studies. In animals, an increase in Kyn may contribute to sarcopenia by causing increase of oxidative stress, 33 and elevated circulating levels of Kyn were also found to be associated with frailty. 34 Muscle Kyn aminotransferases (KATs) convert Kyn into kynurenic acid (Kyna), 35 and peroxisome proliferator‐activated receptor‐γ coactivator 1α1 (PGC‐1α1) could enhance the expression of KATs, thereby increasing energy efficiency and fatigue resistance by the disposal of Kyn from the SM. 36 The mechanisms have also been initially revealed, for Kyn could significantly decrease SM expression of the MyHC and p‐AKT. MyHC loss in muscles has been observed in patients with cachexia and in animal models, and this typically abundant myofibrillar protein greatly impacts muscle size and function. Activation of PI3K–AKT signalling could promote net protein accumulation by suppressing FOXO transcription factors, 37 and the impact of Kyn on PI3K–AKT signalling pathway has gained support. In one current study, IDO‐1 and Kyn pathway metabolites could activate PI3K–AKT signalling in the neoplastic colon epithelium to promote cancer cell proliferation and inhibit apoptosis, 38 whereas we observed opposite effect in the case of SM wasting.
There is little expression of IDO‐1 in SM, so Kyn is more likely produced elsewhere and then imported into muscle fibres. For example, in chronic kidney disease (CKD), the IDO‐1 activity was up‐regulated and was correlated with CKD disease severity due to the chronic inflammation. 39 However, in early stage of the acute kidney injury (AKI), the IDO‐1 activity was not affected, and concentrations of Kyn were even lower in patients with late or non‐recovery. 40 Then in the early critically ill patients, the kidney injury seems not be responsible for the elevated Kyn concentration. During IAS, the GI tract was the first involving organ. The gut mucosal barrier could be destroyed and then in turn enhance development of the IAS. 41 Due to the crucial role of the gut and the gut flora in metabolizing Trp, we deduced that intestinal Trp metabolism via IDO‐1 was an important source of Kyn in septic mice, and results of the experiment confirmed our hypothesis. Considering the pivotal role of Kyn in sepsis‐induced muscle wasting, Kyn was most likely to mediate the gut–muscle axis. Besides, Kyn significantly decreased the MCSA in both CLP and LPS mice treated with anti‐IL‐6 antibody; this suggested that sepsis‐induced increases in muscle Kyn levels may in fact be responsible for IL‐6‐induced muscle wasting.
Certain limitations need to be considered when interpreting our results. First, the sample size of the clinical cohort was relatively small. Second, only muscle samples were collected from the patients and Kyn levels were not dynamically evaluated. Third, blocking of IDO‐1 was achieved using antagonist. Although the effect was confirmed by HPLC, it was still not as definite as genetic knockout mice. Finally, we did not include in vitro experiment to validate the effect of Kyn on muscle before commencing animal experiment.
In conclusion, the present study shows for the first time the high Kyn level in serum and muscle of the IAS patients. Our findings in animal models therefore provided an explanation of the role of IDO‐1 and its metabolite Kyn in IAS‐induced muscle wasting. Our study highlighted the possibility that administering of IL‐6‐neutralizing antibody could alleviate the IAS‐induced muscle wasting by inhibiting IDO‐1 activity and reducing the influx of the Kyn into SM.
Funding
This study was funded by the National Natural Science Foundation of China (Grant Nos. 81970469 and 82172149).
Conflict of interest
The authors declare no conflicts of interest.
Supporting information
Figure S1. a, Picro‐Sirius Red Staining of rectus abdominis from IAS and non‐IAS patients. b, MCSA of the rectus abdominis from IAS and non‐IAS patients. N. S, not significant. *p < 0.05, **p < 0.01, ***p < 0.001.
Figure S2. a, Survival analysis results of the CLP and LPS mice. b, The weight of the gastrocnemius muscles and the proportion of gastrocnemius weight to body weight between the IAS and non‐IAS mice. c, MCSA of the CLP and LPS mice. d, Picro‐Sirius Red Staining of gastrocnemius muscles and relative Sirius Red positive area from CLP and LPS mice. e, Results from qRT‐PCR analysis of the indicated atrophy markers in gastrocnemius from non‐IAS and IAS mice at 72 hours after CLP or LPS injection. f, Measurement of serum IL‐6 and TNF‐α in non‐IAS and IAS mice at 72 hours after CLP or LPS injection. g, Relative IDO‐1 protein expression in colon, intestine, blood and muscle, and samples from control group were taken for normalization. h, Trp levels in the serum and gastrocnemius from C57BL/6 control mice and mice at 72 hours after CLP or LPS injection. N. S, not significant. *p < 0.05, **p < 0.01, ***p < 0.001.
Figure S3. a, Picro‐Sirius Red Staining and of gastrocnemius muscles from IAS mice model treated with navoximod or saline. b, c, Relative mRNA expression of MuRF1, Atrogin1, Myh2 and Myh4 in IAS mice model treated with navoximod or saline. N. S, not significant. *p < 0.05, **p < 0.01, ***p < 0.001.
Figure S4. a, IL‐6 levels of the serum harvested from the CLP or LPS injection mice accompany with IL‐6‐AB, homologous IGG or saline using. b,c, Gastrocnemius muscle weight and MCSA in sham CLP and Sham LPS mice treated with IL‐6 antibody, IgG or saline. d, Relative mRNA expression of MuRF1, Atrogin‐1, FOXO‐1, MUSA1 in each indicated group. e, Relative mRNA expression of Myh2 and Myh4 in each indicated group. N. S, not significant. *p < 0.05, **p < 0.01, ***p < 0.001.
Figure S5. a,b, Relative mRNA expression of the MuRF1, Atrogin‐1, Myh2, and Myh4 in gastrocnemius, and mice that without IL‐6‐AB and Kyn in the control. N. S, not significant. *p < 0.05, **p < 0.01, ***p < 0.001.
Xie T., Lv T., Zhang T., Feng D., Zhu F., Xu Y., Gu L., Guo Z., Ding C., and Gong J. (2023) Interleukin‐6 promotes skeletal muscle catabolism by activating tryptophan–indoleamine 2,3‐dioxygenase 1–kynurenine pathway during intra‐abdominal sepsis, Journal of Cachexia, Sarcopenia and Muscle, 14, 1046–1059, 10.1002/jcsm.13193
Tingbin Xie and Tengfei Lv contributed equally to this work.
Contributor Information
Chao Ding, Email: dingchao21@nju.edu.cn.
Jianfeng Gong, Email: gongjianfeng@nju.edu.cn.
References
- 1. Cecconi M, Evans L, Levy M, Rhodes A. Sepsis and septic shock. Lancet 2018;392:75–87. [DOI] [PubMed] [Google Scholar]
- 2. Ingels C, Gunst J, Van den Berghe G. Endocrine and metabolic alterations in sepsis and implications for treatment. Crit Care Clin 2018;34:81–96. [DOI] [PubMed] [Google Scholar]
- 3. Puthucheary ZA, Rawal J, McPhail M, Connolly B, Ratnayake G, Chan P, et al. Acute skeletal muscle wasting in critical illness. JAMA 2013;310:1591–1600. [DOI] [PubMed] [Google Scholar]
- 4. Hermans G, Casaer MP, Clerckx B, Güiza F, Vanhullebusch T, Derde S, et al. Effect of tolerating macronutrient deficit on the development of intensive‐care unit acquired weakness: a subanalysis of the EPaNIC trial. Lancet Respir Med 2013;1:621–629. [DOI] [PubMed] [Google Scholar]
- 5. Molano Franco D, Arevalo‐Rodriguez I, Roqué i Figuls M, Oleas NG, Nuvials X, Zamora J. Plasma interleukin‐6 concentration for the diagnosis of sepsis in critically ill adults. Cochrane Database Syst Rev 2019;4:CD011811. [DOI] [PMC free article] [PubMed] [Google Scholar]
- 6. Mat‐Nor MB, Md Ralib A, Abdulah NZ, Pickering JW. The diagnostic ability of procalcitonin and interleukin‐6 to differentiate infectious from noninfectious systemic inflammatory response syndrome and to predict mortality. J Crit Care 2016;33:245–251. [DOI] [PubMed] [Google Scholar]
- 7. Zanders L, Kny M, Hahn A, Schmidt S, Wundersitz S, Todiras M, et al. Sepsis induces interleukin 6, gp130/JAK2/STAT3, and muscle wasting. J Cachexia Sarcopenia Muscle 2022;13:713–727. [DOI] [PMC free article] [PubMed] [Google Scholar]
- 8. Chiappalupi S, Sorci G, Vukasinovic A, Salvadori L, Sagheddu R, Coletti D, et al. Targeting RAGE prevents muscle wasting and prolongs survival in cancer cachexia. J Cachexia Sarcopenia Muscle 2020;11:929–946. [DOI] [PMC free article] [PubMed] [Google Scholar]
- 9. Choy EH, Kavanaugh AF, Jones SA. The problem of choice: current biologic agents and future prospects in RA. Nat Rev Rheumatol 2013;9:154–163. [DOI] [PubMed] [Google Scholar]
- 10. Alves PKN, Cruz A, Silva WJ, Labeit S, Moriscot AS. Leucine supplementation decreases HDAC4 expression and nuclear localization in skeletal muscle fiber of rats submitted to hindlimb immobilization. Cell 2020;9:2582. [DOI] [PMC free article] [PubMed] [Google Scholar]
- 11. Agus A, Planchais J, Sokol H. Gut microbiota regulation of tryptophan metabolism in health and disease. Cell Host Microbe 2018;23:716–724. [DOI] [PubMed] [Google Scholar]
- 12. Tattevin P, Monnier D, Tribut O, Dulong J, Bescher N, Mourcin F, et al. Enhanced indoleamine 2,3‐dioxygenase activity in patients with severe sepsis and septic shock. J Infect Dis 2010;201:956–966. [DOI] [PubMed] [Google Scholar]
- 13. Marcos‐Pérez D, Sánchez‐Flores M, Maseda A, Lorenzo‐López L, Millán‐Calenti JC, Strasser B, et al. Frailty status in older adults is related to alterations in indoleamine 2,3‐dioxygenase 1 and guanosine triphosphate cyclohydrolase I enzymatic pathways. J Am Med Dir Assoc 2017;18:1049–1057. [DOI] [PubMed] [Google Scholar]
- 14. Dukes A, Davis C, el Refaey M, Upadhyay S, Mork S, Arounleut P, et al. The aromatic amino acid tryptophan stimulates skeletal muscle IGF1/p70s6k/mTor signaling in vivo and the expression of myogenic genes in vitro. Nutrition 2015;31:1018–1024. [DOI] [PMC free article] [PubMed] [Google Scholar]
- 15. Jiang H, Li F, Liu S, Sun H, Cui Y, Wu Y, et al. Indoleamine 2,3‐dioxygenase is upregulated in the brain of rats with acute pancreatitis. Pancreatology 2015;15:281–285. [DOI] [PubMed] [Google Scholar]
- 16. Singer M, Deutschman CS, Seymour CW, Shankar‐Hari M, Annane D, Bauer M, et al. The third international consensus definitions for sepsis and septic shock (Sepsis‐3). JAMA 2016;315:801–810. [DOI] [PMC free article] [PubMed] [Google Scholar]
- 17. Buras JA, Holzmann B, Sitkovsky M. Animal models of sepsis: setting the stage. Nat Rev Drug Discov 2005;4:854–865. [DOI] [PubMed] [Google Scholar]
- 18. Riedemann NC, Neff TA, Guo RF, Bernacki KD, Laudes IJ, Sarma JV, et al. Protective effects of IL‐6 blockade in sepsis are linked to reduced C5a receptor expression. J Immunol 2003;170:503–507. [DOI] [PubMed] [Google Scholar]
- 19. Kesarwani P, Prabhu A, Kant S, Kumar P, Graham SF, Buelow K, et al. Tryptophan metabolism contributes to radiation‐induced immune checkpoint reactivation in glioblastoma. Clin Cancer Res 2018;24:3632–3643. [DOI] [PMC free article] [PubMed] [Google Scholar]
- 20. Langen RC, Haegens A, Vernooy JH, Wouters EF, de Winther MPJ, Carlsen H, et al. NF‐κB activation is required for the transition of pulmonary inflammation to muscle atrophy. Am J Respir Cell Mol Biol 2012;47:288–297. [DOI] [PMC free article] [PubMed] [Google Scholar]
- 21. Schefold JC, Wollersheim T, Grunow JJ, Luedi MM, Z'Graggen WJ, Weber‐Carstens S. Muscular weakness and muscle wasting in the critically ill. J Cachexia Sarcopenia Muscle 2020;11:1399–1412. [DOI] [PMC free article] [PubMed] [Google Scholar]
- 22. Komatsu R, Okazaki T, Ebihara S, Kobayashi M, Tsukita Y, Nihei M, et al. Aspiration pneumonia induces muscle atrophy in the respiratory, skeletal, and swallowing systems. J CachexiaSarcopenia Muscle 2018;9:643–653. [DOI] [PMC free article] [PubMed] [Google Scholar]
- 23. Miller A, McLeod L, Alhayyani S, Szczepny A, Watkins D, Chen W, et al. Blockade of the IL‐6 trans‐signalling/STAT3 axis suppresses cachexia in Kras‐induced lung adenocarcinoma. Oncogene 2017;36:3059–3066. [DOI] [PubMed] [Google Scholar]
- 24. Petruzzelli M, Schweiger M, Schreiber R, Campos‐Olivas R, Tsoli M, Allen J, et al. A switch from white to brown fat increases energy expenditure in cancer‐associated cachexia. Cell Metab 2014;20:433–447. [DOI] [PubMed] [Google Scholar]
- 25. Reinhart K, Wiegand‐Lohnert C, Grimminger F, Kaul M, Withington S, Treacher D, et al. Assessment of the safety and efficacy of the monoclonal anti‐tumor necrosis factor antibody‐fragment, MAK 195F, in patients with sepsis and septic shock: a multicenter, randomized, placebo‐controlled, dose‐ranging study. Crit Care Med 1996;24:733–742. [DOI] [PubMed] [Google Scholar]
- 26. Opal SM, Fisher CJ Jr, Dhainaut JF, Vincent JL, Brase R, Lowry SF, et al. Confirmatory interleukin‐1 receptor antagonist trial in severe sepsis: a Phase III, randomized, double‐blind, placebo‐controlled, multicenter trial. Crit Care Med 1997;25:1115–1124. [DOI] [PubMed] [Google Scholar]
- 27. Remick DG, Bolgos G, Copeland S, Siddiqui J. Role of interleukin‐6 in mortality from and physiologic response to sepsis. Infect Immun 2005;73:2751–2757. [DOI] [PMC free article] [PubMed] [Google Scholar]
- 28. Tanaka T, Narazaki M, Kishimoto T. IL‐6 in inflammation, immunity, and disease. Cold Spring Harb Perspect Biol 2014;6:a016295. [DOI] [PMC free article] [PubMed] [Google Scholar]
- 29. Moresi V, Adamo S, Berghella L. The JAK/STAT pathway in skeletal muscle pathophysiology. Front Physiol 2019;10:500. [DOI] [PMC free article] [PubMed] [Google Scholar]
- 30. Badawy AA. Tryptophan availability for kynurenine pathway metabolism across the life span: control mechanisms and focus on aging, exercise, diet and nutritional supplements. Neuropharmacology 2017;112:248–263. [DOI] [PubMed] [Google Scholar]
- 31. Schlittler M, Goiny M, Agudelo LZ, Venckunas T, Brazaitis M, Skurvydas A, et al. Endurance exercise increases skeletal muscle kynurenine aminotransferases and plasma kynurenic acid in humans. Am J Physiol Cell Physiol 2016;310:C836–C840. [DOI] [PubMed] [Google Scholar]
- 32. Cervenka I, Agudelo LZ, Ruas JL. Kynurenines: tryptophan's metabolites in exercise, inflammation, and mental health. Science 2017;357:eaaf9794. [DOI] [PubMed] [Google Scholar]
- 33. Kaiser H, Yu K, Pandya C, Mendhe B, Isales CM, McGee‐Lawrence ME, et al. Kynurenine, a tryptophan metabolite that increases with age, induces muscle atrophy and lipid peroxidation. Oxid Med Cell Longev 2019;2019:9894238. [DOI] [PMC free article] [PubMed] [Google Scholar]
- 34. Kim BJ, Hamrick MW, Yoo HJ, Lee SH, Kim SJ, Koh JM, et al. The detrimental effects of kynurenine, a tryptophan metabolite, on human bone metabolism. J Clin Endocrinol Metab 2019;104:2334–2342. [DOI] [PMC free article] [PubMed] [Google Scholar]
- 35. Agudelo LZ, Femenía T, Orhan F, Porsmyr‐Palmertz M, Goiny M, Martinez‐Redondo V, et al. Skeletal muscle PGC‐1α1 modulates kynurenine metabolism and mediates resilience to stress‐induced depression. Cell 2014;159:33–45. [DOI] [PubMed] [Google Scholar]
- 36. Agudelo LZ, Ferreira DMS, Dadvar S, Cervenka I, Ketscher L, Izadi M, et al. Skeletal muscle PGC‐1α1 reroutes kynurenine metabolism to increase energy efficiency and fatigue‐resistance. Nat Commun 2019;10:2767. [DOI] [PMC free article] [PubMed] [Google Scholar]
- 37. Glass DJ. Skeletal muscle hypertrophy and atrophy signaling pathways. Int J Biochem Cell Biol 2005;37:1974–1984. [DOI] [PubMed] [Google Scholar]
- 38. Bishnupuri KS, Alvarado DM, Khouri AN, Shabsovich M, Chen B, Dieckgraefe BK, et al. IDO1 and kynurenine pathway metabolites activate PI3K‐Akt signaling in the neoplastic colon epithelium to promote cancer cell proliferation and inhibit apoptosis. Cancer Res 2019;79:1138–1150. [DOI] [PMC free article] [PubMed] [Google Scholar]
- 39. Aregger F, Uehlinger DE, Fusch G, Bahonjic A, Pschowski R, Walter M, et al. Increased urinary excretion of kynurenic acid is associated with non‐recovery from acute kidney injury in critically ill patients. BMC Nephrol 2018;19:44. [DOI] [PMC free article] [PubMed] [Google Scholar]
- 40. Schefold JC, Zeden JP, Fotopoulou C, von Haehling S, Pschowski R, Hasper D, et al. Increased indoleamine 2,3‐dioxygenase (IDO) activity and elevated serum levels of tryptophan catabolites in patients with chronic kidney disease: a possible link between chronic inflammation and uraemic symptoms. Nephrol Dial Transplant 2009;24:1901–1908. [DOI] [PubMed] [Google Scholar]
- 41. Klingensmith NJ, Coopersmith CM. The gut as the motor of multiple organ dysfunction in critical illness. Crit Care Clin 2016;32:203–212. [DOI] [PMC free article] [PubMed] [Google Scholar]
Associated Data
This section collects any data citations, data availability statements, or supplementary materials included in this article.
Supplementary Materials
Figure S1. a, Picro‐Sirius Red Staining of rectus abdominis from IAS and non‐IAS patients. b, MCSA of the rectus abdominis from IAS and non‐IAS patients. N. S, not significant. *p < 0.05, **p < 0.01, ***p < 0.001.
Figure S2. a, Survival analysis results of the CLP and LPS mice. b, The weight of the gastrocnemius muscles and the proportion of gastrocnemius weight to body weight between the IAS and non‐IAS mice. c, MCSA of the CLP and LPS mice. d, Picro‐Sirius Red Staining of gastrocnemius muscles and relative Sirius Red positive area from CLP and LPS mice. e, Results from qRT‐PCR analysis of the indicated atrophy markers in gastrocnemius from non‐IAS and IAS mice at 72 hours after CLP or LPS injection. f, Measurement of serum IL‐6 and TNF‐α in non‐IAS and IAS mice at 72 hours after CLP or LPS injection. g, Relative IDO‐1 protein expression in colon, intestine, blood and muscle, and samples from control group were taken for normalization. h, Trp levels in the serum and gastrocnemius from C57BL/6 control mice and mice at 72 hours after CLP or LPS injection. N. S, not significant. *p < 0.05, **p < 0.01, ***p < 0.001.
Figure S3. a, Picro‐Sirius Red Staining and of gastrocnemius muscles from IAS mice model treated with navoximod or saline. b, c, Relative mRNA expression of MuRF1, Atrogin1, Myh2 and Myh4 in IAS mice model treated with navoximod or saline. N. S, not significant. *p < 0.05, **p < 0.01, ***p < 0.001.
Figure S4. a, IL‐6 levels of the serum harvested from the CLP or LPS injection mice accompany with IL‐6‐AB, homologous IGG or saline using. b,c, Gastrocnemius muscle weight and MCSA in sham CLP and Sham LPS mice treated with IL‐6 antibody, IgG or saline. d, Relative mRNA expression of MuRF1, Atrogin‐1, FOXO‐1, MUSA1 in each indicated group. e, Relative mRNA expression of Myh2 and Myh4 in each indicated group. N. S, not significant. *p < 0.05, **p < 0.01, ***p < 0.001.
Figure S5. a,b, Relative mRNA expression of the MuRF1, Atrogin‐1, Myh2, and Myh4 in gastrocnemius, and mice that without IL‐6‐AB and Kyn in the control. N. S, not significant. *p < 0.05, **p < 0.01, ***p < 0.001.