Abstract
An active pH-sensitive film based on pectin-sodium alginate-xanthan gum composite film (PAX) was prepared, containing blueberry anthocyanin extract (BAEs), to monitor the freshness of blueberries. The effects of different contents of BAEs on the microstructure and physical properties of intelligent polysaccharide films were comprehensively evaluated. It was found that 75-BAEs-PAX film had a solid response to pH value and showed different and easily distinguishable colors at different pH values. In addition, when the freshness of blueberries stored at different temperatures (−1 °C, 4 °C, 10 °C, 15 °C, 25 °C) was monitored, the color of 75-BAEs-PAX film changed from purple to light pink from neutral to acidic environment, which was consistent with the change of pH value of blueberries from fresh to spoilage. The Arrhenius equation verified that the difference between the activation energy of the indicator film and the blueberry quality was less than 25 kJ/mol. Therefore, the 75-BAEs-PAX film can be used as an indicator film for blueberries freshness monitoring. In this study, the freshness of blueberries was monitored by BAEs, and the purpose of using ontology to monitor ontology was achieved. The freshness of blueberries was visualized during storage and transportation, which could effectively reduce the waste of blueberries. In the future, the method of ontology monitoring ontology could be extended to other foods.
Keywords: Blueberry anthocyanins, Compound polysaccharide, pH-responsive film, Freshness indicator films, Blueberry fruits
Graphical abstract

Highlights
-
•
A composite polysaccharide pH-responsive film containing BAEs was developed.
-
•
Blueberry anthocyanins are used to indicate the freshness of blueberries.
-
•
75-BAEs-PAX film had a different color reaction at pH 2−12.
-
•
75-BAEs-PAX film could monitor the freshness of blueberries at various temperatures , and the color changes significantly.
-
•
The accuracy of 75-BAEs-PAX film in monitoring blueberry quality was verified by Arrhenius equation.
1. Introduction
Intelligent packaging can improve the quality and safety of products by monitoring, sensing, identifying, and other intelligent systems to give feedback on the quality of the environment or packaging contents [1,2]. In recent years, the increasing consumer demand for healthy, safe, functional, and convenient packaging, along with the growing demand for cold chain transportation and the high interest in cold chain logistics [3]. The spoilage process of food products was accompanied by the growth of organic acids, alkaloids, and carbon dioxide, which changed the pH of the packaging environment [4]. Therefore, the pH of the packaging environment was closely related to the freshness of the food.
Intelligent packaging with pH indication provided consumers with real-time, accurate food freshness information through intuitive visual color changes [5,6]. pH indicators usually contain dyes that were sensitive to pH changes. Compared with synthetic dyes, natural dyes had the advantages of being safe and environmentally friendly. Anthocyanin was a natural water-soluble dye that provided bright colors (blue, red, and purple) of leaves, flowers, and fruits and could be used as a pH indicator. Anthocyanins had a wide range of biological activities, including antioxidant, antibacterial, and anti-inflammatory action, and were edible, safe, and widely used in food packaging [7]. Natural anthocyanins, such as anthocyanins in purple sweet potatoes, grape skins, and rose anthocyanins, have been used in intelligent packaging [[8], [9], [10]]. Blueberry extract could become an inhibitor of carbonic anhydrase with pharmaceutical value; blueberry had the title of “king of anthocyanins”, and blueberry anthocyanin extracts (BAEs) were varied, non-toxic, non-polluting and sensitive in color, and have high sensitivity to CO2. Therefore, BAEs were used as pH-sensitive dyes in this study.
In order to cure anthocyanins in indicator films, researchers have developed several methods. Researchers choose biodegradable bio-materials such as chitosan, cellulose nanocrystals, polyvinyl alcohol, gelatin, sodium alginate (SA), pectin, and xanthan gum (XG), among others [[11], [12], [13], [14]]. SA has excellent film-forming properties and gelation ability, pectin has excellent bioactivity, excellent biodegradability, compatibility and perfect film forming ability [15,16], XG has excellent solubility, compatibility and stability at low concentrations [17], and multi-component films can improve the deficiencies of single-component films. Glycerol has the effect of plasticizing and moisturizing, which could help prevent film drying. Glycerol is a colorless and non-toxic liquid. It is a sweetener and moisturizer commonly used in the food processing industry. Most of them appear in sports foods, dairy substitutes, and preservative films [18,19]. Yang et al. [20] developed a polysaccharide (pectin, SA, XG) indicator film based on raspberry extract. They found that the indicator film was only used for monitoring protein-rich foods and was not suitable for monitoring fruits and vegetables. The freshness of fruits and vegetables as necessities of life is crucial. Developing indicator films for monitoring fruits and vegetables can promote the safe transportation and preservation of fruits and vegetables.
In this paper, we develop a pH-responsive film based on pectin, SA, and XG complex polysaccharides (PAX). The intelligent indicator film contained BAEs for monitoring the freshness of blueberries. The effects of different concentrations of BAEs on the physicochemical properties of PAX films were studied and analyzed. Based on the responsiveness of BAEs-PAX film pH, we discussed the potential of indicator film for monitoring blueberry freshness at different temperatures.
2. Materials and methods
2.1. Chemicals and material
Northcountry blueberry, picked from Zhongwo blueberry base in Hongqi Township, Harbin, China. Pectin, SA, XG, glycerin, and anhydrous calcium chloride, purchased from Sino pharm Chemical Reagent Co., Ltd., Shanghai, China; anhydrous ethanol, purchased from Tianjin Guangfu Fine Chemical Research Institute, Tianjin, China. Analytically pure reagents were used.
2.2. Extraction of BAEs
Anthocyanins were extracted according to the method of Xue [19]. Washed and dispersed the blueberries evenly on a porcelain plate, then dried them in an oven (Shanghai Huyueming Scientific Instrument Co., Ltd, Shanghai, China) until the weight no longer changed. The oven temperature was set to 50 °C. After drying, the raw materials were pulverized, screened through 90 mesh, and stored in brown sample bottles protected from light. Blueberry dry powder was mixed with 75% ethanol at 1:10 g/mL and extracted in a water bath for 3 h. The extract was filtrated, and a rotary evaporator removed ethanol to obtain anthocyanins concentrate. The extraction solution was loaded into an AB-8 macroporous adsorption resin column (1.5 cm × 60 cm) and left for 2 h. The soluble impurities, such as saccharides, were washed with distilled water, followed by 70% ethanol solution (5-column volume; flow rate: 2 mL/min) elution of anthocyanins until the chromatographic column was colorless; the eluent was concentrated under pressure and then freeze-dried to obtain BAEs freeze-dried powder, its purity was 25%.
2.3. Color and spectral properties of BAEs solutions in various pH ranges
At 25 ± 1 °C, a certain amount of BAEs solution was diluted and divided into 12 parts. Then, the buffer solution with a pH of 2–13 was poured into each of them in equal volumes. Observed the color change process of the solution under different pH conditions and took photos to record. The transmittance curve of the solutions was then measured in the wavelength range of 450 nm–800 nm using a UV–vis spectrophotometer (Nanjing Feiler Instrument Co., Ltd, Nanjing, China).
2.4. Preparation of BAEs-PAX films
The BAEs-PAX indicator films were made according to the method described by Ma et al. [21]. In a study on the optimum content of base material in PAX glue, glycerol with a quality fraction of 1.5% was weighed as an additive, and then 0.6% pectin, 0.5% SA, and 0.2% XG were added to deionized water at 80 °C. Pectin, SA, and XG were mixed in a constant temperature water bath (Tianjin Tiantai Instrument Co., Ltd, Tianjin, China) for 2 h with a booster stirrer (Shanghai Zhenjie Experimental Equipment Co., Ltd, Shanghai, China) until they were completely dissolved. After that, 0.25%, 0.5%, 0.75%, and 1.0% of BAE freeze-dried powder with different mass fractions were added, and the film solution was thoroughly mixed. In order to prevent the water loss and external impurities from entering the film fluid during stirring, sealed the beaker with PE cling film and let it stand until the film solution was cool. The film liquid was poured into the disposable square Petri dish of 150 mm × 150 mm to maintain its height at 5 mm. Then 1.0% calcium chloride solution was evenly sprayed on the surface of the membrane fluid. Finally, after standing for 3 h, the culture dish was placed in an oven at 60 °C for drying; removed indicator film from the culture dish was at 25 °C, and the indicator film was placed in a dryer to balance. The prepared film was named PXA film, 25-BAEs-PAX film, 50-BAEs-PAX film, 75-BAEs-PAX film, and 100-BAEs-PAX film, respectively.
2.5. Physicochemical properties of BAEs-PAX films
2.5.1. Physical appearance and color
CIELAB analysis allowed the evaluation of the quality of food products using L*, a*, and b* without destroying their structure, in addition to characterizing the color of anthocyanins in fruits and vegetables. This paper evaluated the color of the indicator films using L*, a*, and b*.
The prepared film samples were placed flat on white paper and photographed, and recorded color changes were. The automatic colorimeter measured the films' L*, a*, and b*. Each sample was repeated 3 times, and the average value was calculated. The color difference value ΔE was calculated according to Eq. (1).
| (1) |
Where L*, a* and b* were the color parameters of the film sample; L0, a0 and b0 were the color parameters of the standard whiteboard.
2.5.2. Thickness and density
The thickness of the films was measured at 3 randomly selected points with a spiral micrometer (Mitutoyo, Tokyo, Japan), and the average value was used to determine the film's thickness.
The film was cut into 2 cm × 2 cm size and weighed to get the mass of the film. The volume size could be obtained according to its area and thickness. The density of the film was calculated according to the following equation (Eq. (2)).
| (2) |
Where was the density of the film, g/mm3; where was the mass of the film, g; a was the length of the film, mm; b was the width of the film, mm; c was the thickness of the film, mm.
2.5.3. Tensile strength (TS) and elongation at break (EAB)
The film was cut into a strip of 100 mm × 10 mm using an LD-05 computer control tensile testing machine (Changchun Ming moon Small Testing Machine Co., Ltd, Changchun, China). The sample was placed on the tensile testing machine. The clip distance was set at 50 mm, and the speed was 50 mm/min. The TS and EAB were calculated according to equations (Eqs. (3), (4)).
| (3) |
Where was TS, MPa; P was the fracture load, N; b was the film width, mm; d was the film thickness, mm.
| (4) |
Where was EAB, %; L0 was the distance between the original marking lines indicating the film, mm; L was the distance between the marking lines when the film breaks, mm.
2.5.4. Light transmittance and opacity
The tests were conducted according to the methods in the national standard GB2410-2008, and the American Society for Testing and Materials standard ASTM D1003-61. The transmittance and opacity of the film were measured using a transmittance haze tester (Shanghai Instrument Electrophysical Optical Instrument Co., Ltd, Shanghai, China). The Light transmittance and opacity were calculated according to equations (Eqs. (5), (6)).
| (5) |
| (6) |
Where Tt was transmittance; H was the fog intensity; T1 was the total transmitted light flux through the sample, lm; T2 was the luminous incident flux, lm; T3 was the scattered light flux of the instrument, lm; T4 was the scattered light flux of the instrument, lm.
2.5.5. Moisture content (MC), swelling capacity (SC) and water solubility (WS)
According to Yong et al. [22], the initial mass of the indicator was recorded, and then the indicator after weighing was put into the oven, dried at 105 °C until the mass remained unchanged and weighed again. MC was calculated according to equation (Eq. (7)).
| (7) |
Where MC was the moisture content of the film, %; m1 was the initial mass of the film, g; m2 was the mass of the film after drying, g.
The SC was measured according to the method of Wei et al. [23]. Under the condition of 25 °C, the indicator of 2 cm × 2 cm was weighed and the mass was recorded. Then it was placed in a Petri dish containing 20 mL distilled water. After standing for 24 h, the film was taken out, and the water on the surface of the film was quickly dried and weighed. The swelling degree was calculated according to equation (8).
| (8) |
Where SC was the swelling degree of the film, %; M1 was the initial mass of the film, g; M2 was the mass of film after soaking for 24 h, g.
The determination of WS was carried out according to the method of Kanatt et al. [24]. The freshness indicator was cut into 2 cm × 2 cm, and the sample was dried to constant weight at 105 °C. The thoroughly dried indicator was then placed in a Petri dish containing 20 mL of distilled water and sealed with plastic wrap. It was set at 25 °C for 24 h and removed. After the water on the surface of the indicator was released, it was placed again in the oven at 105 °C. The stove was dried to constant weight, and the water solubility was calculated according to equation (9).
| (9) |
Where WS was the swelling degree of the film, %; W1 was the mass of the film after drying, g; W2 was the mass of the film dried again after soaking for 24 h, g.
2.5.6. Water vapor transmittance rate (WVTR)
According to the method of Khoshgozaran-Abras et al. [25], the test was carried out using the test principle of the wet cup weighing method. The composite film was cut into samples with a diameter of 75 mm, clamped in three moisture-permeable cups, and tested on the moisture-permeable cup bracket inside the water vapor transmittance tester (Jinan Languang Electromechanical Technology Co., Ltd, Jinan, China). WVTR followed the equation (Eq. (10)).
| (10) |
Where WVTR was water vapor transmittance rate, g/(m·s·Pa); was moisture quality through composite film, g; x was the thickness of the composite film, mm; t was the time for water to penetrate the composite film, s; A was the transmittance area of the composite film, m2; ΔP was the water vapor pressure difference on both sides of the composite film, Pa.
2.6. Structural characterization of BAEs-PAX films
2.6.1. Fourier transform infrared spectroscopy (FTIR) analysis
The FTIR was measured according to the method described by Khanjanzadeh et al. [26]. After cutting the freshness indicator film into a sample of 1 cm × 1 cm in size, all spectra were recorded from 4000 cm−1 to 500 cm−1 at a resolution of 4 cm−1 by an infrared spectrometer (Nicolet, Madison, USA) and in attenuated total reflection (ATR) mode.
2.6.2. Scanning electron microscope (SEM) analysis
According to the method of Zhai et al. [27], the surface and cross-sectional morphology of the freshness indicator film was recorded using a SEM (FEI, Hillsboro, USA) and slightly adjusted. The films with different anthocyanins contents were cut to 1 cm × 1 cm, and the film samples were fixed on the metal table with conductive adhesive and sprayed with gold. In the vacuum state, the acceleration voltage was 15 kV.
2.7. BAEs-PAX film' response to pH changes
The pH responsiveness of the film was tested according to Alizadeh-Sani et al. [28], with some alterations. At 25 ± 1 °C, the indicator films were cut into 3 cm × 3 cm and soaked in buffer solution with pH = 2, 4, 6, 8, 10, and 12 for 1 min. After that, the indicator films were removed; the filter paper absorbed the surplus buffer solution. The chromaticity of the needle after the color change was recorded by a chromaticity meter (Konica Minolta, Tokyo, Japan).
2.8. Color stability
The 25-BAEs-PAX film, 50-BAEs-PAX film, 75-BAEs-PAX film, and 100-BAEs-PAX film were stored at two ambient temperatures of 25 °C and 4 °C for 24 days, during which the color changes were observed. A color difference meter recorded the L*, a*, and b*. The color difference value ΔE was calculated according to Eq. (1), and the ΔE evaluated the color stability of the freshness indicator film. The storage condition of the indicator film was at 25 °C, without light avoidance treatment, and without precise control of pH; the pH value was the pH index in the air; it was stored in a refrigerator at 4 °C, without dark treatment and precise control of pH. Its pH value was the pH index in the air, which was used to simulate the storage conditions of blueberries.
2.9. Trials on monitoring the blueberries freshness
The freshness indicator film was divided into 5 groups and placed in a packaging box containing blueberries at −1 °C, 4 °C, 10 °C, 15 °C, and 25 °C, respectively. The color difference of the indicator was measured every other time. Blueberry quality was assessed by the method of Lu et al. [29], and the contents of total soluble solids (TSS), titratable acid (TA), and malondialdehyde (MDA) were determined. A mass spectrometer (Brookfield, Middleboro, USA) determined the hardness of blueberries with a circular probe of 2 mm diameter, the test speed of 0.5 mm/s, and the trigger force of 5 g. The test position was the lateral part of the blueberries, and 20 blueberries were randomly taken for measurement each time, and the average hardness, kg/cm2, was calculated [30]. The weight loss rate of blueberries was determined based on: weight loss rate = (mass of blueberries before storage-mass of blueberries at the time of measurement)/mass of blueberries before storage × 100%. Each sample was measured five times, with the average value used.
The Arrhenius equation was as follows:
| (11) |
Where k was the reaction rate; A was the pre-exponential factor; Ea was activation the energy, J/mol; T was the absolute temperature, K; R was the gas constant (8.3144 J/mol·k).
2.10. Statistical analysis
The experimental data were expressed as mean ± standard deviation. IBM SPSS Statistics 25 was used for statistical analysis, which was realized through adopting one-way analysis of variance (ANOVA). The Duncan test was used to characterize statistical differences between test data, and the results influences were considered significance (P < 0.05). Origin 2018 was used for plotting.
3. Results
3.1. Color and spectral characteristic of BAEs in different buffer solutions
BAEs freeze-dried powder itself was purple, and the color change of anthocyanin aqueous solution at pH 2.0−13.0 was shown in Fig. 1(A). BAEs were red when pH was lower than 4.0, the fundamental changed from light pink to purple when pH was 5.0–8.0, brownish yellow when pH was 9.0–11.0, and blue-green when pH was higher than 11.0. Ultraviolet absorption curves of BAEs solution at different pH values are shown in Fig. 1(B). At pH < 3.0, BAEs solution had an absorption peak at 534 nm, which was consistent with the red color of the yellow terminal salvation. At pH 4.0−8.0, the color of the anthocyanin solution changed from light pink to purple. The absorption peak at 662 nm decreased, and two new absorption peaks appeared at 720 nm and 780 nm due to the transformation of yellow terminal salt ions to neutral quinines. When the pH was 9.0–11.0, the color changed to brownish-yellow. With the increased alkalinity of the solution, part of the quinines was converted to chalcone, and the other part was decomposed to aldehydes and phenols [31]. When the pH was more than 11.0, the solution turned blue-green, probably because the quinone structure of anthocyanin was rapidly converted into chalcone and decomposed under alkaline conditions. The corresponding color change, maximum absorption peak displacement, and strength increase and decrease in Fig. 1(B) were caused by the change of anthocyanin conjugated structure. It has been shown that anthocyanin mainly exists in the form of red 2-phenyl benzopyran cations under strongly acidic conditions. As the pH level increased, the anthocyanin eventually transformed into a pink and virtually colorless methanol pseudo base and a blue quinone base. Anthocyanin was mainly present in the form of yellow chalcone when pH was raised to strongly basic [32].
Fig. 1.
The photo of anthocyanins aqueous solution at different pH (A); UV–Vis spectra of anthocyanins in different pH buffers (B).
3.2. Physicochemical properties of BAEs-PAX films
3.2.1. Appearance and color of BAEs-PAX films
Color is an essential characteristic of the indicator's appearance, and the brightly colored indicator positively affects the subsequent pH response. The chroma parameters of freshness indicator films with various degrees of BAEs supplementary content were shown in Table 1. As can be observed from the table, the degree of freshness shifts from a light pink to dark purple color as the amount of BAEs in the sample increases. According to several studies, adding eggplant anthocyanins to the indicator film also generated a color shift similarly [33]. The L* of the indicator decreased from 77.38 to 73.20. Although the L* showed a pattern of decline, a higher number indicated that the degree of transparency remained relatively high. When BAEs increased from 0.25% to 1.00%, a* increased from 4.71 to 9.27, and b* decreased from 0.39 to −1.02. The changes of a* and b* indicated that with the increased of BAEs addition, the red and blue features of freshness indicators increased, while the green and yellow features decreased.
Table 1.
Color parameters and photos of freshness indicator films with different BAEs additions.
| Freshness indicator films | L* | a* | b* | Film photo |
|---|---|---|---|---|
| 25-BAEs-PAX | 77.38 ± 0.45a | 4.71 ± 0.56c | 0.39 ± 0.02a |  |
| 50-BAEs-PAX | 76.05 ± 0.76b | 5.87 ± 0.88b | −0.54 ± 0.01b |  |
| 75-BAEs-PAX | 74.13 ± 0.50c | 8.27 ± 0.79a | −0.87 ± 0.17bc |  |
| 100-BAEs-PAX | 73.20 ± 0.41d | 9.27 ± 0.54a | −1.02 ± 0.38c |  |
Different letters (a–d) within a column indicate significant differences among samples (P < 0.05).
3.2.2. Thickness and density of BAEs-PAX films
As seen in Fig. 2(A), the thickness of the freshness indicator films increased with supplemental anthocyanins levels, increasing by 16.67%, 20.00%, 30.00%, and 33.33%, respectively. Among them, the thickness of the 100-BAEs-PAX film was the largest, 0.08 mm. Wang et al. [34] used rose anthocyanins to prepare the indicator film. With the increase of anthocyanin content, the thickness of the indicator film gradually increased, which was consistent with the results of this study. This also reflected that the higher the anthocyanin content, the greater the thickness of the film. The addition of BAEs will form a new intermolecular hydrogen bond in the indicator system, which was more favorable to the orderly arrangement of its side chain so that the structure will become denser. The decreasing density can also prove this analysis result.
Fig. 2.
Performance of freshness indicator films. TS and EAB (A); Thickness and density (B); The light transmittance and opacity (C); WVTR (D). Data are plotted as averages ± S.D. (n = 3). a-e Averages ± S.D. in each column and at the same time of determination of each parameter with different letters are significantly different (p < 0.05).
3.2.3. TS and EAB of BAEs-PAX films
Mechanical properties embody intermolecular cross linking, which particularly impacts the integrity of indicator film in the application process. As shown in Fig. 2(B), the TS of the indicator film increased from 26.26 MPa to 29.33 MPa with the addition of BAEs in the range of 0.25%–0.75%. The reason was that the hydroxyl groups in BAEs form hydrogen bonds with molecules in the indicator film substrate, so that the grid structure of the indicator film was denser and the rigidity was enhanced [33]. When the concentration of BAEs increased from 0.25% to 1.00%, the EAB decreased from 12.45% to 8.54%, which may be because the addition of BAEs will fill the gap between the original polysaccharide substance and the plasticizer structure, thus negatively affecting the crosslinking between water molecules and the indicator substrate, resulting in the decrease of EAB [19]. However, excessive BAEs will lead to poor compatibility between indicator substrates. BAEs were unevenly dispersed, and agglomeration occurred on the surface of the indicator film, resulting in a continuous decline of mechanical properties, the film became hard and brittle. Studies have shown that biopolymer films will be affected by plant extracts. That is, the mechanical properties of composite films will be reduced after adding extracts, but this adverse factor was related to the preparation method, technological conditions, the number of plant extracts, and the choice of the film substrate.
3.2.4. Light transmittance and opacity of BAEs-PAX films
As seen in Fig. 2(C), the transmittance of the freshness indicator film showed a downward trend when the anthocyanins addition level increased. When the addition amount of anthocyanin increased from 0.00% to 1.00%, the light transmittance decreased from 87.2% to 58.9%. The opacity increased from 30.7% to 75.8% because the BAEs destroyed the ordered arrangement of molecular chains among the three polysaccharides. Moreover, the crystalline structure of the freshness indicator film may be destroyed by the electrostatic attraction after combining anthocyanin and polysaccharide substrate, which will enhance its scattering and reflection of the beam the transmittance will gradually decrease. In the study, Cao et al. [35] found that with the increase of intelligent cellulose fibers, the film became more and more opaque due to the decrease in the film's transmittance caused by the matrix's action. However, the matrix in this paper did not lead to the change of transmittance. In addition, the added BAEs were purple and could absorb a certain amount of ultraviolet light, so their light absorption will also reduce the transmittance. These results indicated that the BAEs-PAX film has a specific UV shielding effect and can reduce food spoilage caused by UV.
3.2.5. MC, SC and WS of BAEs-PAX films
As can be seen from Table 2, MC, SC and WS all showed a decreasing trend to varying degrees when anthocyanins content increased. This may be due to many hydroxyl groups in the anthocyanin structure. The hydrophilic hydroxyl groups in the polysaccharide substance will form intermolecular hydrogen bonds with the hydroxyl groups in the anthocyanin. This interaction will limit the cross-linking of water molecules and polysaccharide substances, resulting in a significant decrease in MC. However, Feng and Wang [36] showed that the film MC increased firstly and then decreased with the increase of anthocyanins addition level in blueberry, which may be caused by the different substrates used. After the MC of the freshness indicator film decreased, its rigidity was enhanced. The greater swelling capacity will lead to a faster release of pigment, which was unfavorable to the color reaction of the indicator film. The results are shown in Table 2, when the concentration of anthocyanin increased from 0.00% to 1.00%, the swelling degree of the freshness indicator film became 43.25%. As the SC of the indicator was significantly reduced, the hydrophilic group was reduced so that its adsorption to water was also significantly reduced. The film's physical barrier and resistance to water were reflected in its WS. According to the data in Table 2, the WS of the indicator films decreased because of the increase in anthocyanins content. This was because anthocyanins contain many hydrophilic groups, and poly-phenols form a network structure with other polysaccharide substrates, enhancing the interaction with water.
Table 2.
Effects of different BAEs additions on the MC, SC and WS of the freshness indicator film.
| Freshness indicator films | MC (%) | SC (%) | WS (%) |
|---|---|---|---|
| PAX | 49.19 ± 0.03a | 754.82 ± 2.33a | 57.66 ± 1.31a |
| 25-BAEs-PAX | 42.84 ± 0.27b | 459.78 ± 2.09b | 50.28 ± 1.75b |
| 50-BAEs-PAX | 33.49 ± 0.31c | 416.33 ± 2.54c | 46.50 ± 0.30c |
| 75-BAEs-PAX | 30.49 ± 0.09d | 395.80 ± 2.78d | 45.31 ± 0.56cd |
| 100-BAEs-PAX | 27.21 ± 1.33e | 326.34 ± 1.77e | 44.52 ± 0.34d |
Different letters (a–e) within a column indicate significant differences among samples (P < 0.05).
3.2.6. WVTR of BAEs-PAX films
WVTR as an essential test index for freshness indicator films, could reflect the barrier performance of the indicator from the side. Fig. 2(D) shows that the WVTR of the freshness indicator films decreased from 2.42 × 10⁻¹⁰ g/(m s Pa) to 1.88 × 10⁻¹⁰ g/(m s Pa) when the anthocyanins addition was increased to 0.75%, which was due to the addition of anthocyanins, indicating that the reduction of free hydrophilic groups in the membrane results in a decrease in the free space between molecules. The structure became more compact so that water molecules find it difficult to penetrate [37]. In a study of pH-sensitive films made from carrageenan polyphenol extract, Liu et al. [38] found that polyphenol extracts reduced the WVTR of composite films. They attributed this reduction to forming of a dense network structure due to the interaction between carrageenan and polyphenol molecules. When the anthocyanins were in excess (BAEs = 1.00%), the WVTR permeability increased slightly, perhaps because the poor dispersion of BAEs in the indicator film, the presence of pores, bubbles, cracks, and other structures had a specific impact on the water molecules in the indicator film, so the barrier performance was poor. In addition, the barrier properties were also affected by many factors, such as the nature of the polysaccharide substrate itself, its complex structure, and the degree of crosslinking of the plasticizer.
3.3. Structural characterization of BAEs-PAX films
3.3.1. FTIR analysis of BAEs-PAX films
FTIR spectroscopy can reflect the interaction between the indicator film substrates, and the mixing of different substrates will cause the peak shape of the indicator film to move and change. It can be seen from Fig. 3(A) that the film-forming substrate, BAEs-PAX composite film and intelligent indicator film had obvious strong and wide O–H stretching vibration peak near 3292 cm−1, which was due to the presence of hydroxyl groups in pectin, SA, XG, and glycerol. The two characteristic peaks at 2934 cm−1 and 2879 cm−1 were the stretching vibration peaks of –CH2 and –CH, respectively [39]. The absorption peaks at 883 cm−1−1031 cm−1 in the PAX spectrum may be caused by the stretching vibration of C–O, C–C, C–O–C, and the bending vibration of O–H in the structure. These characteristic peaks were reflected in the BAEs-PAX intelligent indicator film [40]. After BAEs were added, the O–H stretching vibration peak at 3325 cm−1 was red-shifted, indicating the formation of new hydrogen bonds. The absorption peaks at 2934 cm−1 and 2879 cm−1 were weakened, meaning that anthocyanins did not destroy the hydrogen bonds formed between pectin, SA, and XG, but enhanced the intermolecular interaction. The absorption peak at 1031 cm−1 shifted to 1023 cm−1, indicating that new hydrogen bonds were generated after adding BAEs. The absorption peak intensity at 750 cm−1−850 cm−1 changed, and part of the bond energy increased, which would lead to the change in the mechanical properties of the indicator film, which might be due to the substitution of the aromatic ring [16]. When the concentration of BAEs was increasing, the spectrum's overall change trend was insignificant, so it was speculated that BAEs had a benign interaction with the substrate composition. In addition to the slight difference in the peak position and the peak intensity, there was no noticeable change in the FTIR spectrum, and no new peak was observed in the spectrum of the indicator film, indicating that no new covalent bond was generated after the film formation. Therefore, the results of FTIR analysis showed that BAEs could be well embedded in the film-forming substrate and had good compatibility with pectin, SA, and XG. Intermolecular forces mainly determined the performance of the indicator film, and the chemical composition of each film-forming substrate was not affected.
Fig. 3.
Infrared spectra of freshness indicator films with different BAEs additions (A); Surface and cross-sectional SEM images of freshness indicator films with different BAEs additions (B), PAX surface (a) and cross section (f), 25-BAEs-PAX surface (b) and cross section (g), 50-BAEs-PAX surface (c) and cross section (h), 75-BAEs-PAX surface (d) and cross section (i), and 100-BAEs-PAX surface (e) and cross section (j).
3.3.2. SEM analysis of BAEs-PAX films
Fig. 3(B) shows the freshness indicator film's SEM image with different BAE content of BAEs. Where a−e is the surface of the indicator film under different BAEs, and f−j is the cross section of the indicator film under different BAEs. It can be seen from the diagram that the indicator film had a smooth surface. When the BAEs content increased to 0.75%, the cross-section was also relatively flat and dense, and the TS of the film also reached the maximum value. This was because BAEs themselves had a certain plasticizing effect, which destroyed the network structure formed between polysaccharide matrix and glycerol, and the entanglement structure between pectin molecular chains was further opened. With the increase of BAEs, the thickness of the film was also increasing, which could be confirmed by the SEM image. In addition, BAEs contained a large number of hydroxyl groups, which changed the arrangement of hydrogen bonds between polysaccharide substrates and glycerol, and formed new hydrogen bonds, thereby reducing the hydrogen bonds and intermolecular entanglements in the original polymer so that the indicator film was denser and smoother. The denser and smoother structure of the indicator film reduced the WVTR and opacity of the film while increasing the haze. When the content of BAEs increased to 1.00%, the cross-section of the indicator began to become rough, and there were more concave shapes. It can be seen that the uniformity of the cross-section was seriously damaged, which meant that excessive BAEs would destroy the compact structure of the cross-section, resulting in a decrease in the mechanical properties and barrier properties of the indicator, which was consistent with the results of the physical property analysis of the indicator film in 3.2. Ma et al. [10] also found that with the addition of anthocyanin, the rough surface of the cross-section of the film increased, and some cracks appeared.
3.4. BAEs-PAX film' response to pH changes
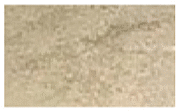
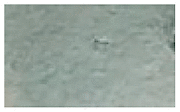
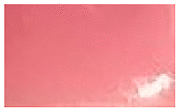
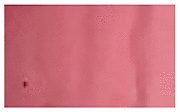
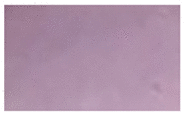
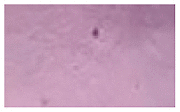
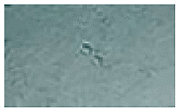
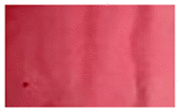
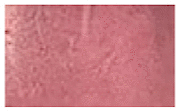
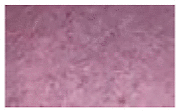
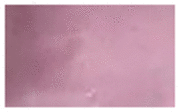
BAEs show different colors at different pH. Table 3 shows the chromaticity parameters and photos of intelligent indicator films with different BAEs additions in different pH buffer solutions. It can be seen from the table that the indicator film was pink at pH 2.0−4.0, purple at 6.0−8.0, coffee yellow at 10.0, and dark green at 12.0. With the increase of pH from 2.0 to 8.0, both a* and b* decreased due to the increased quinone base structure in anthocyanins. However, as the pH continued to rise, the b* increased [5], and the color of the indicator film changed from pink to purple to coffee yellow to dark green. In addition, the L* of the intelligent indicator film decreased gradually with the increase of anthocyanin content, and the apparent change of a* value and b* value meant that the color change of the indicator film was more intense.
Table 3.
Color parameters and photos of freshness indicator films under different pH conditions.
| Freshness indicator films | PH value | L* | a* | b* | Before discoloration | After discoloration |
|---|---|---|---|---|---|---|
| 25-BAEs-PAX | 2 | 83.12 ± 1.03a | 7.94 ± 0.32a | 4.33 ± 0.17a |  |
 |
| 4 | 80.77 ± 1.26b | 4.64 ± 0.98b | 1.99 ± 0.47b |  |
 |
|
| 6 | 78.71 ± 0.38b | 2.34 ± 1.12c | 0.48 ± 0.71c |  |
 |
|
| 8 | 81.89 ± 2.31ab | 2.31 ± 0.45c | −0.03 ± 0.24c |  |
 |
|
| 10 | 80.55 ± 1.98b | −1.21 ± 0.11d | 4.98 ± 0.82a |  |
 |
|
| 12 | 79.23 ± 2.01b | −2.09 ± 0.08d | 0.54 ± 0.15c |  |
 |
|
| 50-BAEs-PAX | 2 | 76.33 ± 2.01b | 11.12 ± 0.76a | 1.20 ± 0.21b |  |
 |
| 4 | 80.77 ± 1.32a | 8.76 ± 0.14b | 1.57 ± 0.98b | 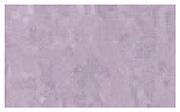 |
 |
|
| 6 | 66.12 ± 1.76d | 3.99 ± 0.09c | −0.32 ± 0.06d | 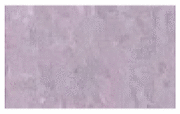 |
 |
|
| 8 | 71.98 ± 1.43c | 6.08 ± 0.39d | −3.01 ± 0.56e | 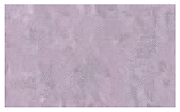 |
 |
|
| 10 | 74.37 ± 0.92b | −1.17 ± 0.13e | 4.33 ± 0.37a | 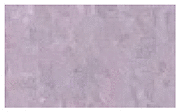 |
 |
|
| 12 | 76.93 ± 1.89b | −2.58 ± 0.06f | 0.57 ± 0.18c | 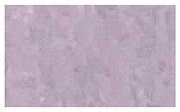 |
 |
|
| 75-BAEs-PAX | 2 | 75.03 ± 0.62c | 12.37 ± 0.74a | 1.98 ± 0.14b | 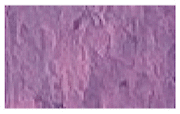 |
 |
| 4 | 80.79 ± 0.06a | 8.97 ± 0.56b | 2.07 ± 0.13b | 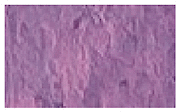 |
 |
|
| 6 | 68.78 ± 1.43d | 5.54 ± 0.39c | −1.75 ± 0.56d | 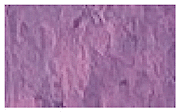 |
 |
|
| 8 | 74.00 ± 1.43c | 4.95 ± 0.39c | −3.03 ± 0.56e | 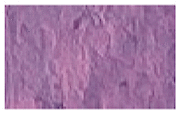 |
 |
|
| 10 | 78.35 ± 1.72b | −1.31 ± 0.94d | 7.88 ± 0.08a | 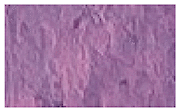 |
 |
|
| 12 | 77.97 ± 2.31b | −2.57 ± 0.42e | −0.41 ± 0.71c | 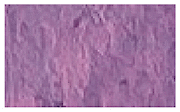 |
 |
|
| 100-BAEs-PAX | 2 | 72.98 ± 0.14c | 13.99 ± 0.11a | 2.14 ± 0.48b | 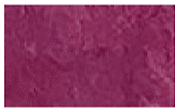 |
 |
| 4 | 82.57 ± 1.57a | 9.23 ± 1.07b | 4.50 ± 1.34a | 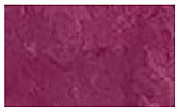 |
 |
|
| 6 | 70.75 ± 1.35d | 6.39 ± 0.32c | −3.21 ± 0.85d | 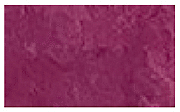 |
 |
|
| 8 | 77.55 ± 1.69b | 5.47 ± 0.48c | 4.99 ± 0.61a | 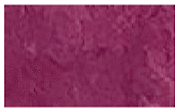 |
 |
|
| 10 | 73.11 ± 1.64cd | −1.09 ± 0.14d | 4.22 ± 0.78a | 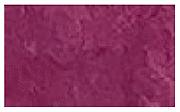 |
 |
|
| 12 | 75.31 ± 1.96b | −2.77 ± 0.48e | −0.43 ± 0.02c | 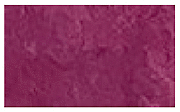 |
 |
Different letters (a–f) within a column indicate significant differences among samples (P < 0.05).
3.5. Color stability of BAEs-PAX films
Freshness indicator films can be used to monitor the freshness of foods because of their distinctive color change. If the color stability of the indicator film itself is poor, it will cause some interference with the monitoring results. BAEs are susceptible to light, temperature and pH. In order to explore the color stability of the indicator film, the indicator film was stored at 25 °C and 4 °C for 24 days without dark treatment to simulate the storage and transportation conditions of blueberry fruit. The color stability of the indicator films was measured at different storage temperatures of 4 °C (Fig. 4(A)) and 25 °C (Fig. 4(B)) over a 24 days storage period. As shown in Fig. 4, the stability of the indicator films varied with the storage temperature. All the indicator films showed different degrees of color change with the extension of time due to the structural changes of the indicator films. At 25 °C, the ΔE of the indicator film was more extensive than that at 4 °C, which was because the higher the temperature, the less stable the indicator film containing anthocyanin was, and with time and the influence of moisture in the air, the indicator film would produce different degrees of discoloration. However, from the overall trend, especially between 3 days and 21 days, the difference in the color change of the indicator films was not significant. The stability of BAEs had certain instability under the action of light, and the higher the light intensity, the less stable it was, so the indicator film should be stored away from light before use. In addition, Ca2+ helps to improve the stability of anthocyanins [41], so spraying calcium chloride on the indicator film improved the stability of the indicator film to some extent. The results of Feng [36] showed that the higher the addition of BAEs, the better the thermal stability. Comprehensively indicating the mechanical properties of the film, 75-BAEs film was selected for blueberry preservation experiments.
Fig. 4.
Color stability of freshness indicator films at different temperatures. 4 °C (A); 25 °C (B).
Data are plotted as averages ± S.D. (n = 3). a-g Averages ± S.D. in each column and at the same time of determination of each parameter with different letters are significantly different (p < 0.05). (For interpretation of the references to color in this figure legend, the reader is referred to the Web version of this article.)
3.6. Kinetic analysis between blueberry and intelligent indicator film
In the study of the time-temperature indicator, whether the indicator film could indicate the change of food with temperature requires that the food quality factor and the response factor of the indicator film had similar activation energy and could use the same method for the study of freshness indicator [42]. Therefore, in exploring the feasibility of freshness indicator film for monitoring blueberry freshness, fitted the Arrhenius equation. It matched the correlation between the indicator film and food quality by establishing the difference between the color difference response factor of the indicator film and the activation energy of each quality index of blueberry, which illustrated the indication effect of the indicator at different temperatures.
3.6.1. Effect of storage temperature on quality changes of blueberries
According to the previous experiment, the decay rate of blueberries reached more than 45% when stored at 25 °C for 12 days. Therefore, the test period of hardness, weight loss rate, TSS, TA, and MDA of blueberries was set at 25 °C for 12 days.
During storage, the hardness, TSS, and TA of blueberries decreased with storage time, as shown in Fig. 5(A)−(C). The fruit hardness rapidly reduced from day 6 to day 9, and the decreasing rate slowed from day 9 to day 18. The content of TA in blueberries decreased with the increase in storage time. As the fruit matured, organic acids were gradually decomposed into sugars, and the fruit might gradually become sweeter from sour and astringent. However, with increased time, some sugars would also be converted into acids under respiration [43]. As shown in Fig. 5(D)–(E), blueberries' weight loss rate and MDA showed an increasing trend during storage. The weight loss rate of blueberries increased fastest at 25 °C. The weight loss rate of blueberries under the condition of 25 °C was the fastest, and nearly 1/5 of the mass was lost after 12 days, and the weight loss rate reached 15.2%. The MDA content increased rapidly from 0 days to 9 days and then slowly increased. Initially might be due to increased maturity, and the latter was due to the degree of decay of blueberries increased. Low-temperature storage had a strong inhibitory effect on the increase of MDA contents. The results showed that the storage of blueberries at ice temperature (−1 °C) was beneficial to the maintenance of hardness, TSS, and TA and inhibited the increase of MDA and weight loss rate. The fruit quality was higher than that under cold storage (4 °C).
Fig. 5.
Effect of storage temperature on quality of blueberry. Hardness (A); TSS (B); TA (C); Weight loss rate (D); MDA (E). Data are plotted as averages ± S.D. (n = 5). a-d Averages ± S.D. in each column and at the same time of determination of each parameter with different letters are significantly different (p < 0.05).
3.6.2. Correlation analysis between blueberry quality and the freshness indicator
The correlation analysis between blueberry quality and freshness indicator films is shown in Table 4. From the table, it can be seen that at different temperatures, the quality of blueberries was significantly correlated with the freshness indicator ΔE, of which 25 °C was the most significant, and the correlation coefficient R reaches 0.95 or more. In contrast, the correlation coefficient R at −1 °C, which was less correlated, also reached more than 0.84, indicating that the correlation between blueberry quality indexes and ΔE was very strong. Therefore, the blueberry quality changed at different ambient temperatures and could be accurately matched with the freshness indicator film.
Table 4.
Correlation analysis of blueberry quality indicators with the freshness indicator ΔE.
| Temperature(°C) | Hardness | TSS | TA | Weight loss rate | MDA | ||
|---|---|---|---|---|---|---|---|
| 25 | 1 | −0.974** | −0.984** | −0.939** | 0.978** | 0.993** | |
| Hardness | 1 | 0.961** | 0.877 | −0.982** | −0.973** | ||
| TSS | 1 | 0.963 | −0.988** | −0.997** | |||
| TA | 1 | −0.910* | −0.961** | ||||
| weight loss rate | 1 | 0.986** | |||||
| MDA | 1 | ||||||
| 15 | 1 | −0.974** | −0.965** | −0.850** | 0.990* | 0.939** | |
| Hardness | 1 | 0.987** | 0.881** | −0.993** | −0.974** | ||
| TSS | 1 | 0.924** | −0.992** | −0.982* | |||
| TA | 1 | −0.893** | −0.955** | ||||
| weight loss rate | 1 | 0.969** | |||||
| MDA | 1 | ||||||
| 10 | 1 | −0.988** | −0.971** | −0.858** | 0.981** | 0.923** | |
| Hardness | 1 | 0.989** | 0.874* | −0.989** | −0.956** | ||
| TSS | 1 | 0.912** | −0.994** | −0.980** | |||
| TA | 1 | −0.878** | −0.954** | ||||
| weight loss rate | 1 | 0.953** | |||||
| MDA | 1 | ||||||
| 4 | 1 | −0.993** | −0.965** | −0.888** | 0.985** | 0.927** | |
| Hardness | 1 | 0.973** | 0.896** | −0.990** | −0.930** | ||
| TSS | 1 | 0.884** | −0.959** | −0.967** | |||
| TA | 1 | −0.885** | −0.955** | ||||
| weight loss rate | 1 | 0.917** | |||||
| MDA | 1 | ||||||
| −1 | 1 | −0.952** | −0.985** | −0.846* | 0.981** | 0.903** | |
| Hardness | 1 | 0.964** | 0.936** | −0.960** | −0.984** | ||
| TSS | 1 | 0.827* | −0.978** | −0.935** | |||
| TA | 1 | −0.834** | −0.905** | ||||
| weight loss rate | 1 | 0.941** | |||||
| MDA | 1 |
* * indicates extremely significant correlation (P < 0.01), * indicates significant correlation (P < 0.05).
3.6.3. Quality dynamics analysis of blueberry
In recent years, there have been many studies on models of quality changes in food during storage [44,45]. These studies have shown that food quality changes follow zero-order and first-order kinetics, and the kinetic equations were shown in Eq. (12)−(13).
Zero-order kinetics:
| (12) |
First-order kinetics:
| (13) |
Where Ct was the quality index value of foods at day t of storage; C0 was the quality index value of food in the initial state; k was the rate constant of food quality change; t was the storage time, day.
According to the different kinetic simulations based on blueberry quality, the kinetic simulation results are shown in Table 5. According to the relevant results of different equations, it can be seen that the R2 of hardness, TSS, and TA fitted in the first-order kinetic equation is better than that fitted in the zero-order kinetic equation. Therefore, these three indicators are fitted by the first-order kinetic equation; the R2 of MDA fitted by the zero-order kinetic equation was better than that of the first-order kinetic equation, so the zero-order kinetic equation fitted the index. Since the first-level kinetic equation could not fit the weight loss rate, this index was fitted with zero-order kinetics only.
Table 5.
Results of the kinetic fitting of blueberry quality indicators.
| Quality index | Temperature (°C) | Zero-order kinetics | R2 | First-order kinetics | R2 |
|---|---|---|---|---|---|
| Hardness | 25 | Ct = 1.318 − 0.03870t | 0.9728 | Ct = 1.3301e−0.036t | 0.9774 |
| 15 | Ct = 1.2918 − 0.0267t | 0.9497 | Ct = 1.3025e−0.025t | 0.9631 | |
| 10 | Ct = 1.3018 − 0.0245t | 0.9864 | Ct = 1.3135e−0.023t | 0.9935 | |
| 4 | Ct = 1.3061 − 0.0208t | 0.9899 | Ct = 1.3146e−0.019t | 0.9926 | |
| −1 | Ct = 1.2975 − 0.0106t | 0.9757 | Ct = 1.2990e−0.009t | 0.9814 | |
| TSS | 25 | Ct = 11.800 − 0.4333t | 0.9420 | Ct = 11.904e−0.0523t | 0.9640 |
| 15 | Ct = 11.737 − 0.3081t | 0.9104 | Ct = 11.854e−0.0382t | 0.9440 | |
| 10 | Ct = 11.931 − 0.2977t | 0.9392 | Ct = 12.064e−0.0345t | 0.9680 | |
| 4 | Ct = 12.382 − 0.3188t | 0.9236 | Ct = 12.549e−0.0323t | 0.9400 | |
| −1 | Ct = 12.739 − 0.2680t | 0.9717 | Ct = 12.968e−0.0226t | 0.9330 | |
| TA | 25 | Ct = 0.7948 − 0.0343t | 0.7963 | Ct = 0.7864e−0.054t | 0.8165 |
| 15 | Ct = 0.7505 − 0.0208t | 0.7025 | Ct = 0.7402e−0.034t | 0.7709 | |
| 10 | Ct = 0.7675 − 0.0197t | 0.7287 | Ct = 0.7609e−0.031t | 0.7955 | |
| 4 | Ct = 0.7857 − 0.0200t | 0.7901 | Ct = 0.7842e−0.031t | 0.8563 | |
| −1 | Ct = 0.8047 − 0.0173t | 0.7952 | Ct = 0.8037e−0.025t | 0.8466 | |
| Weight loss rate | 25 | Ct = 0.6000 + 1.2667t | 0.9837 | – | – |
| 15 | Ct = 0.7274 + 0.8107t | 0.9680 | – | – | |
| 10 | Ct = 0.6000 + 0.6143t | 0.9483 | – | – | |
| 4 | Ct = 0.0607 + 0.5512t | 0.9836 | – | – | |
| −1 | Ct = −0.460 + 0.3929t | 0.9767 | – | – | |
| MDA | 25 | Ct = 7.9520 + 0.8140t | 0.9506 | Ct = 8.0283e0.0706t | 0.8920 |
| 15 | Ct = 8.7471 + 0.5524t | 0.8645 | Ct = 8.6659e0.0463t | 0.8039 | |
| 10 | Ct = 8.5796 + 0.5142t | 0.8593 | Ct = 8.5073e0.0445t | 0.8030 | |
| 4 | Ct = 8.9493 + 0.4769t | 0.8457 | Ct = 8.3687e0.0425t | 0.7969 | |
| −1 | Ct = 7.1750 + 0.4155t | 0.9317 | Ct = 7.3185e0.0409t | 0.9013 |
The reaction rate constants k and their activation energies of hardness, TSS, TA, weight loss rate, and MDA of blueberries at different temperatures are shown in Table 6. Table 6 showed that the reaction rate constants of hardness, TSS, TA, weight loss rate, and MDA of blueberries increased with the increase of storage temperature, so the reaction rate constants were related to temperature. From Eq. (11), the logarithmic value of the reaction rate constant k had a linear relationship with 1/T. A linear fit was performed with 1/T as the horizontal coordinate and lnk as the vertical coordinate to obtain a straight line, as shown in Fig. 6(A)–(E). The slope of this line could be used to calculate the activation energies of hardness, TSS, TA, weight loss rate, and MDA of blueberries as 31.51 kJ/mol, 19.52 kJ/mol, 17.97 kJ/mol, 29.05 kJ/mol, and 16.41 kJ/mol, respectively, and the results are shown in Table 6.
Table 6.
Reaction rate constants k and activation energy Ea for blueberry quality indicators at different temperatures.
| Quality index | Temperature (°C) | 1/T | k | Ea (kJ/mol) | R2 |
|---|---|---|---|---|---|
| Hardness | 25 | 0.00335 | 0.0360 | 31.51 | 0.845 |
| 15 | 0.00347 | 0.0250 | |||
| 10 | 0.00353 | 0.0230 | |||
| 4 | 0.00361 | 0.0190 | |||
| −1 | 0.00367 | 0.0090 | |||
| TSS | 25 | 0.00335 | 0.0523 | 19.52 | 0.931 |
| 15 | 0.00347 | 0.0382 | |||
| 10 | 0.00353 | 0.0345 | |||
| 4 | 0.00361 | 0.0323 | |||
| −1 | 0.00367 | 0.0226 | |||
| TA | 25 | 0.00335 | 0.00335 | 17.97 | 0.889 |
| 15 | 0.00347 | 0.00347 | |||
| 10 | 0.00353 | 0.00353 | |||
| 4 | 0.00361 | 0.00361 | |||
| −1 | 0.00367 | 0.00367 | |||
| Weight loss rate | 25 | 0.00335 | 0.00335 | 29.05 | 0.979 |
| 15 | 0.00347 | 0.00347 | |||
| 10 | 0.00353 | 0.00353 | |||
| 4 | 0.00361 | 0.00361 | |||
| −1 | 0.00367 | 0.00367 | |||
| MDA | 25 | 0.00335 | 0.00335 | 16.41 | 0.902 |
| 15 | 0.00347 | 0.00347 | |||
| 10 | 0.00353 | 0.00353 | |||
| 4 | 0.00361 | 0.00361 | |||
| −1 | 0.00367 | 0.00367 |
Fig. 6.
Arrhenius Diagram of Blueberry Quality Changes.
Hardness (A); TSS (B); TA(C); Weight loss rate (D); MDA (E).
3.6.4. Kinetic analysis of freshness indicator film
The freshness indicator film has noticeable color changes during the test. The response factor can be set as the color difference, calculated according to Eq. (1).
The function of ΔE can be expressed as equation (Eq. (14)):
| (14) |
Where F(X) was the function of the indicator response factor; k was the reaction rate; t was the reaction time.
Based on Eq. (10) and Eq. (14), the changes in ΔE of the freshness indicator at different ambient temperatures were counted and analyzed. Then the data were linearly fitted to obtain the results shown in Fig. 7(A). By linear fitting, the data in Fig. 7(A), the kinetic parameters of blueberry fruit and freshness indicator film at different storage temperatures could be obtained, as shown in Table 7.
Fig. 7.
Changes in color difference values of the freshness indicator film at different storage temperatures (A); Arrhenius curve of freshness indicator film (B). (For interpretation of the references to color in this figure legend, the reader is referred to the Web version of this article.)
Table 7.
Kinetic parameters of color difference values of film indicators under different storage temperatures.
| Name | Temperature (°C) | 1/T | k | R2 | lnk |
|---|---|---|---|---|---|
| 25 | 0.00335 | 0.379 | 0.975 | −0.970 | |
| 15 | 0.00347 | 0.349 | 0.987 | −1.053 | |
| 10 | 0.00353 | 0.246 | 0.986 | −1.402 | |
| 4 | 0.00361 | 0.181 | 0.994 | −1.709 | |
| −1 | 0.00367 | 0.121 | 0.965 | −2.112 |
Combining Table 7 with Eq. (11), a straight line graph of the Arrhenius equation (Fig. 7(B)) was drawn with 1/T as abscissa and lnk as ordinate. The slope was −Ea/T. The Arrhenius equation for the intelligent indicator film ΔE could be obtained from Fig. 7(B).
The reasonable degree of the equation is greater than 0.9 (R2 = 0.901), indicating that the fitting degree was high. After calculation, the activation energy of the indicator film was calculated to be 30.02 kJ/mol. The activation energy values obtained by using hardness, TSS, TA, weight loss rate, and MDA as the quality factors of blueberry were 31.51 kJ/mol, 19.52 kJ/mol, 17.97 kJ/mol, 29.05 kJ/mol, and 16.41 kJ/mol, respectively. The activation energy value obtained using ΔE as the response factor of the intelligent indicator film was 30.02 kJ/mol. The difference between Ea calculated by each quality index of blueberry and Ea of indicator film was 0.97 kJ/mol, and the maximum was 13.59 kJ/mol, which was far less than the standard of 25 kJ/mol. Therefore, the freshness indicator film can well indicate the quality of blueberry.
4. Discussion
In this study, the freshness indicator film was prepared by adding PAX as a matrix and BAEs. The pH response effect was obvious, and the color change of the indicator itself had little interference with the detection results in different temperature environments. High indication accuracy. The indicator film was used to monitor the freshness of blueberries at room temperature and low temperature. The indicator film was matched with the quality indexes of blueberries by kinetics, and the results were good. Therefore, this freshness indicator film gave a good indication of the quality of blueberries.
4.1. Indicator film substrate and performance
Anthocyanins in food packaging applications can be used as a freshness indicator material or the development of intelligent indicator film, and thus real-time monitoring of food quality changes. Polysaccharides have many advantages over other biopolymers in that they can effectively block gas permeation and thus reducing food quality losses. In addition, compared with other polymer-based films, polysaccharide-based films have excellent mechanical properties. At present, various classes of polysaccharides have been used to prepare indicator films, including ĸ-carrageenan, pectin, chitosan, starch, agar, and nitrocellulose. Liu et al. [46] developed an intelligent indicator film with ĸ-carrageenan and black wolfberry anthocyanins. They found that adding a certain amount of black wolfberry anthocyanins could improve the barrier properties and thermal stability of the film, but it would reduce the mechanical properties and light transmittance. In addition, the addition of anthocyanin could greatly improve the antioxidant activity of the material and had good color change characteristics in the range of pH 2−10. Zhai et al. [47] used agar, anthocyanins, gellan gum, and TiO2 nanoparticles to prepare amine-responsive bilayer films for visual monitoring of meat spoilage. The study found that the double-layer film had keen detection capability for alkaline gases produced by spoilage of pork and silver carp. In this study, BAEs were introduced into the PAX matrix to develop pH-based freshness indicator films. The color of BAEs ranges from pink to dark green at pH 2–12. Similar to this study, Shi et al. [48] extracted anthocyanins from blueberry peel and prepared a freshness indicator film using starch, tara gum, and polyvinyl alcohol as substrates to monitor the freshness of fish. The film changed from pink to dark green in the pH range of 2–10. Similar color changes were observed when different sources of anthocyanins (beetroot, purple cabbage extract, hawthorn extract) were added to composite films from different substrates (e.g. chitosan, pectin, and starch) [[49], [50], [51], [52]]. Kurek et al. [53] studied the freshness indicator film containing blueberry and blackberry pomace extracts. This article used residual pomace, which had environmental protection effects, and the film had antioxidant and indicative effects. Different from the article, this article used blueberry anthocyanins to monitor the freshness of blueberries, which had the effect of ontology monitoring, so that the accuracy of the indicator film has been improved to a certain extent. In the future, the antioxidant and controlled release effects of blueberry extracts can be considered to achieve the effect of preservation, and the preservation and indication function of the film can be well integrated. Secondly, the application temperature range of the indicator film can be appropriately broadened, so that the indicator film can be applied to the refrigerated temperatures.
4.2. Indicator film application verification method and scope
In order to explore the further study of the application effect of the freshness indicator at different temperatures, this paper established an Arrhenius kinetic model with each quality index of blueberry as the quality factor and the color difference of the indicator film as the response factor and solved its activation energy. Obtained the dynamic relationship between the quality index of blueberry and the indicator film, and the R2 was above 0.9, which verified the accuracy of the indicator film. The 75-BAEs-PAX film could well monitor the freshness of blueberry. Feng [42] analyzed the dynamics of the blueberry quality index and the indicator film. By selecting the index with a large proportion, the index was matched with the indicator film by using the kinetic equation to verify the application effect of the indicator film. However, there is a possibility that an index has a large error, so this paper made an adjustment on this basis and matched the blueberry indicators with the indicator film to reduce the error and make the indicator film more accurate. At present, the application objects of freshness indicator film are mostly meat and meat products [5,48], but fruits and vegetables research are relatively small. Feng and Wang [36] used blueberry anthocyanins to prepare an intelligent indicator film by casting method for monitoring the spoilage of beef at 25 °C, but the application temperature range was small, and there were some limitations in practical applications. In the study of the intelligent indicator film, the application object was less for fruits and vegetables. This study will help to broaden the range of freshness indicators of fruits and vegetables, but the temperature range needs to be further broadened. As one of the necessities of life, it is particularly important to monitor the freshness of fruits and vegetables during storage and transportation. In the future, more indicator films can be developed according to the characteristics of fruits and vegetables, and with the increase of frozen fruits and vegetables, the research on freshness indicator packaging of fruits and vegetables under freezing conditions can be increased.
5. Conclusion
We developed a freshness indicator film based on PAX containing BAEs. FTIR showed that BAEs had good compatibility with polysaccharide substrates, forming a dense network structure. The phenolic hydroxyl groups in BAEs could form new hydrogen bonds with polysaccharide substrates and glycerol. The results showed that adding BAEs affects the physicochemical properties and structure of BAEs-PAX films. The increase in BAEs concentration reduced the transparency, MC, SC, and hydrophilicity of BAEs-PAX films and increased the thickness and tensile strength. More importantly, the 75-BAEs-PAX film had the best overall performance with strong pH sensitivity and color stability. In addition, through the dynamic analysis of the blueberry quality index and indicator film, the two could be well matched, indicating that the indicator film could well indicate the freshness of blueberry. Therefore, our research on BAEs-PAX film might provide new insights for developing intelligent packaging for fruits and vegetables.
Author contribution statement
Yang Li: Conceived and designed the experiments; Performed the experiments; Contributed reagents, materials, analysis tools or data; Wrote the paper.
Zexi Hu, Ruobing Huo: Conceived and designed the experiments; Performed the experiments; Analyzed and interpreted the data; Contributed reagents, materials, analysis tools or data; Wrote the paper.
Zhuoyu Cui: Performed the experiments; Analyzed and interpreted the data; Wrote the paper.
Funding statement
Ms Yang Li was supported by Natural Science Foundation of Heilongjiang Province of China [No.LH2021C016].
Data availability statement
Data included in article/supplementary material/referenced in article.
Declaration of interest’s statement
The authors declare no conflict of interest
References
- 1.Almasi H., Forghani S., Moradi M. Recent advances on intelligent food freshness indicators; an update on natural colorants and methods of preparation. Food Packag. Shelf Life. 2022;32 doi: 10.1016/j.fpsl.2022.100839. [DOI] [Google Scholar]
- 2.Liu L., Wu W., Zheng L., Yu J., Sun P., Shao P. Intelligent packaging films incorporated with anthocyanins-loaded ovalbumin-carboxymethyl cellulose nanocomplexes for food freshness monitoring. Food Chem. 2022;387:132908. doi: 10.1016/j.foodchem.2022.132908. 132908. [DOI] [PubMed] [Google Scholar]
- 3.Jing Y., Si-Cong L. Research on the whole process control of cold chain transportation under the background of resource saving, IOP conference series. Earth Environ. Sci. 2021;791(1):1216. doi: 10.1088/1755-1315/791/1/012116. [DOI] [Google Scholar]
- 4.Shao P., Liu L., Yu J., Lin Y., Gao H., Chen H., Sun P. An overview of intelligent freshness indicator packaging for food quality and safety monitoring. Trends Food Sci. Technol. 2021;118:285–296. doi: 10.1016/j.tifs.2021.10.012. [DOI] [Google Scholar]
- 5.Zhang X., Zou W., Xia M., Zeng Q., Cai Z. Intelligent colorimetric film incorporated with anthocyanins-loaded ovalbumin-propylene glycol alginate nanocomplexes as a stable ph indicator of monitoring pork freshness. Food Chem. 2022;368 doi: 10.1016/j.foodchem.2021.130825. [DOI] [PubMed] [Google Scholar]
- 6.Oliveira Filho J.G.D., Braga A.R.C., Oliveira B.R.D., Gomes F.P., Moreira V.L., Pereira V.A.C., Egea M.B. The potential of anthocyanins in smart, active, and bioactive eco-friendly polymer-based films: a review. Food Res. Int. 2021;142 doi: 10.1016/j.foodres.2021.110202. [DOI] [PubMed] [Google Scholar]
- 7.Alizadeh-Sani M., Mohammadian E., Rhim J., Jafari S.M. Ph-sensitive (halochromic) smart packaging films based on natural food colorants for the monitoring of food quality and safety. Trends Food Sci. Technol. 2020;105:93–144. doi: 10.1016/j.tifs.2020.08.014. [DOI] [Google Scholar]
- 8.Choi I., Lee J.Y., Lacroix M., Han J. Intelligent ph indicator film composed of agar/potato starch and anthocyanin extracts from purple sweet potato. Food Chem. 2017;218:122–128. doi: 10.1016/j.foodchem.2016.09.050. [DOI] [PubMed] [Google Scholar]
- 9.Kang S., Wang H., Xia L., Chen M., Li L., Cheng J., Li X., Jiang S. Colorimetric film based on polyvinyl alcohol/okra mucilage polysaccharide incorporated with rose anthocyanins for shrimp freshness monitoring. Carbohydr. Polym. 2020;229 doi: 10.1016/j.carbpol.2019.115402. [DOI] [PubMed] [Google Scholar]
- 10.Ma Q., Wang L. Preparation of a visual ph-sensing film based on tara gum incorporating cellulose and extracts from grape skins. Sensor. Actuator. B Chem. 2016;235:401–407. doi: 10.1016/j.snb.2016.05.107. [DOI] [Google Scholar]
- 11.Capello C., Trevisol T.C., Pelicioli J., Terrazas M.B., Monteiro A.R., Valencia G.A. Preparation and characterization of colorimetric indicator films based on chitosan/polyvinyl alcohol and anthocyanins from agri-food wastes. J. Polym. Environ. 2021;29(5):1616–1629. doi: 10.1007/s10924-020-01978-3. [DOI] [Google Scholar]
- 12.Khanjanzadeh H., Park B. Covalent immobilization of bromocresol purple on cellulose nanocrystals for use in ph-responsive indicator films. Carbohydr. Polym. 2021;273 doi: 10.1016/j.carbpol.2021.118550. [DOI] [PubMed] [Google Scholar]
- 13.Jancikova S., Jamróz E., Kulawik P., Tkaczewska J., Dordevic D. Furcellaran/gelatin hydrolysate/rosemary extract composite films as active and intelligent packaging materials. Int. J. Biol. Macromol. 2019;131:19–28. doi: 10.1016/j.ijbiomac.2019.03.050. [DOI] [PubMed] [Google Scholar]
- 14.Kabdrakhmanova S.K., Shaimardan E., Akatan K., Kabdrakhmanova A.K., Kantai N., Synthesis M.B. Abilev. Characteristics and antibacterial activity of polymeric films based on starch and polyvinyl alcohol. J. Chem. Techn. Metall. 2018;53(1):50–60. https://kns.cnki.net/kcms/detail/detail.aspx?FileName=SJOWD8309A6FA18A7916697FED68A61E34C4&DbName=GARJ2018 [Google Scholar]
- 15.Feng S., Tang Q., Xu Z., Huang K., Li H., Zou Z. Development of novel co-mof loaded sodium alginate based packaging films with antimicrobial and ammonia-sensitive functions for shrimp freshness monitoring. Food Hydrocolloids. 2023;135 doi: 10.1016/j.foodhyd.2022.108193. [DOI] [Google Scholar]
- 16.Maciel V.B.V., Yoshida C.M.P., Franco T.T. Chitosan/pectin polyelectrolyte complex as a ph indicator. Carbohydr. Polym. 2015;132:537–545. doi: 10.1016/j.carbpol.2015.06.047. [DOI] [PubMed] [Google Scholar]
- 17.Fan Y., Yang J., Duan A., Li X. Pectin/sodium alginate/xanthan gum edible composite films as the fresh-cut package. Int. J. Biol. Macromol. 2021;181:1003–1009. doi: 10.1016/j.ijbiomac.2021.04.111. [DOI] [PubMed] [Google Scholar]
- 18.Ben Z.Y., Samsudin H., Yhaya M.F. Glycerol: its properties, polymer synthesis, and applications in starch based films. Eur. Polym. J. 2022;175 doi: 10.1016/j.eurpolymj.2022.111377. [DOI] [Google Scholar]
- 19.Xue J. Jiangsu University; Jiangsu: 2019. Research on Freshness Inducator Packaging Material of Salmon Based on Anthocyanin, Vol. Master 's Degree Thesis; pp. 45–76.https://kns.cnki.net/kcms/detail/detail.aspx?FileName=1019883721.nh&DbName=CMFD2020 [Google Scholar]
- 20.Yang J., Fan Y., Cui J., Yang L., Su H., Yang P., Pan J. Colorimetric films based on pectin/sodium alginate/xanthan gum incorporated with raspberry pomace extract for monitoring protein-rich food freshness. Int. J. Biol. Macromol. 2021;185:959–965. doi: 10.1016/j.ijbiomac.2021.06.198. [DOI] [PubMed] [Google Scholar]
- 21.Ma Q., Liang T., Cao L., Wang L. Intelligent poly (vinyl alcohol)-chitosan nanoparticles-mulberry extracts films capable of monitoring ph variations. Int. J. Biol. Macromol. 2018;108:576–584. doi: 10.1016/j.ijbiomac.2017.12.049. [DOI] [PubMed] [Google Scholar]
- 22.Yong H., Liu J., Qin Y., Bai R., Zhang X., Liu J. Antioxidant and ph-sensitive films developed by incorporating purple and black rice extracts into chitosan matrix. Int. J. Biol. Macromol. 2019;137:307–316. doi: 10.1016/j.ijbiomac.2019.07.009. [DOI] [PubMed] [Google Scholar]
- 23.Wei Y., Cheng C., Ho Y., Tsai M., Mi F. Active gellan gum/purple sweet potato composite films capable of monitoring ph variations. Food Hydrocolloids. 2017;69:491–502. doi: 10.1016/j.foodhyd.2017.03.010. [DOI] [Google Scholar]
- 24.Kanatt S.R., Makwana S.H. Development of active, water-resistant carboxymethyl cellulose-poly vinyl alcohol- aloe vera packaging film. Carbohydr. Polym. 2020;227(C) doi: 10.1016/j.carbpol.2019.115303. [DOI] [PubMed] [Google Scholar]
- 25.Khoshgozaran-Abras S., Azizi M.H., Hamidy Z., Bagheripoor-Fallah N. Mechanical, physicochemical and color properties of chitosan based-films as a function of aloe vera gel incorporation. Carbohydr. Polym. 2012;87(3):2058–2062. doi: 10.1016/j.carbpol.2011.10.020. [DOI] [Google Scholar]
- 26.Hossein K., Byung-Dae P., Hamidreza P. Intelligent ph- and ammonia-sensitive indicator films using neutral red immobilized onto cellulose nanofibrils. Carbohydr. Polym. 2022;296:119910. doi: 10.1016/J.CARBPOL.2022.119910. 119910. [DOI] [PubMed] [Google Scholar]
- 27.Zhai X., Shi J., Zou X., Wang S., Jiang C., Zhang J., Huang X., Zhang W., Holmes M. Novel colorimetric films based on starch/polyvinyl alcohol incorporated with roselle anthocyanins for fish freshness monitoring. Food Hydrocolloids. 2017;69:308–317. doi: 10.1016/j.foodhyd.2017.02.014. [DOI] [Google Scholar]
- 28.Alizadeh-Sani M., Tavassoli M., Mohammadian E., Ehsani A., Khaniki G.J., Priyadarshi R., Rhim J. Ph-responsive color indicator films based on methylcellulose/chitosan nanofiber and barberry anthocyanins for real-time monitoring of meat freshness. Int. J. Biol. Macromol. 2021;166:741–750. doi: 10.1016/j.ijbiomac.2020.10.231. [DOI] [PubMed] [Google Scholar]
- 29.Lu J., Li T., Ma L., Li S., Jiang W., Qin W., Li S., Li Q., Zhang Z., Wu H. Optimization of heat-sealing properties for antimicrobial soybean protein isolate film incorporating diatomite/thymol complex and its application on blueberry packaging. Food Packag. Shelf Life. 2021;29 doi: 10.1016/j.fpsl.2021.100690. [DOI] [Google Scholar]
- 30.Xu T., Li Y., Huo R., Wang L. Prediction model of consumers' overall satisfaction of blueberries based on sensory evaluation. Forest Engineering. 2021;37(2):110–116. doi: 10.3969/j.issn.1006-8023.2021.02.016. [DOI] [Google Scholar]
- 31.Grajeda-Iglesias C., Figueroa-Espinoza M.C., Barouh N., Baréa B., Fernandes A., de Freitas V., Salas E. Isolation and characterization of anthocyanins fromhibiscus sabdariffa flowers. J. Nat. Prod. 2016;79(7):1709–1718. doi: 10.1021/acs.jnatprod.5b00958. [DOI] [PubMed] [Google Scholar]
- 32.Oliveira J., Azevedo J., Seco A., Mendoza J., Basílio N., de Freitas V., Pina F. Copigmentation of anthocyanins with copigments possessing an acid-base equilibrium in moderately acidic solutions. Dyes Pigments. 2021;193 doi: 10.1016/j.dyepig.2021.109438. [DOI] [Google Scholar]
- 33.Bilgiç S., Söğüt E., Seydim A.C. Chitosan and starch based intelligent films with anthocyanins from eggplant to monitor ph variations. Turk. J. Agri. Food Sci. Techn. 2019;7(sp1):61–66. doi: 10.24925/turjaf.v7isp1.61-66.2705. [DOI] [Google Scholar]
- 34.Wang Y., Zhang J., Zhang L. An active and ph-responsive film developed by sodium carboxymethyl cellulose/polyvinyl alcohol doped with rose anthocyanin extracts. Food Chem. 2022;373 doi: 10.1016/j.foodchem.2021.131367. [DOI] [PubMed] [Google Scholar]
- 35.Cao L., Sun G., Zhang C., Liu W., Li J., Wang L. An intelligent film based on cassia gum containing bromothymol blue-anchored cellulose fibers for real-time detection of meat freshness. J. Agric. Food Chem. 2019;67(7):2066–2074. doi: 10.1021/acs.jafc.8b06493. [DOI] [PubMed] [Google Scholar]
- 36.Feng Q., Wang L. Preparation and application of blueberry anthocyanin intelligent indicator films. J. Chin. Inst. Food Sci. Technol. 2022;22:281–290. doi: 10.16429/j.1009-7848.2022.02.030. 02. [DOI] [Google Scholar]
- 37.Zhang X., Liu Y., Yong H., Qin Y., Liu J., Liu J. Development of multifunctional food packaging films based on chitosan, tio2 nanoparticles and anthocyanin-rich black plum peel extract. Food Hydrocolloids. 2019;94:80–92. doi: 10.1016/j.foodhyd.2019.03.009. [DOI] [Google Scholar]
- 38.Liu Y., Qin Y., Bai R., Zhang X., Yuan L., Liu J. Preparation of ph-sensitive and antioxidant packaging films based on κ-carrageenan and mulberry polyphenolic extract. Int. J. Biol. Macromol. 2019;134:993–1001. doi: 10.1016/j.ijbiomac.2019.05.175. [DOI] [PubMed] [Google Scholar]
- 39.Hong J., Chen R., Zeng X., Han Z. Effect of pulsed electric fields assisted acetylation on morphological, structural and functional characteristics of potato starch. Food Chem. 2016;192:15–24. doi: 10.1016/j.foodchem.2015.06.058. [DOI] [PubMed] [Google Scholar]
- 40.Haq M.A., Hasnain A., Azam M. Characterization of edible gum cordia film: effects of plasticizers. LWT - Food Sci. Technol. (Lebensmittel-Wissenschaft -Technol.) 2014;55(1):163–169. doi: 10.1016/j.lwt.2013.09.027. [DOI] [Google Scholar]
- 41.Yan H., Zhang W., Ding Z. Study on the stability of premier blueberry anthocyanins. Sci. Techn. Food Indu. 2013;34(13):119–124. doi: 10.13386/j.issn1002-0306.2013.13.042. [DOI] [Google Scholar]
- 42.Feng G. Northeast Forestry University; Harbin: 2019. Blueberry Intelligent Packaging Freshness Indicator Research, Vol. Master 's Degree Thesis; pp. 32–33. [DOI] [Google Scholar]
- 43.Hanson E., Hancock J., Callow P., Beaudry R., Serçe S. Effect of cultivar, controlled atmosphere storage, and fruit ripeness on the long-term storage of highbush blueberries. HortTechnology. 2008;18(2):199–205. doi: 10.21273/HORTTECH.18.2.199. [DOI] [Google Scholar]
- 44.Zhao S., Han X., Liu B., Wang S., Guan W., Wu Z., Theodorakis P.E. Shelf-life prediction model of fresh-cut potato at different storage temperatures. J. Food Eng. 2022;317 doi: 10.1016/S0023-6438(02)00174-3. [DOI] [Google Scholar]
- 45.Nourian F., Ramaswamy H.S., Kushalappa A.C. Kinetics of quality change associated with potatoes stored at different temperatures. LWT - Food Sci. Technol. (Lebensmittel-Wissenschaft -Technol.) 2003;36(1):49–65. doi: 10.1016/j.jfoodeng.2021.110867. [DOI] [Google Scholar]
- 46.Liu J., Wang H., Guo M., Li L., Chen M., Jiang S., Li X., Jiang S. Extract from lycium ruthenicum murr. Incorporating κ-carrageenan colorimetric film with a wide ph–sensing range for food freshness monitoring. Food Hydrocolloids. 2019;94:1–10. doi: 10.1016/j.foodhyd.2019.03.008. [DOI] [Google Scholar]
- 47.Zhai X., Zou X., Shi J., Huang X., Sun Z., Li Z., Sun Y., Li Y., Wang X., Holmes M., Gong Y., Povey M., Xiao J. Amine-responsive bilayer films with improved illumination stability and electrochemical writing property for visual monitoring of meat spoilage. Sensor. Actuator. B Chem. 2020;302(C) doi: 10.1016/j.snb.2019.127130. [DOI] [Google Scholar]
- 48.Shi C., Zhang J., Jia Z., Yang X., Zhou Z. Intelligentph indicator films containing anthocyanins extracted from blueberry peel for monitoring tilapia fillet freshness. J. Sci. Food Agric. 2021;101(5):1800–1811. doi: 10.1002/jsfa.10794. [DOI] [PubMed] [Google Scholar]
- 49.Sobhan A., Muthukumarappan K., Wei L. A biopolymer-based ph indicator film for visually monitoring beef and fish spoilage. Food Biosci. 2022;46 doi: 10.1016/j.fbio.2021.101523. [DOI] [Google Scholar]
- 50.Guo Z., Zuo H., Ling H., Yu Q., Gou Q., Yang L. A novel colorimetric indicator film based on watermelon peel pectin and anthocyanins from purple cabbage for monitoring mutton freshness. Food Chem. 2022;383 doi: 10.1016/j.foodchem.2021.131915. [DOI] [PubMed] [Google Scholar]
- 51.Yan J., Cui R., Tang Z., Wang Y., Wang H., Qin Y., Yuan M., Yuan M. Development of ph-sensitive films based on gelatin/chitosan/nanocellulose and anthocyanins from hawthorn (crataegus scabrifolia) fruit. J. Food Meas. Char. 2021;15(5):3901–3911. doi: 10.1007/s11694-021-00978-8. [DOI] [Google Scholar]
- 52.Norcino L.B., Mendes J.F., Natarelli C.V.L., Manrich A., Oliveira J.E., Mattoso L.H.C. Pectin films loaded with copaiba oil nanoemulsions for potential use as bio-based active packaging. Food Hydrocolloids. 2020;106 doi: 10.1016/j.foodhyd.2020.105862. [DOI] [Google Scholar]
- 53.Kurek M., Garofulić I.E., Bakić M.T., Ačetar M., Uzelac V.D., Galić K. Development and evaluation of a novel antioxidant and ph indicator film based on chitosan and food waste sources of antioxidants. Food Hydrocolloids. 2018;84:238–246. doi: 10.1016/j.foodhyd.2018.05.050. [DOI] [Google Scholar]
Associated Data
This section collects any data citations, data availability statements, or supplementary materials included in this article.
Data Availability Statement
Data included in article/supplementary material/referenced in article.


