

Abstract
Background and objectives:
Femurs affected by metastatic bone disease (MBD) frequently undergo surgery to prevent impending pathologic fractures due to clinician-perceived increases in fracture risk. Finite element (FE) models can provide more objective assessments of fracture risk. However, FE models of femurs with MBD have implemented strain- and strength-based estimates of fracture risk under a wide variety of loading configurations, and “physiologic” loading models typically simulate a single abductor force. Due to these variations, it is currently difficult to interpret mechanical fracture risk results across studies of femoral MBD. Our aims were to evaluate (1) differences in mechanical behavior between idealized loading configurations and those incorporating physiologic muscle forces, and (2) differences in the rankings of mechanical behavior between different loading configurations, in FE simulations to predict fracture risk in femurs with MBD.
Methods:
We evaluated 9 different patient-specific FE loading simulations for a cohort of 54 MBD femurs: strain outcome simulations—physiologic (normal walking [NW], stair ascent [SA], stumbling), and joint contact only (NW contact force, excluding muscle forces); strength outcome simulations—physiologic (NW, SA), joint contact only, offset torsion, and sideways fall. Tensile principal strain and femur strength were compared between simulations using statistical analyses.
Results:
Tensile principal strain was 26% higher (R2 = 0.719, P < .001) and femur strength was 4% lower (R2 = 0.984, P < .001) in simulations excluding physiologic muscle forces. Rankings of the mechanical predictions were correlated between the strain outcome simulations (ρ = 0.723 to 0.990, P < .001), and between strength outcome simulations (ρ = 0.524 to 0.984, P < .001).
Conclusions:
Overall, simulations incorporating physiologic muscle forces affected local strain outcomes more than global strength outcomes. Absolute values of strain and strength computed using idealized (no muscle forces) and physiologic loading configurations should be used within the appropriate context when interpreting fracture risk in femurs with MBD.
Keywords: Metastatic bone disease, finite element model, strain, femur strength, physiologic loading
Introduction
The annual prevalence of metastatic bone disease (MBD) in the US is over 280 000, and the femur is a commonly affected skeletal site.1,2 Patients with MBD often undergo prophylactic surgery to prevent impending pathologic fractures and alleviate pain. Mirels’ score3 is a radiographic metric used clinically to predict impending fracture risk and inform surgical treatment decisions. Mirels’ score is a sensitive predictor of fracture risk (71%-100%); however, over half of low-risk MBD femurs potentially receive nonessential surgical treatment due to Mirels’ low specificity (13%-50%).2 Unfortunately, inherent proximal femur strength and/or subsequent strength reductions resulting from MBD are difficult to evaluate directly from diagnostic (radiographic or computed tomography (CT)) imaging.4,5
The need for accurate fracture prediction in MBD patients has led to early clinical implementation of engineering methods that can provide more objective assessments of true mechanical vulnerability and subsequent fracture risk.6,7 To date, CT-based rigidity analysis8,9 has been the most useful engineering-based augment to improve fracture risk assessment in MBD patients. However, this technique makes several significant simplifying assumptions for clinical utility, including basic loading and geometry assumptions. Finite element (FE) models have been shown to predict bone strength better than quantitative density-only methods,10 and FE analyses have also indicated that the applied loading configurations affect model-predicted bone mechanics.11,12 Though validated FE models of the femur simulating sideways fall,13 -15 single-limb stance,16 or physiologic loading,11 have provided great insight into age/non-traumatic/injury-related mechanical changes in bone strength and fracture risk, FE modeling has not yet seen widespread clinical implementation for fracture risk prediction in MBD.
FE models of femoral MBD have mainly been utilized in experiments with simulated lytic lesions that only modestly replicate the heterogeneous lesions (lytic/mixed/diffuse/blastic) present in MBD patients. Those various FE studies have implemented local strain- and global strength-based estimates of fracture risk under a variety of loading configurations such as offset torsion,17,18 axial compression,5,19 -22 single-limb stance,23 -27 and physiologic activity like level walking and stair ascent.28 -31 While termed “physiologic” loading, these models only simulate a single hip abductor force, and the forces and displacements are typically applied to the model through plastic pots.29 -31 This has implications for MBD as locally acting muscle forces would be expected to influence local strains, particularly for lesions located near muscle insertion sites. Femur strength, which considers global/whole-bone interactions, would expect to be less severely affected by such a modeling assumption. It is currently difficult to interpret mechanical fracture risk results across studies due to the variations in FE simulations of femoral MBD.
Our main aim was to evaluate differences in mechanical behavior between idealized loading configurations and those incorporating physiologic muscle forces, in FE simulations of femoral MBD with patient-specific lesions. Our primary hypothesis was that realistic physiologic muscle forces would affect simulations with local strain-dependent outcomes, rather than simulations with global/whole-bone strength outcomes. A secondary aim was to evaluate differences in the rankings of mechanical behavior between different loading configurations in FE simulations of femoral MBD. We hypothesized that MBD femurs would be ranked similarly from weakest to strongest between the strain outcome simulations, and between the strength outcome simulations.
Materials and Methods
Patient information
A retrospective analysis was performed on 48 MBD patients (27-90 years old; 21 females, 27 males) with Institutional Review Board approval. We analyzed 54 (6 bilateral) femurs from whole-femur diagnostic CT scans (Siemens, Forchheim, Germany; 120 kVp, 150 mAs, 0.3906 mm × 0.3906 mm × 0.6 mm voxel size) that were collected consecutively over a period of 3 years, prior to any prophylactic surgery was performed. Due to the timeframe of acquiring patient data, our only enrollment restrictions were MBD lesions in the distal half of the femur and femoral fracture at initial presentation. We focused on proximal femur lesions due to their proximity to the maximum strained region of the femur. Most patients were diagnosed with the common cancers that metastasize to bone, that is, lung (13), kidney (7), prostrate (7), breast (3). There were 22 lytic, 15 mixed, 6 diffuse, and 5 blastic metastatic cases. Twenty-two out of the 54 femurs underwent prophylactic surgery. A single, fellowship-trained orthopedic oncologist (BJM) with 10 years of clinical experience managed all patients. Patient age (66 ± 11 vs 63 ± 15 years, P = .453) and BMI (25 ± 7 vs 28 ± 7 kg/m2, P = .187) were similar between those that underwent fixation and those that did not. Mirels’ score was 11 ± 1 (range 9-12) and 9± 1 (range 6-10) for femurs that underwent fixation and those that did not, respectively.
FE geometry and meshing
Patient-specific femur geometries were extracted from CT images (Figure 1) using Mimics (Materialise, Leuven, Belgium) using a fixed density threshold (0.15 g/cm3).13,17 Low density region boundaries were manually corrected only as necessary. Using custom code (Matlab, Mathworks, Natick, MA), femur geometries were converted into voxel meshes (8-node hexahedral elements) with 1.5 mm isotropic edge length based on prior validation.13,17 The resulting meshes contained 171 500 ± 34 881 elements on average. Changing element edge length from 1.5 mm to 1.0 mm changed elastic modulus, tensile, and compressive principal strains by less than 1.75%, independently confirming convergence. We evaluated 9 different patient-specific FE models for each femur (486 total). Whole or partial-femur lengths were implemented based on the model evaluated (Figure 1).
Figure 1.

Cross-section of a sample femur geometry with lytic metastasis and elastic modulus distribution acquired from computed tomography scans (left), and the 9 loading configurations simulated using finite element models (right). The normal walking, stair ascent, and stumbling physiologic simulations included the abductor (ABD), proximal and distal ilio-tibial tract (ITTP, ITTD), proximal and distal tensor fascia lata (TFLP, TFLD), vastus medialis (VM), and vastus lateralis (VL) muscle forces, in addition to the hip joint contact force (CF). Posterior view shown. Please refer to the online version for interpretation of color.
FE material behavior
Bone was assigned element-based, isotropic (ν = 0.3),32 inhomogeneous modulus values specific to cortical (apparent density>1.0 g/cm3) and trabecular (apparent density ⩽ 1.0 g/cm3) bone.15,33 CT scans included a calibration phantom (QRM, Moehrendorf, Germany) allowing for extrapolation of patient-specific bone densities from Hounsfield units (Figure 2; R2 = 0.99). Modulii were determined from the patient-specific bone densities and femur-specific empirical relationships (Table 1; r ⩾ .82). Our methodology of voxel mesh modulus assignment can result in partial volume artifacts at the cortical surface elements of the femoral shaft. However, this methodology has been validated for estimation of global/whole-bone mechanical behavior.13,15,17 A modulus of 0.01 MPa was assigned to elements with values <0.01 MPa.16 To conform with existing MBD femur FE models, we simulated both linear elastic material behavior and nonlinear material properties that incorporated post-yield behavior (Table 1). FE models incorporating post-yield behavior used the von Mises yield criterion to simulate bone yield.34
Figure 2.

Average calibration relationship relating CT Hounsfield units to density using a calibration phantom included in each femur CT scan. Dotted line indicates a linear fit.
Table 1.
Femur-specific empirical relationships for assigning material properties.
| Model | Material behavior | Relationships | Reference |
|---|---|---|---|
| Physiologic strain (NW, SA, ST) | Linear elastic | Morgan et al35 | |
| Dalstra et al33 | |||
| Joint contact only strain (NW) | Same as physiologic strain | ||
| Physiologic strength (NW, SA) | Elastic-perfectly plastic until a defined plastic strain, followed by strain softening until a minimum stress, followed by indefinite perfectly plastic |
|
Keyak et al34 |
| Joint contact only strength (NW) | Same as physiologic strength | ||
| Offset torsion | Linear elastic | Keyak et al16 | |
| Vivanco et al36 | |||
| Sideways fall | Elastic-perfectly plastic | Morgan et al35 | |
| Dalstra et al33 | |||
| 0.9% homogeneous yield strain | Edwards et al13 | ||
Abbreviations: NW, normal walking, SA, stair ascent, ST, stumbling, E, elastic modulus (MPa), S, ultimate strength (MPa), σmin, minimum stress (MPa), ρHA, hydroxyapatite equivalent density (g/cm3), ρapp, apparent density (g/cm3), ρash, ash density (g/cm3).
FE loads and boundary conditions
Physiologic Models—Strain (walking/stair ascent/stumbling): boundary conditions replicated the instant of peak hip joint contact force at heel-strike during normal level walking (NW), or the instant of peak hip joint torque during stair ascent (SA), or the instant of peak hip joint contact force during stumbling (ST).37,38 This represented progressively more strenuous levels of physiologic loading activities likely experienced in this patient population. Patient-specific femurs were aligned to the Bergmann et al instrumented dataset coordinate system,38,39 and patient-specific bodyweight-scaled40 muscle forces specific to each loading activity (Table 2) were applied as concentrated loads to FE model surface nodes that corresponded to muscle insertion locations. The abductor, tensor fascia lata, and vastus lateralis muscle forces were applied during physiologic NW (Figure 1). FE simulation of SA included the ilio-tibial tract and vastus medialis muscle forces, in addition to the abductor, tensor fascia lata, and vastus lateralis muscle forces.39 Muscle forces during ST are unclear, hence we applied the same muscle forces during NW to simulate ST, assuming that stumbling would occur during walking. Patient-scaled joint contact force during each activity (Table 2) was applied to the femoral head surface in the direction of the resultant hip joint contact force and passing through the femoral head center. To prevent excessive local mesh distortion, a modulus of 25 GPa was assigned to load application elements.31,34 The femur was physiologically constrained at the location of hip contact on the femoral head, lateral epicondyle, and below the patella groove center.41
Table 2.
Applied muscle forces, joint contact forces, and displacements for the different loading activities simulated.
| Normal walking | Stair ascent | Stumbling | |||||||
|---|---|---|---|---|---|---|---|---|---|
| x | y | z | x | y | z | x | y | z | |
| Abductor (%BW) | 58.0 | 4.3 | 86.5 | 70.1 | 28.8 | 84.9 | Same as normal walking | ||
| Ilio-tibial tract proximal (%BW) | – | – | – | 10.5 | −3.0 | 12.8 | – | – | – |
| Ilio-tibial tract distal (%BW) | – | – | – | −0.5 | −0.8 | −16.8 | – | – | – |
| Tensor fascia lata proximal (%BW) | 7.2 | 11.6 | 13.2 | 3.1 | 4.9 | 2.9 | Same as normal walking | ||
| Tensor fascia lata distal (%BW) | −0.5 | −0.7 | −19.0 | −0.2 | −0.3 | −6.5 | Same as normal walking | ||
| Vastus lateralis (%BW) | −0.9 | 18.5 | −92.9 | −2.2 | 22.4 | −135.1 | Same as normal walking | ||
| Vastus medialis (%BW) | – | – | – | −8.8 | 39.6 | −267.1 | – | – | – |
| Hip contact force (%BW) | −77.9 | −26.6 | −240.3 | −102.3 | −56.9 | −249.9 | −294.8 | −182.4 | −1270 |
| Hip contact displacement magnitude (mm) | 5 | 5 | – | ||||||
Abbreviations: BW, body weight.
Physiologic Models—Strength (walking/stair ascent): because muscle forces are unclear for ST, only the NW and SA activities were simulated. Boundary conditions were the same as the physiologic strain models, except that a compressive contact displacement was applied incrementally to the femoral head surface34 in the direction of the resultant hip joint contact force passing through the femoral head center.
Joint Contact Only Models—Strain/Strength (walking): boundary conditions were the same as the physiologic strain/strength models, except that muscle forces were excluded, which replicated a single-limb stance/axial compression-type loading configuration. Only NW joint contact loads were simulated since this is likely the common activity in the patient population.
Offset Torsion Models—Strength: boundary conditions replicated a mechanism of low-energy failure under torsional loading such as encountered when getting out of bed.17 Loading platens were modeled as a conforming mesh at the anterior femoral head and distal femur, and assigned a linear elastic PMMA material with a modulus of 2500 MPa and ν = 0.3.42 An anterior-posterior displacement was applied incrementally to the surface of the femoral head platen to produce a torsional moment about the femur long axis, while constraining whole-bone bending. The distal femur was constrained in all translations.
Sideways Fall Models—Strength: boundary conditions replicated a mechanism of fragility fracture such as during a fall from hip level.13 Loading platens were modeled as a conforming mesh at the medial femoral head and lateral greater trochanter. A medial-lateral displacement was applied incrementally to the surface of the femoral head platen, while the base of the greater trochanter platen was constrained in medial-lateral translation. The femur distal to the lesser trochanter was constrained in rotation (torsion, bending) and axial (shear) translation.
FE postprocessing
All simulations were performed in Abaqus 2018 (Dassault Systemes Simulia Corp, Johnston, RI) using a static analysis. FE analyses terminated prior to femur strength evaluation for 2 NW and 3 SA physiologic models, and 1 NW joint contact only model, which were excluded from further analysis.
Tensile (maximum) principal strains for physiologic (NW, SA, ST) and joint contact only (NW) strain loading configurations were determined from lesion regions23 that included bone 2 voxels adjacent to the segmented lesion (accounting for partial volume effects at the lesion interface). Average strain from the lesion region, rather than peak strain, was used for comparison to minimize effects of local numerical artifacts. Load application elements and elements in their immediate vicinity were excluded from the analysis to remove strain concentrations.43
Femur strengths for physiologic (NW, SA) and joint contact only (NW) strength loading configurations were determined as the peak resultant reaction force at the femoral head.34 To provide an intra-patient assessment of fracture risk accounting for confounding inter-patient covariates, we also evaluated patient-specific load-to-strength ratios (LSR), defined as the ratio of activity-specific contact force to activity-specific femur strength.4,29
Femur strengths for offset torsion and sideways fall were determined using the maximum principal strain criterion,17 and deformation of the femoral head relative to the greater trochanter,13 respectively.
Model verification
A direct validation of our femoral MBD FE model strains and strengths was beyond the current scope. However, the methods used for model generation were based on validated, published procedures.13,17,34 Therefore, we presently compared our model results with published data to additionally verify our simulation procedures.
Statistical analyses
To test the hypothesis that physiologic muscle forces would affect local strain rather than global strength-based simulations, we compared the tensile strain relationship between NW physiologic and joint contact only loading models using linear regression, and we also compared bias using a Bland-Altman plot. Femur strengths were similarly compared between NW physiologic and joint contact only loading models. Mean differences between NW physiologic and joint contact only loading simulations were compared using either a paired T-test or Wilcoxon signed-rank test (non-normal data).
To test the hypothesis that MBD femurs would be ranked similarly, we evaluated the concordance of mechanical predictions between strain outcome simulations. For each loading configuration, the femurs were ranked from weakest (high strain) to strongest (low strain), and correlations between distributions of femur rankings were compared using Spearman rank correlation. The concordance of mechanical predictions between strength outcome simulations was similarly compared. We also used a percentile analysis to compare the distributions of femur strains/strengths between the different loading configurations. Percentile group means were compared using either a one-way ANOVA or Kruskal–Wallis test (non-normal data). Bonferroni adjustments were made for post hoc comparisons. The strength of the relationship between lesion tensile strain and femur strength, and between LSR and femur strength, was compared using Spearman correlation (non-normal data) for the NW physiologic loading simulation. Alpha level of .05 was defined as significant for all comparisons (SPSS, IBM Analytics, NY).
Results
Our NW physiologic loading model-predicted tensile strains (154-2447 μstrain range) corroborated well the range of reported femur tensile principal strains during level walking (~300-2300 μstrain).37,41,43 Similarly, our 863 to 9210 N range of femur strengths compared well with the range of reported femur strengths (~500-15 000 N).15,16,34
While NW joint contact only loading explained most of the variance in femur strength in relation to physiologic loading (R2 = 0.984, P < .001; slope = 0.992; intercept = −169 N, P = .04 [significantly different from 0]), there was a bias for lower femur strengths (Figure 3). NW joint contact only loading explained variance in tensile principal strain in relation to physiologic loading to a lesser degree (R2=0.719, P < .001; slope = 1.055; intercept = 137 μstrain, P = .08), with a bias for higher strains (Figure 3). Femur strengths were 4% lower (4166 ± 1411 vs 4333 ± 1422 N, P < .001), while tensile strains were 26% higher (842 ± 637 vs 668 ± 512 μstrain, P < .001) for NW joint contact only loading compared to physiologic loading.
Figure 3.

Femur strength and lesion tensile principal strain relationships between normal walking joint contact only and physiologic loading configurations (left column). Dashed lines indicate y = x relationship and dotted lines indicate linear fit. Outcome bias between loading configurations was evaluated using Bland-Altman plots (right column). Solid lines indicate means of the differences and dotted lines indicate 95% confidence interval limits.
The rankings of the mechanical predictions were strongly correlated between the strain outcome simulations (ρ = 0.723 to 0.990, P < .001), and moderately-to-strongly correlated between the strength outcome simulations (ρ = 0.524 to 0.984, P < .001). Femur strengths and strains followed a generally comparable distribution between loading configurations (Figures 4 and 5), with a trend for the strongest percentile group mostly including femurs that were not surgically fixed. Femurs within the strongest percentile were at lower fracture risk (lower LSR) on average than femurs within the weakest percentile (P < .001, Figure 4 top) for both the NW and SA physiologic loading configurations. Lesion tensile strain was moderately related to femur strength (Figure 6).
Figure 4.

Distribution of femur strengths according to the weakest (33rd), middle, and strongest (67th) percentiles for physiologic, offset torsion, and sideways fall loading configurations. Surgically and non-surgically treated femurs are indicated. Error bars indicate percentile standard deviation. LSR – load-to-strength ratio, a – weakest percentile average significantly different from middle, b – weakest percentile average significantly different from strongest, c – middle percentile average significantly different from strongest, all P < .001. The insets show force-displacement curves from a sample femur. Please refer to the online version for interpretation of color.
Figure 5.

Distribution of lesion tensile principal strains according to the strongest (33rd), middle, and weakest (67th) percentiles for physiologic loading configurations. Surgically and non-surgically treated femurs are indicated. Error bars indicate percentile standard deviation. a – weakest percentile average significantly different from middle, b – weakest percentile average significantly different from strongest, c – middle percentile average significantly different from strongest, all P < .001. The insets show distribution of tensile principal strain through the cross-section of a sample femur. Please refer to the online version for interpretation of color.
Figure 6.

Relationship between femur strength and lesion tensile principal strain for normal walking physiologic loading, showing a moderate correlation. Dotted line indicates a linear fit. ρ – Spearman correlation coefficient.
LSR was strongly related to femur strength (Figure 7). As expected, LSR trended higher under the more strenuous SA physiologic loading activity (Figure 4). Except for one case, femurs observed to be at higher fracture risk (LSR > 1) during NW physiologic loading were also at higher fracture risk during SA physiologic loading.
Figure 7.
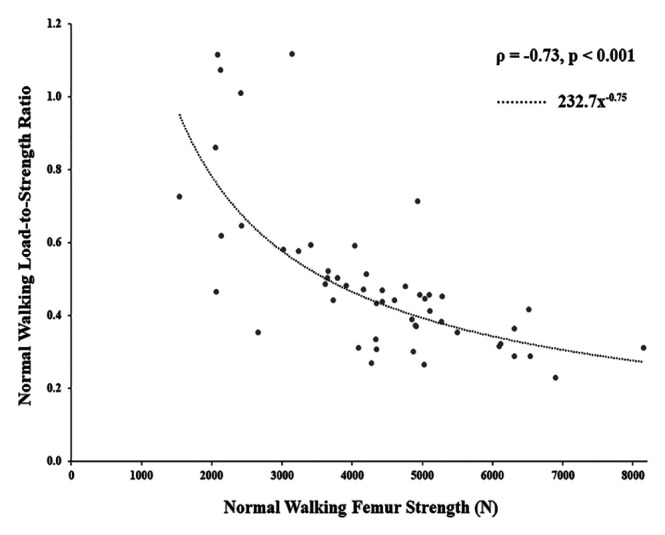
Relationship between femur strength and load-to-strength ratio for normal walking physiologic loading, showing a strong correlation. Dotted line indicates a power fit. ρ – Spearman correlation coefficient.
Discussion
Using data from 48 patients, we evaluated differences in mechanical behavior between idealized loading configurations and those incorporating physiologic muscle forces, and differences in the rankings of mechanical behavior between different loading configurations, in FE simulations of femurs with MBD. We found that tensile strain was 26% higher and femur strength was 4% lower in simulations excluding physiologic muscle forces. We also found that the rankings of the mechanical predictions were correlated between the strain outcome simulations, and between the strength outcome simulations.
Excluding muscle forces has previously been shown to result in higher computed tensile strains in femurs without MBD.11,43 We similarly found incorporating physiologic muscle forces affected NW simulations with strain, rather than strength, outcomes. Strains for NW with joint contact only loading (excluding muscles) were similar in magnitude to strains in the more strenuous SA physiologic loading activity, indicating that muscle loading effects (ie, bending) are not fully accounted for when only simulating compressive joint loads. Excluding muscle force in single abductor simulations has been shown to result in small (0.5%-1.3%) decreases in femur strength in femurs with MBD.34 We found the same femurs had a higher fracture risk (LSR > 1) for both NW physiologic and joint contact only loading. However, due to the lower magnitudes estimated with joint contact only loading, there is potential for predicting higher fracture risk based on femur strength given the calculation of LSR with reference to constant joint loads. Conversely, strain-based evaluation of fracture risk, like the strain ratio (lesion region strain/contralateral normal region strain),23 would be less prone to error from systematic bias. Regardless, absolute values should be used within the appropriate context when interpreting fracture risk calculated with idealized and physiologic loading configurations.
Loads during activities of daily living are important for fracture risk prediction,4 and pathologic fractures predominantly occur during non-traumatic activities of daily living.25,30 Prior femur MBD FE models simulating physiologic loading only focus on the abductor muscle, with loads typically applied through plastic pots.29 -31 Loads applied through plastic pots preferentially load cortical bone, thereby altering the load transfer mechanism to the underlying trabecular compartment and result in overestimation of bone strength.44 The abductor is only one of several muscles active during level walking and stair ascent; therefore, our physiologic simulations incorporated all dominantly active muscles.39 We currently focused on proximal femur lesions and musculature and the effects of distal lesions and including distal muscles warrant further investigation.
While strain concentrations were observed at and in the vicinity of lesion locations (Figure 5), only the weakest percentile strains during the ST loading simulation approached the tensile yield limit of bone (~6000 μstrain).45 Strain-dependent outcome simulations provide an indirect estimate of fracture risk (only moderately correlated with femur strength) that requires correlation with prospective incidences of fracture for accurate interpretation.23 Also, implementation of the strain-dependent approach requires well-defined lytic lesions to evaluate lesion region strain as mixed/diffuse metastatic lesion geometries/boundaries are harder to identify.46 However, identifying lesion boundaries is not critical in nonlinear material-based global femur strength outcome simulations, which inherently account for change in material behavior resulting from MBD. Also, nonlinear models have been shown to explain more variance in failure load.26 On the other hand, offset torsion/sideways fall loading simulations may be more relevant for predictions of fragility fracture risk,15 resulting from osteoporosis-related systemic global weaking of the femoral head-neck regions, versus localized MBD structural effects. The strong concordance of mechanical predictions between the strain outcome simulations, and between the strength outcome simulations suggests that it may be possible to compare the ranking of femur mechanics within a cohort across studies implementing various loading configurations. Further, given the (mostly) automated modeling process and strong concordance of mechanical predictions, combinations of fracture risk outcomes from different FE model types may potentially be processed using a machine/deep learning approach to improve predictions of fracture risk and assist clinical decision making for surgical management in patients with femur MBD.
Limitations
Our study was not without limitations. We were limited to a relative comparison of mechanical differences between loading configurations due to lack of a true reference. However, our modeling methods were based on validated, published procedures and our results corroborated well with published data, thereby providing a level of confidence in our simulation outcomes. Only 2/32 non-surgically treated femurs experienced a pathologic fracture. Therefore, it was also presently not possible to evaluate model performance against prospective incidences of fractures. Additionally, a surgeon’s decision to treat may be prone to bias and may not be an ideal substitute outcome option to evaluate model performance. When making treatment decisions surgeons also consider clinical factors such as diagnostic need apart from mechanical factors, evident from the few treated cases within the strongest percentile (Figure 4). We also did not explicitly model the constitutive behavior of the bone-metastatic tissue interface. However, given the similar order of magnitude of metastatic tissue modulus as trabecular bone,47,48 our model can account for variations in modulus distribution at the macro-scale due to the local alterations, which are expected to contribute to the variation in whole-bone mechanics. Incorporating a metastasis-specific constitutive model would be expected to systematically affect the mechanical predictions, which, given the parametric nature of our study, would not be expected to change the interpretation of our results. Mechanical assessment was made at the timepoint the CT scans were acquired. While mechanical integrity may vary over time due to the dynamic disease process, we expect similar conclusions due to our parametric evaluation of loading configurations. Because muscle forces during a fracture event are undocumented, for femur strength outcome physiologic loading simulations, activity-specific scaled muscle forces were applied incrementally in proportion together with the contact displacements to achieve the peak reaction force.29 We did not explicitly adjust for covariates due to the relatively low sample size. However, demographics were similar between treated and untreated cases, and we limited our analyses to paired comparisons to test our primary hypothesis.
Conclusions
Despite the limitations, we showed that FE simulations of patient-specific MBD femurs incorporating physiologic muscle forces affect local strain outcomes more than global strength outcomes. Based on a comprehensive evaluation of common loading simulations pertinent to MBD femurs, we also showed that mechanical predictions were ranked (weakest to strongest) similarly between the strain outcome simulations, and between the strength outcome simulations. The resulting differences from the variability in FE model loading indicated absolute values computed using idealized (no muscle forces) and physiologic loading configurations should be used within the appropriate context when interpreting fracture risk.
Acknowledgments
We thank Mitchell Carlson and Alexandra Bradford for assistance with image processing.
Footnotes
Author Contributions: Study conceived by JEG and designed by JEG and JEJ. Finite element modeling: JEJ. Data analysis and interpretation: JEJ, JEG, BJM, MJB. Manuscript writing: JEJ and JEG. Manuscript approval: JEJ, JEG, BJM, MJB.
The author(s) declared no potential conflicts of interest with respect to the research, authorship, and/or publication of this article.
Funding: The author(s) received no financial support for the research, authorship, and/or publication of this article.
ORCID iDs: Joshua E Johnson  https://orcid.org/0000-0002-8049-4105
Jessica E Goetz
https://orcid.org/0000-0002-7197-5978
References
- 1. Sternheim A, Traub F, Trabelsi N, et al. When and where do patients with bone metastases actually break their femurs? Bone Joint J. 2020;102-b:638-645. [DOI] [PubMed] [Google Scholar]
- 2. Damron TA, Mann KA. Fracture risk assessment and clinical decision making for patients with metastatic bone disease. J Orthop Res Off Publ Orthop Res Soc. 2020;38:1175-1190. [DOI] [PMC free article] [PubMed] [Google Scholar]
- 3. Mirels H. Metastatic disease in long bones. A proposed scoring system for diagnosing impending pathologic fractures. Clin Orthop Relat Res. 1989;249:256-264. [PubMed] [Google Scholar]
- 4. Hipp JA, Springfield DS, Hayes WC. Predicting pathologic fracture risk in the management of metastatic bone defects. Clin Orthop Relat Res. 1995;312:120-135. [PubMed] [Google Scholar]
- 5. Derikx LC, van Aken JB, Janssen D, et al. The assessment of the risk of fracture in femora with metastatic lesions: comparing case-specific finite element analyses with predictions by clinical experts. J Bone Joint Surg Br. 2012;94:1135-1142. [DOI] [PubMed] [Google Scholar]
- 6. Benca E, Patsch JM, Mayr W, Pahr DH, Windhager R. The insufficiencies of risk analysis of impending pathological fractures in patients with femoral metastases: a literature review. Bone Rep. 2016;5:51-56. [DOI] [PMC free article] [PubMed] [Google Scholar]
- 7. Derikx LC, Verdonschot N, Tanck E. Towards clinical application of biomechanical tools for the prediction of fracture risk in metastatic bone disease. J Biomech. 2015;48:761-766. [DOI] [PubMed] [Google Scholar]
- 8. Nazarian A, Entezari V, Villa-Camacho JC, et al. Does CT-based rigidity analysis influence clinical decision-making in simulations of metastatic bone disease? Clin Orthop Relat Res. 2016;474:652-659. [DOI] [PMC free article] [PubMed] [Google Scholar]
- 9. Nazarian A, Entezari V, Zurakowski D, et al. Treatment Planning and fracture prediction in patients with skeletal metastasis with CT-based rigidity analysis. Clin Cancer Res An Off J Am Assoc Cancer Res. 2015;21:2514-2519. [DOI] [PMC free article] [PubMed] [Google Scholar]
- 10. Edwards WB, Schnitzer TJ, Troy KL. Torsional stiffness and strength of the proximal tibia are better predicted by finite element models than DXA or QCT. J Biomech. 2013;46:1655-1662. [DOI] [PMC free article] [PubMed] [Google Scholar]
- 11. Cristofolini L, Juszczyk M, Martelli S, Taddei F, Viceconti M. In vitro replication of spontaneous fractures of the proximal human femur. J Biomech. 2007;40:2837-2845. [DOI] [PubMed] [Google Scholar]
- 12. Troy KL, Grabiner MD. Off-axis loads cause failure of the distal radius at lower magnitudes than axial loads: a finite element analysis. J Biomech. 2007;40:1670-1675. [DOI] [PMC free article] [PubMed] [Google Scholar]
- 13. Edwards WB, Schnitzer TJ, Troy KL. Reduction in proximal femoral strength in patients with acute spinal cord injury. J Bone Miner Res. 2014;29:2074-2079. [DOI] [PubMed] [Google Scholar]
- 14. Dragomir-Daescu D, Op Den Buijs J, McEligot S, et al. Robust QCT/FEA models of proximal femur stiffness and fracture load during a sideways fall on the hip. Ann Biomed Eng. 2011;39:742-755. [DOI] [PMC free article] [PubMed] [Google Scholar]
- 15. Orwoll ES, Marshall LM, Nielson CM, et al. Finite element analysis of the proximal femur and hip fracture risk in older men. J Bone Miner Res. 2009;24:475-483. [DOI] [PMC free article] [PubMed] [Google Scholar]
- 16. Keyak JH, Rossi SA, Jones KA, Skinner HB. Prediction of femoral fracture load using automated finite element modeling. J Biomech. 1998;31:125-133. [DOI] [PubMed] [Google Scholar]
- 17. Johnson JE, Brouillette MJ, Permeswaran PT, Miller BJ, Goetz JE. Simulated lesions representative of metastatic disease predict proximal femur failure strength more accurately than idealized lesions. J Biomech. 2020;106:109825. [DOI] [PubMed] [Google Scholar]
- 18. Spruijt S, Van Der Linden JC, Sander Dijkstra PD, et al. Prediction of torsional failure in 22 cadaver femora with and without simulated subtrochanteric metastatic defects: a CT scan-based finite element analysis. Acta Orthop. 2006;77:474-481. [DOI] [PubMed] [Google Scholar]
- 19. Anez-Bustillos L, Derikx LC, Verdonschot N, et al. Finite element analysis and CT-based structural rigidity analysis to assess failure load in bones with simulated lytic defects. Bone. 2014;58:160-167. [DOI] [PMC free article] [PubMed] [Google Scholar]
- 20. Eggermont F, Derikx LC, Verdonschot N, et al. Can patient-specific finite element models better predict fractures in metastatic bone disease than experienced clinicians? towards computational modelling in daily clinical practice. Bone Jt Res. 2018;7:430-439. [DOI] [PMC free article] [PubMed] [Google Scholar]
- 21. Eggermont F, van der Wal G, Westhoff P, et al. Patient-specific finite element computer models improve fracture risk assessments in cancer patients with femoral bone metastases compared to clinical guidelines. Bone. 2020;130:115101. [DOI] [PubMed] [Google Scholar]
- 22. Falcinelli C, Di Martino A, Gizzi A, Vairo G, Denaro V. Fracture risk assessment in metastatic femurs: a patient-specific CT-based finite-element approach. Meccanica. 2020;55:861-881. [Google Scholar]
- 23. Sternheim A, Giladi O, Gortzak Y, et al. Pathological fracture risk assessment in patients with femoral metastases using CT-based finite element methods. A retrospective clinical study. Bone. 2018;110:215-220. [DOI] [PubMed] [Google Scholar]
- 24. Yosibash Z, Plitman Mayo R, Dahan G, Trabelsi N, Amir G, Milgrom C. Predicting the stiffness and strength of human femurs with real metastatic tumors. Bone. 2014;69:180-190. [DOI] [PubMed] [Google Scholar]
- 25. Benca E, Synek A, Amini M, et al. QCT-based finite element prediction of pathologic fractures in proximal femora with metastatic lesions. Sci Rep. 2019;9:10305. [DOI] [PMC free article] [PubMed] [Google Scholar]
- 26. Sas A, Ohs N, Tanck E, van Lenthe GH. Nonlinear voxel-based finite element model for strength assessment of healthy and metastatic proximal femurs. Bone Rep. 2020;12:100263. [DOI] [PMC free article] [PubMed] [Google Scholar]
- 27. Tanck E, van Aken JB, van der Linden YM, et al. Pathological fracture prediction in patients with metastatic lesions can be improved with quantitative computed tomography based computer models. Bone. 2009;45:777-783. [DOI] [PubMed] [Google Scholar]
- 28. Cheal EJ, Hipp JA, Hayes WC. Evaluation of finite element analysis for prediction of the strength reduction due to metastatic lesions in the femoral neck. J Biomech. 1993;26:251-264. [DOI] [PubMed] [Google Scholar]
- 29. Goodheart JR, Cleary RJ, Damron TA, Mann KA. Simulating activities of daily living with finite element analysis improves fracture prediction for patients with metastatic femoral lesions. J Orthop Res. 2015;33:1226-1234. [DOI] [PubMed] [Google Scholar]
- 30. Kaneko TS, Skinner HB, Keyak JH. Lytic lesions in the femoral neck: Importance of location and evaluation of a novel minimally invasive repair technique. J Orthop Res. 2008;26:1127-1132. [DOI] [PubMed] [Google Scholar]
- 31. Keyak JH, Kaneko TS, Skinner HB, Hoang BH. The effect of simulated metastatic lytic lesions on proximal femoral strength. Clin Orthop Relat Res. 2007;459:139-145. [DOI] [PubMed] [Google Scholar]
- 32. Wirtz DC, Schiffers N, Pandorf T, Radermacher K, Weichert D, Forst R. Critical evaluation of known bone material properties to realize anisotropic FE-simulation of the proximal femur. J Biomech. 2000;33:1325-1330. [DOI] [PubMed] [Google Scholar]
- 33. Dalstra M, Huiskes R, Odgaard A, van Erning L. Mechanical and textural properties of pelvic trabecular bone. J Biomech. 1993;26:523-535. [DOI] [PubMed] [Google Scholar]
- 34. Keyak JH, Kaneko TS, Tehranzadeh J, Skinner HB. Predicting proximal femoral strength using structural engineering models. Clin Orthop Relat Res. 2005;437:219-228. [DOI] [PubMed] [Google Scholar]
- 35. Morgan EF, Bayraktar HH, Keaveny TM. Trabecular bone modulus-density relationships depend on anatomic site. J Biomech. 2003;36:897-904. [DOI] [PubMed] [Google Scholar]
- 36. Vivanco JF, Burgers TA, García-Rodríguez S, et al. Estimating the density of femoral head trabecular bone from hip fracture patients using computed tomography scan data. Proc IMechE, Part H: J Engineering in Medicine. 2014;228:616-626. [DOI] [PubMed] [Google Scholar]
- 37. Edwards WB, Miller RH, Derrick TR. Femoral strain during walking predicted with muscle forces from static and dynamic optimization. J Biomech. 2016;49:1206-1213. [DOI] [PubMed] [Google Scholar]
- 38. Bergmann G, Deuretzbacher G, Heller M, et al. Hip contact forces and gait patterns from routine activities. J Biomech. 2001;34:859-871. [DOI] [PubMed] [Google Scholar]
- 39. Heller MO, Bergmann G, Deuretzbacher G, et al. Musculo-skeletal loading conditions at the hip during walking and stair climbing. J Biomech. 2001;34:883-893. [DOI] [PubMed] [Google Scholar]
- 40. Winter DA. Biomechanics and Motor Control of Human Movement. 4th ed. John Wiley & Sons, Inc; 2009. [Google Scholar]
- 41. Speirs AD, Heller MO, Duda GN, Taylor WR. Physiologically based boundary conditions in finite element modelling. J Biomech. 2007;40:2318-2323. [DOI] [PubMed] [Google Scholar]
- 42. Lewis G. Properties of acrylic bone cement: state of the art review. J Biomed Mater Res. 1997;38:155-182. [DOI] [PubMed] [Google Scholar]
- 43. Polgár K, Gill HS, Viceconti M, Murray DW, O'Connor JJ. Strain distribution within the human femur due to physiological and simplified loading: finite element analysis using the muscle standardized femur model. Proc IMechE, Part H: J Engineering in Medicine. 2003;217:173-189. [DOI] [PubMed] [Google Scholar]
- 44. Edwards WB, Troy KL. Simulating distal radius fracture strength using biomechanical tests: a modeling study examining the influence of boundary conditions. J Biomech Eng. 2011;133:114501. [DOI] [PubMed] [Google Scholar]
- 45. Bayraktar HH, Morgan EF, Niebur GL, Morris GE, Wong EK, Keaveny TM. Comparison of the elastic and yield properties of human femoral trabecular and cortical bone tissue. J Biomech. 2004;37:27-35. [DOI] [PubMed] [Google Scholar]
- 46. Ataei A, Eggermont F, Baars M, et al. Evaluation of inter- and intra-operator reliability of manual segmentation of femoral metastatic lesions. Int J Comput Assist Radiol Surg. 2021;16:1841-1849. [DOI] [PMC free article] [PubMed] [Google Scholar]
- 47. Nazarian A, von Stechow D, Zurakowski D, Müller R, Snyder BD. Bone volume fraction explains the variation in strength and stiffness of cancellous bone affected by metastatic cancer and osteoporosis. Calcif Tissue Int. 2008;83:368-379. [DOI] [PubMed] [Google Scholar]
- 48. Whyne CM, Hu SS, Workman KL, Lotz JC. Biphasic material properties of lytic bone metastases. Ann Biomed Eng. 2000;28:1154-1158. [DOI] [PubMed] [Google Scholar]